
Abstract
Abstract
An anaerobic/oxic/anoxic sequencing batch biofilm reactor (A/O/A SBBR) was tested to treat carbon-limited wastewater without external carbon addition. Simultaneous nitritation–denitritation in the oxic period and poly-hydroxybutyrate (PHB)-driven denitritation in the anoxic period were implemented in the A/O/A SBBR. A high total nitrogen (TN) removal efficiency of 95.97 ± 2.85% was achieved, in which 57.62 ± 4.43% was removed during the aerobic period and 39.00 ± 4.07% was removed during the anoxic period. Simultaneously, 15.47 ± 2.65% of the removed TN was emitted as nitrous oxide (N2O), and 72.25 ± 4.86% of total N2O was produced during the anoxic period. As a result, PHB-driven denitritation improved TN removal efficiency while stimulating high amounts of N2O emission. High-throughput pyrosequencing analysis revealed an abundance of the genera Thauera and Denitratisoma as potential denitrifiers that improved TN removal efficiency. N2O was primarily produced by betaproteobacterial microorganisms, especially the genera Thauera, Denitratisoma, and Nitrosomonas.
Introduction
S
The ratio of chemical oxygen demand (COD) to total nitrogen (TN), (C/N), is important in assessing the carbon utilization in nitrogen-containing wastewater. For domestic sewage, a C/N ratio <4 has been considered a carbon shortage (Renou et al., 2008). Sequencing batch reactors (SBRs) operating in an aerobic/anoxic mode have often been used to treat wastewater with C/N ratios higher than 4 (Wei et al., 2012; Capodici et al., 2014; Fudala-Ksiazek et al., 2014). However, Wei et al. (2012) reported that sewage with a C/N ratio higher than 5 still has a carbon deficiency in the aerobic/anoxic process, leading to only 35% TN removal efficiency. Thus, a modified SBR operating in the anaerobic/oxic/anoxic (A/O/A) mode was proposed to fully use the carbon in wastewater (Miao et al., 2015).
The concept of simultaneous nitritation–denitritation (SND) in microaerobic environments has increasingly captured the attention of researchers as it is superior for the simplification of operating procedures and a reduction in required oxygen and energy (Holman and Wareham, 2005; Seifi and Fazaelipoor, 2012). A comparison of SND-containing processes operating in fully aerobic and anoxic/aerobic modes showed that the anoxic/aerobic process has higher nitrogen removal efficiency (Zhang et al., 2015). The anaerobic/aerobic/anoxic SND-containing process may be vastly superior to the anoxic/aerobic process.
Moreover, nitrification and denitrification in wastewater treatment both appear to be the main sources of nitrous oxide (N2O). N2O can be produced through three routes: (1) nitrifier denitrification, which is carried out by ammonia-oxidizing bacteria (AOB); (2) hydroxylamine oxidation during nitrification; and (3) heterotrophic denitrification (Kampschreur et al., 2009). N2O is generally regarded as a greenhouse gas and the dominant ozone-depleting substance (Ravishankara et al., 2009). Many researchers have studied N2O production in biological nitrogen removal processes. In these studies, because of the differences in sewage quality, running parameters, and environmental conditions, different results characterizing the N2O emission rates were reported.
For artificial synthetic wastewater treatment processes, N2O production was 0.2–16% of the nitrogen load during nitrification and 0.005–90% of the nitrogen load during denitrification (Chung et al., 2000; Tsuneda et al., 2005; Lemaire et al., 2006; Zhang et al., 2015; Zhao et al., 2016). The amount of N2O emitted per cycle of a nitritation process was 1.5 times higher than that of a full nitrification process (Wei et al., 2014); additionally, denitrification using stored carbon substances (e.g., poly-hydroxybutyrate [PHB]) caused an increase in N2O production (Meyer et al., 2005). Nitritation and PHB-driven denitrification are the important components of nitrogen removal through nitrite systems operating in the A/O/A mode. It is meaningful to explore N2O production in the aforementioned system. To date, no published literature on the subject is available.
In this study, an A/O/A sequencing batch biofilm reactor (A/O/A SBBR) was used for the treatment of wastewater with C/N ratios of 4 without adding external carbon during the anoxic phase. This study aimed to (1) examine nitrogen removal through nitrite in the A/O/A SBBR, (2) analyze the TN removal pathway in a typical cycle, (3) characterize N2O production in the A/O/A SBBR, and (4) explore N2O generation sources using a bacterial community analysis based on the results of high-throughput 16S rRNA gene sequencing.
Materials and Methods
Description of the SBBR
Experiments were carried out in an SBBR with a working volume of 13 L, a diameter of 0.2 m, and a height of 0.5 m. In total, 12% of the SBBR was filled with plastic fiber. The suspended solid concentration in the mixed liquor was 3000–3350 mg/L. The aeration rate was 20 L/h (the dissolved oxygen [DO] concentration was 1.45–2.20 mg/L). The temperature of the SBBR was maintained at 30 ± 2°C. The operational pH ranged from 7.0 to 7.8. A submersible pump was used to keep the solution completely mixed.
Operation procedures
At the beginning of the start-up period (days 1–15), the SBBR operated in the anaerobic/oxic mode with 12-h cycles. When complete ammonia oxidation was successfully achieved, the SBBR was changed to operate in the A/O/A mode with 12-h cycles: a feeding period (10 min), an anaerobic period (50 min), an aerobic reaction (150–190 min), an anoxic reaction (500–460 min), and then a decanting process (10 min). During the whole operation of a cycle, the endpoints of the aeration and anoxic periods were decided by the real-time control method introduced by Peng et al. (2008). The SBBR operation consisted of the following three stages (Fig. 1):
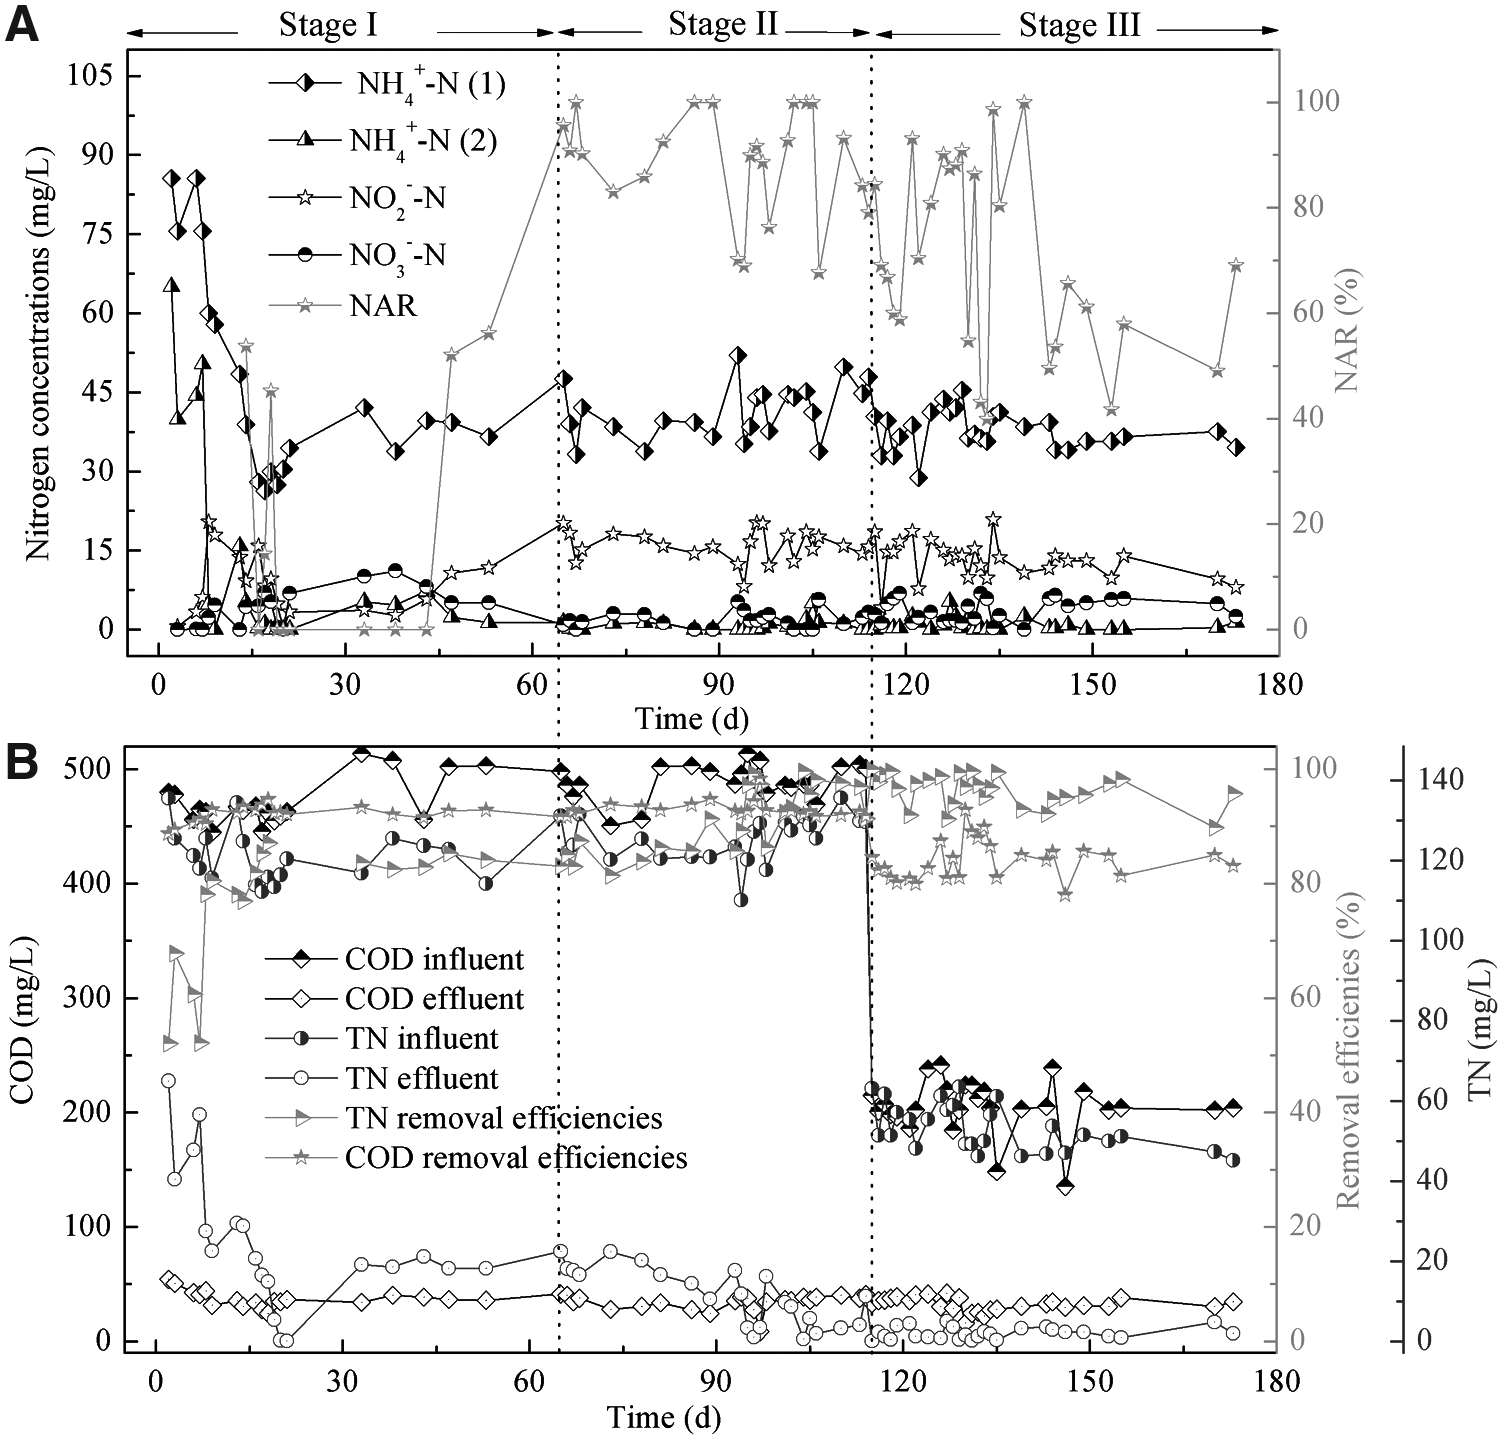
Overall performance in the SBBR:
Stage I (days 1–65): the start-up period of nitrogen removal through nitrite.
Stage II (days 66–115): the stable running period of nitrogen removal through nitrite under A/O/A operation.
Stage III (days 116–180): simulating domestic wastewater treatment period.
Wastewater composition and seed sludge
Synthetic wastewater of stage I and stage II contained COD (as glucose), 500 mg/L; and ammonium (NH4+−N [as NH4HCO3]), 120 mg/L; with the remaining composition of the wastewater kept the same as that reported in the article by Ge et al. (2016). The exchange volume was 30%, and the hydraulic retention time (HRT) was 40 h. The wastewater composition of stage III was the same as that of stage I except for that of COD (200 mg/L) and NH4+-N (50 mg/L) (Yang et al., 2009). The exchange volume was 70%, resulting in an HRT of 17 h. The influent NH4+-N volume loads during all operations were maintained at 0.07 kg/(m3 · day). The seed sludge of this reactor was the same as in the process by Ge et al. (2016).
Analytical methods
NH4+-N, nitrate (NO3−N), nitrite (NO2−N), and COD were conducted in accordance with the standard methods (APHA-AWWA-WPCF, 2001). TN was the sum of NH4+-N, NO3−N and NO2−N. PHB content was determined by UV spectrophotometry according to Law and Slepecky (1961). The concentration of dissolved N2O in wastewater was obtained by N2O microsensor (Unisense). N2O generation and emission were determined according to Ge et al. (2016) and Hu et al. (2014), and the calculation method of NO2−N accumulation ratio (NAR) was in accordance with Zeng et al. (2014). The methodology of microbial community analysis is presented in the DNA extraction, pyrosequencing, and sequence processing section of the Supplementary Data.
Results and Discussion
Overall performance of the SBBR
The SBBR achieved stable operation 4 months after start up (Fig. 1). During the start-up period (stage I: days 1–65), the nitritation system was used to enrich AOB and restrain nitrite-oxidizing bacteria (NOB). A low flow rate (20 L/h) of air was supplied to control the low DO concentration in the shortcut nitrification process. During this period, the percentage of NH4+-N oxidation increased from 15% to 100%. On day 65, the NAR was increased to 96% at the end of aeration, and nitritation was achieved successfully (Fig. 1A).
During the stable running period (stages II and III: days 66–180), the NH4+-N concentration before aeration was 30.61 ± 4.2 mg/L (n = 45), and the concentrations of NH4+-N and NO2−N at the end of aeration were 0.81 ± 1.19 mg/L (n = 45) and 14.27 ± 3.74 mg/L (n = 45), respectively, resulting in an NO2−N-to-NOx−N ratio of 76.68 ± 18.18% (n = 45). The limited aeration rate and aeration duration contributed to the enrichment of AOB over NOB during the operation. NOB exhibits a higher affinity for oxygen than AOB does, so nitrite accumulation is commonly observed at low DO concentrations. NOB also had relatively low growth rates at low DO concentrations (Chung et al., 2005).
TN and COD removal performances in SBBR are shown in Fig. 1B. During the longer TN and COD running period (stages I and II: days 1–115), the influent TN concentration was 121 ± 8.44 mg/L (n = 37), with 18.42 ± 15.67 mg/L (n = 37) TN in the effluent. The TN removal rate increased from 58.14 ± 7.59% to 88.07 ± 8.41%. COD declined promptly to its minimum value at the end of the anaerobic period, with a high removal efficiency (92.47 ± 1.52% with 480.07 ± 19.87 mg/L COD input). Therefore, the process in this study had good nitrogen and carbon removal efficiency at the influent pollutant load.
Considering that the SBBR can operate flexibly, the influent volume load at different NH4+-N concentrations can be maintained by regulating the drainage ratio. It was possible to treat domestic sewage in the SBBR under the same NH4+-N input load as during the former treatment. Thus, the influent had been changed to simulate domestic wastewater treatment during stage III (days 116–180).
During the domestic wastewater simulation running period, the influent TN and COD concentrations were 52.13 ± 5.40 mg/L (n = 26) and 204.94 ± 23.26 mg/L (n = 26), respectively, with 2.06 ± 1.47 mg/L (n = 26) TN and 32.30 ± 6.16 mg/L (n = 26) COD in the effluent. TN and COD removal rates were 95.97 ± 2.85% and 84.02 ± 5.11%, respectively. This result indicates that high nutrient removal efficiency can be achieved in both the higher TN and COD running period and domestic wastewater simulation running period.
Nitrogen compounds and control parameters in a typical cycle
To better understand the characteristics of nitrogen removal, the variations of pH and COD, PHB, NH4+-N, NO3−N, NO2−N, DO, and dissolved N2O concentrations during a typical cycle on day 131 were determined (Fig. 2).
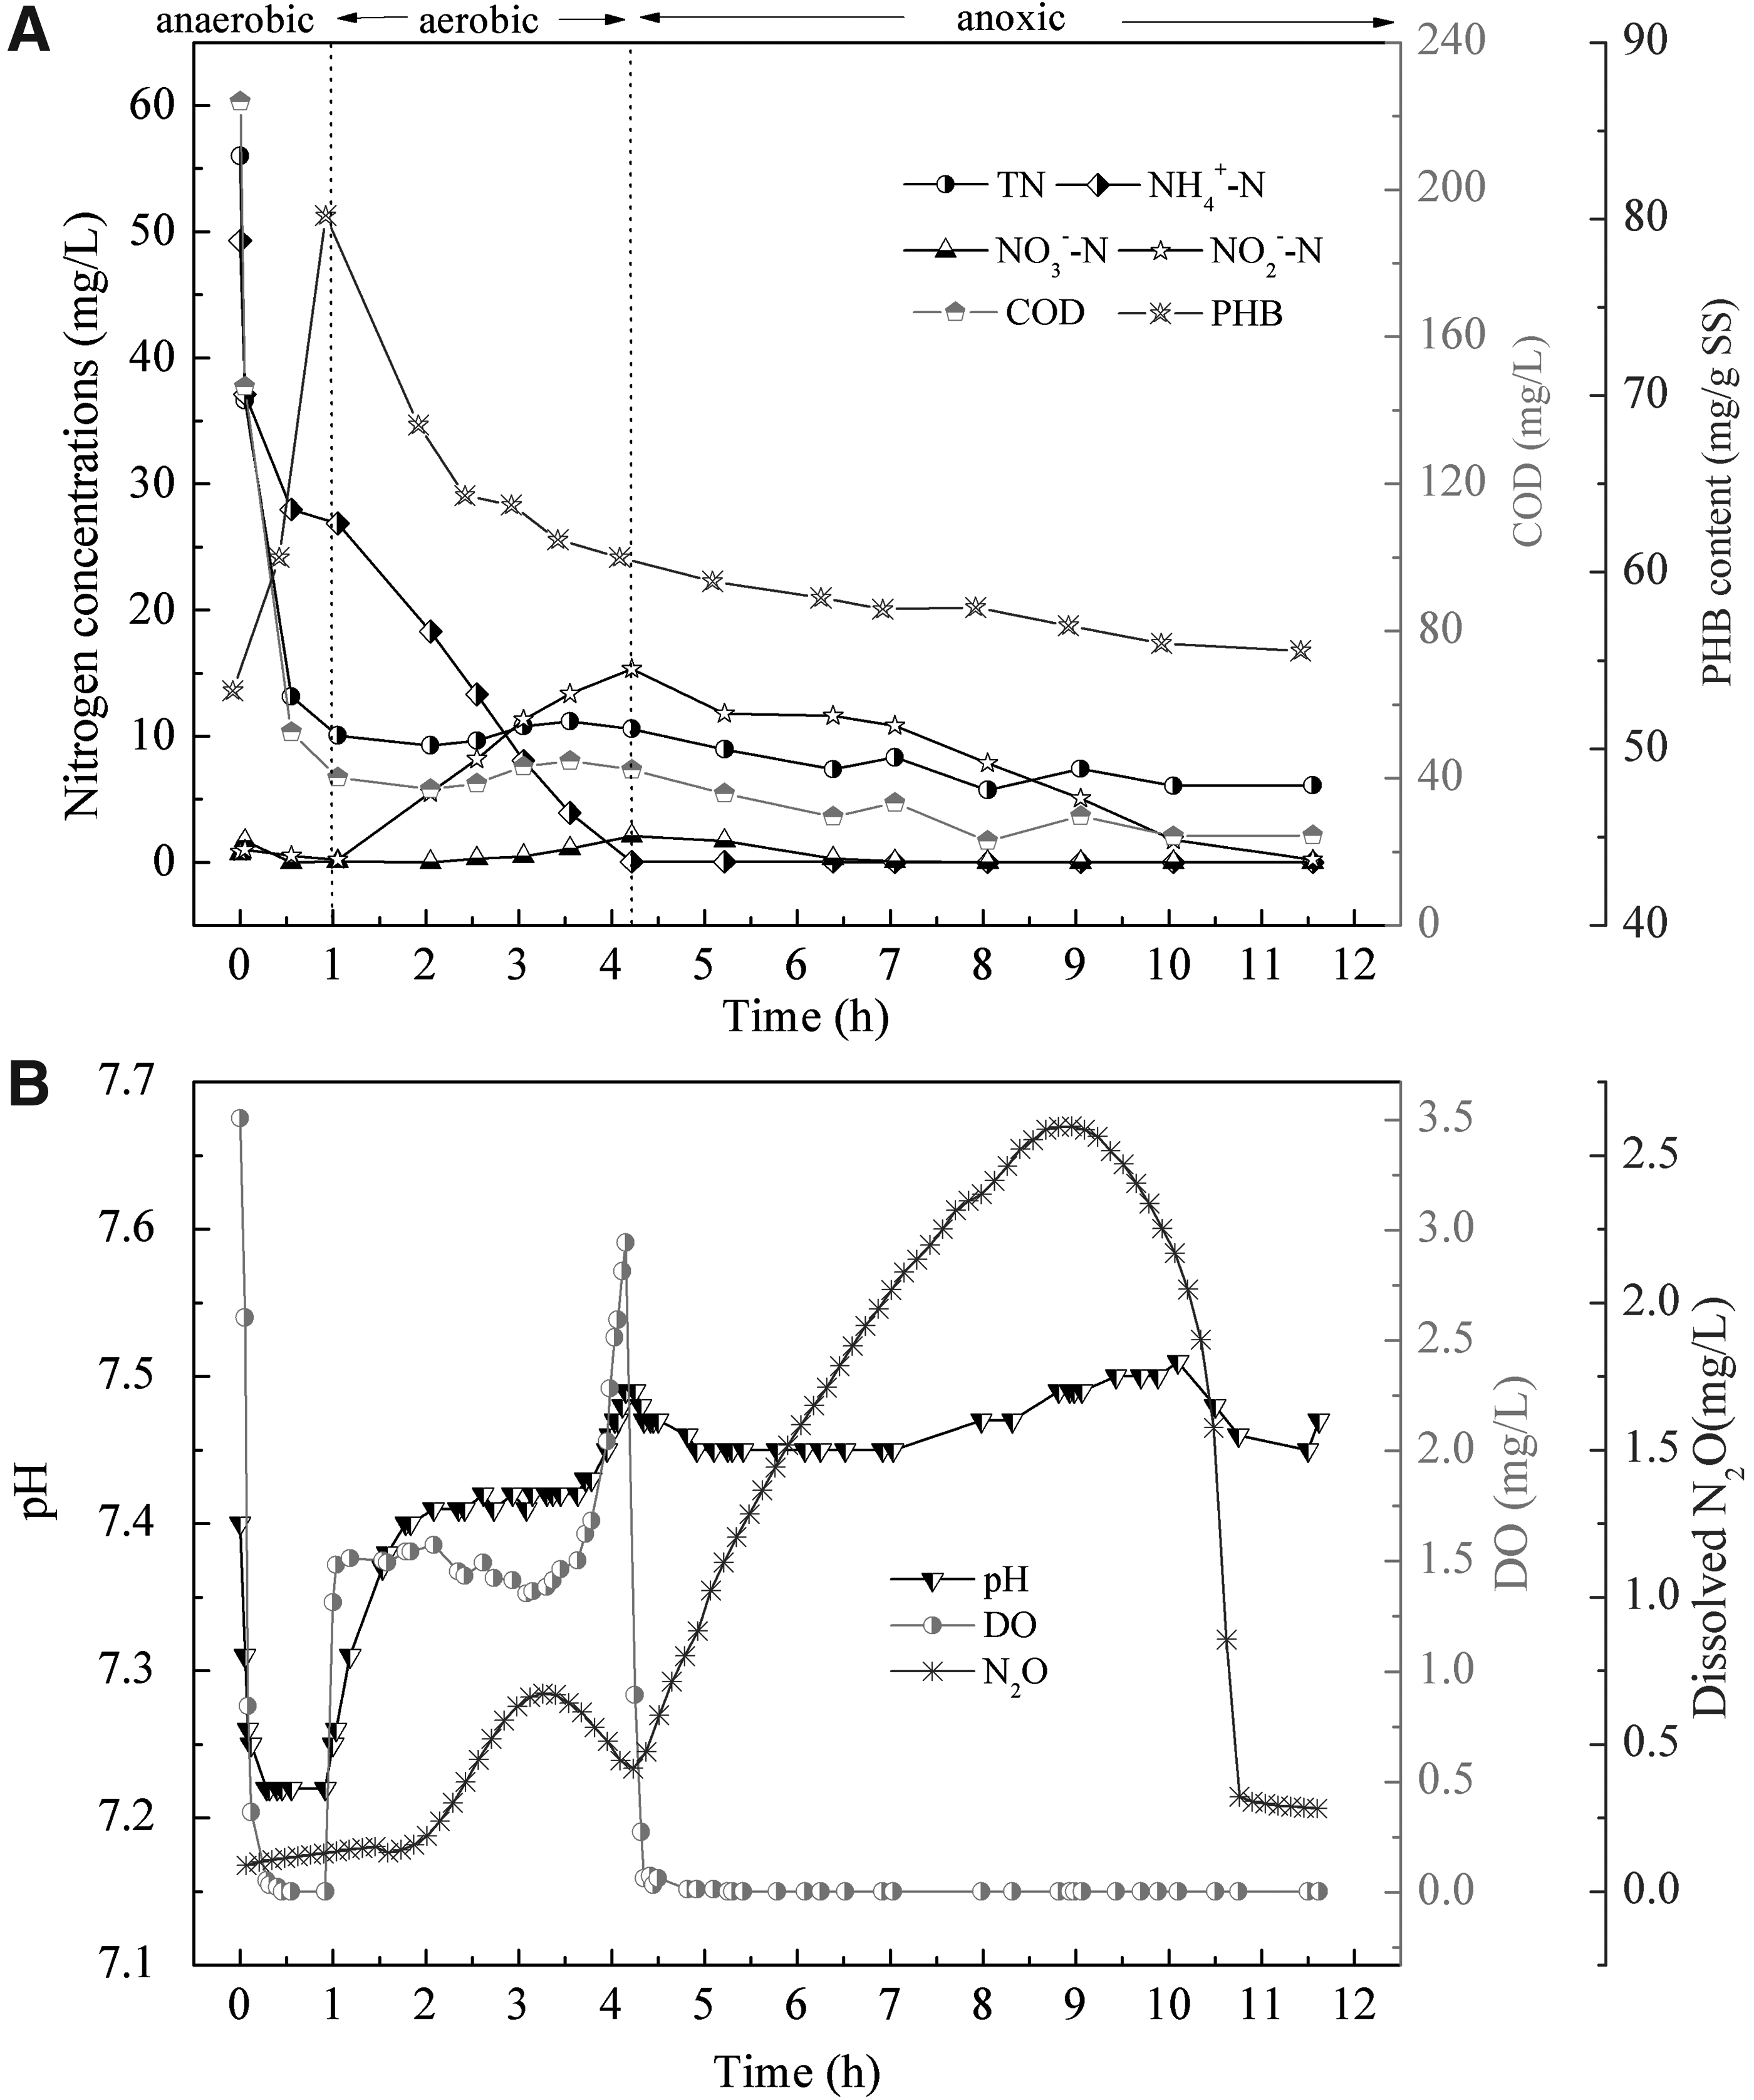
Typical profiles of nitrogen compounds and control parameters during 12-h cycle operation in SBBR on day 131:
As shown in Fig. 2A, the carbon source was consumed and stored as PHB during the anaerobic period. In the aerobic period with 1.48 ± 0.08 mg/L DO in the SBBR, the NH4+-N decreased with rapid NO2−N accumulation and a low NO3−N level. At 2 h after feeding, the N2O started to increase upon the decrease in PHB content when the concentration of NO2−N increased to 5.52 mg/L. The pH increased during the rise in HCO3−/CO2 caused by the continuous stripping of CO2 at the beginning of aerobic conditions. The subsequent unchanging pH in aerobic conditions was mainly due to SND (Ge et al., 2016). At 4.2 h of reaction, a rapid increase in pH and DO meant that complete nitritation had occurred, in addition to reaching the maximum NO2−N concentration (15.32 mg/L). The use of the limited aeration duration (4.2 h) seems to be an interesting possibility to achieving stable nitritation since the oxygen affinity constants of ammonia and nitrite oxidizers are different (0.3 and 1.1 mg/L, respectively) (Wiesman, 1994). Moreover, the accumulated PHB would be consumed under excess aeration so that a relative low PHB could be provided for postanoxic denitrification. Thus, controlling the aeration duration was a key point in the operation of the A/O/A process.
At the aerobic stage, the SBBR mainly produced N2O with two methods. First, in the inner biofilm, the denitrification process could be carried out during aeration using the remaining carbon or internally stored carbon. Additionally, von Schulthess et al. (1994) reported that N2O accumulation occurs when the activity of N2O reductase is inhibited by the presence of oxygen. In addition, the nitrifier denitrification pathway during the SND process also causes the production of N2O. In nitrifier denitrification, the NH4+-N is converted by nitrifiers to NO2−N, followed by the reduction of NO2−N to N2O (Poth and Focht, 1985).
During the anoxic phase, N2O continued to increase as PHB decreased until the NO2−N concentration declined to 5.05 mg/L at 9.05 h of reaction. The pH increased until TN decreased to 1.77 mg/L at 10 h of reaction. Both TN and N2O decreased to their minimum values at the end of the reaction. The PHB was consumed as the carbon source for denitrification (Meyer et al., 2005). In total, 15.32 mg/L of NO2−N was removed by PHB-driven denitritation, and 5.85 mg/L of N2O was produced during the anoxic period. Thirty-eight percent of NO2−N was converted to N2O. Some studies proposed that PHB-driven denitrification causes a larger amount of N2O production (Meyer et al., 2005; Kampschreur et al., 2009; Zhao et al., 2016). According to the study by Kampschreur et al. (2009), the reason is that the slow degradation of PHB leads to a competition for electrons among different denitrifying enzymes; thus, the low nitrous oxide reductase activity causes N2O accumulation.
The efficiency of TN removal was 99% during the 12-h cycle. In total, 56% of the TN was removed during the aerobic period, and 43% of TN was removed during the anoxic period. The significantly high TN removal in the A/O/A SBBR was attributed to SND, PHB-driven denitrification, and the supply for growth purposes. The anoxic period was ∼2.5 times longer than the aerobic period because of the low degradation rate of PHB. The extended anoxic time limited the wastewater treatment efficiency of this process. Thus, the A/O/A SBBR is more suitable for small-scale wastewater treatment.
According to the above method used to analyze the nitrogen removal in a typical cycle, the roles of the processes during different time periods in this A/O/A SBBR can be described as follows: (1) during the anaerobic period, COD is consumed and stored as PHB; (2) during aeration, NH4+-N is oxidized to NO2−N, and a part of the nitrogen is removed by SND and PHB-driven denitrification; and (3) under anoxic conditions, surplus NO2−N is removed by heterotrophic denitrification using stored carbon compounds.
Characteristics of TN removal and N2O production
During the steady-state period of the A/O/A SBBR, specifically on days 130 and 131, N2O production was studied; the results are shown in Fig. 3. N2O production was 7.74 ± 1.28 mg/L (2.19 ± 0.67 mg/L during the aerobic period and 5.55 ± 0.73 mg/L during the anoxic period). Table 1 shows the nitrogen removal performance and N2O production under various running conditions for sewage treatment in recent studies.
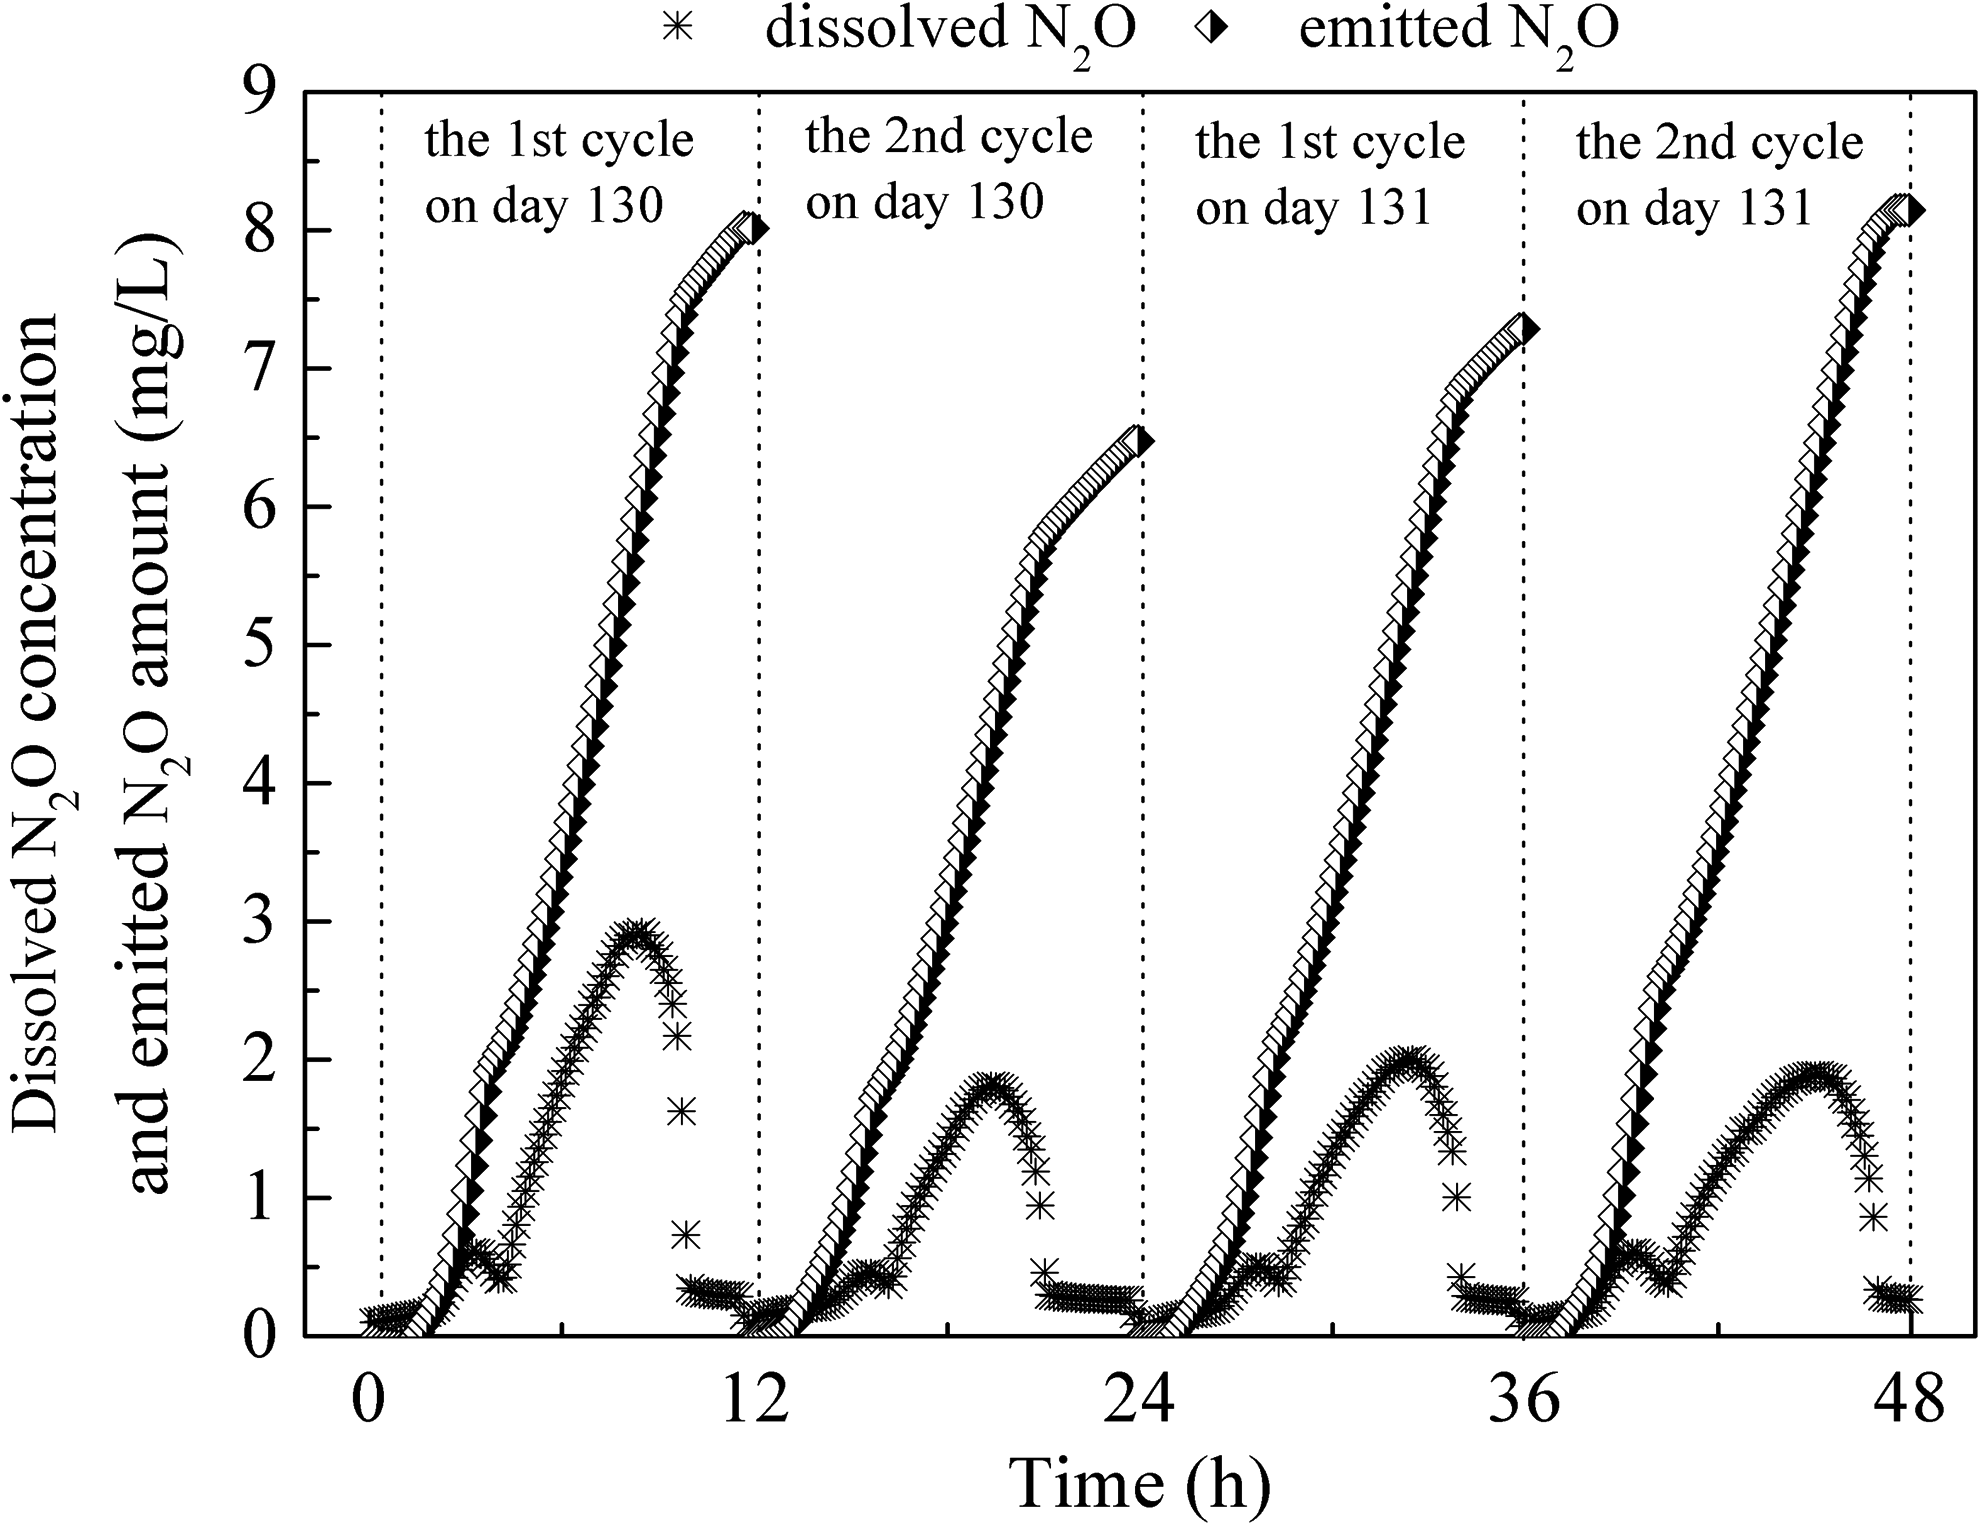
Typical profiles of dissolved and emitted N2O during four continuous cycle operations on days 130 and 131.
N2O, nitrous oxide; SBBR, sequencing batch biofilm reactor; SBR, sequencing batch reactor; DO, dissolved oxygen; TN, total nitrogen.
The modified SBR (Miao et al., 2015) and SBBR (in this article) operated in A/O/A mode could effectively achieve nitrogen removal from wastewater with a C/N ratio of 4. The operation of the modified process was flexible and cost-efficient as it is based on only a single reactor. During the traditional anaerobic/aerobic process, TN removal efficiency was 66–77%, which was lower than that found in this article, whether under high or low DO conditions (Zhu and Chen, 2011; Jia et al., 2012). Meanwhile, the N2O conversion rate (15.47 ± 2.65%) found in this study was also higher than that of anaerobic/aerobic reactors (2.1–10.4%). Compared with conventional nitrogen removal processes, the A/O/A SBBR enhanced the removal of nitrogen and stimulated the emission of N2O simultaneously.
TN removal efficiency of the A/O/A SBBR was improved mainly by three factors. First, the limitations of DO diffusing from the liquid to the biofilm can produce an anoxic zone in SBBR. Denitrification could be carried out in the internal part of the biofilm during aeration. Second, the addition of an anaerobic period after feeding improved the carbon storage ability of microorganisms, thus providing a sufficient carbon source for the following denitrification step. Finally, in a traditional system, the effluent of a treatment process is always drawn out from an oxic unit, and the nitrite or nitrate cannot be thoroughly removed. However, in this article, the anoxic phase was placed after the aerobic period. With this step being placed later in the process, the reduction in NO2−N coincided with PHB consumption during the anoxic phase (Fig. 2), indicating that PHB was the likely source of reducing equivalents for nitrite reduction. In total, 39.00 ± 4.07% of the removed TN was reduced during the anoxic period, indicating that PHB-driven denitrification contributed to the higher TN removal in the A/O/A SBBR.
Higher N2O conversion rate (15.47 ± 2.65%) in the A/O/A SBBR was mainly caused by the following reasons. (1) The denitrification process could proceed during aeration. Additionally, the activity of N2O reductase could be inhibited by the presence of oxygen, leading to N2O accumulation (von Schulthess et al., 1994). (2) The low-oxygen conditions in the inner biofilm favor denitrification by AOB, of which N2O is the main product (Wunderlin et al., 2012). (3) Nitrite accumulation in the A/O/A SBBR represses N2O reduction, which leads to an increase in N2O production in the system. N2O is strongly correlated with NO2−N (Park et al., 2000). (4) In total, 72.25 ± 4.86% of the total N2O produced during the anoxic period was attributed to PHB-driven denitrification.
Bacterial community structure in the SBBR
A 16S rRNA gene sequencing analysis was carried out to examine the microbial community in the SBBR. The community composition at the phylum, class, and genus levels is shown in Fig. 4.

Microbial community composition of the SBBR sludge based on high-throughput 16S r RNA gene sequencing. The inner, middle, and outer pie charts show the community composition at the phylum, class, and genus levels, respectively.
As shown in Fig. 4, Proteobacteria was the most abundant phylum in the sample, accounting for 58.31% of species in the SBBR, which is similar to the microbial community results proposed by Zhang et al. (2012). The other dominant phyla were Bacteroidetes (17.43%), Planctomycetes (14.92%), Firmicutes (1.42%), and Candidate_division_TM7 (0.72%). The phylum Planctomycetes was ubiquitous in the biological sewage treatment processes and some of its constituents had a great effect on organic substance degradation and contaminant removal (Wang et al., 2012). The phylum Candidate_division_TM7 has been frequently reported in wastewater treatment plants (Nielsen et al., 2010), possesses the capability of using both oxygen and nitrite as electron acceptors, and has a limited ability to store short-chain fatty acids, such as PHB.
The class Betaproteobacteria was the most dominant Proteobacteria in the SBBR (38.22%). It strongly influenced nitrogen removal from wastewater (Liang et al., 2015). Some microbes of the classes Gammaproteobacteria and Alphaproteobacteria have been widely reported to uptake short-chain fatty acids and store them as PHB (Liu et al., 2000). Nitrosomonas from Betaproteobacteria were the most common of the AOB genera and accounted for 4.82% of the total sequences (37,452 sequences). The Nitrosomonas-like AOB have been generally suggested to be capable of denitrification (Colliver and Stephenson, 2000). AOB denitrification often causes higher N2O emission during wastewater treatment. Kong et al. (2013) also reported that the Nitrosomonas sp. was the AOB that caused the most N2O emission.
The genera Nitrospira and Nitrobacter were the two important genera of the NOB in this article (Fig. S1 of the Supplementary Data), and the amount of Nitrospira (0.29%) was much greater than that of Nitrobacter (0.01%). There was a significantly greater number of AOB (4.82%) than of NOB (0.30%). This result demonstrated that nitritation is achieved by a great decrease in the amount of NOB in the reactor. The suppression of NOB was primarily due to inhibition of free ammonia during the anaerobic period (Ge et al., 2016). In addition, low concentrations of DO in the SBBR also promoted the suppression effect when the free ammonia concentration was insufficient to inhibit NOB.
Members of the genus Thauera have been reported as potential denitrifiers that remove nitrogen and phosphorus (Thomsen et al., 2007). These denitrifiers are also capable of internal PHB storage (Thomsen et al., 2007). Most species of Thauera reduce nitrogen oxidants through partial denitrification, and the Thauera genus generates N2O as its terminal denitrification product (Liang et al., 2015). The genus Denitratisoma represents a novel group of denitrifying bacteria (Fahrbach et al., 2006). The abundance of potential denitrifying bacterial genera (10.35% of Thauera and 7.00% of Denitratisoma) was significantly higher than that in the reactor reported by Liang et al. (2015) (3.29%); these genera removed large amounts of nitrogen and produced large amounts of N2O in the SBBR in this study.
Conclusions
The advanced nitrogen removal that was achieved during the A/O/A SBBR process is based on the performance of SND during the oxic phase and on denitrification driven by PHB during the anoxic phase. The nitritation–denitritation and PHB-driven denitritation processes simultaneously improved the nitrogen removal efficiency and increased N2O production. The genera Thauera and Denitratisoma, which are potential denitrifiers, were abundantly found in the SBBR, which promoted TN removal efficiency. The genera Denitratisoma, Thauera, and Nitrosomonas were the main microorganisms that stimulated the emission of N2O during this process.
Footnotes
Acknowledgment
This work was supported by the National Natural Science Foundation of China (Grant No. 51778057).
Author Disclosure Statement
No competing financial interests exist.
References
Supplementary Material
Please find the following supplemental material available below.
For Open Access articles published under a Creative Commons License, all supplemental material carries the same license as the article it is associated with.
For non-Open Access articles published, all supplemental material carries a non-exclusive license, and permission requests for re-use of supplemental material or any part of supplemental material shall be sent directly to the copyright owner as specified in the copyright notice associated with the article.