
Abstract
Abstract
Interaction of water quality, flow conditions, and the presence of lead and biofilm was examined in simulated partial lead service line replacement. Recirculating pipe loops were connected to individual 90-L reservoirs, and biofilm was collected from polycarbonate coupons. Three corrosion inhibitors, including sodium orthophosphate (OP) (1 mg-P/L), zinc orthophosphate (ZOP) (1 mg-P/L), or sodium silicate (10 mg/L), were used to treat Pb-Cu pipe loops. Controls included an “inhibitor-free,” “galvanic free,” and “lead-free” with Pb-Cu, Pb-PVC, and PVC-PVC coupled pipe loops, respectively. Adenosine triphosphate (ATP) was used to measure energy production of living cells and as a proxy to assess biofilm growth. The two highest (significant) ATP counts were found in the OP (under stagnant conditions) and ZOP (under flow-through conditions). Sodium silicates generally produced lower ATP counts compared to the phosphate-based inhibitors in the flow-through condition, although these differences were not statistically significant. Significant positive correlation between presence of lead and biofilm (ATP) and presence of copper and biofilm (ATP) were observed, although this observation does not imply a linear relationship. Biofilm was observed to act as a significant reservoir for lead with values ranging from 0.06 to 0.81 μg Pb/cm2 before chlorination to 0.04 to 0.21 μg Pb/cm2 postchlorination. This work highlights the potential for biofilm to act as a reservoir and subsequently as a source of lead release, and underscores the value of including biofilm evaluation when selecting corrosion inhibitors.
Introduction
L
However, sodium silicates have also been observed to be slow acting and take 6 months before significant decreases in lead and copper were observed (Schock et al., 2005), and to provide less corrosion protection compared to zinc orthophosphate (ZOP) (Woszczynski et al., 2015). The exact mechanism of sodium silicate corrosion inhibitor action is still largely unknown, although it is hypothesized to be a function of both pH increase and influence on scale formation (likely hydrocerussite vs. silicate based) (Lintereur et al., 2011).
The impact of phosphate-containing corrosion inhibitors as a source of nutrient for bacteria has raised concerns with utilities, and bacterial regrowth was identified as a potential drawback in 70% of U.S.-based utilities using phosphate inhibitors surveyed in 2001 (McNeill and Edwards, 2002).
Microbial growth requires certain essential nutrients such as carbon, nitrogen, and phosphorous, and traditionally, carbon has been thought of as the only limiting nutrient in drinking water distribution systems; however, there have been conflicting reports regarding the role of phosphate as a nutrient source for biofilm (Fang et al., 2009).
Several studies have shown that phosphate addition enhances bacteria growth in drinking water systems (Lehtola et al., 2002; Chu et al., 2005; Fang et al., 2009; Payne et al., 2016), whereas others reported no enhanced bacteria growth (Batté et al., 2003b). Chu et al. (2005) observed heterotrophic plate counts (HPCs) in biofilm to reach a stable level (2.47 × 10⁵ colony-forming units [CFU]/cm2) after 6 weeks and increased to 1.04 × 10⁶ CFU/cm2 after the addition of 0.01 mg-P/L phosphate. Increasing the phosphate dose to 0.05 mg/L, however, did not result in a further HPC increase. Fang et al. (2009) reported that the addition of 30 and 300 μg/L of phosphorus increased cell count by ∼1 log, but decreased exopolysaccharide (EPS) production by 81% (30 μg/L phosphorous dose) and 77% (300 μg/L phosphorous dose). EPSs are produced by microbial cells and allow them to adhere to surfaces, and the authors suggested that the decrease in EPS production (when exposed to higher phosphorous doses) could be a response to the shift in limiting nutrients from phosphate to carbon. Fang et al. (2009) theorized that as carbon is limited, less energy is invested in EPS production, resulting in a looser, more easily detached EPS structure.
In a lead- and copper-impacted environment, Payne et al. (2016) observed 3 mg-PO4/L to result in significantly higher biofilm on polycarbonate coupons when compared to a control (no PO4). The same authors reported phosphate to increase biofilm community diversity, which has been demonstrated to have important implications for disinfection effectiveness by Simões et al. (2010).
Biofilms are surface-associated bacterial communities with complex interactions between each other and the surface. Biofilm growth can be affected by nutrients present (LeChevallier et al., 1991), disinfectant type (Murphy et al., 2008), surface materials (Lehtola et al., 2004), and flow conditions (Manuel et al., 2007).
Biofilms have been associated with microbially induced corrosion (MIC), where they can affect the surface through several mechanisms, including the following: the creation of a localized galvanic cell, where the area below the biofilm becomes anaerobic and acts as an anode to neighboring aerobic surfaces (cathode), or through the production of metabolic by-products (Schock and Lytle, 2011). However, the effects of MIC were not specifically examined in this study.
Biofilms produce exopolymeric substances that can provide a binding site for cationic metals (Qin-qin et al., 2012), allowing them to accumulate metals, where the functional −OH, C═O, and C–O–C group structures have been shown to provide lead (II) binding sites (Ma et al., 2012). The exopolymeric substances can also bind natural organic matter present in the bulk water, through a variety of mechanisms.
Biofilm accumulation of metals could represent an important sink (or temporary storage site) for released metals and therefore a possible source of metals in bulk water when biofilms are disturbed. Sources of disturbance could include biofilm inactivation (through disinfection) or hydraulic disturbances through changes in flow velocity. For example, Ginige et al. (2011) reported that following biofilm inactivation (through disinfection), Fe and Mn entrapped in biofilm were released.
Biofilm has been shown to be a major contributor to bulk water microbial concentrations. Liu et al. (2014) reported that 98% of the total bacteria in a drinking water distribution system pipe were associated with either the loose deposits or the pipe wall biofilm. Van der Wende et al. (1989) demonstrated in bench-scale experiments that biofilm detachment was the major contributor to the effluent bulk water bacteria concentration. Similarly, Lautenschlager et al. (2010) observed an increase in microbial cell concentration in tap water following overnight stagnation. The authors also analyzed the microbial community diversity of tap water, which suggested that the released cells were associated with biofilm. Therefore, biofilm release could be a significant concern for exposure to lead.
Ownership of lead water service lines is shared between the utility and the homeowner. In an effort to remove sources of lead from drinking water, lead service line replacement programs have been initiated by many jurisdictions; however, the homeowner may choose not to replace their portion of the lead service line, leaving only a partial lead service line replacement (PLSLR). These PLSLRs are subject to galvanic corrosion between the lead portion and the new copper line (typically used), or brass connectors (Triantafyllidou and Edwards, 2010, 2011; Wang et al., 2012).
The practice of PLSLRs is now generally viewed as unhelpful to lead abatement programs as lead release can be worsened by partial replacements, and elevated lead levels have been shown to persist for up to 14 months (St. Clair et al., 2016). This study used simulated PLSLR in recirculating mode as a practical setup to facilitate water quality amendment and the assessment of weekly mass of lead release, and has been used elsewhere to study lead release in PLSLR conditions (Wang et al., 2013).
Corrosion control programs must be tailored to site specific water quality and appropriate for buried infrastructure. As such, bench or pilot scale testing is recommended before implementing changes. The impact of water quality changes as a result of corrosion control programs is not often reported in the literature, with a few exceptions where corrosion surface conditions (Rompré et al., 2000; Ollos et al., 2003) and the presence of phosphate from ZOP (Payne et al., 2016) have been shown to influence biofilm growth and microbial community diversity. In addition, biofilm communities have been associated with lead pipe (White et al., 2011), and elsewhere, lead and other trace inorganics have been shown to accumulate in biofilms (Ginige et al., 2011; Kent, 2016; Payne et al., 2016).
The purpose of this study was to examine the effect of corrosion inhibitor type (OP, ZOP, and sodium silicate) under a variety of water quality conditions on biofilm growth (as measured by adenosine triphosphate [ATP] count). Also, the storage capacity of biofilm for lead was also assessed to estimate the potential of a biofilm release to contribute to lead exposure.
Materials and Methods
Simulated partial lead service line recirculating pipe loop set-up
To simulate PLSLRs, five recirculating pipe loops (four with Pb-Cu test sections and one with a Pb-PVC test section) were constructed using aged lead pipes, which were harvested following 63 years of service from a city located in Ontario, Canada. Lead pipes (internal diameter 1.28 ± 0.3 cm) used in this study were cut into 0.5 m sections and were coupled with 0.5 m sections of new copper pipes (internal diameter 1.27 cm). Insulating plastic spacers were placed between the copper and lead pipes. The two pipe materials were connected by an external copper wire placed 7 cm from the junction to create an external and measurable galvanic current.
In practice, PLSLR uses direct contact of lead and copper, a coupling with a third dissimilar metal, such as brass, a dielectric fitting (with external grounding strap), or through a connector sleeve (Wang et al., 2012; Clark et al., 2013). Wang et al. (2012) found that a PLSLR connected with a plastic fitting and an external copper wire provided varied results comparable to a plastic fitting with no external connection between lead and copper and a brass dielectric fitting. In addition, both of these connection methods released less lead than the brass coupling (Wang et al., 2012).
Lead-free control recirculating pipe loop
There was one additional reservoir attached to a sixth pipe loop that served as a control for biofilm analysis (a similar system with a 50-L reservoir and PVC pipe sections [internal diameter 1.27 cm] connected using a plastic spacer). The smaller volume reservoir for the PVC control was selected due to size constraints in the laboratory.
Water source
Untreated Lake Ontario was selected as an unchlorinated source of water for this experiment to facilitate water quality amendments, and the water quality is given in Table 2. Toronto-treated water (sourced from Lake Ontario) has an average pH of 7.6, conductivity of 316 μS/cm, turbidity of 0.38 NTU, total organic carbon (TOC) of 1.9 mg/L, and a chloride-to-sulfate mass ratio (CSMR) of ∼0.98 (City of Toronto, 2014). The results obtained in this study are only reflective of the water quality used. Site-specific conditions should always be examined in a corrosion study.
Pipe loop operation and recirculation conditions
The experimental phases (lead release acclimation period, and corrosion inhibitor treatment) are shown in Table 1. A total of six recirculating pipe loops were used. Five of the recirculating pipe loops (four with Pb-Cu test sections and one with a Pb-PVC test section) were connected to an individual 90-L reservoir holding Lake Ontario water (Table 2), which allowed for one complete daily flush of the system with reservoir water, given 120 min of flow per day. The sixth, PVC only, recirculating pipe loop was connected to a 50-L reservoir.
For the analyses of pH, conductivity, and chlorine residual, measurement of those parameters was taken daily, but any duplicate measurement for each day was not collected. For the analyses of chloride, sulfate, and corrosion inhibitors, a duplicate sample was collected for each sample, which was collected once a week. The standard deviations were calculated for all the results of each experimental phase.
ATP, adenosine triphosphate; CSMR, chloride-to-sulfate mass ratio; NM, not measured.
The typical treated water values were reported in Drinking Water Analysis Summary for 2014 (City of Toronto, 2014).
—, values which were not reported; MDL, method detection limit; OP, orthophosphate; TOC, total organic carbon.
Alternating stagnant and flow-through conditions were created using a timed pump in the recirculation system (Fig. 1). Recirculating systems (with a reservoir) offer two main advantages over a flow-through system: (1) easy amendment and maintenance of water quality changes and (2) assessment of total mass of lead released from pipe loops on a weekly basis. Pumps provided flow in all pipe loops.
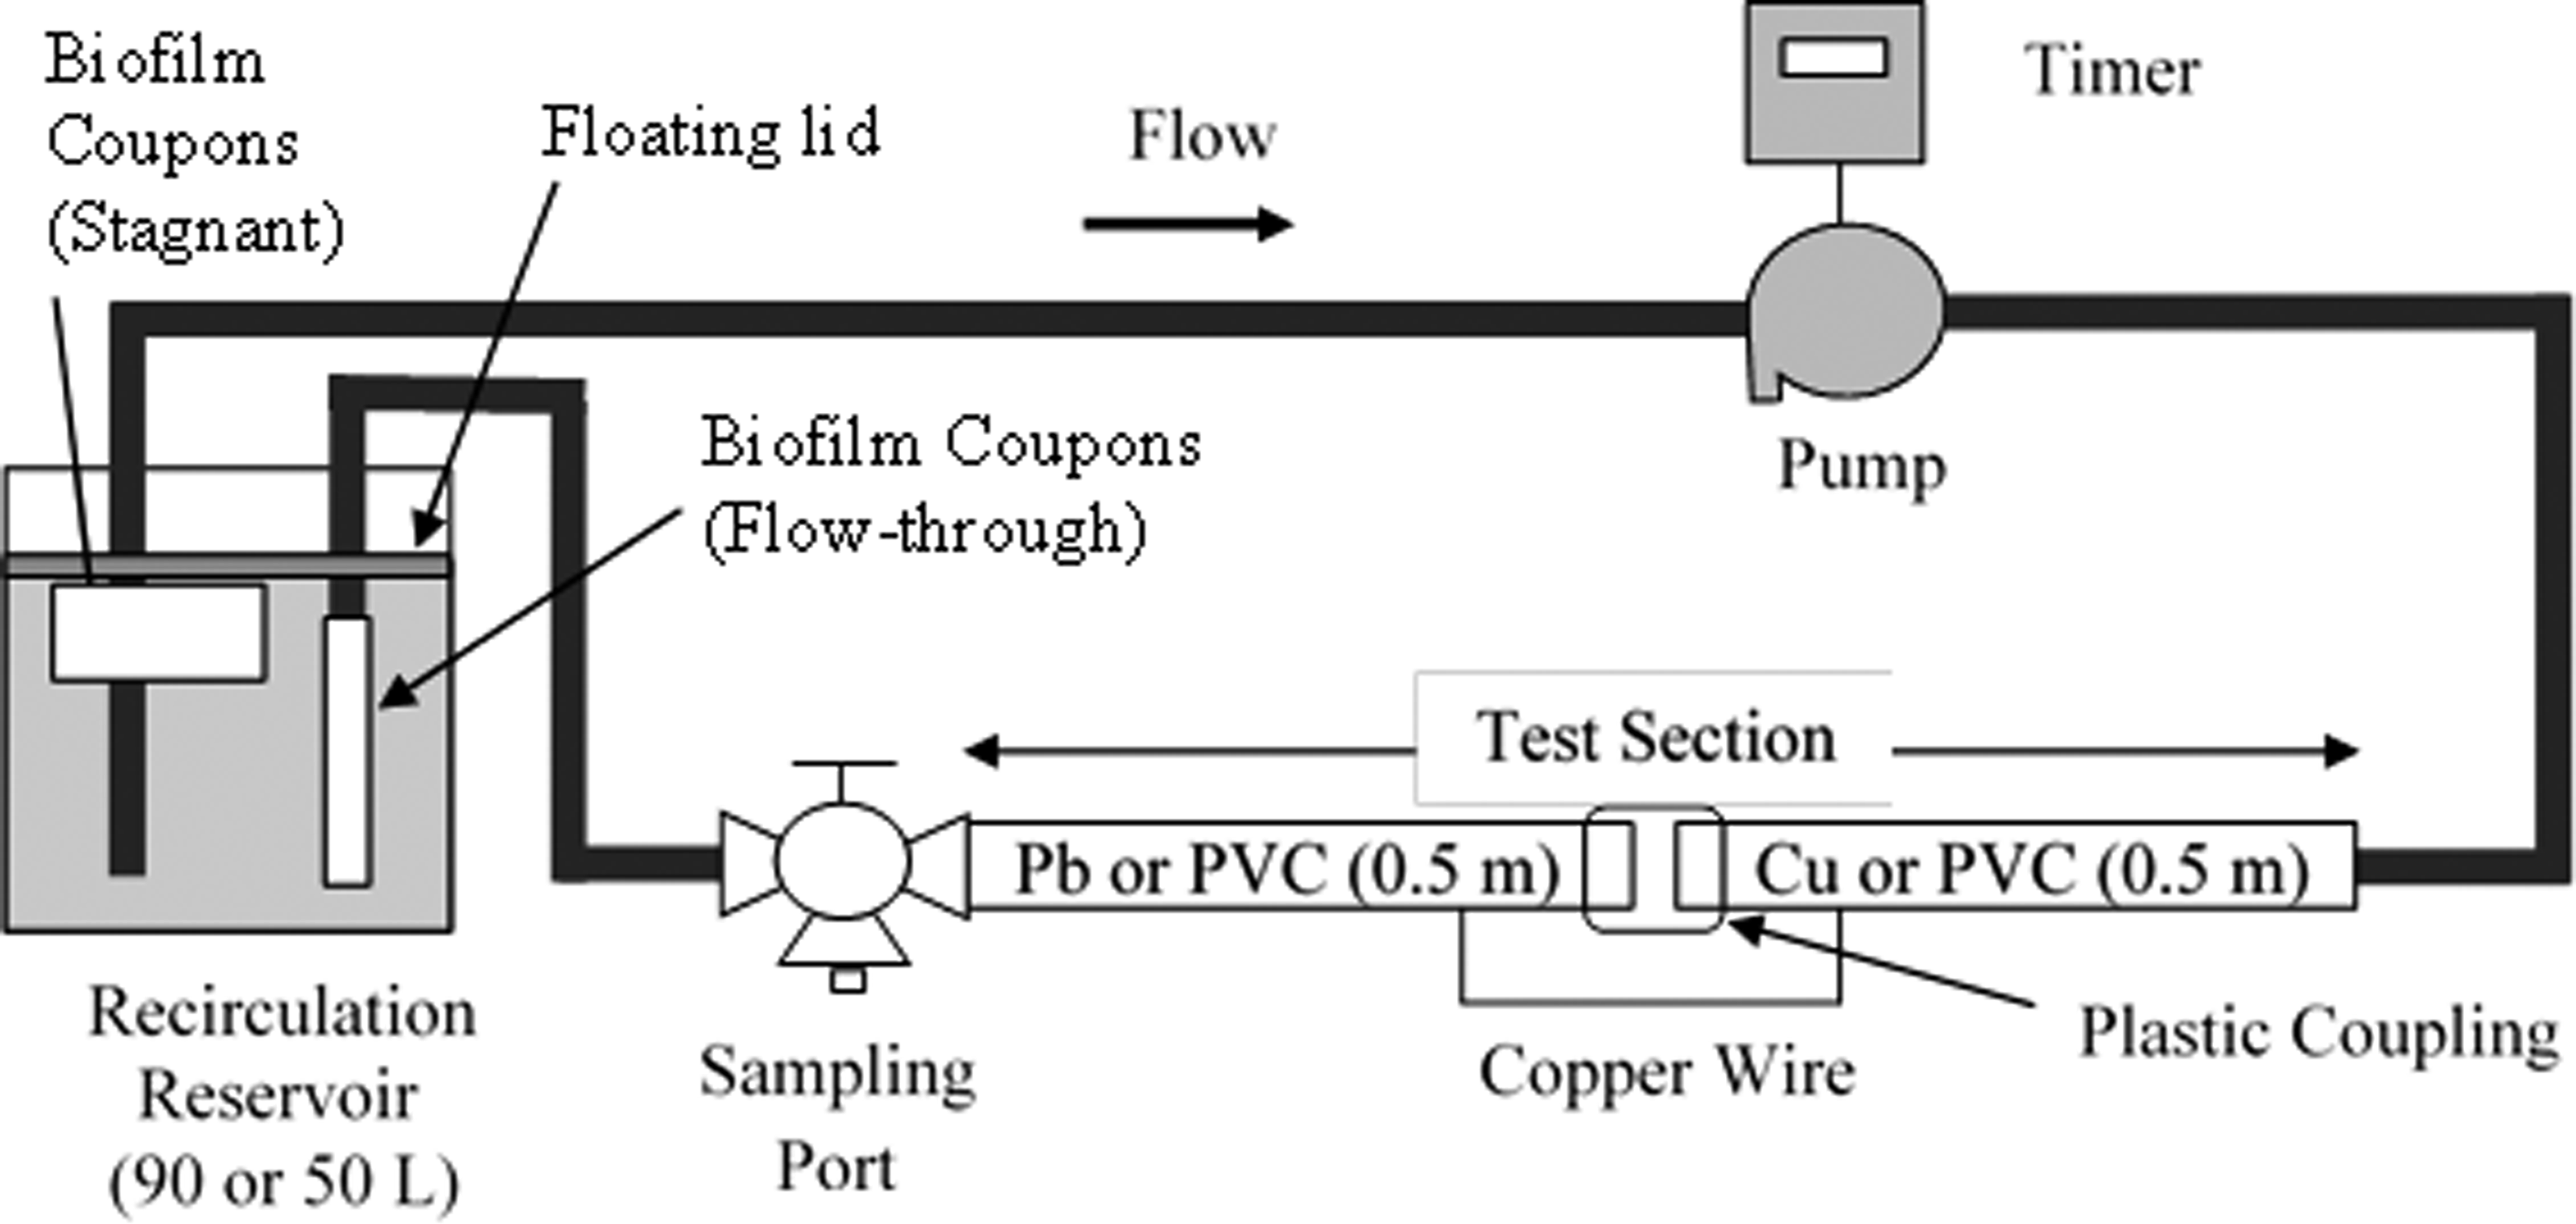
Experimental apparatus (typical).
A median flow rate of 5.3 L/min (1.4 gpm) has been shown to be typical for household kitchen faucets (Welter, 2016). Timers were programmed to simulate a flow rate of 5 L/min for a total 120 min of flow (600 L/day for typical household) with alternating stagnation periods ranging from 10 min to 8 h 20 min. The Reynold's number was calculated to be 8,322, or turbulent flow. The shear stress was calculated to be ∼1.76 Pa for both the metal (lead/copper) and polycarbonate surfaces.
At the end of each weekly cycle, the reservoirs were acidified and drained to assess the mass of lead released over the course of the week, and details of the weekly sampling process are available in Kogo et al. (2017). Fresh Lake Ontario water was then used to refill the reservoirs.
Source water was not treated to remove background microorganisms. The system was not disinfected before use as this would have disturbed the lead and copper scales in the pipe sections.
Water quality conditions and experimental phases
High CSMR values (1.42–7.1, 0.77, and 16.2) can enhance galvanic corrosion (Triantafyllidou and Edwards, 2010; Nguyen et al., 2011b; Hu et al., 2012). Conductivity tends to increase with a high CSMR, which facilitates galvanic current and subsequently galvanic corrosion (Gregory, 1985; Willison and Boyer, 2012).
The experimental phases for the corrosion control trial are shown in Table 1. The length of each experimental phase was determined by the amount of time required to achieve a stable lead release. Stable release was defined as when the 3-week moving average for dissolved lead measure after a 6-h stagnation for all lead-bearing pipe loops fell within ±15% (Kogo et al., 2017).
The experiment also had three control pipe loops for (1) biofilm grown in the absence of lead (PVC-PVC), (2) the absence of a galvanic connection (Pb-PVC), and (3) a corrosion inhibitor-free control (Pb-Cu, no corrosion inhibitor). Following a 4-week acclimation period, a galvanic connection was installed between the lead and copper pipes using an external copper wire during four “treatment” phases of low CSMR, high CSMR-low conductivity, high CSMR-high conductivity, and high CSMR-high conductivity chlorine (Table 1).
The CSMR of test water was adjusted to 0.2 by adding 100-mg/L sodium sulfate (Sigma-Aldrich Co., Oakville, ON, Canada) for the low CSMR condition. For the high CSMR condition, the CSMR did not require further amendment, as the natural CSMR of Lake Ontario water is 1 (high CSMR condition). However, since no sodium sulfate was added to water for the high CSMR condition, the conductivity of water was lower compared to the low CSMR condition. To eliminate conductivity as a confounding factor, the high CSMR condition was also tested at both low and high conductivity conditions by adding equal amounts of sulfate and chloride.
For the high CSMR condition, high conductivity condition was first tested without chlorine and then finally with chlorine. Three corrosion inhibitors added during the treatment phases included the following: OP 1 mg-P/L (Sigma-Aldrich Co.), ZOP 1 mg-P/L (Carus Co., LaSalle, IL), and sodium silicate 10 mg/L (National Silicates, Toronto, ON, Canada). The analysis of the corrosion control experiments can be found in Kogo et al. (2017).
Biofilm collection from polycarbonate coupons
To facilitate biofilm collection, polycarbonate coupons (15 × 1.5 × 2 cm, approximate surface area 45 cm2) were used. Polycarbonate coupons were used to provide an inert surface. It should be noted that the surface characteristics of polycarbonate would be similar to other plastic pipes used in premise plumbing. The polycarbonate coupons were placed outside the lead and copper pipe loops to minimize disturbance to delicate corrosion scales.
Lead and copper coupons were not used as coupon materials, as it would have been difficult to distinguish between the lead and copper adsorbed from the bulk water versus lead and copper released from the coupons during biofilm analysis. The stagnant coupons were placed in a mesh basket and fixed using a glue to allow for water circulation.
To capture flow-through conditions, coupons were placed sequentially (vertically in direction of flow) in the plastic effluent pipe. A total of 40 coupons were inserted into each system, 20 each for the stagnant and flow-through conditions. Coupons were removed from the system for sampling and they were not replaced. The number of samples taken in each experimental phase was a practical consideration as the length of each phase was based on achieving stable lead release.
For the analysis of biofilm ATP and metal correlation, two sets of coupons (representing stagnant and flow-through conditions) were collected from each reservoir in the high CSMR-high conductivity phase, and eight sets of coupons were collected in the high CSMR-high conductivity chlorine phase.
A 42-day biofilm development period was used to achieve steady-state biofilm density on the polycarbonate coupons, consistent with previous studies that had a 30-day minimum acclimation period (Gagnon et al., 2004, 2005; Rand et al., 2007; Payne et al., 2016). One set of polycarbonate coupons under stagnant and flow-through conditions was collected from each reservoir for ATP analysis.
Lead and copper accumulation in biofilm were assessed during the final two stages of the experiment (high CSMR-high conductivity and high CSMR-high conductivity-chlorine conditions). During phases with high CSMR-high conductivity and high CSMR-high conductivity-chlorine conditions, each coupon was cut in half. The coupons were cut horizontally with respect to flow, and there may be some bias as the top half of the coupon would likely have been exposed to a greater concentration of lead, copper, and nutrients compared to the downstream section. The horizontal cut was assumed to be advantageous over a vertical cut, as it would help minimize biofilm sample loss. One half of the coupon was then used for ATP analysis and the other half of the coupon was used for lead analysis.
Experiments were performed at room temperature, 20°C ± 1°C.
Sample analysis
Analysis of water quality parameters
A laboratory pH meter (Model 8015; VWR Scientific, Inc., Mississauga, ON, Canada) was used to monitor pH. Concentrations of chloride, sulfate, and phosphate were measured using ion chromatography with a Dionex ICS-5000 system (Thermo Scientific, Sunnyvale, CA) based on the U.S. EPA Method 300.0 (Pfaff, 1993). Silica (silicon dioxide) and free chlorine were determined using an HACH Silicomolybdate Method (8185) and the DPD colorimetric method described in Standard Method 4500-Cl− (APHA, 2005), respectively, with a DR 2700 Portable Spectrophotometer (HACH Co., Loveland, CO).
TOC was analyzed using a Model 1010 Wet Oxidation TOC Analyzer with a Model 1051 Vial Multisampler (O.I. Analytical, College Station, TX) based on a wet oxidation method as described in Standard Method 5310 D (APHA, 2005). Alkalinity was measured using an end-point colorimetric titration procedure according to Standard Method 2320 B (APHA, 2005).
Galvanic current flowing from the lead to the copper pipes was measured by a multimeter (Model No. 22-811; RadioShack, Fort Worth, TX) with 100-Ω resistance based on the method used by Nguyen et al. (2011a). The external copper wire connecting the two pipes was removed and replaced with the multimeter for 30 s to obtain readings. Conductivity was monitored using a sensION+ MM150 portable Multiparameter meter (HACH Co.).
Coupon sampling procedure for lead, copper, and ATP
To analyze total lead and copper in biofilm, half of the coupons were collected from the six reservoirs during the high CSMR-high conductivity phase and the high CSMR-high conductivity with chlorine phase. Coupon samples were handled on the edges with gloved hands and did not touch other surfaces. Washed and dried scissors were used to cut the coupons, and the ATP density was found to be 0.39 ng ATP/cm2 on the scissors, which confirmed that the cutting procedure did not adversely impact the results. Biofilm was removed from both sides of a collected coupon into a clean 15-mL polypropylene tube by using a clean disposable lead-free scraper.
Any remaining biofilm was collected by rinsing with Milli-Q water. The total volume of the solution was adjusted to 30 mL to obtain enough volume for total lead and copper analysis, and all samples were mixed thoroughly by shaking.
Analysis of biofilm as measured by ATP
ATP is a measure of energy production in living cells and can be used to assess microbiological mass in drinking water applications (Delahaye et al., 2003; Lautenschlager et al., 2010; van der Wielen, and van der Kooij, 2010). ATP in biofilm and raw water samples was determined by using Quench-Gone™ Aqueous test kits and Deposit and Surface Analysis test kits (LuminUltra Technologies Ltd., Fredericton, NB), respectively, with a precalibrated luminometer (LuminUltra Technologies Ltd.). Half of each coupon was used for ATP analysis, leaving the remainder for lead and copper analyses. ATP of the untreated water was analyzed in duplicate using 100-mL samples. For bulk water, 100-mL samples were taken in duplicate for analysis.
Analysis of total lead and copper in biofilm and bulk water
Dissolved lead is defined as lead passing through a 0.45-μm filter. Lead larger than 0.45 μm is defined as particulate. For dissolved lead analysis, half of each sample was filtered using a 0.45-μm syringe filer, discarding the first 5 mL of filtrate to flush the filter. To capture the total lead, the remaining sample and coupons were prepared using nitric acid digestion at 105°C for 2 h (Standard Method 3030 E) (APHA, 2005).
For both dissolved and total lead samples, 0.25% (v/v) nitric acid was added to pH <2 according to Standard Method 3030 B (APHA, 2005) for preservation and stored at 4°C until analysis using inductively coupled plasma atomic emission spectrometry. Copper samples were prepared and analyzed in the same manner as described for lead. Method detection limits for lead and copper were 6.0 and 5.7 μg/L, respectively.
Statistical analyses
All statistical analyses comparing multiple means were conducted using Tukey's method, and pair-wise comparisons were conducted using the paired T-test (Berthouex and Brown, 2002) with MiniTab 17 (Minitab, Inc., State College, PA) statistical software. Pearson correlations were conducted using Microsoft Excel (Microsoft, Redmond, WA). All statistical analyses were conducted at the 95% confidence interval.
Results and Discussion
Effects of corrosion inhibitors on biofilm growth under stagnant and flow-through conditions
Biofilm on polycarbonate coupons under stagnant and flow-through conditions (Fig. 1) was measured to determine the impact of corrosion inhibitors and flow conditions on microbial growth (Fig. 2). Sodium silicates generally produced lower ATP counts compared to the phosphate-based inhibitors in the flow-through condition, although these differences were not significant (α = 0.05).

ATP accumulation under
The results in this study suggest that phosphate (OP, ZOP) did not appear to enhance growth compared to sodium silicate (Fig. 2). Rompré et al. (2000) reported that the mass of biofilm was not significantly different in phosphate systems when compared to sodium silicate and concluded that surface characteristics were a key factor influencing biofilm development. Batté et al. (2003a) reported that phosphate addition did not enhance biofilm growth in a carbon-limited environment.
Effect of chlorination on ATP counts under stagnant and flow-through conditions
In general, in the absence of chlorine, ATP values under stagnant conditions in Cu-Pb systems were higher (2.1–2.4 log ATP) when compared to flow-through conditions (1.5–1.7 log ATP), notably for the OP system that showed the highest values during the high CSMR-high conductivity trial (Fig. 2). The ZOP system was the exception, where ATP values under stagnant conditions and flow-through conditions were not significantly (α = 0.05) different. Under flowing conditions in the absence of chlorine, the ZOP system had significantly (α = 0.05) higher ATP for the low CSMR values, but ATP values were not significantly different in later phases.
Chlorination significantly decreased ATP values for all systems. A 0.9 to 2.2 and 1.0 to 2.0 log reduction were observed under both stagnant condition and flow-through condition, respectively (Table 3). Biofilm appeared to be more resistant to disinfection when considering flow-through conditions. Even though the average ATP values for flow-through conditions were not significantly different from stagnant conditions, ATP values rapidly decreased in 3 weeks under stagnant conditions, while ATP values showed gradual decrease under flow-through conditions.
ZOP, zinc orthophosphate.
Biofilm cohesiveness has been reported to increase after exposure to shear stress (0.2–10 Pa) (Mathieu et al., 2014), which is consistent with observations by others that biofilm volumetric density increases under higher flow velocities (Garny et al., 2008). The shear stress in this study was estimated to be 1.76 Pa under the flow-through condition. Lehtola et al. (2006) also observed an increase in biofilm with increasing flow rate for both copper and plastic pipes. In addition, Mathieu et al., (2014) reported that chlorination (3.7 mg-Cl2/L) decreased biofilm cluster volumes and lowered the shear rate needed to remove biofilm. This was likely as a result of decreased number of contact points. Ollos et al. (2003) compared two levels of shear stress (0.4 and 2.0 N/m2) and suggested that lower shear stress (or flow) may limit biofilm accumulation by reducing mass transfer of biodegradable organic matter.
It is also plausible that more dense biofilms may limit the transfer of chlorine, affecting disinfection effectiveness as has been suggested elsewhere in the literature (Stewart et al., 1998). The results in this study suggest that biofilms grown in dynamic (flow through) conditions are more resistant to chlorination, which could have important implications for disinfection. It is also possible that incomplete mixing may have played a role, with the stagnant coupons exposed to more chlorine as a result of their location in the reservoir; however, the frequent circulation of the reservoir water in combination with the daily monitoring of the chlorine residual would both help minimize this concern.
Lead and copper accumulation in biofilm
Trends with respect to ATP and lead accumulation were consistent, suggesting that the density of biofilm was correlated to the lead storage capacity (Fig. 3). A correlation between lead trapped in the biofilm for the high CSMR-high conductivity condition and the high CSMR-high conductivity with chlorine condition was compared (Fig. 3); significant (p < 0.05) positive Pearson correlations (R > 0.70) were observed for all systems where lead was available, except the sodium silicate system under the flow-through condition and the Pb-PVC system under stagnant and flow-through conditions.

Correlations between total lead and ATP accumulation under
Similarly, total copper was also observed to accumulate in biofilms (Fig. 4) with significant (p < 0.05) positive correlations (R > 0.75) between ATP and copper accumulation with the exception of the PVC-PVC under stagnant conditions. Accumulation in drinking water biofilms of lead (Kent, 2016; Payne et al., 2016) and copper (Payne et al., 2016) has been observed elsewhere. Kent (2016) found that 55% of lead in the influent water to bench-scale glass columns accumulated in the biofilm.
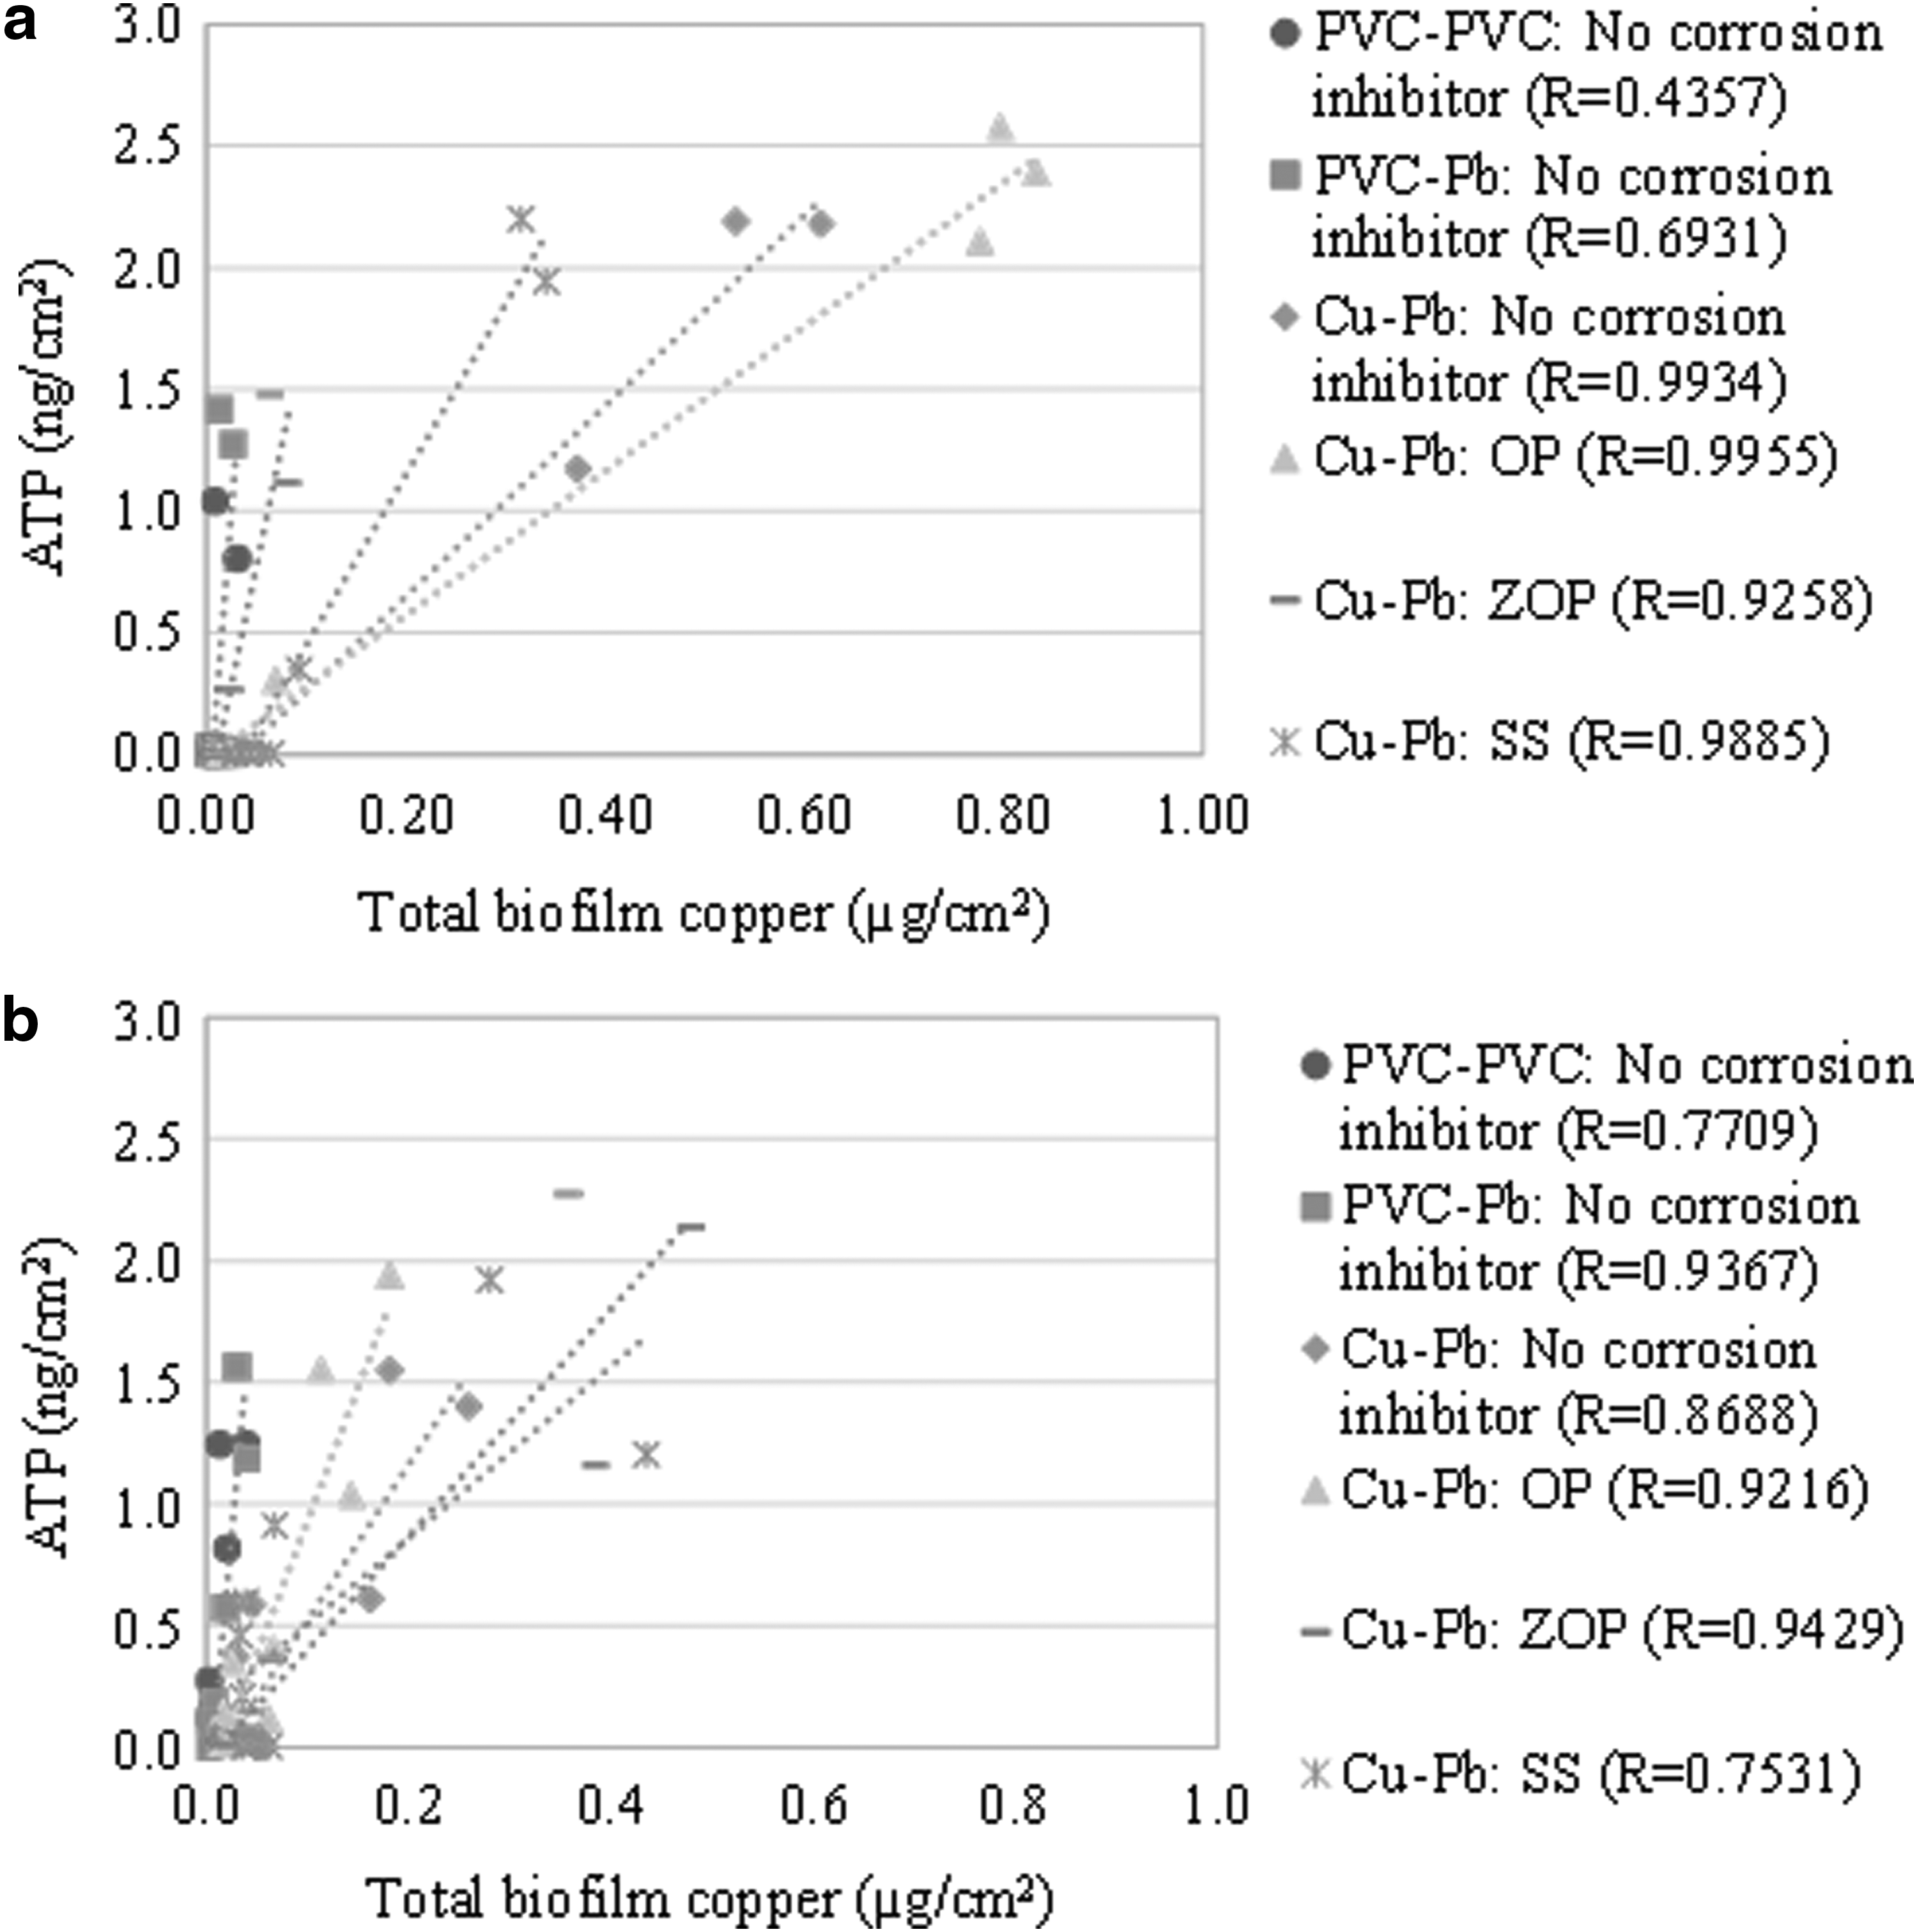
Correlations between total copper and ATP accumulation under
Estimation of capacity of biofilm for storing and releasing lead
The capacity of biofilm to sorb lead is an important consideration as it can be mobilized during disinfection and/or physical disturbances. The capacity of biofilm for storing lead was estimated on the basis of observed ATP and lead values for the flow-through system and an approximate wetted surface area of the pipe section.
For the purposes of estimation, it was assumed that ATP and lead values in the biofilm were uniform throughout the system. The density of Pb in terms of biofilm (ng ATP) and surface area (cm2) for both the high CSMR-high conductivity phase and the high CSMR-high conductivity with chlorine phase is shown in Table 4.
Capacities for storing lead were estimated for wetted internal surface area of a 1-m long pipe, 1-cm internal diameter (approximate surface area of 314 cm2). The weekly mass release of the systems was estimated based on daily galvanic current.
NA, not applicable.
In the high CSMR-high conductivity phase, the density of biofilm-associated lead on a polycarbonate surface was found to be 0.00 μg Pb/cm2 (PVC-PVC, no corrosion inhibitor), 0.14 μg Pb/cm2 (Pb-PVC, no corrosion inhibitor), 0.18 μg Pb/cm2 (Cu-Pb, no corrosion inhibitor), 0.06 μg Pb/cm2 (Cu-Pb, OP), 0.81 μg Pb/cm2 (Cu-Pb, ZOP), and 0.22 μg Pb/cm2 (Cu-Pb, SS). In the high CSMR-high conductivity phase with chlorine, the density of biofilm-associated lead on a polycarbonate surface was found to be 0.00 μg Pb/cm2 (PVC-PVC, no corrosion inhibitor), 0.04 μg Pb/cm2 (Pb-PVC, no corrosion inhibitor), 0.05 μg Pb/cm2 (Cu-Pb, no corrosion inhibitor), 0.04 μg Pb/cm2 (Cu-Pb, OP), 0.21 μg Pb/cm2 (Cu-Pb, ZOP), and 0.06 μg Pb/cm2 (Cu-Pb, SS).
To illustrate the potential impact of biofilm lead accumulation, estimates were made for a theoretical pipe (1 m long, 1 cm diameter) under flow conditions using lead-biofilm values observed in this study (Table 4). Based on a 1-m pipe (1 cm diameter), the lead capacity before chlorination ranged from 20.1 to 254.5 μg. Following chlorination, the lead capacity ranged from 12.4 to 66.2 μg.
Lehtola et al. (2006) observed that copper concentrations increased in bulk water following periods of flow, attributing it to detached biofilm. Similarly, Ginige et al. (2011) reported that biofilm inactivation can release trapped Fe and Mn in biofilm, resulting in increased Mn concentrations, although the mechanisms might be different than those for lead. Lead has been shown to bind to functional groups of biofilm EPS (Ma et al., 2012), and therefore lead could likely accumulate over time in biofilm.
Thus, the capacity of biofilm to act as a reservoir for lead could be important, as detachment could occur under various conditions, releasing the biofilm-lead complex into the bulk water.
Conclusions
This study examined the impacts of various water quality and flow conditions, corrosion inhibitors, and chlorine disinfectant on both biofilm growth and lead accumulation. There was a significant positive correlation between the presence of lead and ATP and the presence of ATP and copper, although this observation does not imply a linear relationship. Biofilm was observed to be an important sink for lead, implying that biofilm could subsequently act as a potentially significant source of lead release. This work highlights the potential for biofilm to act as a potential reservoir for lead, which could be released under changing water quality conditions, and underscores the value of including biofilm assessment when evaluating corrosion inhibitors.
Footnotes
Acknowledgments
The authors wish to thank Jim Wang at the Drinking Water Research Group (University of Toronto) for technical support during the setup and operation of these trials, as well as Toronto Water for providing access to source water. The authors also gratefully acknowledge the Natural Sciences Engineering Research Council of Canada (NSERC) and the Canadian Water Network (CWN) for their financial support. The authors also wish to thank their CWN project partners.
Author Disclosure Statement
No competing financial interests exist.