
Abstract
Abstract
The principal goal of this research was to develop a new scale-up procedure with which the adsorption of organic micropollutants (MPs) by granular activated carbon (GAC) can be predicted from bench-scale tests. To develop scale-up approaches, the adsorption of 29 environmentally relevant MPs was studied in both pilot-scale GAC adsorbers and rapid small-scale column tests that were based on the proportional diffusivity design (PD-RSSCT). Four surface waters with different dissolved organic carbon (DOC) concentrations were spiked with MPs at ng/L levels and tested in PD-RSSCTs simulating full-scale empty bed contact times of 7 and 15 min. Corresponding pilot-scale tests showed MP breakthrough occurred earlier than in PD-RSSCTs, and MP-specific differences between the PD-RSSCT and pilot column breakthrough curves were described by fouling parameters. On average, the PD-RSSCT overpredicted pilot-scale MP breakthrough by a factor of 3.0 ± 1.2 (n = 101). Two approaches were developed for predicting bed volumes that can be treated to 10% MP breakthrough in full-scale adsorbers (BV10%,full-scale). In the first approach, a predictive relationship for the fouling parameter was developed and based on the MP to DOC concentration ratio in the adsorber influent, BVs to 10% MP breakthrough in the PD-RSSCT (BV10%,PD-RSSCT), and pH-dependent octanol–water partition coefficient (log D). In the second approach, BV10%,full-scale was directly predicted from BV10%,PD-RSSCT. These relationships were verified by adequately predicting full-scale GAC breakthrough curves for several MPs in a fifth water from a drinking water treatment plant on the Ohio River.
Introduction
G
A full-scale adsorber is scaled down to the RSSCT by using a smaller GAC particle size (typically 5–10 times smaller) and key relationships developed from dimensional analysis of the dispersed-flow pore and surface diffusion model (Crittenden et al., 1986b). These relationships assume GAC characteristics (particle porosity, bed porosity, pore size distributions, etc.) remain constant from the large GAC particle to the crushed GAC particle and the adsorption of the target MP and any competing compounds can be described by the same scaling equations (Crittenden et al., 1991). GAC adsorber design parameters such as GAC type, empty bed contact time (EBCT), and parallel or series operation can be tested directly using the RSSCT. To estimate operational costs, carbon use rate and bed life can be determined from RSSCT breakthrough profiles.
However, in the presence of background DOM, a systematic approach for predicting full-scale MP removal using the RSSCT has not evolved (Speth and Miltner, 1989; Summers et al., 1989; Crittenden et al., 1991; Knappe et al., 1997; Corwin and Summers, 2010). DOM fouls the surface of the GAC because it is irreversibly adsorbed (Summers and Roberts, 1988), permanently reducing its capacity for MPs through direct adsorption site competition and pore blockage. The reduction in adsorption capacity and kinetics is termed fouling. Capacity reductions from fouling are magnified when there is a large disparity between the respective concentrations of the MP and DOM because of the inability for the MP to compete for a limited number of adsorption sites (Sontheimer et al., 1988; Najm et al., 1991; Corwin and Summers, 2010).
Fouling has been shown to be particle size dependent where larger GAC particles are more susceptible to DOM fouling compared to smaller GAC particles. Larger GAC particles have relatively more surface area behind micropores that become constricted by adsorbed DOM, causing greater reductions in the apparent adsorption capacity compared to smaller GAC particles (Corwin and Summers, 2010). Consequently, fouling does not scale using the current RSSCT design equations resulting in RSSCT predictions that consistently exhibit more adsorption capacity than the full scale. In addition, fouling affects adsorption kinetics (Hand et al., 1989; Li et al., 2003a, 2003b; Kennedy and Summers, 2015), complicating scale-up because of mass transfer assumptions made in the RSSCT design equations.
There are two common RSSCT designs, each making a different assumption about intraparticle mass transfer or adsorbate diffusivity within the GAC pores. One design approach is termed constant diffusivity (CD-RSSCT) and assumes that intraparticle diffusivity is independent of GAC particle size. In the other design approach, the intraparticle diffusivity is dependent on GAC particle size. The most common nonconstant design approach is termed proportional diffusivity (PD-RSSCT), in which the intraparticle diffusivity decreases linearly with particle size and has been shown to adequately predict full-scale removal of DOM (Crittenden et al., 1991; Summers et al., 1995). There has been some success in using both the CD- and PD-RSSCT design approaches for MPs in the presence of DOM (Crittenden et al., 1987; Vidic et al., 1992; Cerminara et al., 1995; Knappe et al., 1997), but in general, the CD-RSSCT was accepted because of its better predictions of early MP breakthrough (Summers et al., 1989; Crittenden et al., 1991; Knappe et al., 1997).
Recent work by Corwin and Summers (2010) has made the RSSCT more useful for MP applications by developing a method for adjusting RSSCT breakthrough data to match full-scale data using the fouling index (FI), shown in Equation (1),
where dp is the GAC particle diameter, LC denotes large column, and SC denotes small column. FI depends on the scaling factor (SF), that is, the ratio of the dp,LC to dp,SC and a fouling factor, Y. The FI is independent of the RSSCT scaling equations for EBCT and hydraulic loading rate (HLR). MP breakthrough profiles obtained in RSSCTs typically overpredict those obtained at the full scale. Therefore, the RSSCT throughput, shown in this work as bed volumes (BVs, ratio of volume of water treated to volume of GAC bed), can be normalized by the FI to match full-scale performance for adsorption capacity, shown in Equation (2).
Using the PD-RSSCT and equilibrium studies, Corwin and Summers (2010) found a range for Y between 0.6 and 0.8 for six MPs. A higher value of Y represents more fouling and a lower value of Y represents less fouling. If an RSSCT were to match full-scale adsorption capacity perfectly, Y would be equal to zero. Their work also suggested an inverse relationship between Y and the influent MP concentration (C0,MP) relative to the influent background DOM concentration measured by dissolved organic carbon (DOC0). However, a predictive relationship for Y has yet to be developed to allow the application of Equations (1) and (2) for full-scale MP breakthrough predictions from RSSCT breakthrough data.
Therefore, the primary objective of this study was to develop a predictive relationship for Y based on MP and system properties and therefore a new scale-up approach using the PD-RSSCT. With respect to MP removal, to date, the PD-RSSCT has only been useful for evaluating different GACs, EBCTs, and adsorber operation in series or parallel, and rarely with MP concentrations at the ng/L level, covering a wide range of adsorbabilities. However, a new scale-up approach for the PD-RSSCT would allow water providers and engineers concerned with the presence of MPs in drinking water to obtain full-scale carbon use rates with significant savings in cost, time, and water compared to pilot-scale studies. An additional benefit of a new scale-up approach using the PD-RSSCT as opposed to the CD-RSSCT would be the ability to predict complete breakthrough curves for both DOC and MPs from a single bench-scale test. Another objective of this study was to explore other relationships using the PD-RSSCT, independent of Y, to provide water providers and engineers with additional methods to predict full-scale MP breakthrough behavior.
Materials and Methods
Waters
MP adsorption was studied in five surface waters (Waters A–E). PD-RSSCTs were conducted with all five waters, pilot tests with waters A–D, and a full-scale study with Water E. Waters A and B were produced by spiking a DOM isolate into GAC-treated tap water. The DOM isolate was obtained from lake water collected at Big Elk Meadows (BEM), Colorado, using a reverse osmosis membrane (DOW FILMTEC™ LE-4040). For Water A, BEM-DOM was coagulated using ∼100 mg/L of aluminum sulfate, settled, and cartridge filtered. For Water B, BEM-DOM was ozonated at ∼1 mg O3/mg DOC. Waters C, D, and E were conventionally treated waters from the Orange Water and Sewer Authority (OWASA) in Carrboro, North Carolina, the City of Longmont (LM) in Colorado, and the Greater Cincinnati Water Works (GCWW) in Ohio, respectively.
Relevant characteristics of Waters A–E are summarized in Table 1. DOC, ultraviolet absorbance (UVA254), and pH were measured in accordance with Standard Methods (APHA et al., 2005). DOC0 concentration ranged by more than a factor of two and the specific UVA254,0 (SUVA254,0) by nearly a factor of two, indicating a range of DOM characteristics. In some cases, the influent water quality of the pilot columns and PD-RSSCTs was slightly different as all the water needed for the PD-RSSCTs was collected or generated at one time, representing a snapshot in time, while the influent water quality of the pilot columns was subject to temporal fluctuation over the course of the run.
BEM, Big Elk Meadows; GCWW, Greater Cincinnati Water Works; DOC, dissolved organic carbon; LM, City of Longmont; OWASA, Orange Water and Sewer Authority; PD, proportional diffusivity; RSSCT, rapid small-scale column test; SUVA, specific ultraviolet absorbance.
Micropollutants
Twenty-nine environmentally relevant MPs including pharmaceuticals, personal care products, herbicides, insecticides, and a manufacturing additive were chosen from occurrence studies of surface drinking water sources (Kolpin et al., 2002; Focazio et al., 2008) and are shown in Supplementary Table S1. Water E contained four additional MPs (bupropion, lamotrigine, metoprolol, and sucralose) that were present in the collected water sample. MPs covered a wide range of hydrophobicities, ionic states, and molecular weights. The 29 MPs were added to Waters A–E for PD-RSSCTs and to Waters A–D for pilot-scale testing. Target MP influent concentrations were based on the median concentrations from the same studies (Kolpin et al., 2002; Focazio et al., 2008), detection limits, and a goal to be able to detect the onset of breakthrough at effluent concentrations that corresponded to 2.5–10% of the influent concentration (C0,MP). All MPs were purchased from Sigma-Aldrich, with three exceptions. 2,4-D was purchased from Acros Organics, iopromide was purchased from US Pharmacopeia, and simazine was purchased from Alfa Aesar.
The sum of the MP mass concentrations in the pilot columns and PD-RSSCT influents for Waters A–D averaged 8.1 ± 2.7 μg/L, which was <0.5% of the DOC0 concentrations. The sum of the MP mass concentrations in the PD-RSSCT influent for Water E averaged 4.6 ± 2.1 μg/L after spiking the 29 MPs. The sum of the native MP mass concentrations in the corresponding full-scale adsorber influent averaged 0.98 ± 0.05 μg/L. Both summed MP mass concentrations for Water E were <0.3% of the DOC0 concentrations, although there were likely more MPs present that were not targeted by the liquid chromatography–tandem mass spectrometry (LC/MS-MS) method.
MP analysis was conducted using LC/MS-MS at the Center for Mass Spectrometry at the University of Colorado at Boulder. Results from the LC/MS-MS analysis were reported as relative concentrations (CMP/C0,MP) derived from analyte area ratios of the paired effluent and influent samples. Influent MP concentrations for pilot tests and PD-RSSCTs (Waters A–D), as well as influent and effluent MP concentrations in Water E were estimated from an internal standard (carbamazepine at 100 ng/L). Water samples were collected in baked 250 mL amber glass bottles, stored at 4°C, and extracted within 1 week before quantification. The relative standard deviation for all MP results was <11% (Ferrer et al., 2010).
Column operation
Operational parameters for the pilot columns and full-scale adsorber are shown in Table 2. Pilot-scale GAC beds were contained in 2.54 cm inside diameter glass chromatography columns with polytetrafluoroethylene (PTFE) adapters and operated at an HLR of 5 m/h, which resulted in a flow rate of 42 mL/min. Although an HLR of 5 m/h represents the lower end of typical rates, it was chosen to limit the amount of water required. The aspect ratios for the columns were 27 (Waters A, C, D with Norit 1240) and 19 (Water B with Calgon F300), which is greater than the 8–10 necessary to avoid wall effects (Knappe et al., 1999). Before starting pilot column tests, the GAC bed was backwashed with dechlorinated and organic-free water to remove carbon fines.
Water E at the full scale: Abed = 181 m2, lbed = 3.5 m, HLR = 12–14 m/h, MGAC = 3.1 × 10⁵ kg, EBCT = 15–18 min.
Log-mean GAC particle diameter.
EBCT, empty bed contact time; GAC, granular activated carbon; HLR, hydraulic loading rate.
EBCTs of 7 and 15 min were evaluated with Water A [Water A(7) and Water A(15), respectively], which was accomplished by operating two GAC columns at EBCTs of 7 and 8 min in series. An EBCT of 7.5 min was evaluated for Water B and an EBCT of 7 min for Waters C and D. Pilot columns for Waters A and B were operated in the laboratory at the University of Colorado, where influent batches were prepared approximately every 3 days. Pilot columns for Waters C and D were operated at their respective treatment plants where MP-spiked influent batches were prepared weekly.
Influent water was spiked with all 29 MPs at individual initial concentrations ranging from 3 ng/L to 3 μg/L. Concentrated MP stock solutions with MP concentrations ranging from 0.1 to 5 mg/L were prepared in deionized water, stored at 4°C, and remade approximately every 6 months. Water was fed to the columns from well-mixed 200 L high-density polyethylene (HDPE) barrels through PVC, stainless steel, and PTFE tubing using a PTFE diaphragm pump. Pilot column effluent water was treated in a secondary GAC barrel before being discharged to a drain.
Paired influent and effluent samples for MP analysis were collected immediately before and after the pilot columns. A needle valve was used for flow control to maintain the desired EBCT during sampling. Pilot column influent and effluent DOC and UVA254 samples were taken biweekly at the beginning of the run. After complete DOC breakthrough, UVA254 was used as a surrogate parameter for DOM concentration. Strong relationships were observed between DOC and UVA254 (R2 ≥ 0.95) for all waters.
For Water E, four paired influent and effluent samples were collected from a single full-scale adsorber containing freshly reactivated GAC. The GAC adsorbers at GCWW are variable rate contactors and were operated within an EBCT range of 15–18 min during the 9-month study (August 2011–May 2012).
RSSCT operational parameters are also shown in Table 2. All RSSCTs were designed according the PD approach (USEPA, 1996) to simulate full-scale EBCTs of 7, 7.5, and 15 min. The PD-RSSCT design was selected for several reasons. As previously discussed, the PD-RSSCT can effectively simulate full-scale breakthrough of DOC and UVA254 (Crittenden et al., 1991; Summers et al., 1995). Corwin and Summers (2010) also showed that MP removal kinetics matched well for the PD-RSSCT design after adjusting MP adsorption capacity with the FI. In the presence of DOM, MP adsorption under typical GAC adsorber operating conditions results in pore diffusion Biot (Bip) numbers greater than 30 (Corwin, 2010). If MP diffusivities are nonconstant with changing GAC particle size and intraparticle mass transfer controls adsorption kinetics (Bip > 30) (Hand et al., 1984), the CD-RSSCT cannot be expected to yield good simulations of full-scale MP breakthrough (Crittenden et al., 1991).
Fresh subbituminous coal-based GAC (Waters A, C, D with Norit 1240; Water B with Calgon F300; Water E with reactivated) was carefully crushed using a mortar and pestle, while minimizing the production of fines. The 100 × 200 mesh size fraction was obtained using US standard sieves and a sieve shaker, rinsed with deionized water to remove fines, dried at 105°C, and stored in amber glass vials in a desiccator. Crushed GAC was then placed in 4.76 mm ID PTFE columns based on a small-scale HLR of 6.7 m/h and flow rate of 2 mL/min. The aspect ratio for the RSSCT columns was 43 (100 × 200 mesh). Spiked influent water was fed to the columns from well-mixed 20 L glass carboys through the same setup as the pilot columns. Sampling and column discharge followed the same procedure as the pilot columns.
PD-RSSCTs were conducted in the laboratories at the University of Colorado at Boulder and North Carolina State University. Except for Waters A and B, which were created in batches, all water for the PD-RSSCTs was collected in 200 L HDPE or stainless steel barrels and stored at 4°C until use.
Results and Discussion
DOC and MP breakthrough
Using results for Water A(7) as an example, breakthrough curves obtained in the pilot column and PD-RSSCT are compared in Fig. 1 for DOC and two representative MPs. Full-scale operation time estimates to reach ∼35% and 65% DOC breakthrough agreed within about 2.4 days when comparing PD-RSSCT and pilot-scale data. Averaging across all the waters, the difference in DOC breakthrough between the pilot columns and PD-RSSCTs averaged about 19 days of full-scale operation time (43% average relative difference) for the four waters (Supplementary Table S2), indicating the good predictability of PD-RSSCT for DOM removal.
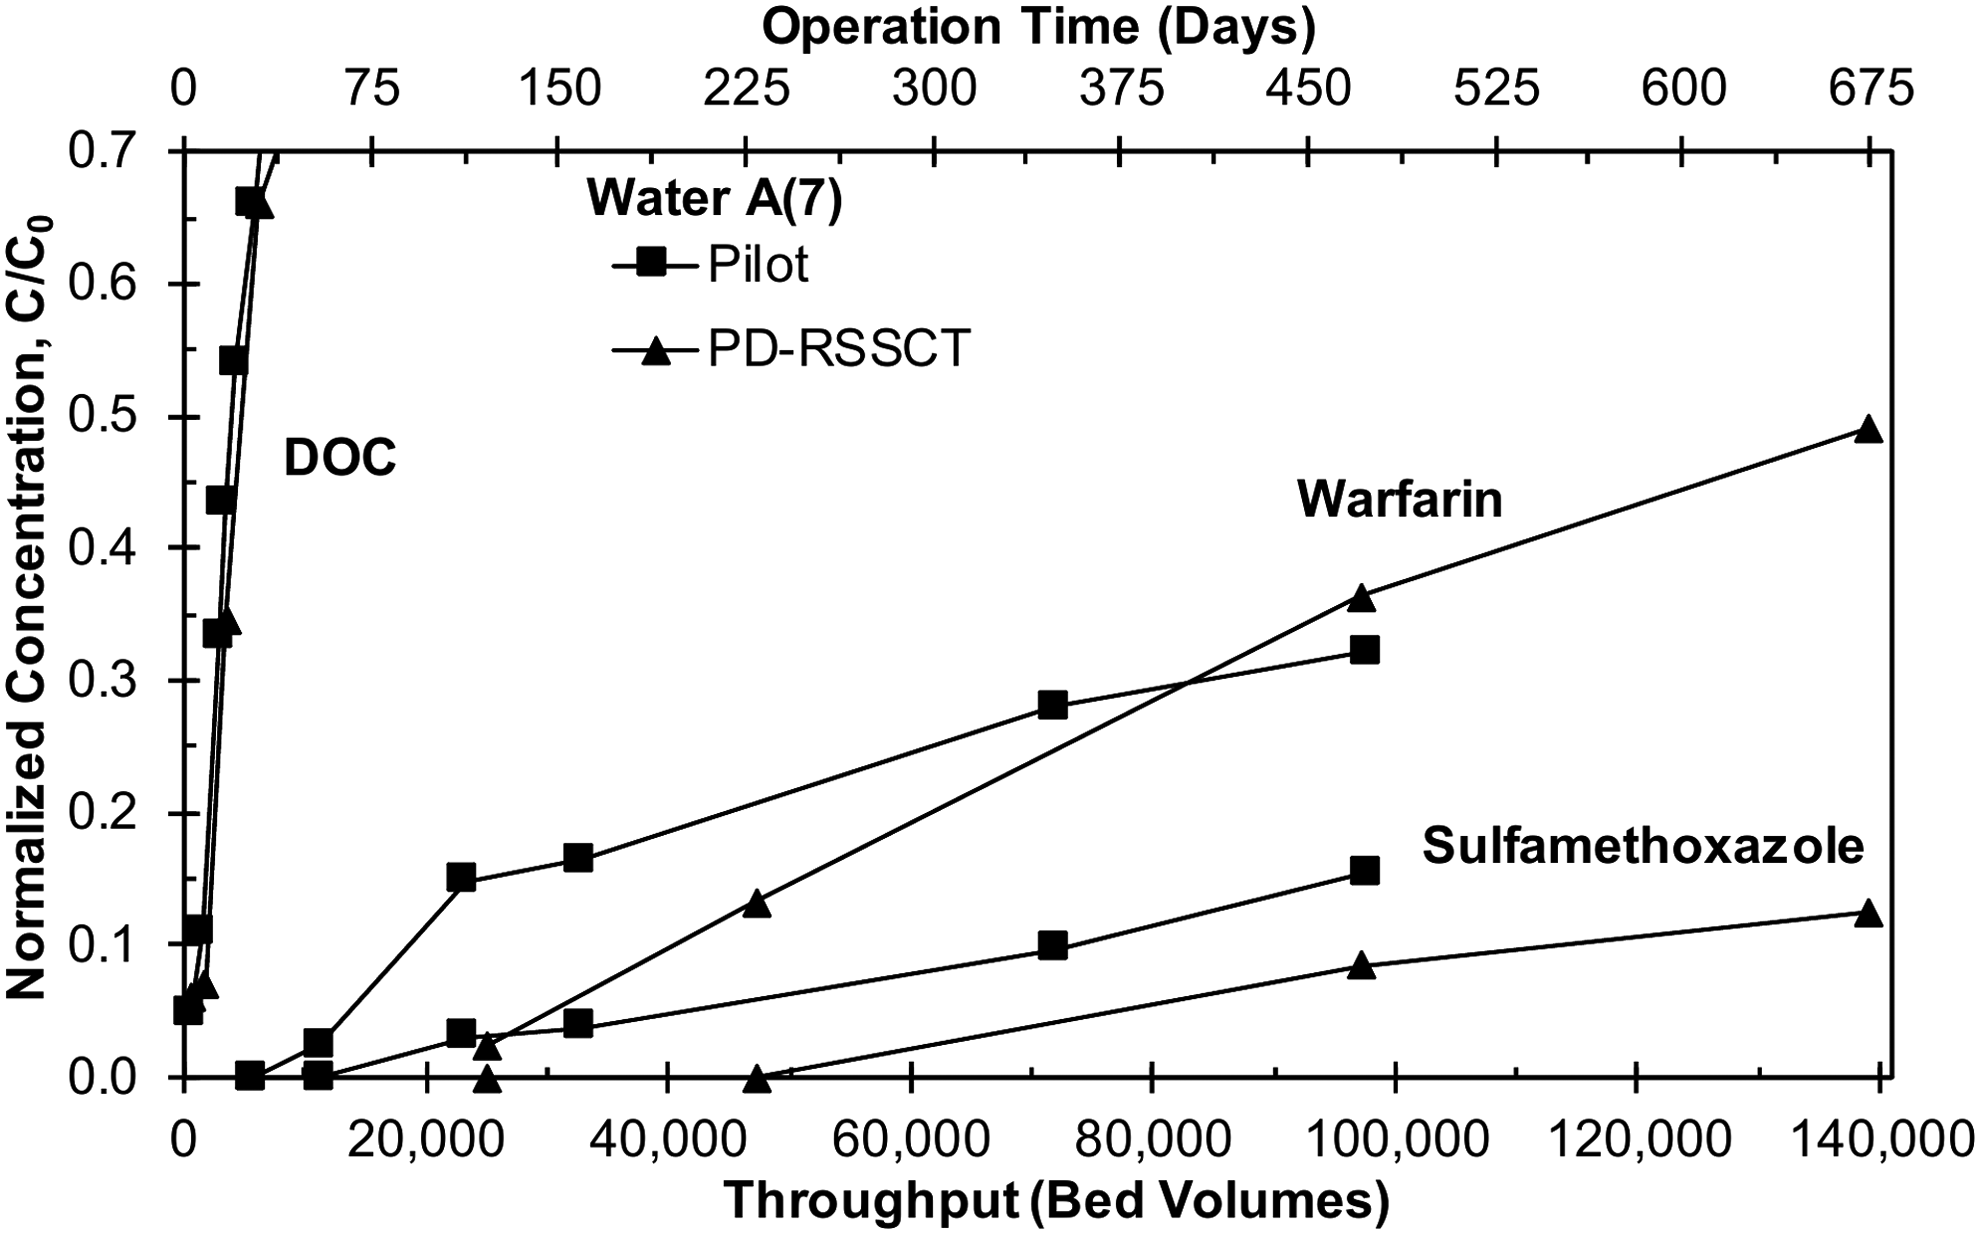
Comparison of pilot and PD-RSSCT breakthrough curves for DOC (C0 = 3.9 ± 0.4 mg/L), warfarin (C0 ∼70 ± 30 ng/L, MRL ∼5 ng/L), and sulfamethoxazole (C0 ∼270 ± 40 ng/L, MRL ∼5 ng/L) in Water A(7). DOC, dissolved organic carbon; MRL, minimum reporting limit; PD, proportional diffusivity; RSSCT, rapid small-scale column test.
In contrast, at 10% MP breakthrough, there was a difference of about 200 and 100 days of full-scale operation time for sulfamethoxazole and warfarin, respectively, shown in Fig. 1. BVs to 10% breakthrough (BV10%) were chosen as a metric for MPs because of limited breakthrough for many MPs and the general goal to achieve high MP removal levels from drinking water. In Fig. 1, the pilot column and PD-RSSCT breakthrough curves for warfarin intersect at ∼30% breakthrough, a result that was likely caused by the onset of warfarin biodegradation in the pilot column (Zearley and Summers, 2012).
Results in Fig. 1 are representative of the other waters, for which the absolute differences between pilot-scale and PD-RSSCT breakthrough curves were small for DOC and large for MPs. Small differences in DOC breakthrough were attributed to seasonal fluctuations in DOC0 concentrations at the pilot/full scale, whereas the PD-RSSCT represented a snapshot in time of water quality. While small differences in bulk DOM surface loading between pilot tests and PD-RSSCTs could cause small differences in MP breakthrough at the two scales, the principal reason for the observed differences in MP adsorption is the particle size dependence of GAC fouling by DOM (Corwin and Summers, 2010). DOC breakthrough occurred well before any MP breakthrough for all tests; therefore, DOC breakthrough curves are not shown in subsequent figures. Instead a throughput in BVs to DOC breakthrough of 20% and 50% (BV20% and BV50%) is shown in Table 3 for Waters A(7 & 15) through D. DOC BV20% and BV50% values are much smaller than MP BV10% values, also shown in Table 3, demonstrating how DOM loading occurred well ahead of any MP mass transfer zone (MTZ).
No measurable breakthrough was found for acetaminophen, carbaryl, diuron, and trimethoprim.
Average ± standard deviation (count).
Actual EBCT values are 0.82, 0.63, 0.82, 0.82, and 1.8 min.
Value taken as average of data and PSDM simulation.
Value taken from PSDM simulation.
Values not included in calculations due to erratic breakthrough behavior over all tests.
No pilot breakthrough, therefore no Y value could be obtained.
No breakthrough or could not be confidently projected to 10% using the PSDM.
Testing whether average values are significantly different than unity [Water A(7)] at the 95% confidence level, that is, larger or smaller average Y values.
BV, bed volume; PSDM, pore and surface diffusion model.
Obtaining fouling factor values
The pore and surface diffusion model (PSDM using AdDesignS™ from Michigan Technological University, Houghton, Michigan) was the main tool used to obtain Y values that account for differences in MP adsorption capacity between the pilot column and PD-RSSCT breakthrough data. Procedures for the PSDM fitting methods are given elsewhere (Summers et al., 2014) and follow the modeling assumptions of Corwin and Summers (2011). The modeling approach of Summers et al. (2014) involves systematically fitting the PSDM to the PD-RSSCT curve and then adjusting the fit to match the pilot column data, obtaining an FI value as the ratio of the PD-RSSCT adsorption capacity parameter, Freundlich K (KF), to the pilot column KF. Within the PSDM, different combinations of KF and intraparticle tortuosity (τ) values could have been interpreted as adequate fits to experimental data, especially for MPs with limited (<50%) breakthrough curves. To obtain Y values, τ values were limited to <20 (Sontheimer et al., 1988; Hand et al., 1989; Corwin and Summers, 2011), and differences between the limited number of PD-RSSCT breakthrough points and the PSDM fit were visually minimized.
Y values were also obtained following the approach of Corwin and Summers (2010), which involved adjusting Y values by increments of 0.05 to visually collapse the PD-RSSCT breakthrough data onto the pilot column data. This second approach is demonstrated for four MPs in Waters A(7), B, C, and D and is shown in Fig. 2. The sensitivity of ±0.05 for Y is also shown in Fig. 2 for malaoxon and demonstrates that increments smaller than 0.05 were not justified. All Y values obtained from the two methods were not statistically different (t-test, 95% confidence level) for Water A(7), most likely because both methods are subject to user discretion in visual fitting. All Y values obtained from the two methods are summarized in Table 3 for Water A(7).

Visual Y-fitting for malaoxon (C0 ∼230 ± 50 ng/L, MRL ∼10 ng/L) in Water A(7), clofibric acid (C0 ∼230 ± 40 ng/L, MRL ∼5 ng/L) in Water B, simazine (C0 ∼80 ± 20 ng/L, MRL ∼5 ng/L) in Water C, and metolachlor (C0 ∼120 ± 60 ng/L, MRL ∼10 ng/L) in Water D. MBD, minimum breakthrough detection.
Predicting full-scale MP adsorption kinetics using the PD-RSSCT
Using Y and FI to collapse the PD-RSSCT breakthrough curves onto the pilot column, breakthrough curves corrected for differences in adsorption capacity, but it was also found that adsorption kinetics matched as well as seen by Corwin and Summers (2010). Since the FI is a constant value, using it to normalize PD-RSSCT throughput will inherently create a steeper breakthrough curve for the adjusted PD-RSSCT prediction. As demonstrated in Fig. 2, the slope of most adjusted PD-RSSCT breakthrough curves matched the pilot column well with some steeper and some shallower. Given that the PD-RSSCT with the FI approach provides relatively good predictions of full-scale kinetics and alternative methods are not guaranteed to provide better predictions (Corwin, 2010), assuming intraparticle diffusion effectively decreases linearly with GAC particle size is a valid assumption for MP adsorption in the presence of DOM.
Adsorption kinetics was further investigated by curve fitting using the PSDM. Surface diffusion, or the surface-to-pore diffusion flux ratio (SPDFR), was initially set equal to zero due to the presence of DOM (Hand et al., 1989; Carter and Weber, 1994; Jarvie et al., 2005; Corwin and Summers, 2011). For all 72 PD-RSSCT PSDM fits for Waters A(7 & 15), B, and D, surface diffusion was not required to acquire a good fit of the data. Surface diffusion was invoked for 24 of 66 pilot column PSDM fits for Waters A(7 & 15), B, and D. Surface diffusion was invoked for 3 of 11 PD-RSSCT PSDM fits and all 11 pilot column PSDM fits for Water C. Surface and pore diffusion Biot numbers (Bis and Bip) were greater than 30 in the pilot columns and PD-RSSCTs, indicating film diffusion was negligible to mass transfer resistance and intraparticle mass transfer controlled adsorption kinetics (Hand et al., 1984; Sontheimer et al., 1988; Corwin, 2010). Using the PSDM, it was found that on average, pore diffusion was about seven times slower and surface diffusion was much slower (most SPDFRs ≈0) in the PD-RSSCT compared to the pilot columns. According to the PD-RSSCT design, the amount of spreading of the MTZ in the large- and small-scale columns due to intraparticle diffusion resistances should be identical. However, it cannot be expected that kinetics would match because fouling does not scale using the RSSCT design equations, hence the development of the FI approach by Corwin and Summers (2010).
A probable cause for slower than expected intraparticle diffusion is that after GAC particles are ground, the micropore domain dominates mass transfer resistance (Summers et al., 2011). It is thought that grinding exposes more meso- and micropores to the bulk flow (Corwin and Summers, 2010), reducing the occurrence of a two-domain transport of diffusion through the macropores followed by diffusion through the meso- and micropores. Considering the PD design of the RSSCT has similar DOM loadings per mass of GAC compared to the full scale, adsorbed DOM would therefore increase pore tortuosity to a greater extent in the smaller GAC particle. Slower adsorption kinetics would result from increased pore constriction and elimination of surface diffusion, thereby increasing the spread of the MTZ, flattening the breakthrough curve. Increased external mass transfer resistance in the small column is not a suspected cause for the shallower breakthrough curves because the amount of spreading due to film mass transfer is reduced in the PD-RSSCT design (Crittenden et al., 1987, 1991).
Effect of influent DOC concentration, EBCT, and GAC particle size on the fouling factor
MP BV10% values in Table 3 show that iopromide was the least adsorbable among the 29 tested MPs. while carbamazepine and naproxen were the most adsorbable among the compounds that broke through in the PD-RSSCT for Water A(7). BV10% values for acetaminophen, carbaryl, diuron, and trimethoprim are not shown in Table 3 because they did not exhibit breakthrough in any of the waters. PD-RSSCT run times were long because of the high affinity of many of the tested MPs for the GAC surface and increased adsorption capacity of the smaller GAC particle size. Although the RSSCT typically underestimates MP removal from biodegradation, some MP biodegradation was expected in both the pilot columns and PD-RSSCTs despite the frequent replacement of the glass wool prefilter in the PD-RSSCT setup. For biodegradable MPs (Zearley and Summers, 2012), pilot column and PD-RSSCT data were matched only at early breakthrough before the onset of significant biological growth.
BV10% values for a given MP were different for each water, indicating breakthrough was a function of the background matrix. To investigate the effects of the background matrix on scale-up, Y values (using PSDM fitting) for each MP were compared across all waters. Comparisons were made by normalizing Y values in each water by the corresponding Y value from Water A(7). Water A(7) was chosen as the base case because it had the highest DOC0 concentration and highest number of MPs with sufficiently high levels of breakthrough to obtain Y values (n = 23). The ratios are shown in the right side of Table 3. For each test, these ratios were then averaged and compared to unity to see if their collective behavior was significantly different from Water A(7) (t-test, 95% confidence level). Y values for caffeine and tributyl phosphate were excluded for the analysis due to erratic breakthrough behavior in all waters.
On average, Y values from Waters B, C, and D were statistically similar to those from Water A(7). Y values for Water A(15) were 13% larger on average compared to Water A(7), but these differences were small (largest absolute difference in Y was 0.08 for methomyl) between Water A(7) and Water A(15), and the data for Water A(15) were limited (n = 5). Thus, Y was determined to be primarily a function of the MP and less so a function of the background matrix over the range of waters tested. Previous work suggested Y may solely be a function of the ratio of C0,MP to DOC0 (Corwin and Summers, 2010; Corwin, 2010), whereas this work suggests Y is a function of MP properties other than its concentration (e.g., hydrophobicity). Average Y values, with most standard deviations near 0.1, for each MP shown in the far right of Table 3 demonstrate the MP-specific nature of Y over the range of waters tested.
It is interesting to note that on average, Y values were not significantly different for Water B, even though the SF of 11.9 for this pilot column and PD-RSSCT pair differed from the SF of 8.5 for all other pilot column and PD-RSSCT pairs. The SF is the ratio of GAC particle sizes in the pilot column to the PD-RSSCT, and relates Y to FI, shown in Equation (1). Therefore, the particle size dependence of fouling is represented by the SF term in the FI, while the MP dependence is captured by Y. Consequently, pilot-scale testing may not be necessary to establish FI, and only two PD-RSSCTs with two different GAC particle sizes (suggested SF ≥3) may need to be conducted to yield Y values. Once the Y value is obtained, breakthrough from either PD-RSSCT can be scaled to project full-scale GAC adsorber performance.
Predicting the fouling factor
Theoretical relationships for DOM fouling are difficult considering the vast number of variables that can exist between waters, GAC type, loading scenarios, and so on. Therefore, an empirical relationship was developed based on obtainable and adsorption-relevant parameters. A total of 47 Y values were chosen from Waters A(7 & 15), B, C, and D, as well as Y values from Crittenden et al. (1989), Summers et al. (1989), Mastropole (2011), and Fotta (2012). The literature Y values were all from PD-RSSCTs representing 13 different volatile organic compounds and were included to obtain a breadth of Y values, MPs, GAC types, SFs (4.3–13.6), and adsorption conditions. In all, 73 Y values were used for a multiple linear regression using the least-squares method.
Y values were compared to many physical parameters relevant to adsorption, including the ratio of the initial MP concentration to DOC0 concentration (C0,MP/DOC0) based on the findings of Corwin and Summers (2010), aqueous solubility, pH-dependent octanol–water partition coefficient (log D), and Abraham solvation parameters (A, B, E, S, V). MP BV10% values were also considered a system property that incorporates the GAC type, particle size, adsorber operating conditions, and background DOM matrix. Using BVs to any percent breakthrough is essentially a surrogate measure of the system-specific adsorption capacity.
Singularly, only the ratio of the C0,MP/DOC0, BV10%,PD-RSSCT, and log D showed any systematic trend with Y values. These parameters represent both the specific MP and background DOM matrix. Several other researchers have related activated carbon removal or breakthrough to these parameters (Magnuson and Speth, 2005; Westerhoff et al., 2005; Snyder et al., 2007; de Ridder et al., 2009, 2010; Mastropole, 2011; Fotta, 2012; Reinert, 2013). Therefore, these three parameters were chosen for a multiple linear regression of the initial surface response model form in Equation (3),
where y is the fouling factor Y, β is the regression coefficient, x1 is C0,MP/DOC0, x2 is BV10%,PD-RSSCT, and x3 is log D. Log D values in the range of −2.66 to 3.03 were obtained from SciFinder® (Chemical Abstracts Service) at the appropriate pH for MPs that are ionic at pH values 6–8. C0,MP/DOC0 values ranged from 4.7 × 10⁻⁶ to 0.48 and BV10%,PD-RSSCT values ranged from 850 to 310,000.
To best stabilize the variance, the response (Y) was transformed to the reciprocal of Y. Regressions were then run in a stepwise manner, where in each step, the coefficient (β) with the highest p-value above 0.05 was eliminated until all the coefficients were significant at the 95% confidence level. Final results from the stepwise regression (p < 0.01, R2 = 0.77, R2adj = 0.76, R2pred = 0.71, n = 73) showed nonlinear behavior that could not be accounted for by the linear equation, even with significant interaction terms. Therefore, the model was transformed using a significant power function (p < 0.01, R2 = 0.68, R2adj = 0.68, R2pred = 0.66, n = 73), yielding the final regression shown in Equation (4).

Plotting residuals as a function of fitted values for all steps in the regression process showed random equal variance, and normal probability plots confirmed the residuals were normally distributed. β0, β1, β2, β3, β12, and β23 were all found to be significant (p < 0.05). Equation (4) follows expected trends that Y values increase (which implies a larger fouling effect) with the following: (i) increasing BVs to 10% MP breakthrough, that is, more time for DOM fouling/preloading to occur, (ii) decreasing C0,MP/DOC0, either decreasing influent MP concentration or increasing DOC0 concentration, that is, MP ability to compete for adsorption sites is reduced, and (iii) increasing log D or MP hydrophobicity, that is, as MP affinity for the GAC surface increases, the progression of its MTZ slows, allowing for increased DOM fouling/preloading. A sensitivity analysis was conducted for each predictor over the range of its values (e.g., C0,MP/DOC0: 4.7 × 10⁻⁶ to 0.48), while the other two were held constant at their median values. Each predictor had similar impacts on Y predictions, a range of about 0.35–0.45, indicating no single predictor dominates Equation (4) over their given ranges.
Although complete full-scale breakthrough curves can be acquired using the PD-RSSCT and Equation (4), if only BV10% values are desired, the PD-RSSCT only needs to be run to 10% MP breakthrough to obtain a Y value from Equation (4). This approach would result in further reductions in effort and analytical costs for predicting MP removal in full-scale GAC adsorbers. For most MPs, termination of a PD-RSSCT at 10% MP breakthrough would still capture complete DOC breakthrough.
A plot (p < 0.01, R2 = 0.63, R2adj = 0.62, R2pred = 0.60, n = 73) comparing the simulated or predicted [from Eq. (4)] BVs to 10% breakthrough in the pilot (designated from here on as BV10%,full-scale as pilot columns used full-scale GAC media) values to the corresponding experimentally determined BV10%,full-scale values is shown in Fig. 3a. The error bars represent the variability when adjusting Y by ±0.1, a range deemed acceptable considering the experimental and analytical variability at these low MP concentrations. Nineteen Y values from Waters A(7 & 15), B, C, and D were not used in the development of Equation (4) because (i) breakthrough was below detection, (ii) only one breakthrough point could be used to obtain a Y value, (iii) the MP was caffeine or tributyl phosphate for reasons previously discussed, or (iv) the Y value experienced high (>3σ) standardized residuals during regression analysis. Four external full-scale BV10% values for atrazine, DEET, simazine, and prometon from Corwin and Summers (2010) are also shown for comparison, and were predicted within 14% on average. In Fig. 3a, a good agreement between experimental and predicted BV10% values was observed up to about 50,000 BVs or 8 months of GAC service time at a 7 min EBCT, demonstrating the utility of Equation (4) for predicting early MP breakthrough.
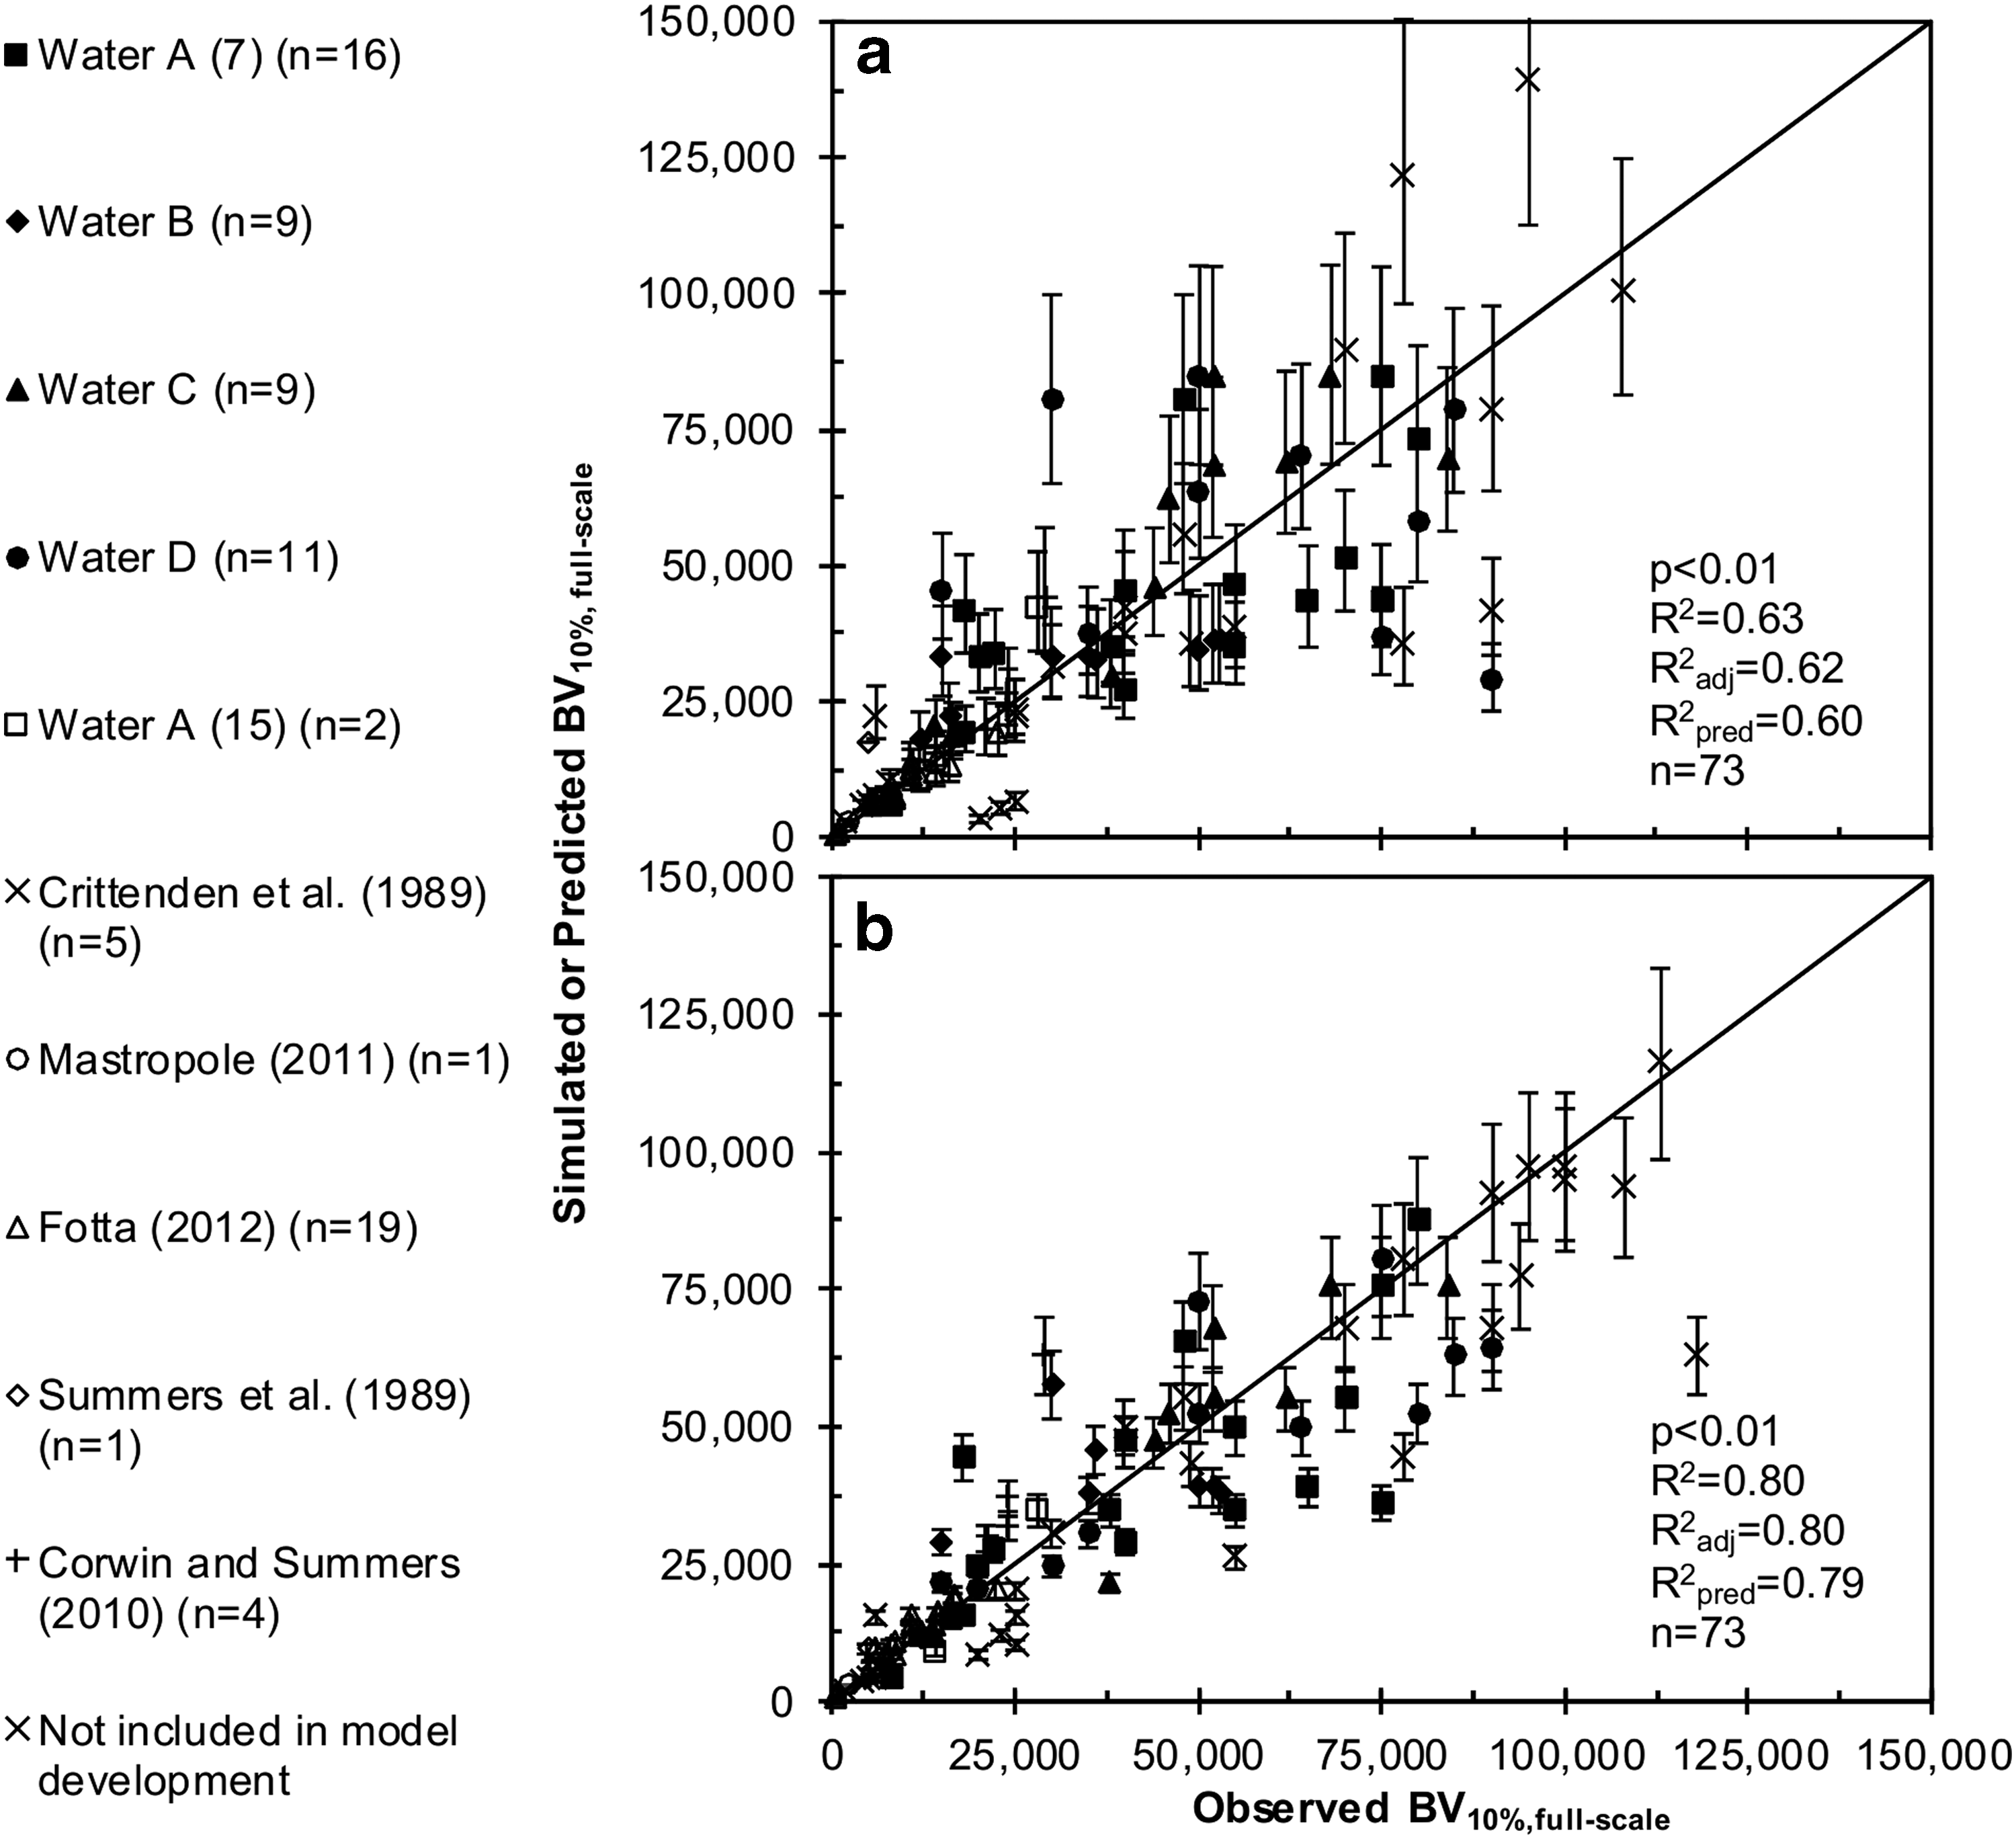
Simulated or predicted values versus observed values for
Eight MPs that were not used to develop the regression were not predicted well. These MPs broke through late in their respective PD-RSSCT (>250,000 BVs) despite having log D values less than about 2. Late breakthrough defined by relatively large BV10%,PD-RSSCT values, possibly from biodegradation, yielded large Y values (>1). MPs with such late breakthrough in the PD-RSSCT would also break through late at the full scale, well beyond normal adsorber run times, and thus would not be a concern for drinking water providers.
Predicting full-scale BVs to 10% MP breakthrough
Alternatively, and independent of the FI method, an empirical relationship was developed relating BV10% values obtained from PD-RSSCTs to those measured in pilot columns. Pilot column and PD-RSSCT BV10% values were selected following the same guidelines as for the previous approach. In all, 73 BV10% pair values were used for a simple linear regression using the least-squares method. To stabilize the variance, the response (BV10%,full-scale) and predictor (BV10%,PD-RSSCT) were both transformed using the natural logarithm. The resulting regression is shown in Equation (5) (p < 0.01, R2 = 0.92, R2adj = 0.92, R2pred = 0.92, n = 73).
As before, a plot of residuals as a function of fitted values showed random equal variance, and normal probability plots confirmed residuals were normally distributed. Both β0 and β1 were found to be significant (p < 0.1). A plot (p < 0.01, R2 = 0.80, R2adj = 0.80, R2pred = 0.79, n = 73) comparing fitted or predicted [from Eq. (5)] BV10%,full-scale values to the corresponding observed BV10%,full-scale values is shown in Fig. 3b. For predicting full-scale BV10% values, Equation (5) appears to be superior to Equation (4). However, Equation (4) is intended to obtain the FI so that a complete PD-RSSCT breakthrough curve can be adjusted to project a complete full-scale breakthrough curve. A complete breakthrough curve allows for comparison of carbon use rates at different levels of MP removal and more accurate curve fitting using the PSDM to obtain adsorption capacity and kinetic parameters (i.e., KF and τ).
Of the MPs used to develop the regression, 48% fell within 20% of the observed BV10%,full-scale. For the MPs used to validate the regression, 54% fell within 20% of the observed BV10%,full-scale. The four external full-scale BV10% values from Corwin and Summers (2010) are also shown for comparison. None was predicted within 20% of the observed BV10%,full-scale, but all fell within 61% on average. Equation (5) may also serve as a check on Equation (4) if a larger Y value (>1) is predicted. On average, the PD-RSSCT overpredicted BV10% of the pilot/full scale by a factor of 3.0 ± 1.2 (n = 101) for an SF range of 4.3–13.6. Typically, the factor of overprediction was <3 for weakly adsorbing MPs and >3 for strongly adsorbing MPs.
Full-scale verification
Using reactivated GAC from GCWW, a PD-RSSCT was designed and operated to compare breakthrough data to full-scale breakthrough data from Kennedy et al. (2015) for six MPs in the effluent of one of 10 full-scale adsorbers at GCWW. Full-scale and PD-RSSCT breakthrough profiles are shown in Fig. 4 for the six MPs. Despite limited data, the scale-up approach using Equation (4) to estimate Y resulted in good predictions of the full-scale data for four of the six MPs. Water E comparisons between predicted [Eq. (4)] and observed [PSDM method from Summers et al. (2014)] values are shown in Table 4. The predicted Y values for atrazine, caffeine, cotinine, prometon, and sucralose in Water E were within 0.1 of the PSDM-fitted values. The predicted Y value for sulfamethoxazole was lower than the PSDM-fitted value by ∼0.2. However, a predicted Y value of 0.48 using Equation (4) provided a much better prediction of the full scale compared to the average Y value for sulfamethoxazole of 0.28 from Table 3, strengthening the inclusion of the BV10%,PD-RSSCT term in Equation (4) to represent system-specific effects. Overall, the predicted Y values for MPs in Water E were very similar to the PSDM-fitted or observed values, seen by an average of 1.0 ± 0.3 (predicted value divided by observed value) in Table 4.
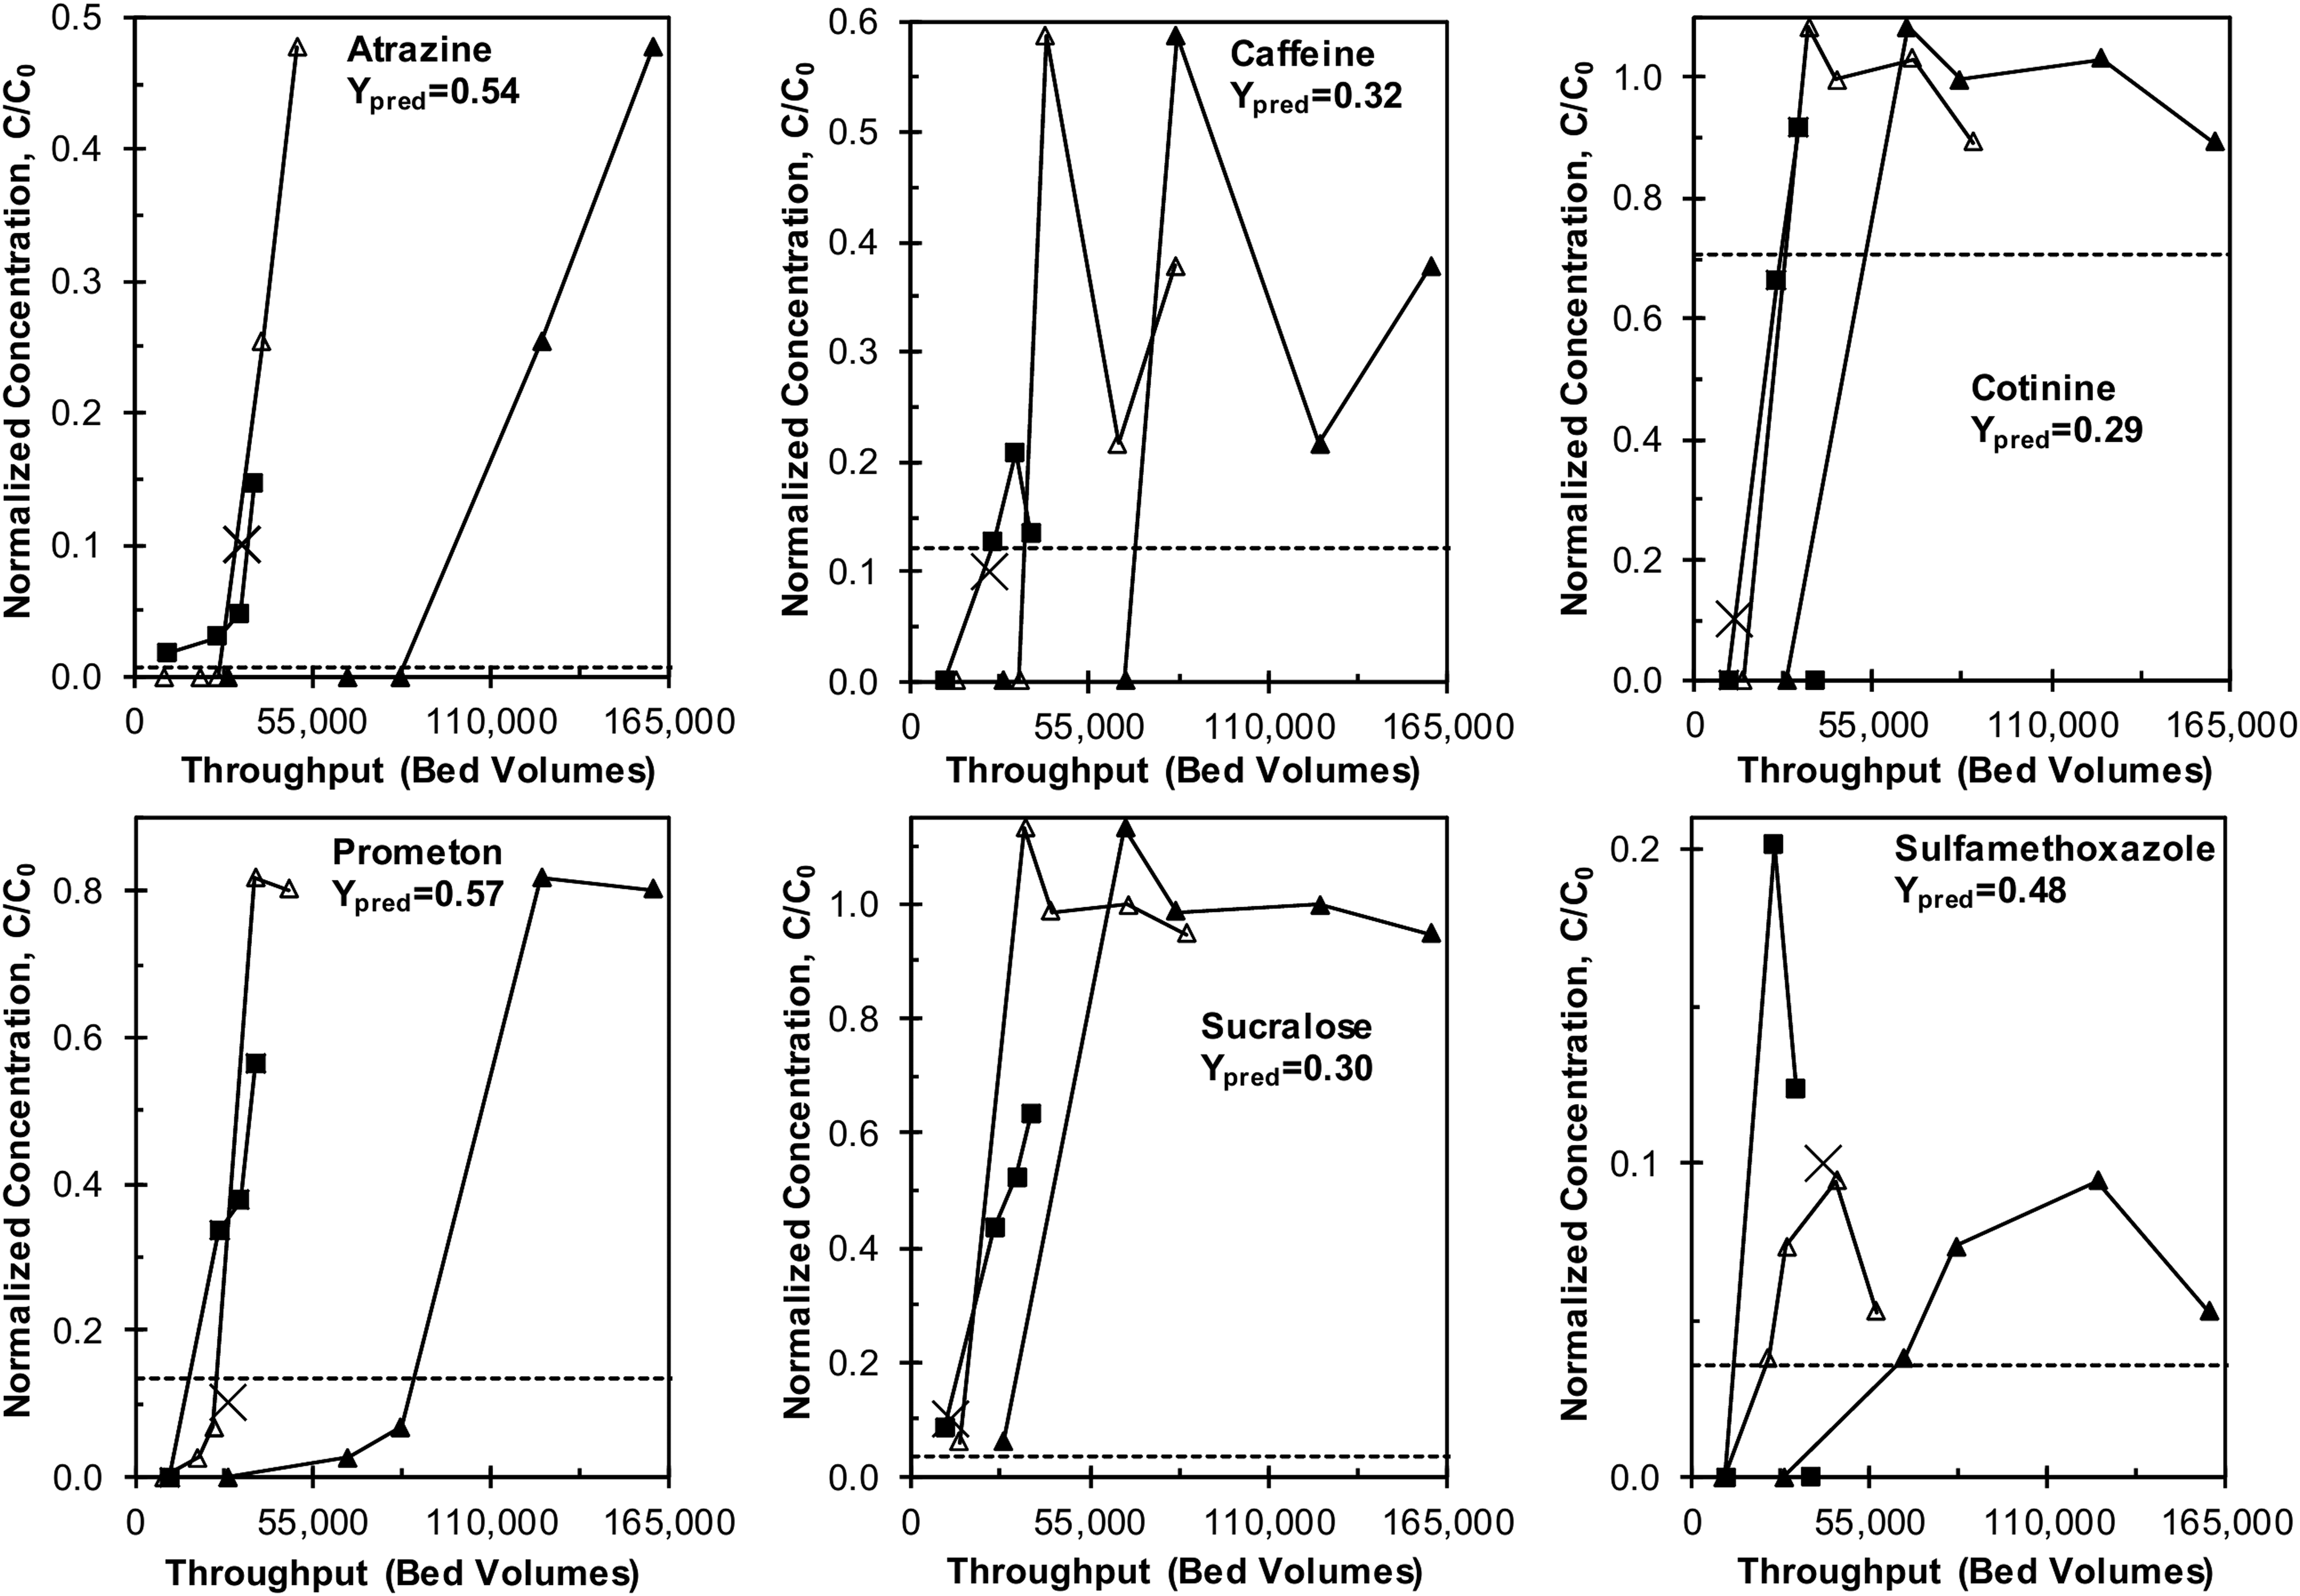
Full-scale breakthrough predictions using predicted Y values (Ypred) from Equation (4) for atrazine (C0 ∼280 ± 390 ng/L, MRL ∼2 ng/L), caffeine (C0 ∼40 ± 20 ng/L, MRL ∼5 ng/L), cotinine (C0 ∼7 ± 1 ng/L, MRL ∼5 ng/L), prometon (C0 ∼8 ± 5 ng/L, MRL ∼1 ng/L), sucralose (C0 ∼420 ± 250 ng/L, MRL ∼15 ng/L), and sulfamethoxazole (C0 ∼40 ± 10 ng/L, MRL ∼5 ng/L) in Water E (DOC0 ∼2 mg/L). The last data point for cotinine and sulfamethoxazole was below detection. Large X is BV10%,full-scale prediction from Equation (5).
Standard error = 0.09.
Standard error = 10,500 BVs.
Predicted divided by observed.
BV10%,full-scale values for Water E were predicted using Equation (5) and are also shown in Fig. 4 (as large X's). Atrazine, caffeine, cotinine, and sucralose BV10%,full-scale values were predicted within 5%, 9%, 1%, and 8%, respectively. BV10%,full-scale values for prometon and sulfamethoxazole were both overpredicted by a factor of ∼2. Regardless, the BV10%,full-scale predictions are much more representative of full-scale breakthrough than the original BV10%,PD-RSSCT values (∼84,000 BVs for prometon and ∼126,000 BVs for sulfamethoxazole). A comparison between the observed and predicted BV10%,full-scale values is shown in Table 4 and illustrates that Equation (5) overpredicted BV10%,full-scale by an average of 1.4 ± 0.6 (predicted value divided by observed value).
Conclusions
Pilot-scale tests and PD-RSSCTs were conducted in four surface waters to develop a new scale-up approach that corrects MP-specific differences in adsorption capacity, which permits the full-scale prediction of MP breakthrough curves from PD-RSSCT data. By matching PD-RSSCT breakthrough curves to pilot column breakthrough curves, Y values were obtained and used to develop a predictive relationship. The predictive relationship for Y was based on the following MP-specific parameters: C0,MP/DOC0, BV10%,PD-RSSCT, and log D. BV10%,PD-RSSCT also includes background DOM matrix effects. The relationship was verified by adequately predicting full-scale breakthrough for four of the six MPs from a utility that uses GAC to treat water from the Ohio River. Statistical analysis showed Y values depended more on the specific MP at these low concentrations than the background DOM matrix, most likely because the same conditions (DOC, GAC type, etc.) existed within each pilot column and PD-RSSCT pair. Only two PD-RSSCTs at different particle sizes are needed to obtain Y values, further expediting the process of GAC adsorption predictions. A predictive relationship was also developed for BV10%,full-scale values and was based directly on the corresponding BV10%,PD-RSSCT values. The relationship closely predicted BV10%,full-scale values for four of the six MPs from the same water utility. Both relationships greatly improve the predictive power of the PD-RSSCT and will provide engineers with more reliable data for design of full-scale GAC installations.
Footnotes
Acknowledgments
This research was partially funded by the Water Research Foundation Project 4235, a Malcolm Pirnie, Inc. fellowship, and a University of Colorado Boulder Dissertation Completion fellowship. We thank the City of Longmont, Bob Allen, George Talbott, and the treatment plant operators; OWASA, Ken Loflin, and Joseph Roccaro; BEM Association, Carole Renouf, Paul Flanagan, and Nelson Renouf; GCWW, Debbie Metz, Maria Meyer, and Jeff Vogt; Imma Ferrer and Michael Thurman at the University of Colorado Boulder Center for Environmental Mass Spectroscopy; Angela Mastropole and Bilgen Yuncu at North Carolina State University; Janet Cardenas at the University of Colorado Boulder.
Author Disclosure Statement
No competing financial interests exist. The views, analysis, recommendations, and conclusions in this report are those of the authors and do not represent official or unofficial policies or opinions of the United States Government and the United States takes no position with regard to any findings, conclusions, or recommendations made.
References
Supplementary Material
Please find the following supplemental material available below.
For Open Access articles published under a Creative Commons License, all supplemental material carries the same license as the article it is associated with.
For non-Open Access articles published, all supplemental material carries a non-exclusive license, and permission requests for re-use of supplemental material or any part of supplemental material shall be sent directly to the copyright owner as specified in the copyright notice associated with the article.