
Abstract
Abstract
Modeling is helpful for predicting nitrous oxide (N2O) accumulation and verifying the production mechanisms in wastewater treatment. A model that integrates two pathways for N2O production by ammonium-oxidizing bacteria (AOB) under extremely low dissolved oxygen (DO) conditions was proposed in this work. In this new model, a major improvement of the previously published N2O models was made to omit the intermediary compounds nitroxyl (NOH) and nitric oxide (NO) in both N2O production pathways, aiming to reduce model parameters and calibration work. The model was calibrated and validated by experimental data from four independent nitritation and nitrification studies at different DO levels. Results showed that model predictions well captured the measured N2O, ammonium, nitrite, nitrate, and DO variation trends, suggesting that this two-pathway model was able to describe the autotrophic nitritation and nitrification processes with both mixed and nitrifying cultures. N2O production by the AOB denitrification pathway occupied the dominant part in oxygen-limited nitritation processes, and incomplete hydroxylamine (NH2OH) oxidation pathway acted as the primary part in nitrification processes at high DO levels. The newly presented model would be beneficial to improve the modeling study on N2O production by autotrophic bacteria.
Introduction
I
It is generally accepted that N2O can be emitted during autotrophic nitrification and heterotrophic denitrification from wastewater treatment plants (WWTPs), aiming on biological nitrogen removal (BNR) (Foley et al., 2010). It has been known that N2O accumulation is influenced by various operation factors, primarily including the carbon/nitrogen ratio, dissolved oxygen (DO) level, nitrite concentration, electron competition, and feed pattern (Law et al., 2013; Pan et al., 2013; Yang et al., 2013). However, the mechanisms of N2O production in wastewater treatment have not been fully confirmed.
Mathematical modeling has been demonstrated to be useful for testing hypotheses and verifying mechanisms suggested by operational results in experiments and WWTPs (Henze et al., 2000). Therefore, a series of mathematical models were explored based on Activated Sludge Models (ASMs, Henze et al., 2000) to describe N2O production and consumption in wastewater treatment. The ASM for Nitrogen (ASMN) of Hiatt and Grady (2008) was first proposed for predicting N2O production in BNR processes. This model was able to predict N2O production through modeling anoxic denitrification as a four-step process, using nitrate (NO3−), nitrite (NO2−), nitric oxide (NO), and, finally, N2O as the terminal electron acceptor in every step.
Subsequently, the improved ASM for Indirect Coupling of Electrons was developed to represent the electron competition between the four denitrification steps, which was not considered in ASMN (Pan et al., 2013). Recently, the role of intracellular polymers on N2O accumulation during heterotrophic denitrification was modeled well by several models (Liu et al., 2015; Ding et al., 2016). The mechanism of N2O production by heterotrophic bacteria has been well understood by modeling results of these advanced models.
To expose the mechanism of N2O production by autotrophic bacteria, two distinct pathways, the ammonium oxidizing bacteria (AOB) denitrification pathway and the incomplete NH2OH oxidation pathway, were recently proposed in many single-pathway models (Ni et al., 2011, 2013a, b, Ni and Yuan, 2015). However, the comprehensive modeling results showed that the single-pathway models were unable to reproduce all N2O data published in literature (Ni et al., 2013a). In fact, the single-pathway models could be used under particular conditions, while the two-pathway models could be adopted in ordinary situations (Ni et al., 2013a, Ni and Yuan, 2015).
Consequently, two models were proposed to integrate these two pathways. First, Ni et al. (2014) proposed a two-pathway model by modeling N2O productions in multiple nitritation periods. The model was validated satisfactorily by introducing the intracellular electron carriers to link the oxidation and reducing reactions reasonably. Afterward, another two-pathway model (named AOB 2-p model) was proposed by Pocquet et al. (2016) recently. The AOB 2-p model provided good predictions of long-term N2O production in wastewater treatment.
However, to investigate the mechanisms of N2O production by autotrophic bacteria in the two-pathway model by Ni et al. (2014), the kinetic parameters related to peculiar variables on electron carriers were difficult to assess (Pocquet et al., 2016). Also, in the AOB 2-p model (Pocquet et al., 2016), the intermediate of NO that was rare (Chandran et al., 2011; Rodriguez-Caballero et al., 2013) and unmeasured in most BNR processes was involved; the DO consumption was described as a Haldane function rather than a Monod function. Both the adding of NO and the adopting of Haldane function would bring about more parameters and calibration efforts during model application. Further studies are still necessary to make the two-pathway model more easy to use.
Moreover, as the reported autotrophic N2O models were developed at conventional aerobic levels (0.5–5.0 mg O2/L), little attention has been paid to the N2O production under the extremely low DO (<0.2 mg O2/L) conditions. Since oxygen plays an important role in N2O production during nitrification processes (Jia et al., 2013; Guo and Vanrolleghem, 2014), both N2O productions by AOB at the low and ordinary DO levels should be modeled comprehensively.
This study aimed to explore a concise model integrating two autotrophic N2O production pathways, that is, an AOB denitrification pathway and an incomplete NH2OH oxidation pathway for nitritation and nitrification processes. To this end, experimental data from three independent nitritation and nitrification systems operated under both low and high DO conditions were used to calibrate and validate the developed model. Two production pathways were compared to determine the dominant source of N2O accumulation in the nitritation and nitrification processes at different DO levels.
Materials and Methods
Model description
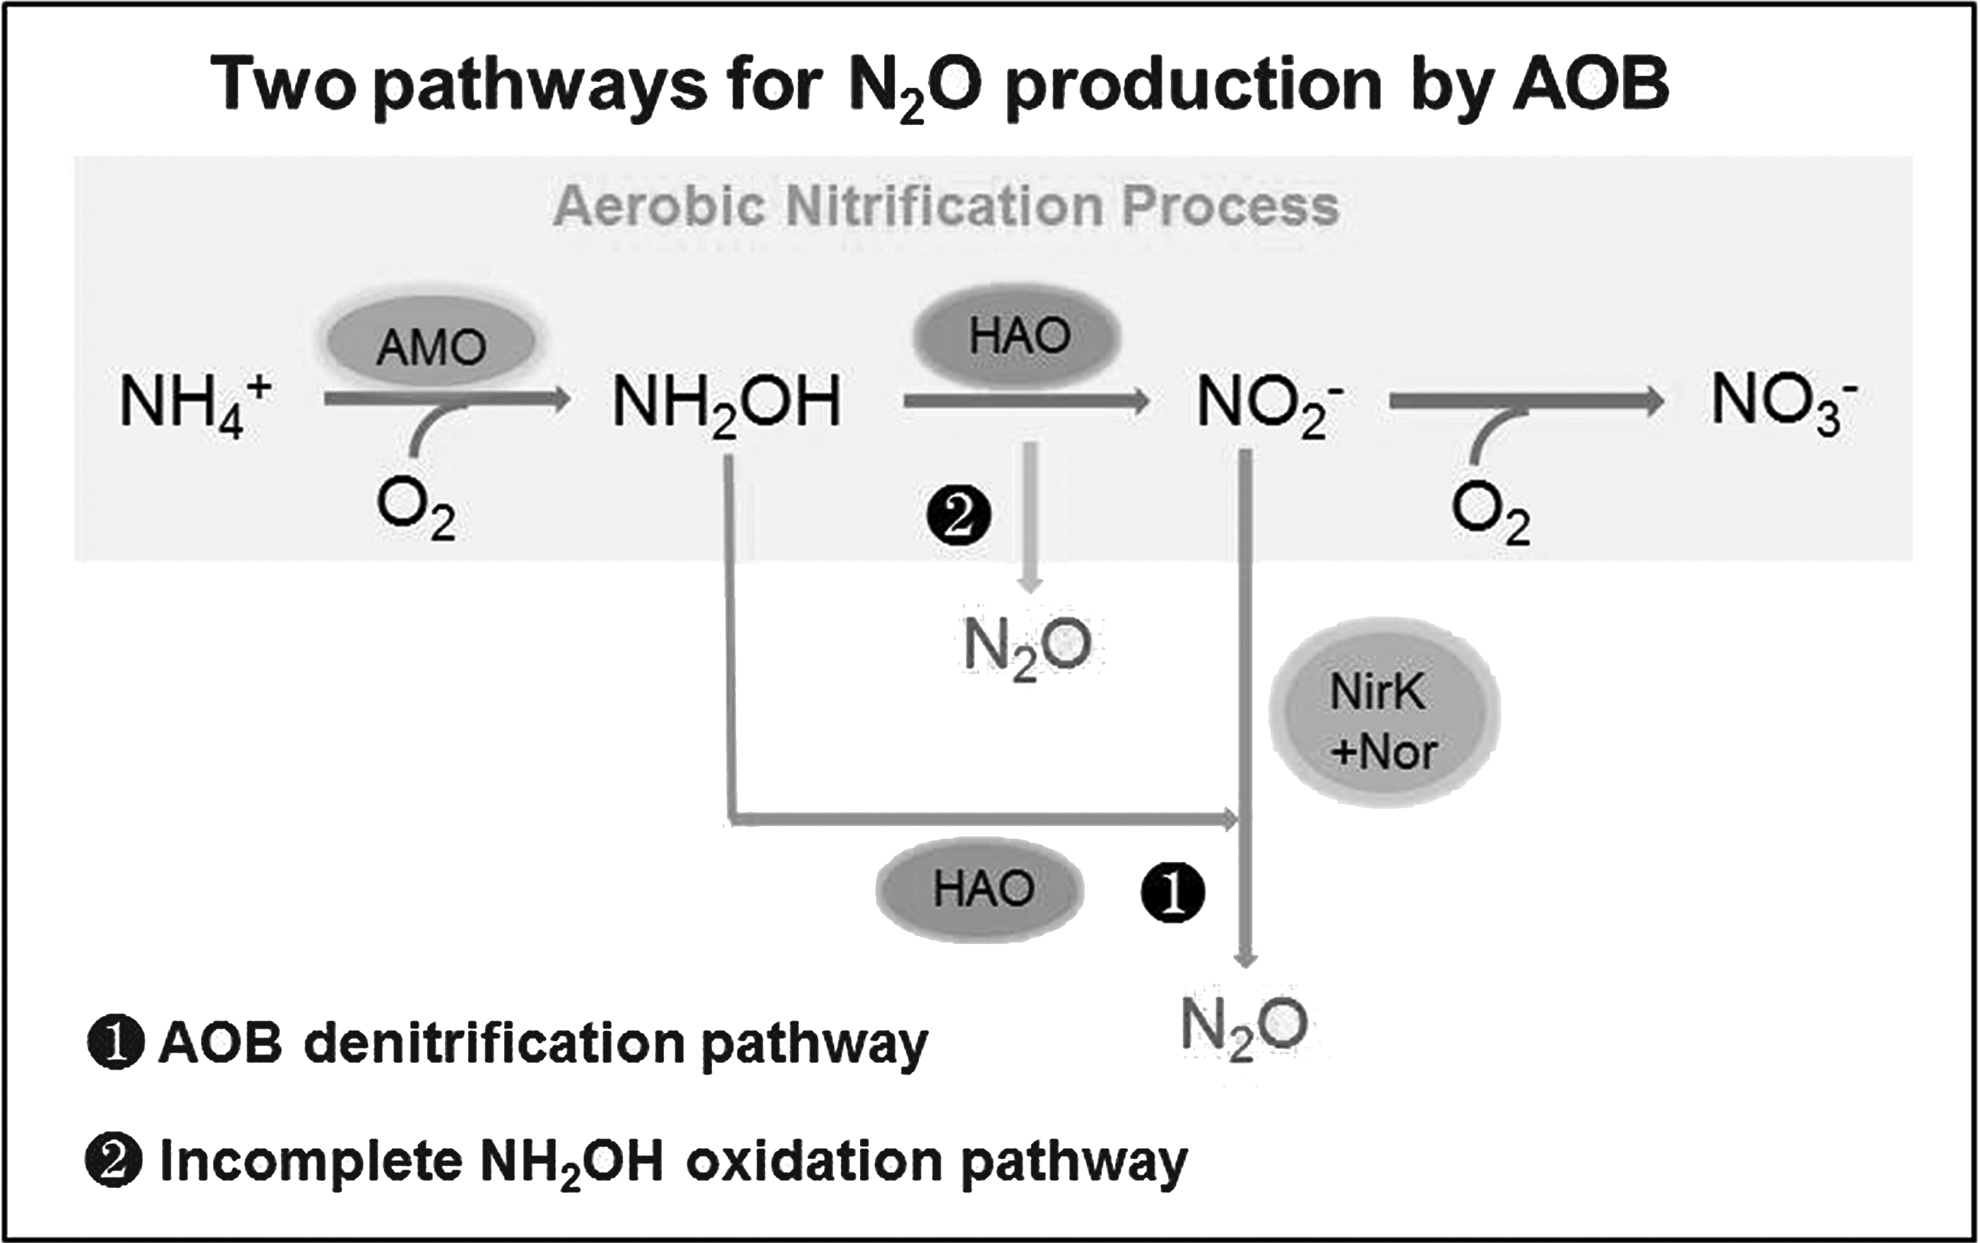
The mathematical model for N2O production was explored by covering an AOB denitrification pathway and an incomplete NH2OH oxidation pathway. The mechanisms of these reaction processes are expressed in Fig. 1. The model structure was provided in a matrix format reflecting the stoichiometric relationships based on ASM3 (Henze et al., 2000). The model components, stoichiometry, kinetics matrix, and parameter definitions are summarized in Supplementary Tables S1–S4.
Schematic representation of the reactions involved in the model.
AOB denitrification pathway and incomplete NH2OH oxidation pathway
Seven biochemical reactions were included in the model. The first four steps were stated to describe the well-known AOB denitrification pathway and the incomplete NH2OH oxidation pathway (Kim et al., 2010):
(R1) NH4+ oxidation to NH2OH, catalyzed by ammonia monooxygenase (AMO), with oxygen consumption; (R2) NH2OH oxidation to NO2−, catalyzed by hydroxylamine oxidoreductase, with O2 as the electron acceptor; (R3) NH2OH oxidation to produce NO and subsequently NO reduction to N2O, successively mediated by the NirK enzyme (a periplasmic copper-containing nitrite reductase) and the Nor enzyme (a NO reductase), with NO2− as the terminal electron acceptor, as shown in Fig. 1, ❶; (R4) Incomplete NH2OH oxidation generated a byproduct of N2O, as shown in Fig. 1, ❷;
It should be noted that, as NO accumulation is usually rare during AOB denitrification process (Chandran et al., 2011; Rodriguez-Caballero et al., 2013) and NO is seldom measured in practical operations, NO production and consumption were omitted in this model. As a result, NO2− reduction to N2O in process R3 was simplified as a one-step reaction. Moreover, N2O can be produced through both biological reduction of NO and chemical decomposition of NOH (nitroxyl) during NH2OH oxidation; it has not been fully clarified whether NO, NOH or NH2OH itself is the direct source. In fact, it cannot be excluded that N2O is derived from all of these oxynitrides (Ni et al., 2013a). Therefore, the incomplete NH2OH oxidation pathway was simplified as a one-step reaction by omitting both NO and NOH.
The omission of NO was the key difference between this new model and the published two-pathway models by Ni et al. (2014) and Pocquet et al. (2016); it would make the model structure more concise and the model easier to use. A further minor difference between the newly developed model and the published model (Pocquet et al., 2016) was the adoption of the Monod function rather than the Haldane function in describing the effect of DO on N2O production by the AOB denitrification pathway, which would reduce the number of parameters and the calibration efforts during modeling works.
Other model descriptions
Considering that AOB and nitrite oxidizing bacteria (NOB) demonstrate different growth and decay trends under different conditions (Wyffels et al., 2004), the autotrophic microorganisms were divided into two types of bacteria, AOB and NOB (Kaelina et al., 2009; Ostace et al., 2012). In this work, the growth and decay of autotrophic bacteria were split into AOB and NOB processes, both in nitrification and endogenous respiration:
(R5) aerobic growth of NOB, with NO2− oxidation to NO3−; (R6) aerobic endogenous respiration of AOB; (R7) aerobic endogenous respiration of NOB.
In addition, the calculated free ammonia (FA) concentrations were within the inhibition range according to Anthonisen et al. (1976). For this reason, an FA inhibition on NOB growth was considered by employing a conventional switching function
Experimental data
Experimental data from two operational cycles in an oxygen-limited nitritation process (Case 1 studied in this work) were first used to calibrate and validate the model structure and parameter values. Then two sets of published data from Case 2 (Kim et al., 2010) and Case 3 (Kim, 2011) investigating N2O production in nitrification with mixed culture and nitrifying culture were used to further verify the validity of the model.
Case 1
A cylindrical sequencing batch reactor (SBR) with a work volume of 7 L was used for experimental study. To obtain an enriched culture of autotrophic bacteria, the SBR was fed with ammonium-rich synthetic wastewater, in which no carbon source was provided. The SBR was operated with an anaerobic-oxic-anoxic mode, the operation cycles and synthetic wastewater compositions of typical experiments are shown in Supplementary Tables S5 and S6.
The reaction temperature was controlled at 30 ± 1°C using a water jacket. Three liters of synthetic wastewater was added in each feeding, and 100 mL of biomass was removed at the end of the anoxic stirring period. Correspondingly, the hydraulic retention time and the sludge retention time were 28 h (the operation cycles were 12 h during the cultivating period) and 30 days, respectively. The mixed liquor suspended solid (MLSS) in the reactor was 2,000 ± 28 mg/L. During the concerned aeration period, the DO level was controlled at 0.1–0.2 mg O2/L by supplying aeration with a constant air flow rate of 60 mL/min. The average pH was maintained at 7.7–8.2 in the aeration period.
After 3 months of operation, the reactor reached a steady state, with greater than 98% conversions of NH4+ to NO2− in the effluent. Experimental data from Cycle 1 with an influent ammonium concentration of 120 mg N/L and Cycle 2 with an influent ammonium concentration of 240 mg N/L were used to calibrate and validate the model structure and parameter values, respectively.
Measurement of NH4+, NO2−, NO3−, and MLSS was undertaken according to the Standard Methods (APHA, 2005). The pH value, DO, and temperature were measured by online probes. The dissolved N2O concentration in liquid was monitored online by a microsensor (Unisense, Denmark) and the N2O emission rate and total N2O production were determined by the calculating methods of published studies, as described below:
N2O emits from liquid to atmosphere through diffusion and air stripping across the water–air interface. The N2O emission rate can be described using linear equations with respect to the dissolved N2O concentration (Gao et al., 2016):
where re is the N2O emission rate [mg N/(L·min)],
It can be derived by solving Equation (1):
It can be derived by rewriting Equation (2):
where a is an item that comes from the indefinite integration of Equation (1). When t equals 0, the initial N2O concentration in water can be drawn; it can be denoted as C0, that is,
As a result, Equation (3) can be rewritten as follows (Hu et al., 2014):
The volumetric mass transfer coefficient of N2O (
Batch tests were carried out to determine the N2O emission rate in Case 1. First, equal volume of tap water instead of mixed liquor was added into the reactor; plenty of N2O gas was then injected into the reactor and dissolved fully in the tap water. Keeping the operational conditions, including aeration rates, stirring rates, and reaction temperatures, the same with the running test, the drop of N2O concentration per second was measured using the online probe and recorded by the computer. By matching the curves, which represented the N2O decreasing with time, to the exponential functions like Equation (4) (R2
Based on the measured dissolved N2O concentration and the obtained value of
where Q is the N2O emission amount in a period of
Case 2 (Kim et al., 2010): In this study, batch tests were performed to clarify the mechanism of N2O emission from the nitrification process. The parent bioreactor (30 L) was operated under an alternate nitrification/denitrification mode to treat swine wastewater. Operational results indicated that both heterotrophic denitrifier and autotrophic nitrifier existed in the mixed sludge. Nitrifying batch experiments were performed with the sludge taken from the parent bioreactor. The batch reactor was aerated with air (0.6 L/min) and the temperature was kept constant at 25°C. The pH of mixed liquor was adjusted to 8.0. One kind of substrate such as ammonium chloride (NH4Cl), NH2OH, sodium nitrate (NaNO3), or sodium nitrite (NaNO2) was added into the reactor in each batch experiment.
The detailed experimental setup and analytical methods could be found in literature (Kim et al., 2010). The batch test, in which NH4Cl (4.5 mmol N) was added to the reactor and the measured DO was approximately at 0.15–7.5 mg O2/L, was selected to evaluate the model validation.
Case 3 (Kim, 2011): To estimate the effect of ammonium concentration on N2O emission by nitrifiers, batch nitritation tests were carried out with enriched nitrifiers in oxygen-limited condition. The nitrifying sludge was incubated in a parent SBR for more than 3 months by providing ammonium (240 mg N/L) in the synthetic wastewater as the only energy source. Fluorescence in situ hybridization confirmed that AOB and NOB were the dominant microorganisms, occupying at least 30% of the total bacteria in the sludge. MLSS in the sealed batch reactor (1 L) was 3500 mg/L and DO was maintained at less than 1.0 mg/L throughout the batch experiment (data not shown). NH4+ concentration in the batch reactor was varied from 50, 100, 200, to 500 mg N/L in each batch test and bicarbonate (NaHCO3) was added to keep the pH at 7.0–7.5.
The detailed experimental setup and analytical methods were described by Kim (2011). The batch test with NH4+ concentration of 50 mg N/L in the reactor was used to further evaluate the model validation.
Model calibration and validation
Model calibration for optimizing parameter values was performed by fitting the simulation results to the experimental data. The model was first calibrated by the experimental data from Cycle 1 and then validated by the experimental data from Cycle 2 in Case 1. Then, the model was further evaluated by the experimental data from Case 2 and Case 3 in literature (Kim et al., 2010; Kim, 2011). To this end, parameter values were recalibrated for these two independent nitrifying cultures. The distinct operational regimes and culture characteristics of four modeling cases are listed in Table 1.
DO, dissolved oxygen.
In this work, the widely used program tool of MATLAB (R2012a) was selected as the computational platform.
Results and Discussion
Parameter calibration
As presented in Supplementary Table S4, 22 kinetic and stoichiometric parameters for the developed model were identified and most of them were directly implemented using values from literature; only the reduction factor for AOB denitrification (
Ni et al., 2011.
Estimated in this study.
Determined by batch tests in this study.
The difference of these parameter values among three experimental cases was likely because the different reaction temperatures, DO control methods, and operating strategies resulted in distinct microbial communities and different molecular diffusion characteristics in these experiment cultures (Liu et al., 2015; Ding et al., 2016). The average value of
Model validation
The model was initially calibrated with the experimental data from Cycle 1 of Case 1; the predicted NH4+, NO2−, NO3−, N2O, and DO profiles and the measured data are illustrated in Fig. 2.
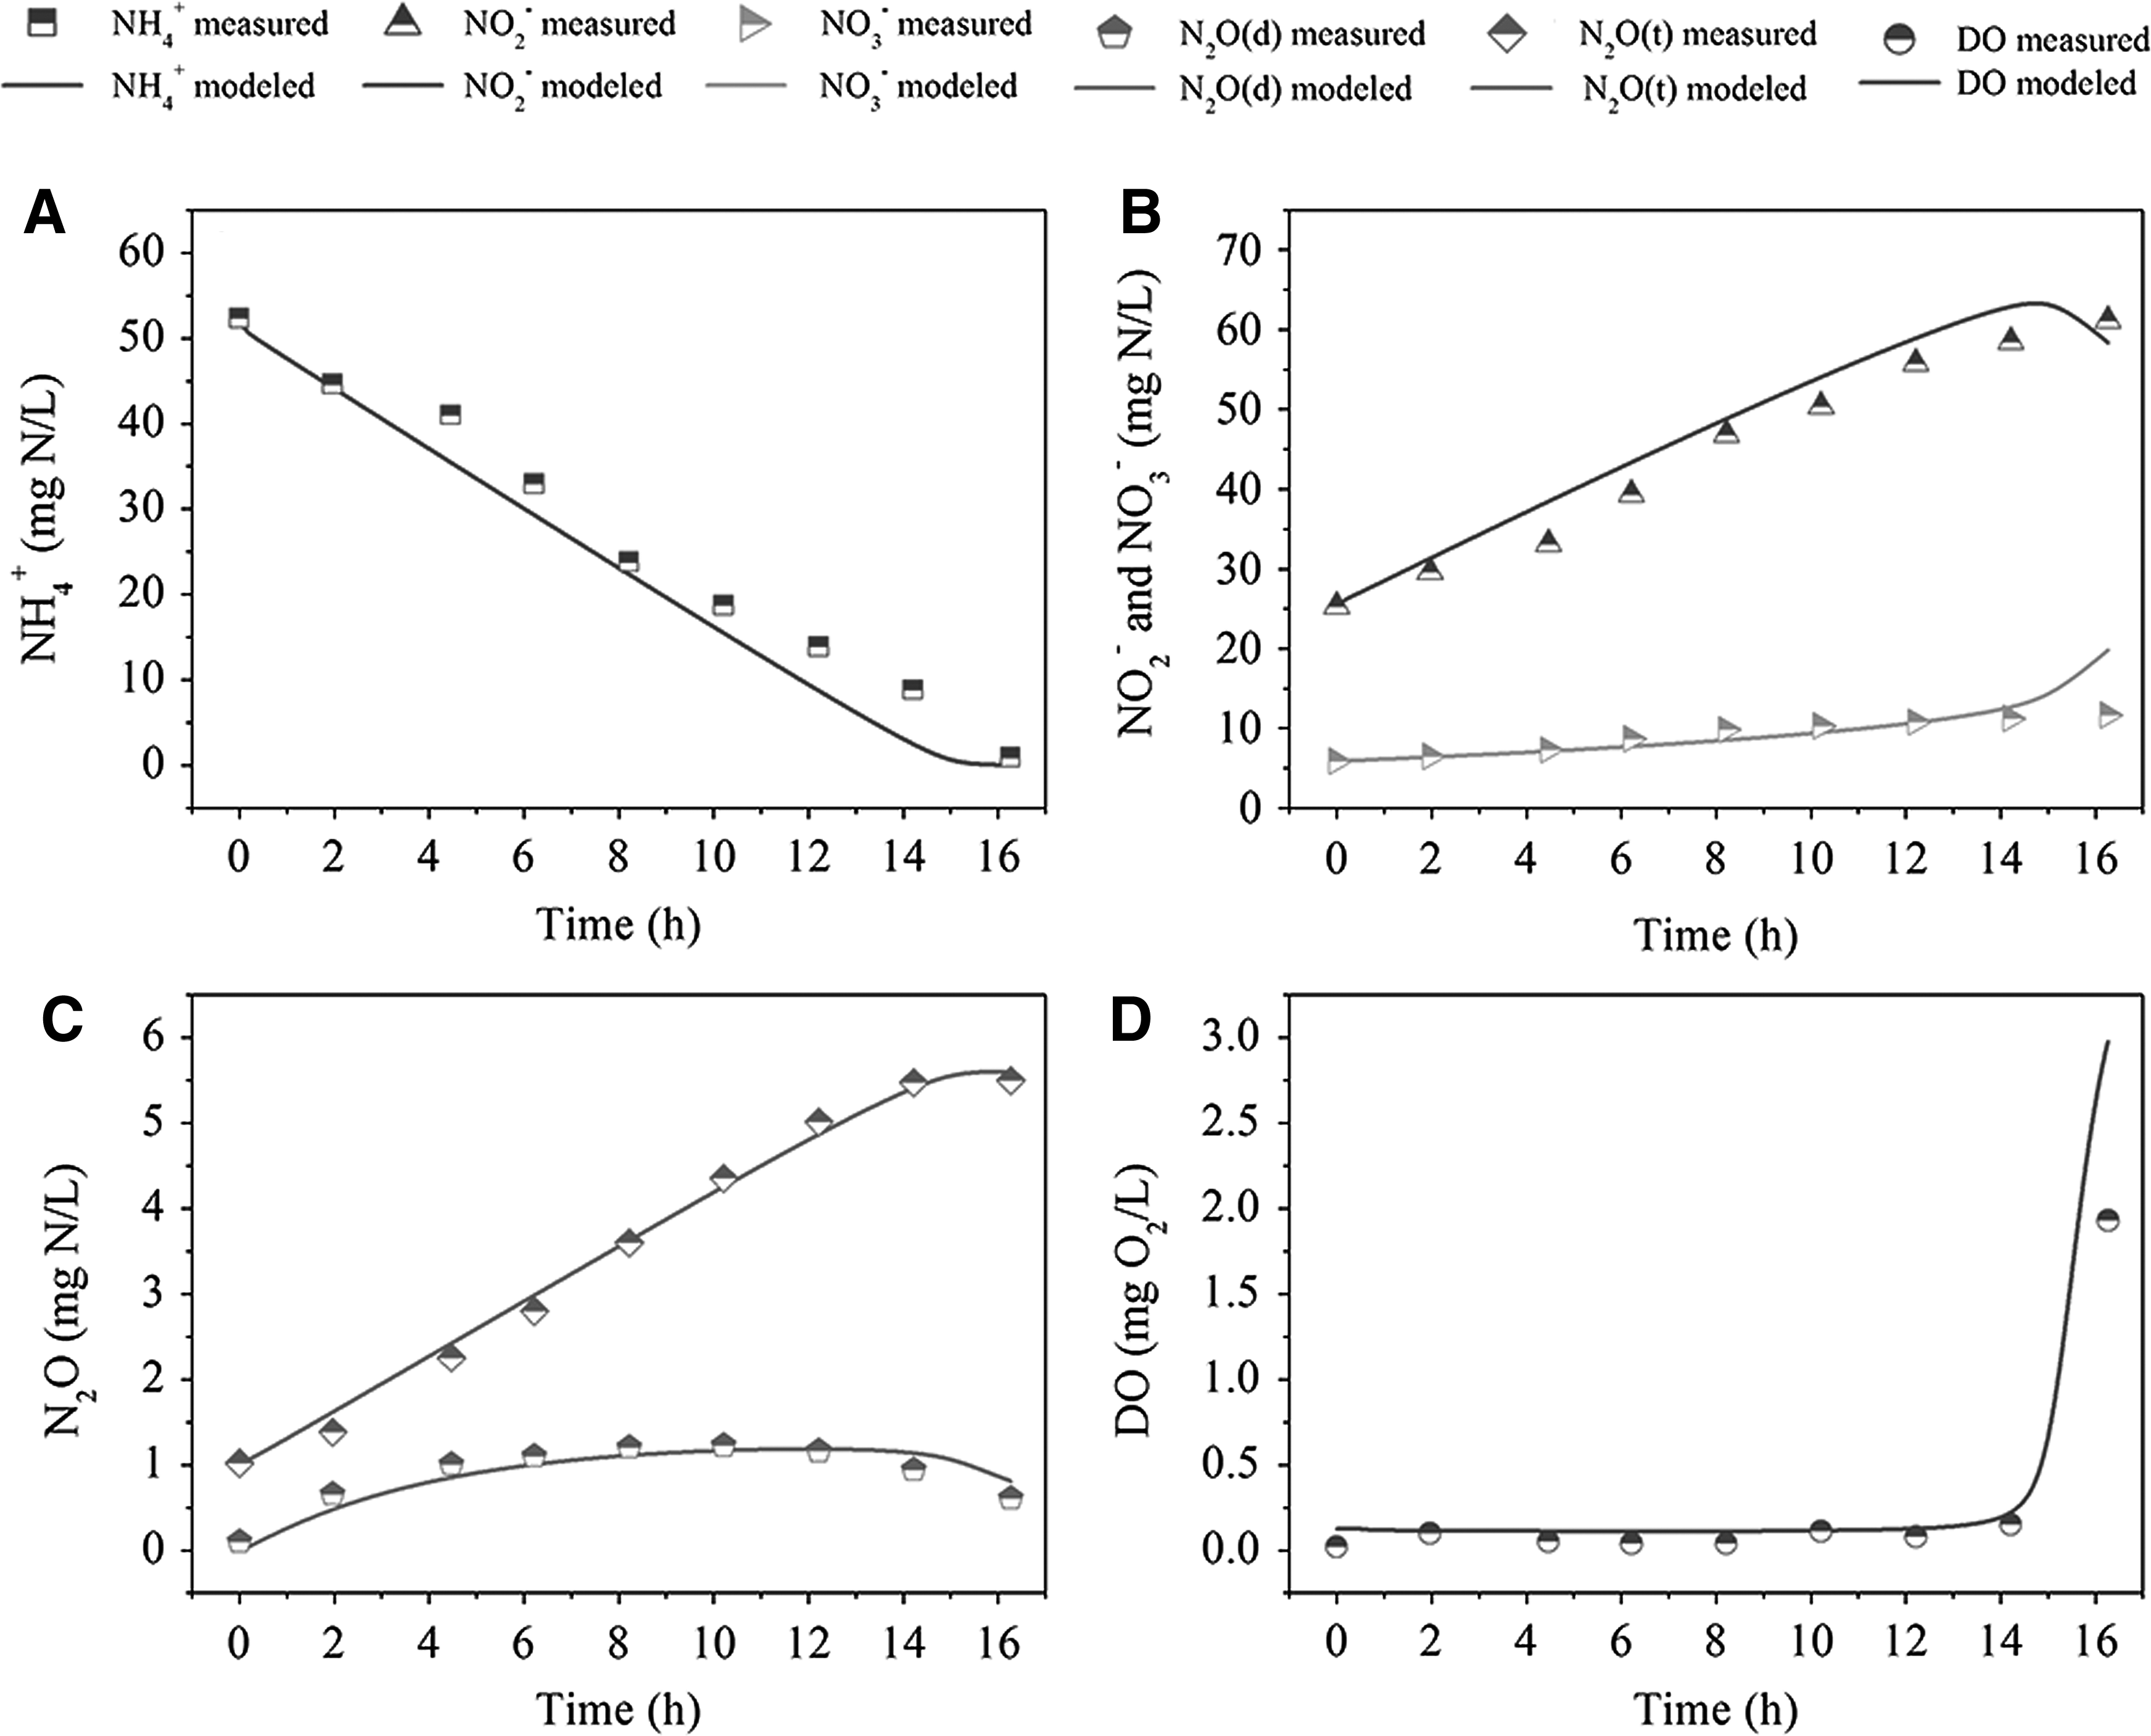
Model calibration with experimental data from Cycle 1 of Case 1, with influent NH4+ concentration of 120 mg N/L:
During the aeration period at low DO level, most of NH4+ was oxidized to NO2−, with a small amount of NO3− production. N2O production increased with the decrease of NH4+ and the increase of NO2−. For the complete oxidation of NH4+, DO concentration increased dramatically, resulting in a further oxidation of NO2− to NO3− and a stop of N2O growing at the end of the aeration. Meanwhile, the dissolved N2O in liquid even decreased due to the continuous stripping into atmosphere. The model captured these trends reasonably well. Possibly due to the time error for DO measuring (every 5 min), the simulated DO curve deviated from the last dot of the measured data. Nevertheless, the rising trend of DO inflexion was predicted well.
Next, the model was validated by the experimental data from Cycle 2 of Case 1. As Fig. 3 demonstrated, the profiles of the variables involved in Cycle 2 were similar to Cycle 1. Based on the fixed model structure and established parameter values in Supplementary Table S4, the predicted data were in agreement with the measured data of both oxynitrides and DO concentrations.

Model validation with experimental data from Cycle 2 of Case 1, with influent NH4+ concentration of 240 mg N/L:
Then, the model and its parameters were evaluated with the data of NH4+, NO2−, NO3−, N2O, and DO from Case 2 to check its validation. The differences between Case 2 and Case 1 were the distinct communities and the DO conditions: a nitrifying culture in Case 1 and a mixed culture in Case 2, and an oxygen-limited condition in Case 1 and an oxygen-uncontrolled condition in Case 2. The model predictions and the experimental results of Case 2 are shown in Fig. 4.

Model validation with experimental data from Case 2:
During the first 90 min of aeration, DO was maintained at a low level (∼0.26 mg O2/L) and NH4+ was oxidized to NO2−, with a rapid increase of N2O accumulation. After the deletion of NH4+, oxygen was surplus and the DO concentration went up to 7.61 mg O2 L−1 in the last half of the aeration period. Meanwhile, NO3− was generated in quantity with the oxidation of NO2−. Due to the inhibition of high DO on AOB denitrification, N2O emission stopped to increase.
The difference of N2O profiles between modeling and experimental results was likely due to the reduction of N2O to N2 by heterotrophic denitrification in low DO condition. Since certain heterotrophic bacteria existed in the mixed culture, which was maintained by the swine wastewater, the dead cells from microorganism decay were degraded to available carbon sources for heterotrophic denitrification (Yang et al., 2009). Consequently, N2O produced by AOB denitrification was reduced to N2 by the heterotrophic denitrification on regenerated carbon source, and it caused a delay of N2O accumulation at the commencement of aeration in the experiment study. When the nitrite accumulated high after the 45 min of aeration, the reduction of N2O by heterotrophic denitrifying bacteria was blocked, resulting in rapid N2O growth.
Therefore, more complete mechanisms of N2O production and consumption should be identified and added to the developed model in the future. Nevertheless, the model satisfactorily represented the trends of the experimentally observed dynamics in this modeling case.
Finally, the model was further validated by the experimental data from Case 3, which represented the nitritation results in a batch test, different from Case 1 with cycle running results in SBR. Due to the same low DO conditions, the NH4+, NO2−, NO3−, and N2O profiles in Case 3 were similar to those in Case 1. Except for several dots in NO2− and NO3− modeling, the prediction curves well matched the measured data in experiment (Fig. 5). The scatters that did not fall on the simulation curves seemed to be measured inaccurately in the experimental study, according to the well-predicted increasing trends of NO2− and NO3−.
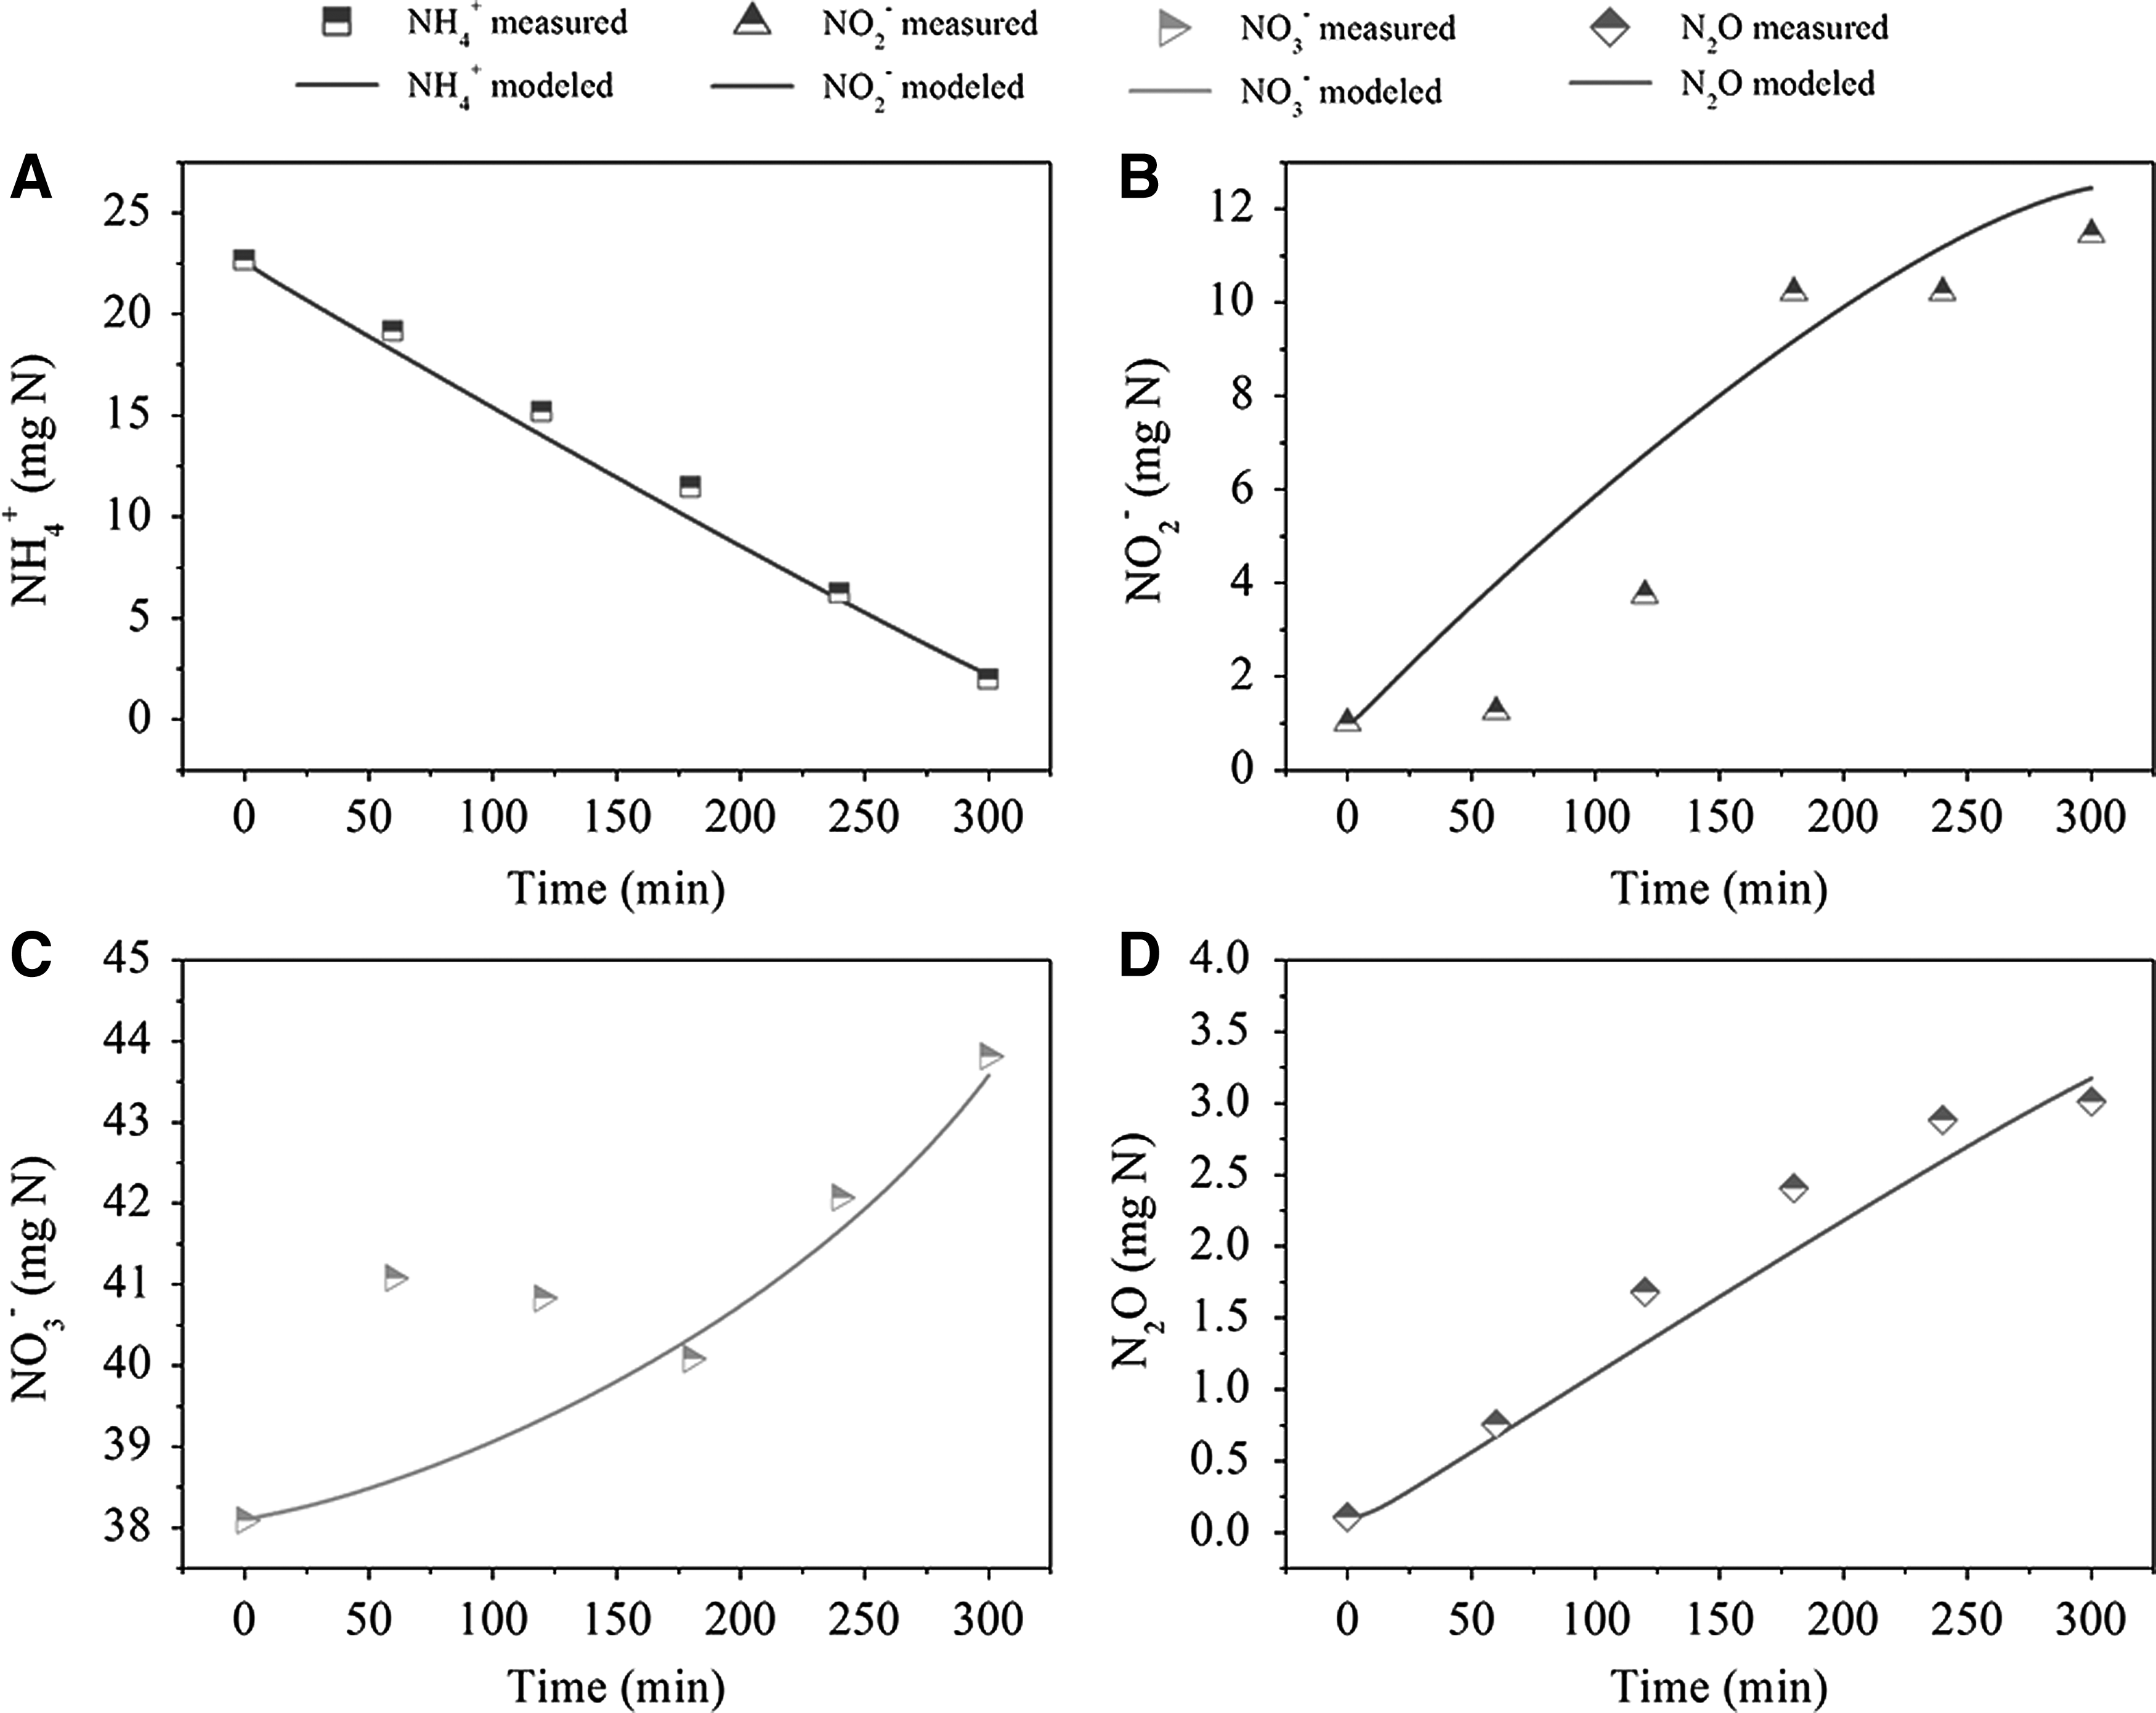
Model validation with experimental data from Case 3:
The average R2 value of the main variables in four modeling studies was 0.9734 (Table 3), indicating that the developed model are robust in their ability to predict NH4+, NO3−, NO2−, N2O, and DO profiles in various nitritation and nitrification processes.
N2O production by two pathways
The AOB denitrification pathway and the incomplete NH2OH oxidation pathway for N2O production were integrated in this developed model. The N2O production proportions by two pathways in the nitritation and nitrification processes were calculated during modeling, as shown in Fig. 6. Moreover, the N2O production variations by two pathways and the DO profiles in four modeling studies are illustrated in Fig. 7.
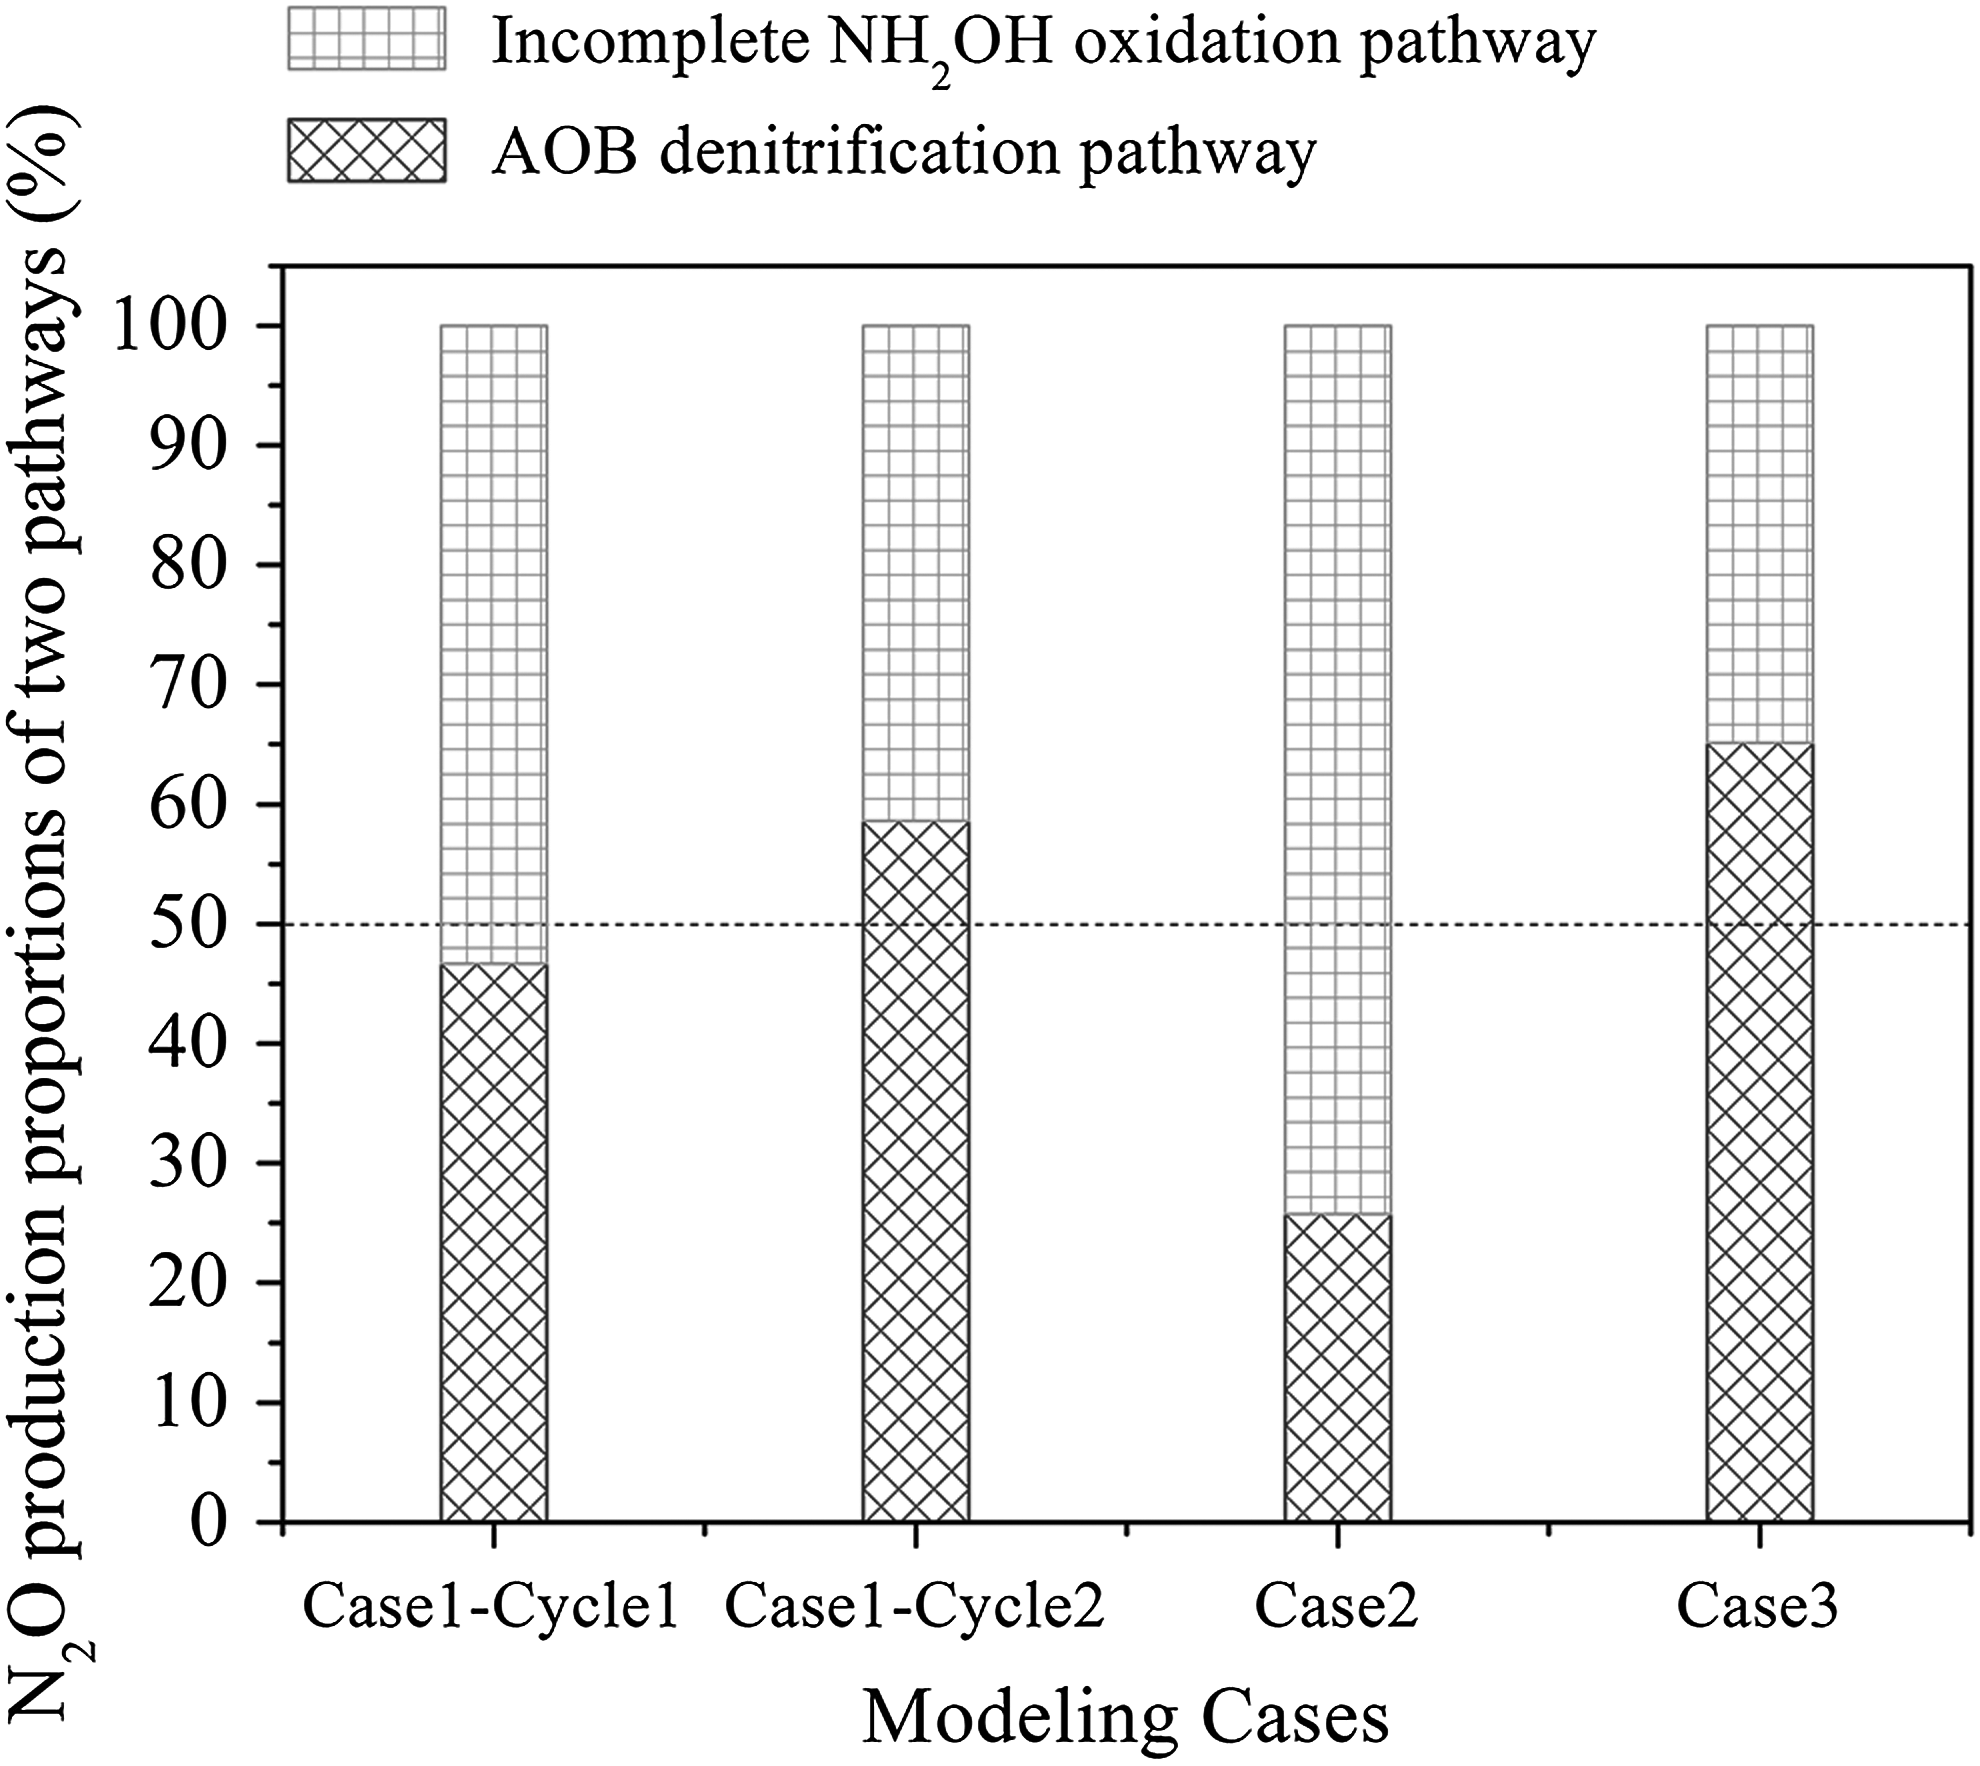
N2O production proportions by the AOB denitrification pathway and incomplete NH2OH oxidation pathway in four modeling studies.
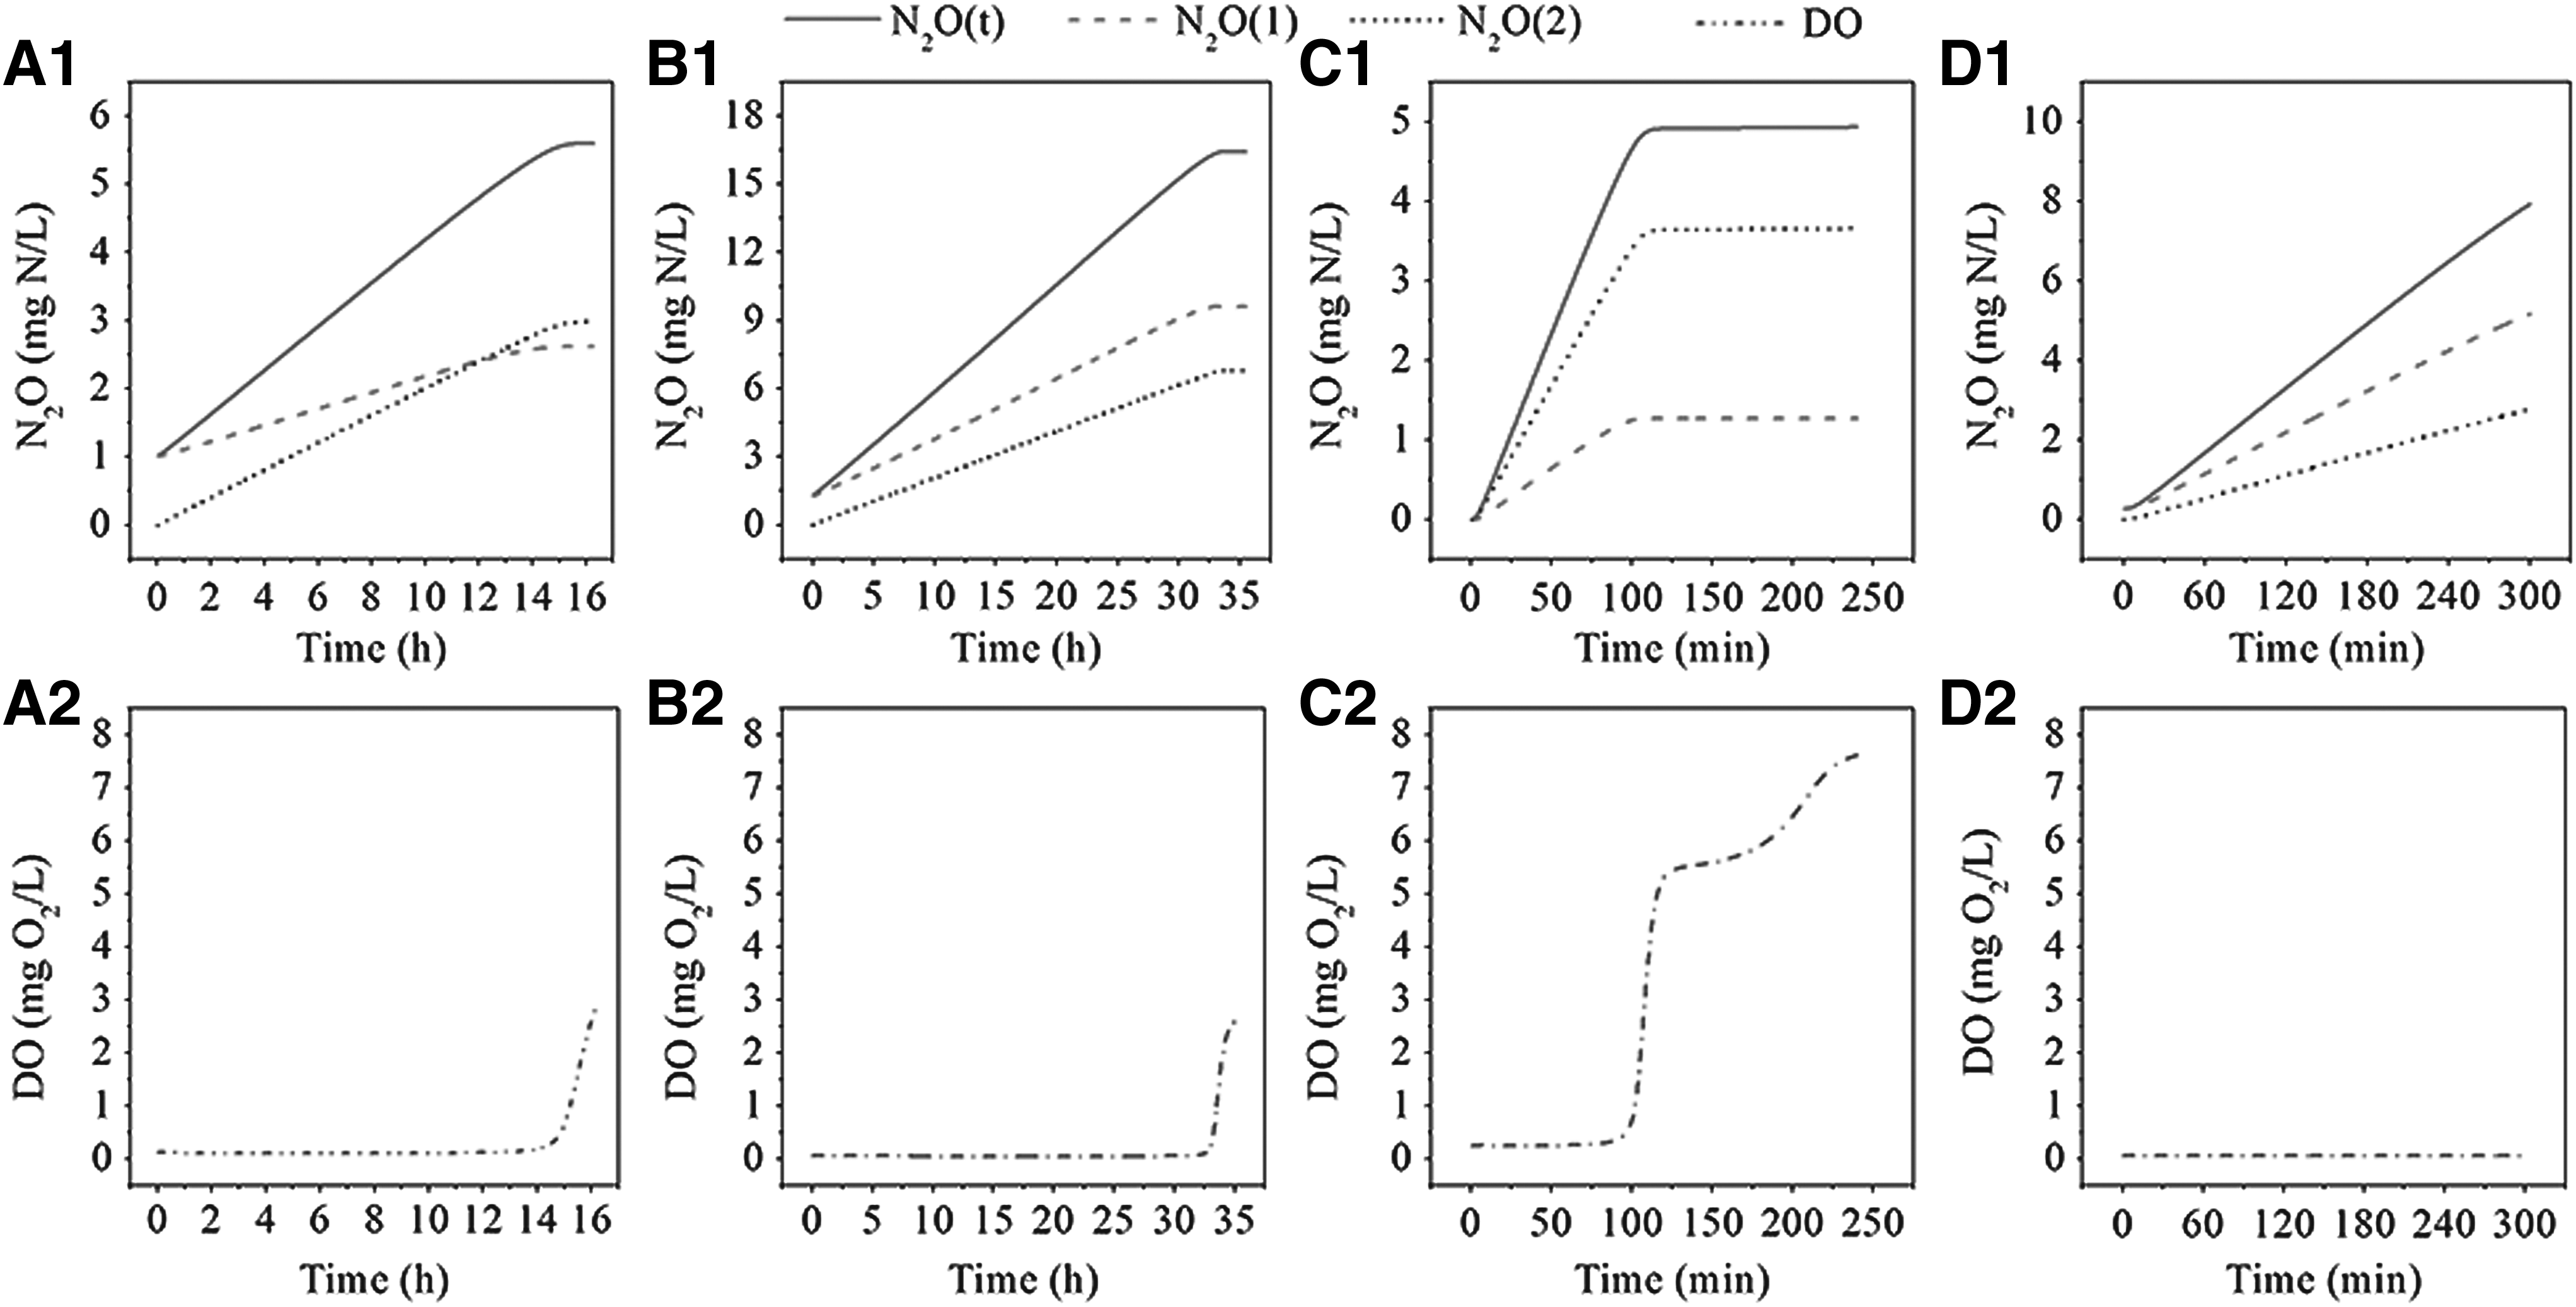
Variations of N2O production and DO concentration in four modeling studies: N2O
Modeling results indicated that the AOB denitrification pathway categorically dominated the whole nitritation process under oxygen-limited conditions in Case 1 (Cycle 2) and Case 3, while the incomplete NH2OH oxidation pathway was dominated in Case 2 with the high DO level. Combined with DO and nitrite variations in Case 1 and Case 3, it could be inferred that AOB denitrification tends to be stimulated and dominated at low DO levels with NO2− accumulation, which was consistent with previous studies (Ni et al., 2014; Peng et al., 2014, 2015). On the other side, a high level of DO lead to more N2O production by the incomplete NH2OH oxidation pathway, it was agreed with Peng et al. (2014).
Interestingly, along with the sharp increase of DO at the end of aeration, N2O production by the AOB denitrification pathway grew much slower than that by the incomplete NH2OH oxidation pathway, resulting in the basically flat proportions by two pathways in Cycle 1 of Case 1(Fig. 6 and 7A1–A2). The proportions exchange between two pathways was due to the synchronous inhibition on AOB denitrification and promotion on NH2OH oxidation by DO (Ni et al., 2014, Ni and Yuan, 2015). The difference of N2O production proportions by two pathways between Cycle 1 and Cycle 2 was probably because the higher NH4+ inhibition on NO2− oxidation to NO3− (R5 in this model) resulted in the higher nitrite accumulation, which ultimately led to more N2O production by the AOB denitrification in Cycle 2 than those in Cycle 1.
Conclusions
An integrated two-pathway model for N2O prediction in nitritation and nitrification processes was newly presented in this study. This modified model satisfactorily described the N2O accumulation dynamics in four typical experiments. The modeling results suggested that this two-pathway model was capable of modeling N2O production both under low and high DO conditions, both in mixed and nitrifying culture and both in batch and cycle running experiments. The model was expected to be used effectively and easily for understanding of N2O production in BNR processes.
Supplementary Data
The component definitions, stoichiometric matrix, process kinetic rate equations, and kinetic and stoichiometric parameters of the proposed model are shown in Supplementary Tables S1–S4. The synthetic wastewater compositions and operation cycles of Case 1 are shown in Supplementary Tables S5–S6.
Footnotes
Acknowledgment
This work was supported by the National Natural Science Foundation of China (Grant No. 51778057).
Author Disclosure Statement
No competing financial interests exist.
References
Supplementary Material
Please find the following supplemental material available below.
For Open Access articles published under a Creative Commons License, all supplemental material carries the same license as the article it is associated with.
For non-Open Access articles published, all supplemental material carries a non-exclusive license, and permission requests for re-use of supplemental material or any part of supplemental material shall be sent directly to the copyright owner as specified in the copyright notice associated with the article.