
Abstract
Abstract
To get the optimal influent flow rate distribution and volume distribution of step feeding anoxic/oxic (A/O) biological nitrogen removal process (SFAOBNR), a simultaneous distribution method was proposed in this study. The amount of chemical oxygen demand (COD) required for denitrifying unit mass of nitrate nitrogen (NO3−-N) (α, mg COD/mg NO3−-N) was taken as the key parameter for influent flow rate distribution and volume distribution of the anoxic and oxic units of SFAOBNR. A step feeding process with three stages of denitrification-nitrification was studied by activated sludge model No. 1 and a clarification-thickening model for sedimentation tank with GPS-X software. Meanwhile, by comparing with published data, the optimum value of α was determined. Results indicated that the optimum value of α was 4.0 mg COD/mg NO3−-N according to the characteristics of influent. The method proposed in this study can distribute the influent flow rate and the volumes of the anoxic and oxic units of SFAOBNR quickly and make full use of COD in influent for denitrification which not only can improve the total nitrogen removal efficiency but also reduce the energy consumption of biological wastewater treatment plants.
Introduction
T
Step feeding A/O biological nitrogen removal process (SFAOBNR) has multistage of anoxic and oxic units for denitrification and nitrification in series. Influent is introduced to anoxic units to provide carbon source for denitrifying nitrate nitrogen (NO3−-N) coming from the oxic units in the previous stages. The SFAOBNR has many advantages, including more uniform distribution of oxygen demand, superior ability to handle peak wet flows, flexible operation, reduced bioreactor volume, and more robust nitrification performance (Johnson et al., 2005; Tang et al., 2007). Besides, SFAOBNR can increase the availability of organic matter in wastewater for exogenous denitrification in anoxic periods and, subsequently, allowed nitrification to occur under a lower organic loading in oxic periods (Lin and Jing, 2001).
The performance of SFAOBNR largely depends on influent flow distribution and volume distribution of the process. Wastewater characterization, especially C/N ratio and effluent requirements, significantly impacts the influent flow distribution and volume distribution of the SFAOBNR (Görgün et al., 1996; Larrea et al., 2001). Different influent C/N ratio resulted in different influent flow distribution and volume distribution (Lee et al., 2007; Zhu et al., 2009a; Ge et al., 2010). Improper influent flow distribution of SFAOBNR would decrease the total nitrogen removal efficiency of SFAOBNR. According to published literatures, when influent C/N ratio is big, more influent flow rate should be injected into anoxic units in anterior stage of SFAOBNR; when influent C/N ratio is small, more influent flow rate should be injected into anoxic units in latter stage of SFAOBNR. However, obtaining the optimal influent flow distribution and volume distribution of SFAOBNR based on the influent C/N ratio is still a difficult task. Although experimental methods, including orthogonal experiment (Han et al., 2008), trial-and-error method (Zhu et al., 2007a), and fuzzy control method (Zhu et al., 2009b), can be used for ascertaining the optimization influent flow rate distribution and volume distribution of SFAOBNR, it is a tedious and time-wasting working (Zhu et al., 2007b). As a result, the theoretical methods (FuJii, 1996; Görgün et al., 1996; Zhu et al., 2007b; Guo et al., 2008) become a better choice for distributing the influent flow rate and the volume of the anoxic and oxic units of SFAOBNR.
In this study, a new distribution method which can simultaneously distribute the influent flow rate and the volume of SFAOBNR was proposed, and the amount of chemical oxygen demand (COD) required for denitrifying unit mass of NO3−-N (α, mg COD/mg NO3−-N) was selected as the key parameter. According to the published literatures and simulation with GPS-X, the optimum value of α was determined.
Materials and Methods
Simultaneous distribution method for influent and volume of SFAOBNR
Influent flow rate is distributed with the principle that the amount of COD injected into anoxic units of the process must satisfy the requirement of denitrifying NO3−-N coming from oxic units in the previous stages. Influent flow rate distribution coefficients of each stage of n-stage step feed A/O activated sludge process, ri, can be calculated by Equation (1):
where r1, r2, r3, … , rn represent influent flow distribution coefficients of each stage of SFAOBNR; m represents the ratio of COD concentration to total kjeldahl nitrogen (TKN) concentration in influent; and as noted before, α is the amount of COD required for denitrifying unit mass of NO3−-N, mg COD/mg NO3−-N.
The volumes of anoxic units and oxic units are distributed with equal nitrate nitrogen volume loading and equal ammonia nitrogen volume loading, respectively. Volumes of oxic units and anoxic units can be calculated by Equations (2) and (3):
where VO is the total volume of the oxic units of SFAOBNR; VA is the total volume of the anoxic units of SFAOBNR; VAi is the volume of anoxic unit of ith-stage of the process; and VOi is the volume of oxic unit of ith-stage of the process.
The derivation of Equations (1)–(3) is shown in Supplementary Data.
There are two benefits distributing the influent flow rate and the volume of SFAOBNR simultaneously with the method proposed above. First, it can ensure the COD amount required for denitrification in anoxic units, meanwhile, make the process use the maximum amount of COD in influent for denitrification, and second, it can make nitrification and denitrification process proceed in an uniform volume loading.
GPS-X software and the models used
GPS-X is a model-independent, multipurpose computer program for the modeling and simulation of municipal and industrial wastewater treatment plants developed by Hydromantis Environmental Software Solutions, Inc., Canada. A variety of modeling approaches, such as IAWQ Task Group Models (ASMs) (Henze et al., 1987, 1999), the general (bio-P) model (Dold, 1990; Barker and Dold, 1997), Mantis and comprehensive plant-wide model, are available within GPS-X to handle a specific unit operation or unit process (Hydromantis Environmental Software Solutions, Inc., 2014).
In this study, activated sludge model No. 1 (ASM1) (Henze et al., 1987) and a clarification-thickening model proposed by Takács et al. (1991) in GPS-X were used for numerical simulation.
ASM1 is primarily developed for municipal activated wastewater treatment plants to describe the removal of organic carbon substances and nitrogen. ASM1 contains 8 dynamic processes, 13 components, 5 stoichiometric parameters, and 14 kinetic parameters. Clarification-thickening model (Takács et al., 1991) is based on the solid flux concept and on a mass balance around each layer of a one-dimensional settler. The clarifier of activated sludge process is divided into several layers. By making use of a special settling velocity equation designed to simulate the settling velocity of dilute and more concentrated suspension, the model can simulate the solids profile throughout the settling column, including the underflow and effluent suspended solids. In this study, all the parameters of the clarification-thickening model used the default values of the software of GPS-X.
The values of the parameters of ASM1 and the clarification-thickening model are listed in Supplementary Table S1.
General characteristics of simulation layout of SFAOBNR
Referring to The COST Simulation Benchmark: Description and Simulator Manual (Copp, 2001), the plant layout of this study had following characteristics: (1) 3-stage step feeding biological nitrogen removal process with a secondary settler was used; (2) anoxic units were unaerated, but fully mixed; (3) oxic tanks were achieved using a fixed oxygen transfer coefficient (KLa) of 240.0 d−1; (4) DO saturation in the oxic tanks was 8.0 mg/L; (5) the biological reactor volume was equal to 6,000.0 m3. The ratio of VA to VO was set at 2:3, and VA and VO were 2,400 m3 and 3,600 m3, respectively; (6) the volume of the nonreactive secondary settler was 6,000.0 m3 (the area of 1,500.0 m2 and the depth of 4.0 m) subdivided into 10 layers; (7) the feed point to the settler was located in the middle of the sixth layer; (8) influent flow rate was 9,223.0 m3/d. The returned activated sludge flow rate was adjusted by the return ratio of 0.5, 0.75, and 1.0; (9) wasted activated sludge was pumped continuously from the secondary settler underflow according to the sludge retention time (SRT, θc) which were 10, 12, 15, and 18 days, respectively. The schematic representation of the simulation process is shown in Fig. 1.

Schematic representation of 3-stage step feeding A/O biological nitrogen removal process.
All 13 components in ASM1, which were particulate inert organic matter (Xi), slowly biodegradable substrate (XS), active heterotrophic biomass (XBH), active autotrophic biomass (XBA), particulate products arising from biomass decay (XP), soluble inert organic matter (SI), readily biodegradable organic matter (SS), dissolved oxygen (SO), nitrite and nitrate nitrogen (SNO), ammonia and ammonium nitrogen (SNH), soluble biodegradable organic nitrogen (SND), particulate degradable organic matter (XND), and alkalinity (SALK), were included in the simulation. In influent, SO, XB,A, XP, and SNO were assumed to be zero. Total suspended solids (TSS), total COD (TCOD), TKN, NO3−-N, and total nitrogen (TN) were calculated as follows (Copp, 2001):
The influent characteristics were referred to the composition of The COST Simulation Benchmark: Description and Simulator Manual (Copp, 2001). As the SI and XI cannot be utilized by microbials for denitrification, the COD content used for calculating C/N ratio did not include SI and XI. The influent characteristics when C/N ratio equaled to seven are shown in Table 1. The other C/N ratios were achieved by adjusting the concentrations of SNH. Concentrations of the other components were fixed in influent. When influent C/N ratio was 3, 4, 5, 6, 8, 10, and 12, the concentrations of SNH in influent were 104.19, 72.43, 53.37, 40.66, 24.78, and 15.25 g/m3, respectively.
Insufficient alkalinity results in incomplete nitrification in oxic units. In SFAOBNR, if incomplete nitrification occurs in oxic units, residual ammonia nitrogen (NH4+-N) will accumulate to the effluent of the process as TN. Consequently, the total nitrogen removal efficiency of SFAOBNR will decrease and the actual value of α cannot be obtained. To avoid the effect of insufficient alkalinity on the total nitrogen removal efficiency of SFAOBNR, it was assumed that the alkalinity in influent of SFAOBNR was sufficient in this study. Alkalinity was included in the simulation, however, the effect of alkalinity on the operation of SFAOBNR was ignored. Relatively high concentrations of alkalinity (350 and 700 g/m3) were given during the simulation. When influent C/N ratio was 3, the concentration of alkalinity in influent was set at 700 g/m3 in the model for achieving a complete nitrification. Under the other influent C/N ratios, the concentration of alkalinity in influent was set at 350 g/m3.
Simulation scenarios
To determine the optimal value of α for distributing the influent flow rate and the volume of the process, different values of α were selected. Theoretically, denitrifying 1 mg NO3−-N required 2.86 mg COD, however, the required COD in practical denitrification process was higher than 2.86 mg (Leslie Grady et al., 2011). So, the selected values of α should be bigger than 2.86. In this study, α was supposed to be equal to 3, 4, 5, 6, 7, 8, 9, and 10, respectively. Through simulating the nitrogen removal efficiencies of 3-stage step feeding A/O biological nitrogen removal process under different conditions, the value of α which can make the process achieve the maximum TN removal efficiency was selected as the optimum value theoretically. The simulation scenarios were shown in Table 2.
Results and Discussion
Impacts of α on TN removal efficiency of the process
Based on the simulations, the C/N ratios were divided to three classes, low, medium, and high. The low C/N ratio referred to 3, the medium C/N ratio referred to 4, 5, and 6, and the high C/N ratio referred to 7, 8, 9, and 10. Overall, the TN removal efficiency of the process was increased with the increasing of return ratio, C/N ratio, and (SRT, θc). However, the impacts of α on the TN removal efficiencies of the process were more complex. When the C/N ratio of the influent were low and high, the TN removal efficiency of the process was decreased with the increasing of α. When the C/N ratio was medium, the TN removal efficiency of the process increased firstly and then decreased with the increasing of α (Fig. 2). When the C/N ratio was low, the decreasing of the TN removal efficiency of the process was more obvious than those when C/N ratios were medium and high with the increasing of α. When the C/N ratio was 3 and the return ratio was 0.5, the TN removal efficiencies of the process were decreased from 63.7% to 56.4%, 66.3% to 57.5%, 69.1% to 58.9%, and 71.1% to 60.1% when SRTs were 10, 12, 15, and 18 days, respectively. However, the decreasing of the TN removal efficiency of the process was relieved when the return ratio increased.
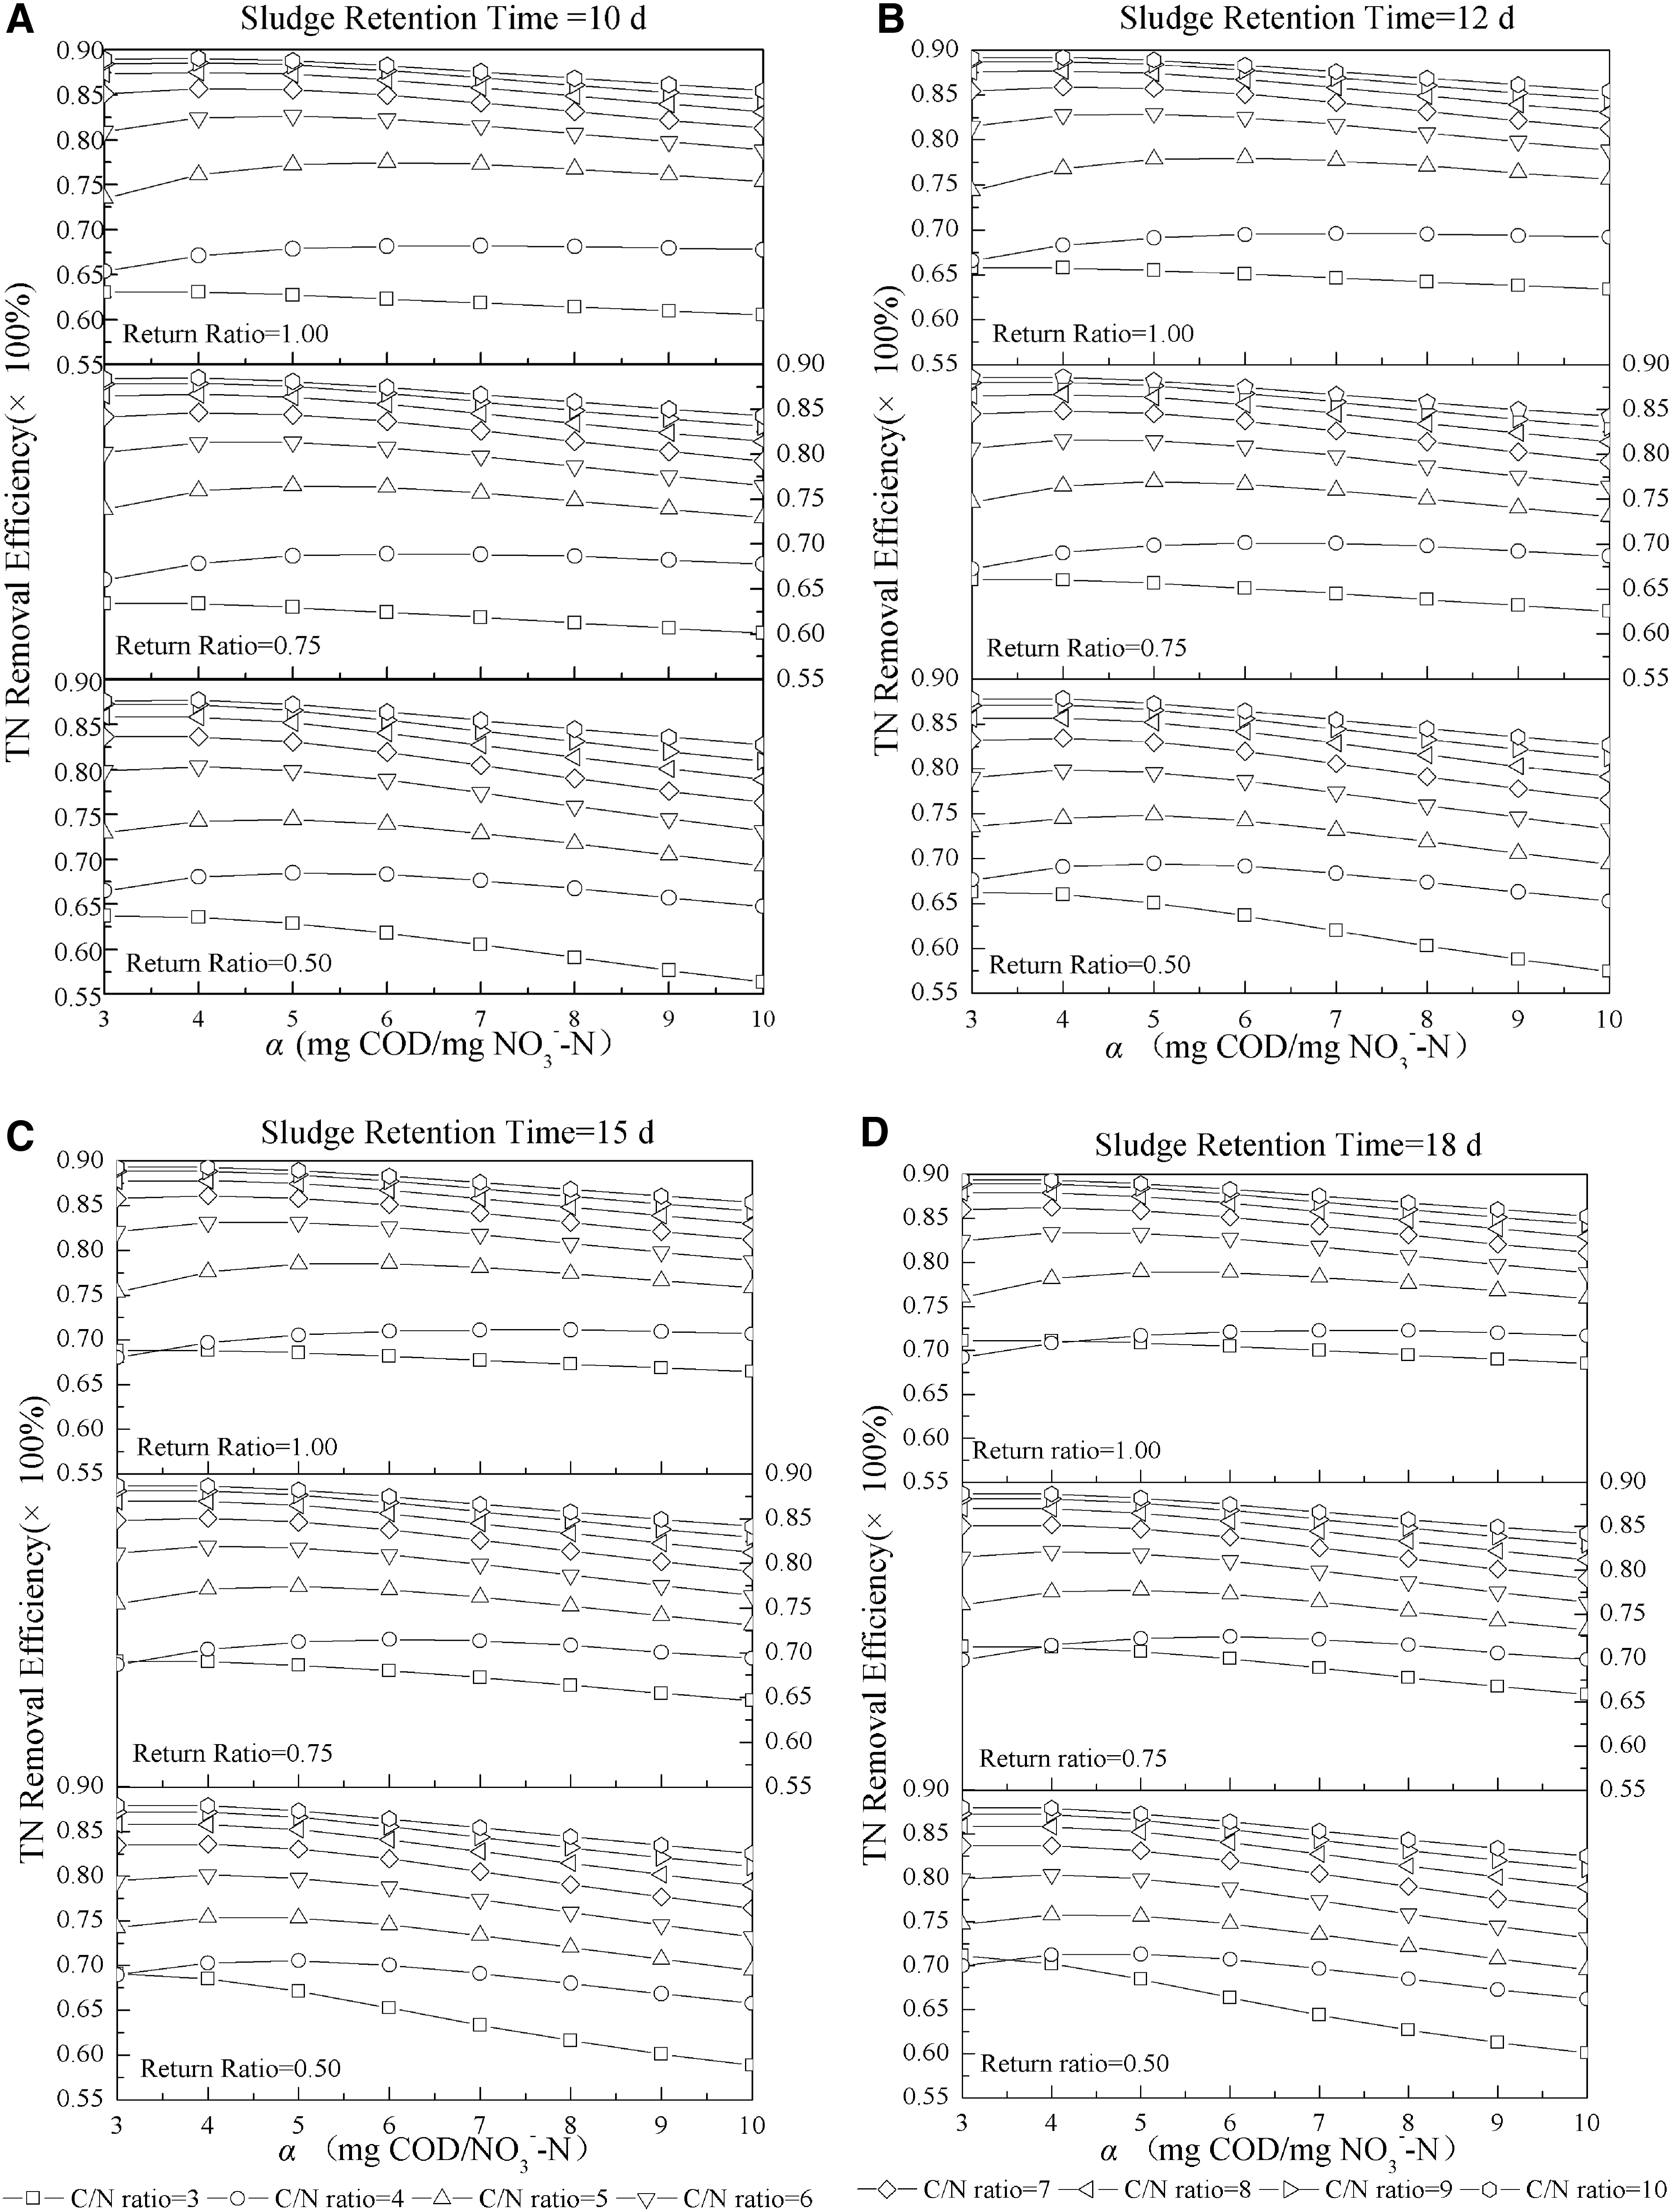
TN removal efficiencies of 3-step feeding biological nitrogen removal process under different SRT, return ratio, and α (mg COD/mg NO3−-N) values
Different α resulted in the different influent flow rate and volume distribution of the process based on Equations (1)–(3). The influent distribution coefficients, the volumes of the anoxic and oxic units of the process under different C/N ratios and α were shown in Supplementary Table S2. Under the optimum α, the influent injected into the anoxic units of the process can satisfy the COD requirement for denitrifying the nitrate coming from the oxic units in the previous stages. However, under the other α, the influent flow rates injected into the anoxic units were more or less than the requirements for denitrification process. In the first situation, excess influent flow rate was injected into the former stage of the process. Under this situation, the excess COD and TKN were injected into the former stage. After the conversion in oxic units, COD and TKN were changed to CO2, water, and NO3−-N, respectively. In the following anoxic units, the COD injected cannot satisfy the COD requirement for denitrification. As a result, NO3−-N coming from the oxic unit in the previous stage cannot be denitrified completely, and NO3−-N in the effluent of the anoxic unit accumulated to the following stage. Finally, the TN removal efficiency of the process was decreased. In the second situation, excess influent flow rates were injected into the latter stage of the process. Under this situation, the excess COD and TKN were injected into the latter stage, and TKN was changed to NO3−-N in the oxic unit of the latter stage. After denitrifying NO3−-N from the oxic unit of the previous stage, COD cannot be utilized completely and the excess COD would flow into the oxic unit, turned into CO2 and water. In other words, part of COD was wasted. Meanwhile, more energy was requested for oxidizing the excess COD. This situation was more serious when the C/N ratio of the influent was small.
The increasing of SRT and return ratio can improve the TN removal efficiency of the process. However, compared to C/N ratio and α, the improvement effects were limited. The TN removal efficiency of the step feeding biological wastewater treatment process mainly depended on the number of stages (Guo et al., 2008), C/N ratio, and influent and volume distribution (Han et al., 2008). Although the increasing of SRT and return ratio can improve the nitrogen removal by endogenous denitrification, the denitrification rate of endogenous denitrification was small and it cannot improve the TN removal of the process greatly.
Determination of optimum value of α
Optimum values of α making the process achieve the maximum TN removal efficiency in different conditions were exhibited in Table 3.
SRT, sludge retention time.
Based on the traditional model, the amount of COD required for denitrifying unit mass of nitrate nitrogen can be calculated by (Leslie Grady et al., 2011):
where YH is the heterotrophic biomass yield, mg cell COD/mg COD; bH is the decay coefficient of heterotrophs, d−1; and fD is the fraction of biomass into the residuals. Typical values of YH, bH, and fD were 0.67 mg cell COD/mg COD (Henze et al., 1987), 0.2 d−1 (Dold and Marais, 1986), and 0.08 (Leslie Grady et al., 2011), respectively. The maximum and minimum values of α were 8.67 and 3.02 mg COD/mg NO3−-N. The value of α was decreased with the increasing of θc as the extra electrons coming from the decay of microbials. According to Equation (8), when θc increased from 10 to 18 days, the value of α decreased from 3.86 mg COD/mg NO3−-N to 3.52 mg COD/mg NO3−-N. θc did not have significant effects on α in the range of 10–18 days. However, according to the simulation, values of α were in the range of 3.0–8.0 mg COD/mg NO3−-N. When the C/N ratios in the influent were low and high, the values of α were in the range of 3.0–4.0 mg COD/mg NO3−-N, and when the C/N ratio in the influent was medium, the values of α were in the range of 5.0–7.0 mg COD/mg NO3−-N. When C/N ratio in influent was lower than four, the carbon source was not sufficient for traditional denitrification process (Zhao et al., 2016), which meant the value of α calculated by Equation (8) might be underestimated as some of the biodegradable organic matter were slowly biodegradable and cannot be metabolized rapidly enough to be available in the anoxic units for denitrification (Leslie Grady et al., 2011).
To ascertain the acceptable value of α, the distribution results of influent calculated with the method proposed in this study when the values of α were 4, 5, 6, and 7 mg COD/mg NO3−-N, respectively, were verified by the data published by Zhu et al. (Zhu et al., 2007a). Four-stage step feeding A/O biological nitrogen removal process was utilized by Zhu et al. to treat wastewater with different influent C/N ratios. The influent flow distribution of 4-stage step feeding A/O biological nitrogen removal process of Zhu et al. were shown in Supplementary Table S3, and the influent flow distribution results calculated by the method proposed in this study were shown in Supplementary Table S4. As the ratio of anoxic reactor volume and oxic was maintained at 1:3.5 in the study carried out by Zhu et al., the volume distribution were not compared. By calculating the value of root mean square error (RMSE) between the influent distribution ratios with the method proposed in this study and the experiment results(Zhu et al., 2007a), the optimum value of α can be determined. RMSE was calculated by Equation (1). The values of RMSE between the calculation and the experiments were shown in Table 4.
RMSE, root mean square error.
where n represented the number of the data. As the 4-stage step feeding A/O biological nutrient removal process was utilized, n was 4; and Ci and Ei were the influent distribution ratios of the four stage of the process calculated by the method proposed in this study and the experiment results (Zhu et al., 2007a).
When α was 4.0 mg COD/mg NO3−-N, the value of RMSE was the minimum. The optimum value of α can be determined as 4.0 mg COD/mg NO3−-N. The influent distribution ratios calculated by the method proposed in this study under different influent C/N ratios approximated to the experiment results (Zhu et al., 2007a). The nitrogen removal efficiency of wastewater treatment process was impacted by the composition of COD in influent, temperature, the type of the process, and so on. In different wastewater treatment processes, relatively high nitrogen removal efficiencies can be obtained when influent C/N ratios were in the range of 4.0–7.0 mg COD/mg NO3−-N (Suh et al., 2006; Li et al., 2008; Zhao et al., 2008; Ma et al., 2010). When the C/N ratio in influent was low, the carbon source in influent was not sufficient for denitrification, and the small α resulted in a more uniform distribution of influent which could make full use of COD for denitrification. Besides, the more uniform distribution of influent also can prolong the effective retention time of the influent of each stage, and nitrate can also be removed by endogenous denitrification (Wang et al., 2015). When the C/N ratio in influent was high, the carbon source in influent was excess for denitrification, and a large number of influent was distributed to the first stage of the process while a small α was adopted. Although the large number of the influent injected into the first stage of the process would shorten the effective retention time of the influent in each stage, as the relatively high concentration of COD, the biochemical reaction would proceed with a relatively high rate, and a high TN removal efficiency of the process can be promised. When the C/N ratio in the influent was medium, a relatively big α adopted might be a compromise settlement. In general, the influent of each stage and the volume of reaction unit of step feeding biological nitrogen removal process can be distributed quickly and conveniently by taking the amount of COD required for denitrifying unit mass of nitrate nitrogen as the key parameter.
Conclusions
An effective method for influent flow rate distribution and volume distribution for SFAOBNR was proposed. The amount of COD required for denitrifying unit mass of nitrate nitrogen (NO3−-N) (α, mg COD/mg NO3−-N) taken as the key parameter can be distributed by influent flow rate and volume of each reaction unit of SFAOBNR conveniently, and the optimum value of α was 4.0 mg COD/mg NO3−-N. The distribution method proposed can make full use of COD in influent for denitrification under a uniform volume loading rate condition which not only can improve the total nitrogen removal efficiency but also reduce the energy consumption.
Footnotes
Acknowledgments
This work was supported by the Shaanxi Province Science & Technology Development Program (Grant No.: 2014K15-03-02); National Training Programs of Innovation and Entrepreneurship for Undergraduates (Grant No.: 201610710081); and the Fundamental Research Funds for the Central Universities (Grant No.: 310828171004; Grant No.: 310829161004).
Author Disclosure Statement
No competing financial interests exist.
References
Supplementary Material
Please find the following supplemental material available below.
For Open Access articles published under a Creative Commons License, all supplemental material carries the same license as the article it is associated with.
For non-Open Access articles published, all supplemental material carries a non-exclusive license, and permission requests for re-use of supplemental material or any part of supplemental material shall be sent directly to the copyright owner as specified in the copyright notice associated with the article.