
Abstract
Abstract
Performance of microbial fuel cells (MFCs) was monitored during the influent nutrient change from lactate to glucose/acetate/propionate and then to lactate. Meanwhile, anodic microbial communities were characterized by culture-independent molecular biotechnologies. Results showed MFC performance recovered rapidly when the lactate was replaced by one of its metabolic intermediates acetate, while it needed a longer time to recover if lactate substrate was converted to glucose/propionate or acetate to lactate. Secondary lactate feed enhanced the enrichment of bacterial populations dominating in first lactate feed. Electricity-producing bacteria, Geobacter spp., and beneficial helpers, Anaeromusa spp. and Pseudomonas spp., revived from a low abundance as lactate secondary supply, but microbial communities were hard to achieve former profiles in structure and composition. Hence, microbial community profiles tended to recover when outside environmental condition were restored. Different substrates selected unique functional microbial populations.
Introduction
M
Microbial communities developed in MFCs anodic chamber show great diversity, not only limited to commonly electrochemically active bacteria such as Shewanella and Geobacter species, but covered substantial members from phyla Proteobacteria, Firmicutes and Acidobacteria to Actinobacteria (Logan, 2009). However, most of them are sensitive to the changes of environmental factors. Even minor fluctuation of culturing condition frequently leads to imbalance of microbial communities in structure, composition, and abundance (Zhou et al., 2013). This will further negatively affect the performance of MFCs. From the practical point of view, the wastewater ingredient is fluctuant due to the uncertainty of weather and human activities. Hence, the effect of change in wastewater ingredient on performance of MFCs and functional microorganisms should be well considered.
Several studies have shown that the sudden change of influent nutrients affected the microbial community profiles and led to different performance of MFCs (Chae et al., 2009; Zhang et al., 2011). Chae et al. (2009) found that glucose-fed MFC demonstrated high diversity of microbial community and it rapidly generated current when glucose was replaced by other simpler substrates. Zhang et al. (2011) also obtained the similar results. They found that the anodic microbes in MFC enriched by acetate needed a longer adaptation time to metabolize glucose. To the contrary, the MFC started up by glucose showed rapid and high power generation when glucose was replaced by its metabolic intermediates acetate or butyrate.
However, from the microbiological point of view, it should be the difference of anodic functional microorganisms that led to different response of MFC to substrate changes. Zhang et al. (2011) found that Clostridium and Bacillus species were specific in glucose enrichment, while Geobacter-like species were specifically enriched by acetate. Thus, the profile of microbial community enriched by influent is an important index we should consider because of microorganisms' critical part in the MFCs (Logan, 2009). Moreover, response of microbial community to influent changes will guide us to operate the MFCs in the wastewater treatment plant.
Denaturing gradient gel electrophoresis (DGGE) and high-throughput sequencing (HTS) are recently developed culture-independent microbial molecular ecological techniques. These techniques have played the important roles in revealing the structure and composition of microbial communities and further improving the contaminants removal efficiency (Muyzer, 1999; Metzker, 2010; Rubaba et al., 2013). In the present study, the experiments were designed to investigate the effect of substrate change on the performance of MFCs. Meanwhile, the composition and structure of microbial community on MFC anodes were explored using polymerase chain reaction (PCR)- DGGE and HTS techniques. The results would provide new strategy for us to control the bioreactor during the practice of the wastewater treatment.
Materials and Methods
MFC configuration
Single-chamber MFCs with volume of 28 mL were constructed to treat artificial wastewater and generate electricity simultaneously. MFC anode was made of carbon brush, and the air cathode was made of carbon cloth (Ruibang Carbon Material Co., Shanghai, China). The cathode was pretreated as method described by Cheng et al. (2006). The external resistance connecting the anode with cathode was 1 kΩ.
MFC startup and operation
Experimental design comprised of three phases. Phase 1, MFC started up feeding 500 mg/L lactate (as chemical oxygen demand [COD]). Three identical MFCs were inoculated pretreated sludge as previously described (Gao et al., 2014). The anolyte contained 500 mg/L lactate, phosphate-buffered saline (PBS) (137 mM NaCl, 2.7 mM KCl, 10 mM Na2HPO4•2H2O, 2 mM KH2PO4, pH 7.4), trace mineral, and vitamin solutions. The influent conductivity and pH were finally maintained at about 8.0 mS/cm and 8.5, respectively. The MFCs were operated in batch mode at room temperature (20°C–25°C). The anolyte was replaced regularly with new solution once the voltage declined below 10 mV. Phase 2, after MFC startup, to reveal the effect of substrate change on the microbial communities in anodic chamber; lactate in anolyte of three bioreactors was replaced by equivalent COD of glucose (MFC Glu), acetate (MFC Ace), and propionate (MFC Pro), respectively. Phase 3, substrates in anolyte were secondly replaced by lactate as phase 1.
Electrochemical measurements
Voltage (U) across the external resistance (R) of the MFC was recorded using a data acquisition system (PISO-813, Hongge Taiwan). Current (I) was calculated as I = U/R, and cell power output (P) was calculated from P = U × I. The power density (PV) was calculated using the equation: PV(W/m3) = P/V, where V is the volume of the anodic chamber. The polarization curves were obtained by changing external circuit resistances from 1,000 to 20 Ω during the steady state of MFC. The voltage was recorded at a time interval of 10 min. Residual COD in MFC was determined by colorimetric method according to standard methods (Clesceri et al., 1998).
Microbial community analysis
At the end of each phase, anodic microbial biofilm was obtained as the method described by Cui et al. (2016). In brief, the fibers covered with biofilm were cut randomly from at least three positions of anodic carbon brush and crushed using sterile scissors. The particles were put into a 1.5 mL sterile centrifuge tube with 1 mL sterile deionized water and then mixed hardly by a shaker followed by centrifuging at 12,000 g for 5 min to remove the supernatant. Afterward, total DNA was extracted from the pellets by the Soil DNA Extraction Kit (Mobio, CA) according to manufacturer's instructions. When conducting the DGGE analysis, bacterial 16S rRNA gene universal primers BA101F (5′- TGGCGGACGGGTGAGTAA -3′) and BA534R (5′- GC clamp-ATTACCGCGGCTGCTGG-3′) were used to amplify the V3 and V4 region of 16S rRNA gene. PCR amplifying, DGGE profiling, and 16S rRNA gene sequencing for community analysis were conducted as previously described (Gao et al., 2014). SPSS software (SPSS, Inc., Chicago IL) was used to calculate the similarity of lanes in DGGE profiles.
Partial 16S rRNA gene based HTS was used to determine the diversity and composition of the bacterial communities in each sample. PCR amplifications were conducted in triplicate with the primer set 515F (5′-GTGCCAGCAGCCGCGGTAA-3′) and 806R (5′- GGACTACCAGGGTATCTAAT-3′) targeting the V4 region of the bacterial 16S rRNA gene. The reverse primer contained a 6-bp error-correcting barcode unique to each sample. DNA was amplified following the protocol described previously (Freguia et al., 2010). Sequencing was subsequently determined on an Illumina MiSeq platform by Novogene (Beijing, China).
Pairs of reads from the original DNA fragments were merged using FLASH (Liu and Logan, 2004). Sequencing reads were assigned to each sample according to the unique barcode of the sample. QIIME software package (http://qiime.org/) and UPARSE pipeline (http://drive5.com/uparse/) were used to analyze the reads and pick operational taxonomic units (OTUs). Sequence similarity with 97% or higher was considered as same OTU. Afterward, the OTUs were clustered into different bacterial phyla and genera using the RDP classifier (http://rdp.cme.msu.edu/). QIIME software package was applied to perform the principal component analysis (PCA) based on all sequences in each sample.
Accession number of DNA sequence
Sequences obtained in DGGE are deposited in GenBank under the accession numbers KP274081- KP274099. 16S rRNA gene sequencing reads by HTS are deposited in MG-RAST with the IDs 4614364.3-4614372.3.
Results and Discussion
Effect of substrate conversion on performance of MFCs
The tendency of voltage in MFCs Glu, Ace, and Pro is shown in Fig. 1. After 300 h operation, they started up successfully and approached almost the same highest voltages and maximum power densities. Their highest voltages ranged from 210 to 230 mV and maximum power densities were 1.85–2.33 W/m3. We examined the COD removal rate and found that more than 70% of lactate was removed in the beginning 10 h at each batch (Fig. 2). After 24 h operation, the COD in all three bioreactors decreased to below 100 mg/L and removal rate approached to 80.5%, 75.5%, and 85.5% for MFCs Glu, Ace, and Pro. The average coulombic efficiency for all MFCs was around 9%.
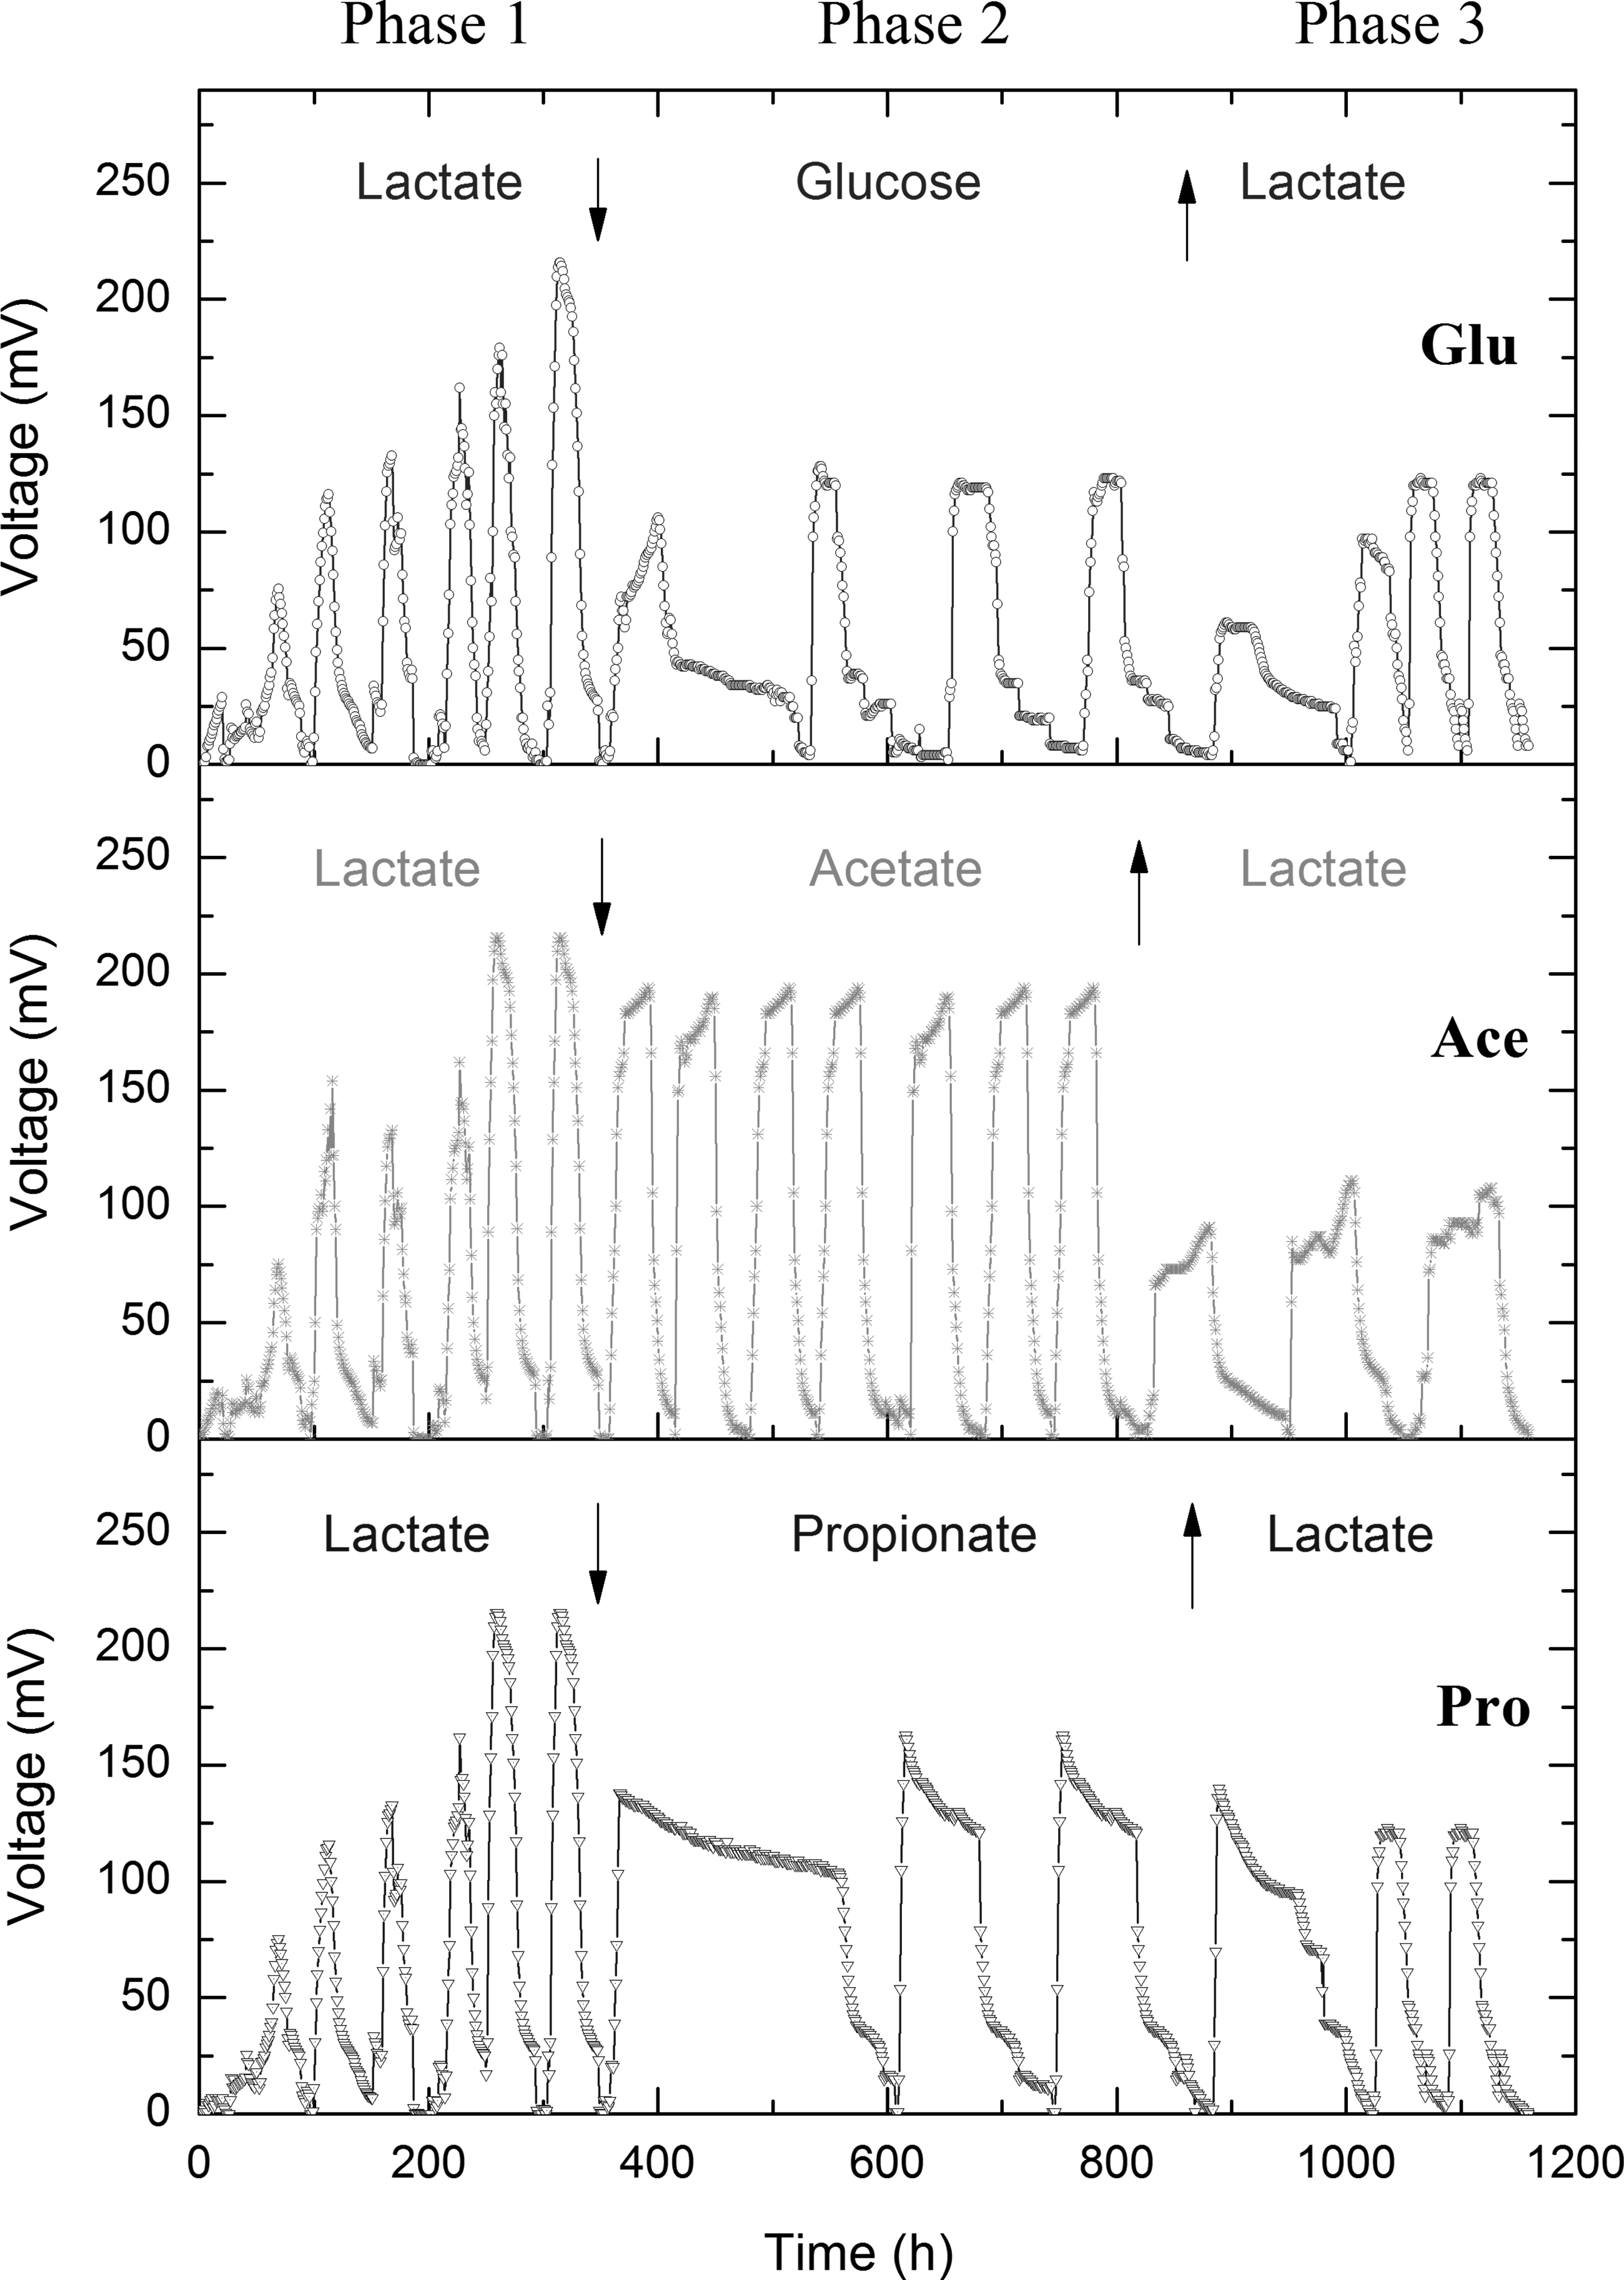
Voltage profiles of MFCs as substrates changed. Phase 1, MFCs started up with feeding lactate; Phase 2, lactate was replaced by glucose (Glu), acetate (Ace), and propionate (Pro), respectively; Phase 3, substrates were turned back to lactate. The down arrow indicated that the lactate was replaced, and up arrow indicated that the substrates were recovered to lactate. MFCs, microbial fuel cells.
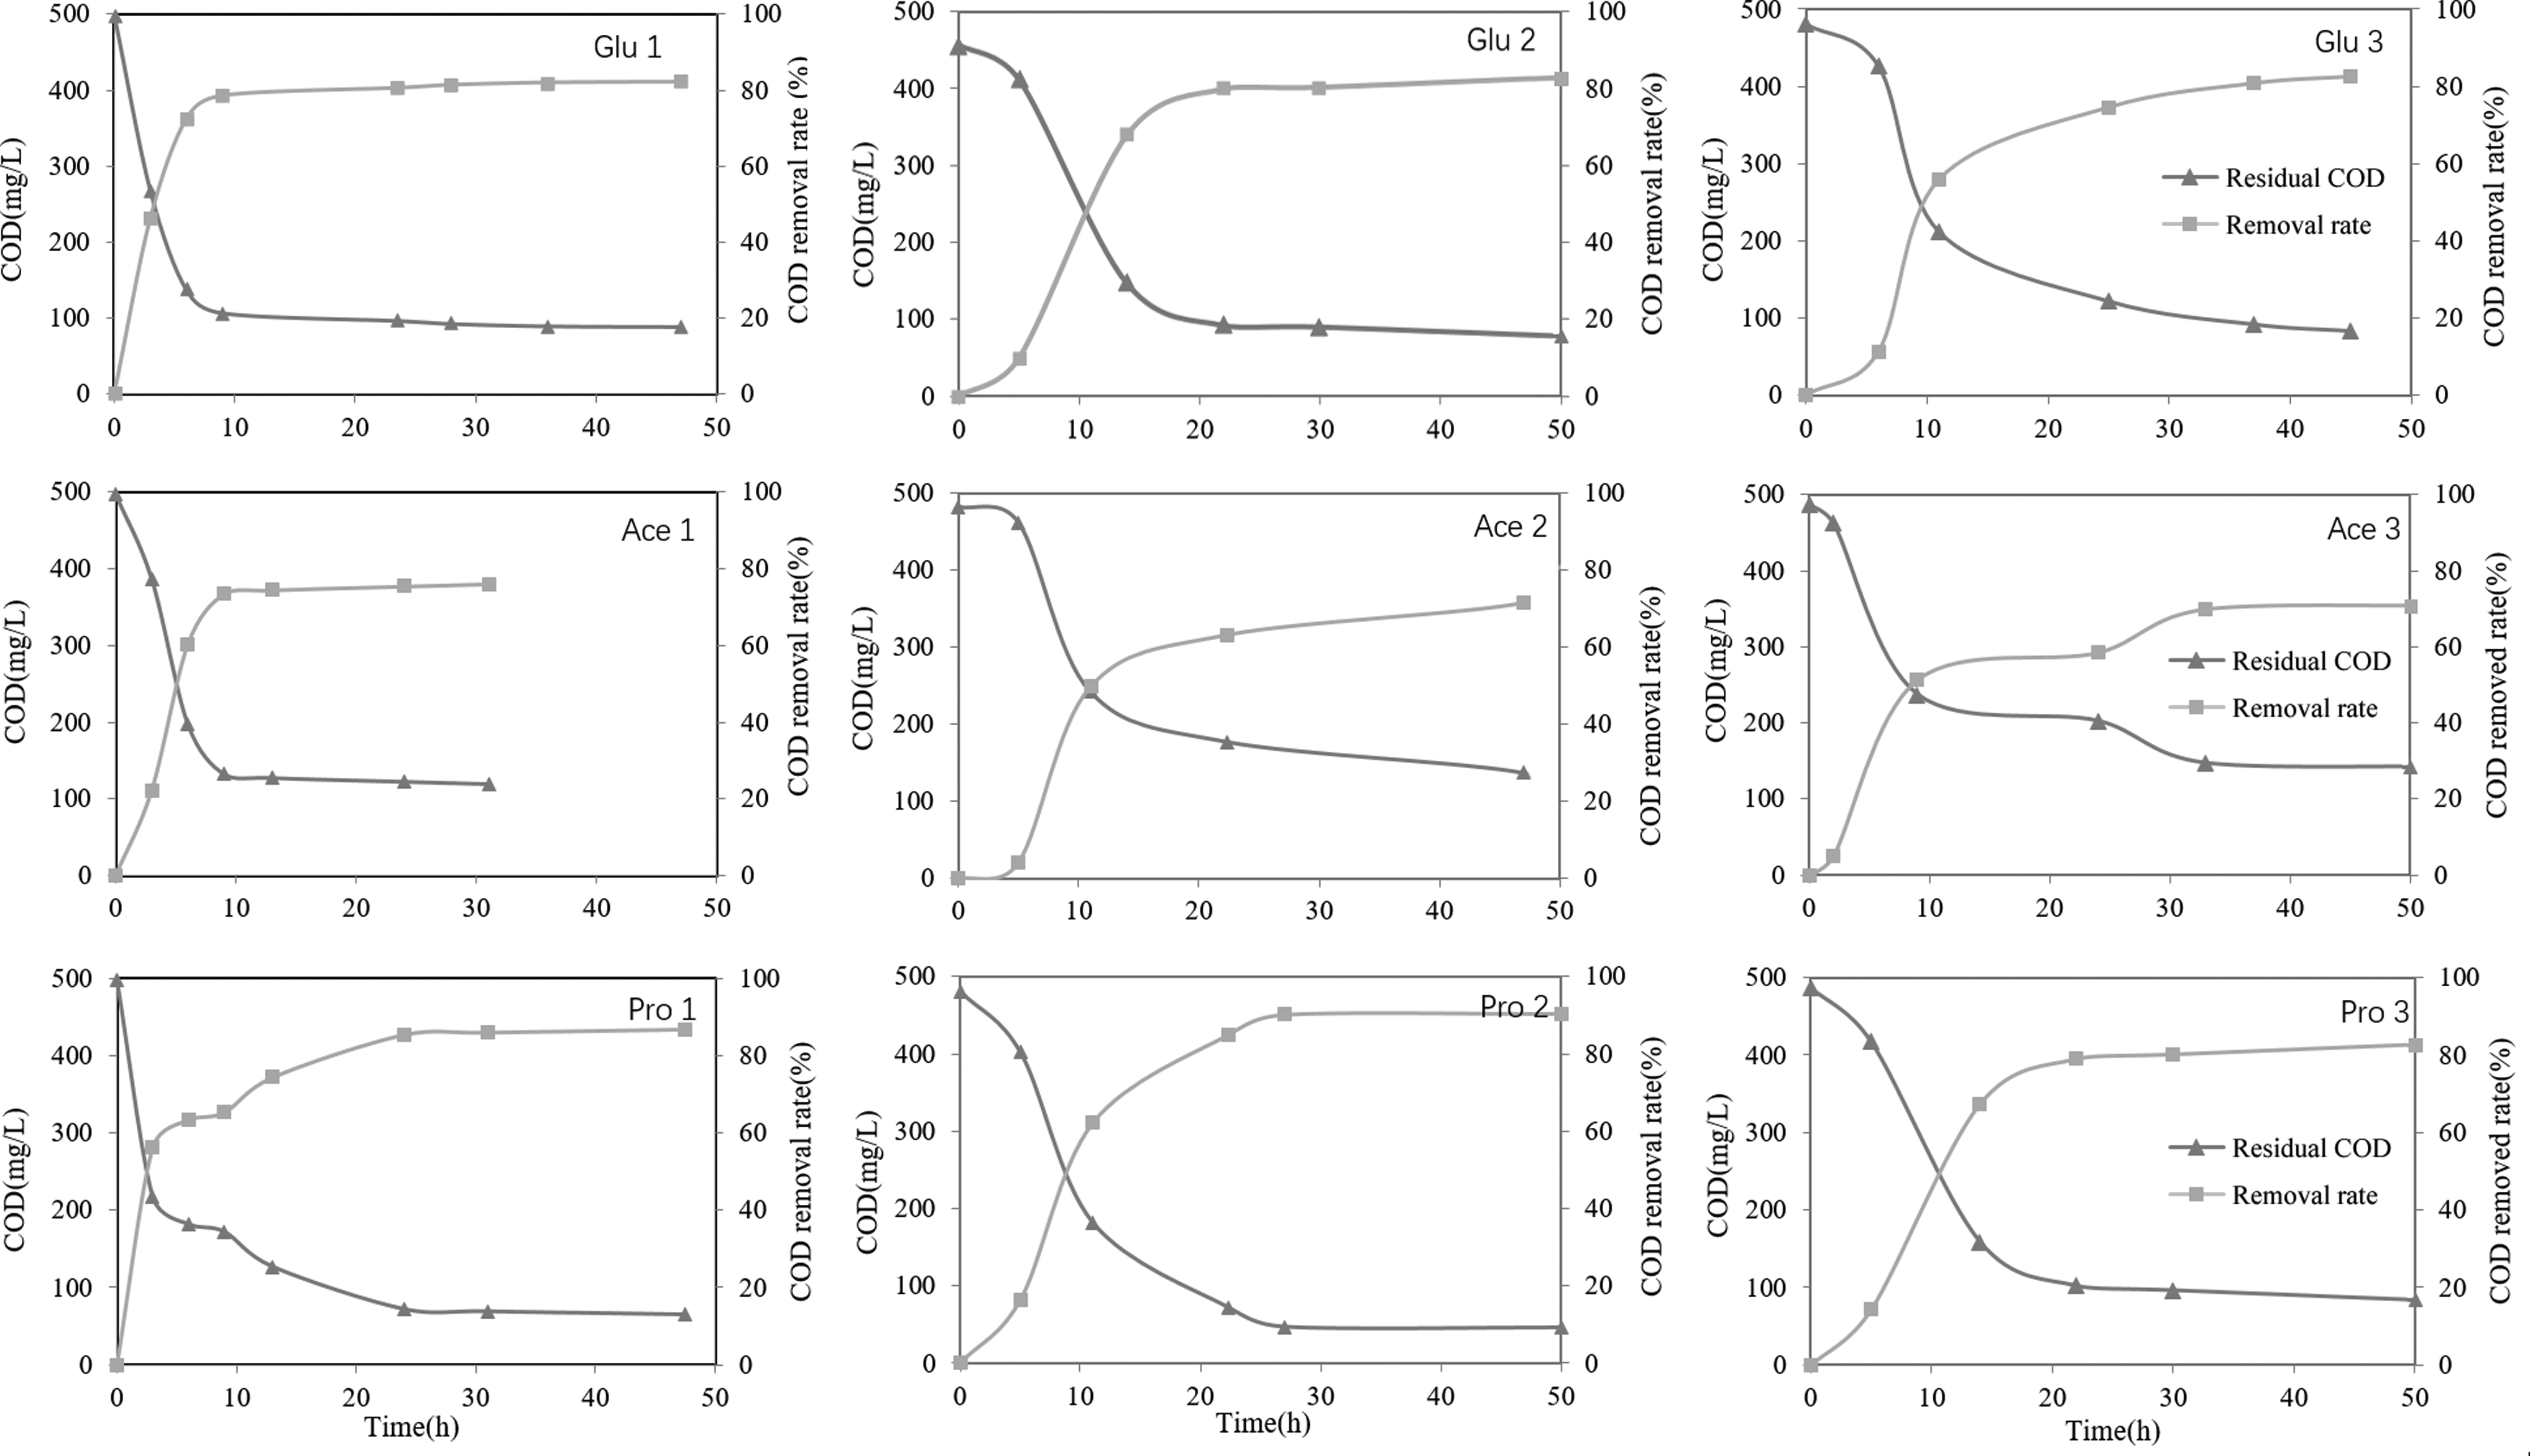
COD removal rate of MFCs treating different artificial wastewaters. Glu1-3, Ace1-3, and Pro1-3 indicated three phases in corresponding MFCs.
Change of voltages was observed when the lactate was replaced by glucose, acetate, or propionate, respectively. At first batch, glucose and propionate-feeding MFCs both approached to 100 mV, but lasted for about 200 h. After that, their voltages showed a little increase but the batch's duration was still about 150 h. These results suggested that MFC microbes enriched with lactate needed a longer adaptive time to utilize glucose and propionate; the new microbial communities should be rebuilt to utilize the new substrates (Zhang et al., 2011).
Compared with that, we even did not find an adaptive time for the lactate-to-acetate MFC and the voltage quickly increased to about 190 mV. Acetate was one of the metabolic intermediates when the lactate was anaerobically degraded (Lindgren et al., 1990), so the microbial populations that utilize acetate had existed in the original microbial community (Zhang et al., 2011). Chae et al. (2009) and Zhang et al. (2011) observed the similar potential profiles when acetate was replaced by glucose. In their research, when glucose was fed into the acetate-enriched MFCs, the adaptation time was around 3 days with a relative low power density.
Interestingly, the propionate looks like lactate in molecular structure, but the bioreactor still required a long term to acclimate when the lactate was replaced by propionate. This might be ascribed to the different degradation pathways of lactate and propionate (Koch et al., 1983; Lindgren et al., 1990). In general, lactate is first converted to pyruvate, and pyruvate is subsequently degraded to formate and acetate (Lindgren et al., 1990); while the propionate is directly converted to acetate and carbon dioxide (Koch et al., 1983). Thus, the anodic biofilms of MFCs were needed to enrich different microbial populations by propionate and lactate due to different metabolic pathways.
When the lactate was substituted by glucose, acetate, and propionate, the MFC internal resistance presented a little more increase, but power densities decreased to 1.43–1.65 W/m3. Compared with the other two, the propionate-feeding MFC generated higher power density at this phase; this indicates that propionate might be easier utilized by anode-respiring bacteria (ARB) and thus ARB were enriched better. This would be confirmed by the analysis of the microbial community on the anodes.
When the substrates in the three MFCs were changed back to lactate secondly, little longer lag times were also observed (Fig. 1). This indicated that it was difficult for the microbial community recovering in relative short time even if glucose-fed-MFC contained high community diversity (Chae et al., 2009). The maximum voltage for the acetate-fed MFC reached only about 100 mV when the lactate refed, which was far lower than its 230 mV in the first phase. Hence, acetate-fed MFC needed longer time to enrich the lactate-utilizing microbial populations. Compared with phase 1, the power output obviously decreased to 0.97–1.62 W/m3.
Substrates change affecting the anodic microbial community structure
The biofilms on the anodes were sampled at the end of each phase, and the DGGE profiles are shown in Fig. 3. Predominant bands in the DGGE profiles were excised and sequenced; phylogenetic tree was built with the similar sequences (Fig. 4). The activated sludge sample contained more bands and presented higher diversity than the enrichments. We hardly found that the bands in the enriched samples presented the same migrating distance with the original sludge. Interestingly, the divergence in microbial community structure was also observed in different MFC anodes enriched with lactate. This indicated that the difference in structure of microbial communities would definitely exist even if we tried to control the bioreactors under the similar condition and operational parameters.
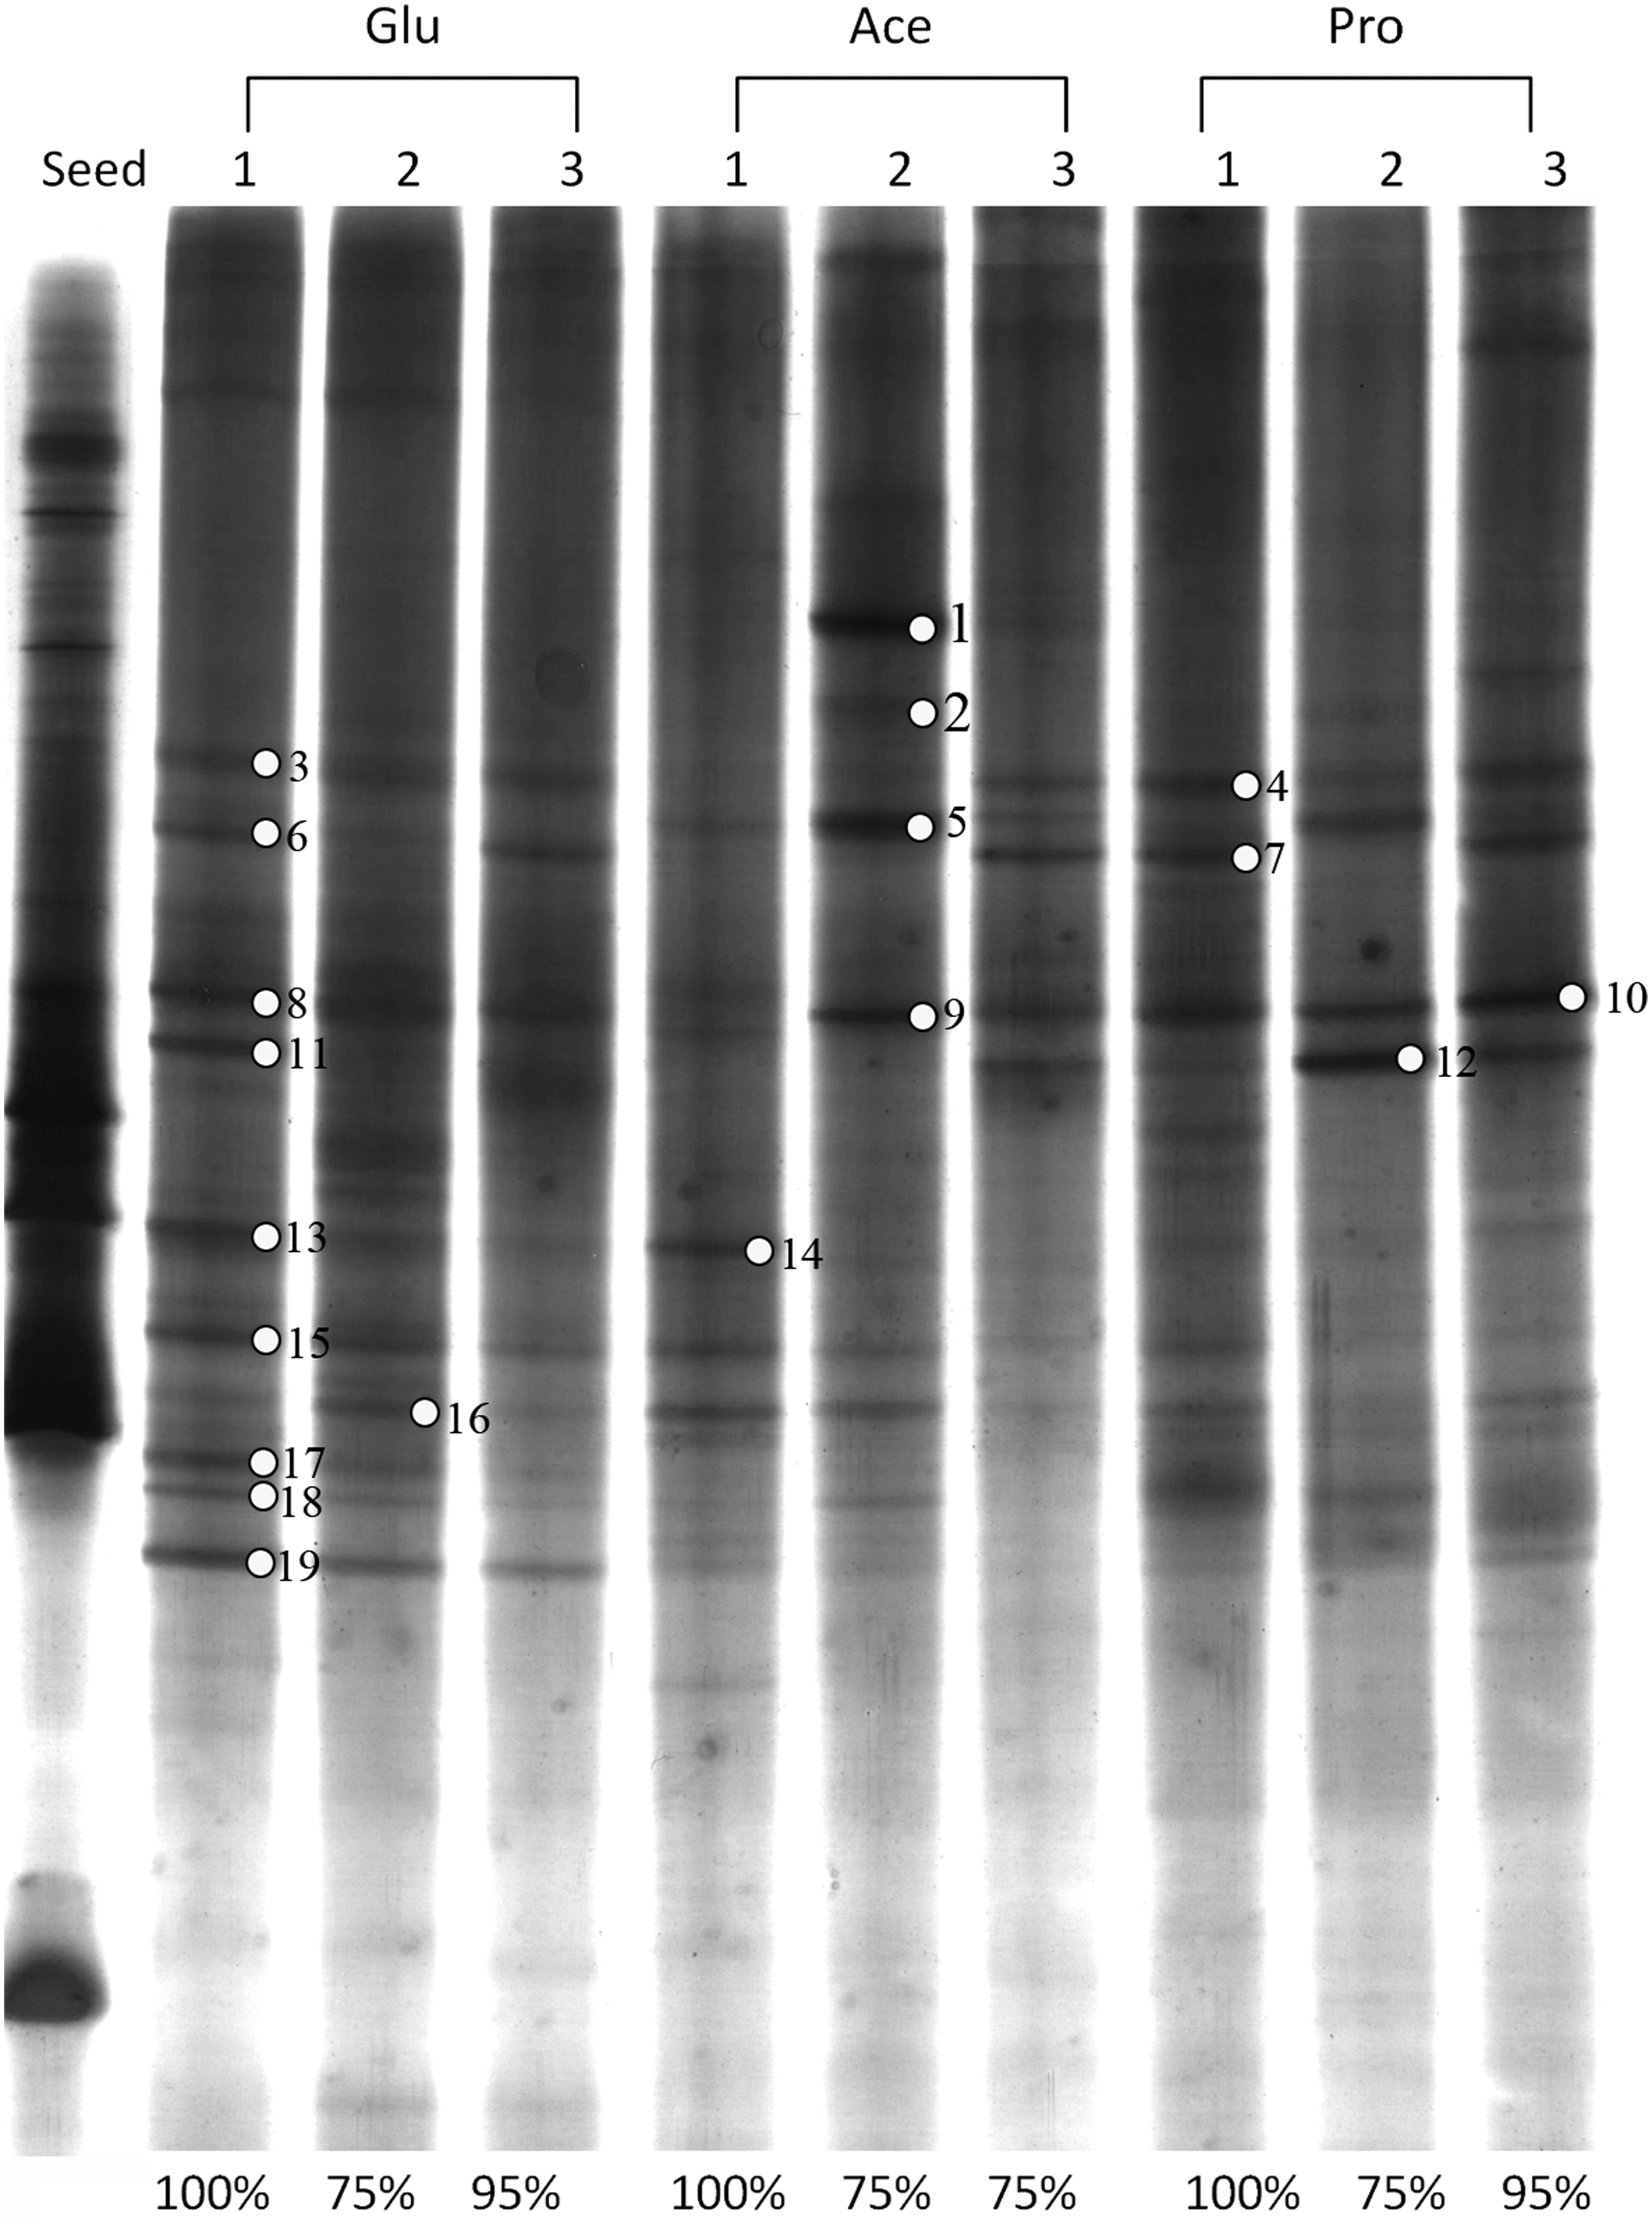
DGGE profile of anode microbial communities in MFCs with substrates changing. Seed was the activated sludge used to be incubated in MFCs; Glu, Ace, and Pro indicated the microbial communities from the anode biofilm in corresponding MFCs; Glu1-3, Ace1-3, and Pro1-3 refer to the three phases. Numbers of 1–19 in the lane indicated the bands to be sequenced; percentages under the pattern showed their similarity of microbial communities with the first phase in the corresponding MFC. DGGE, denaturing gradient gel electrophoresis.
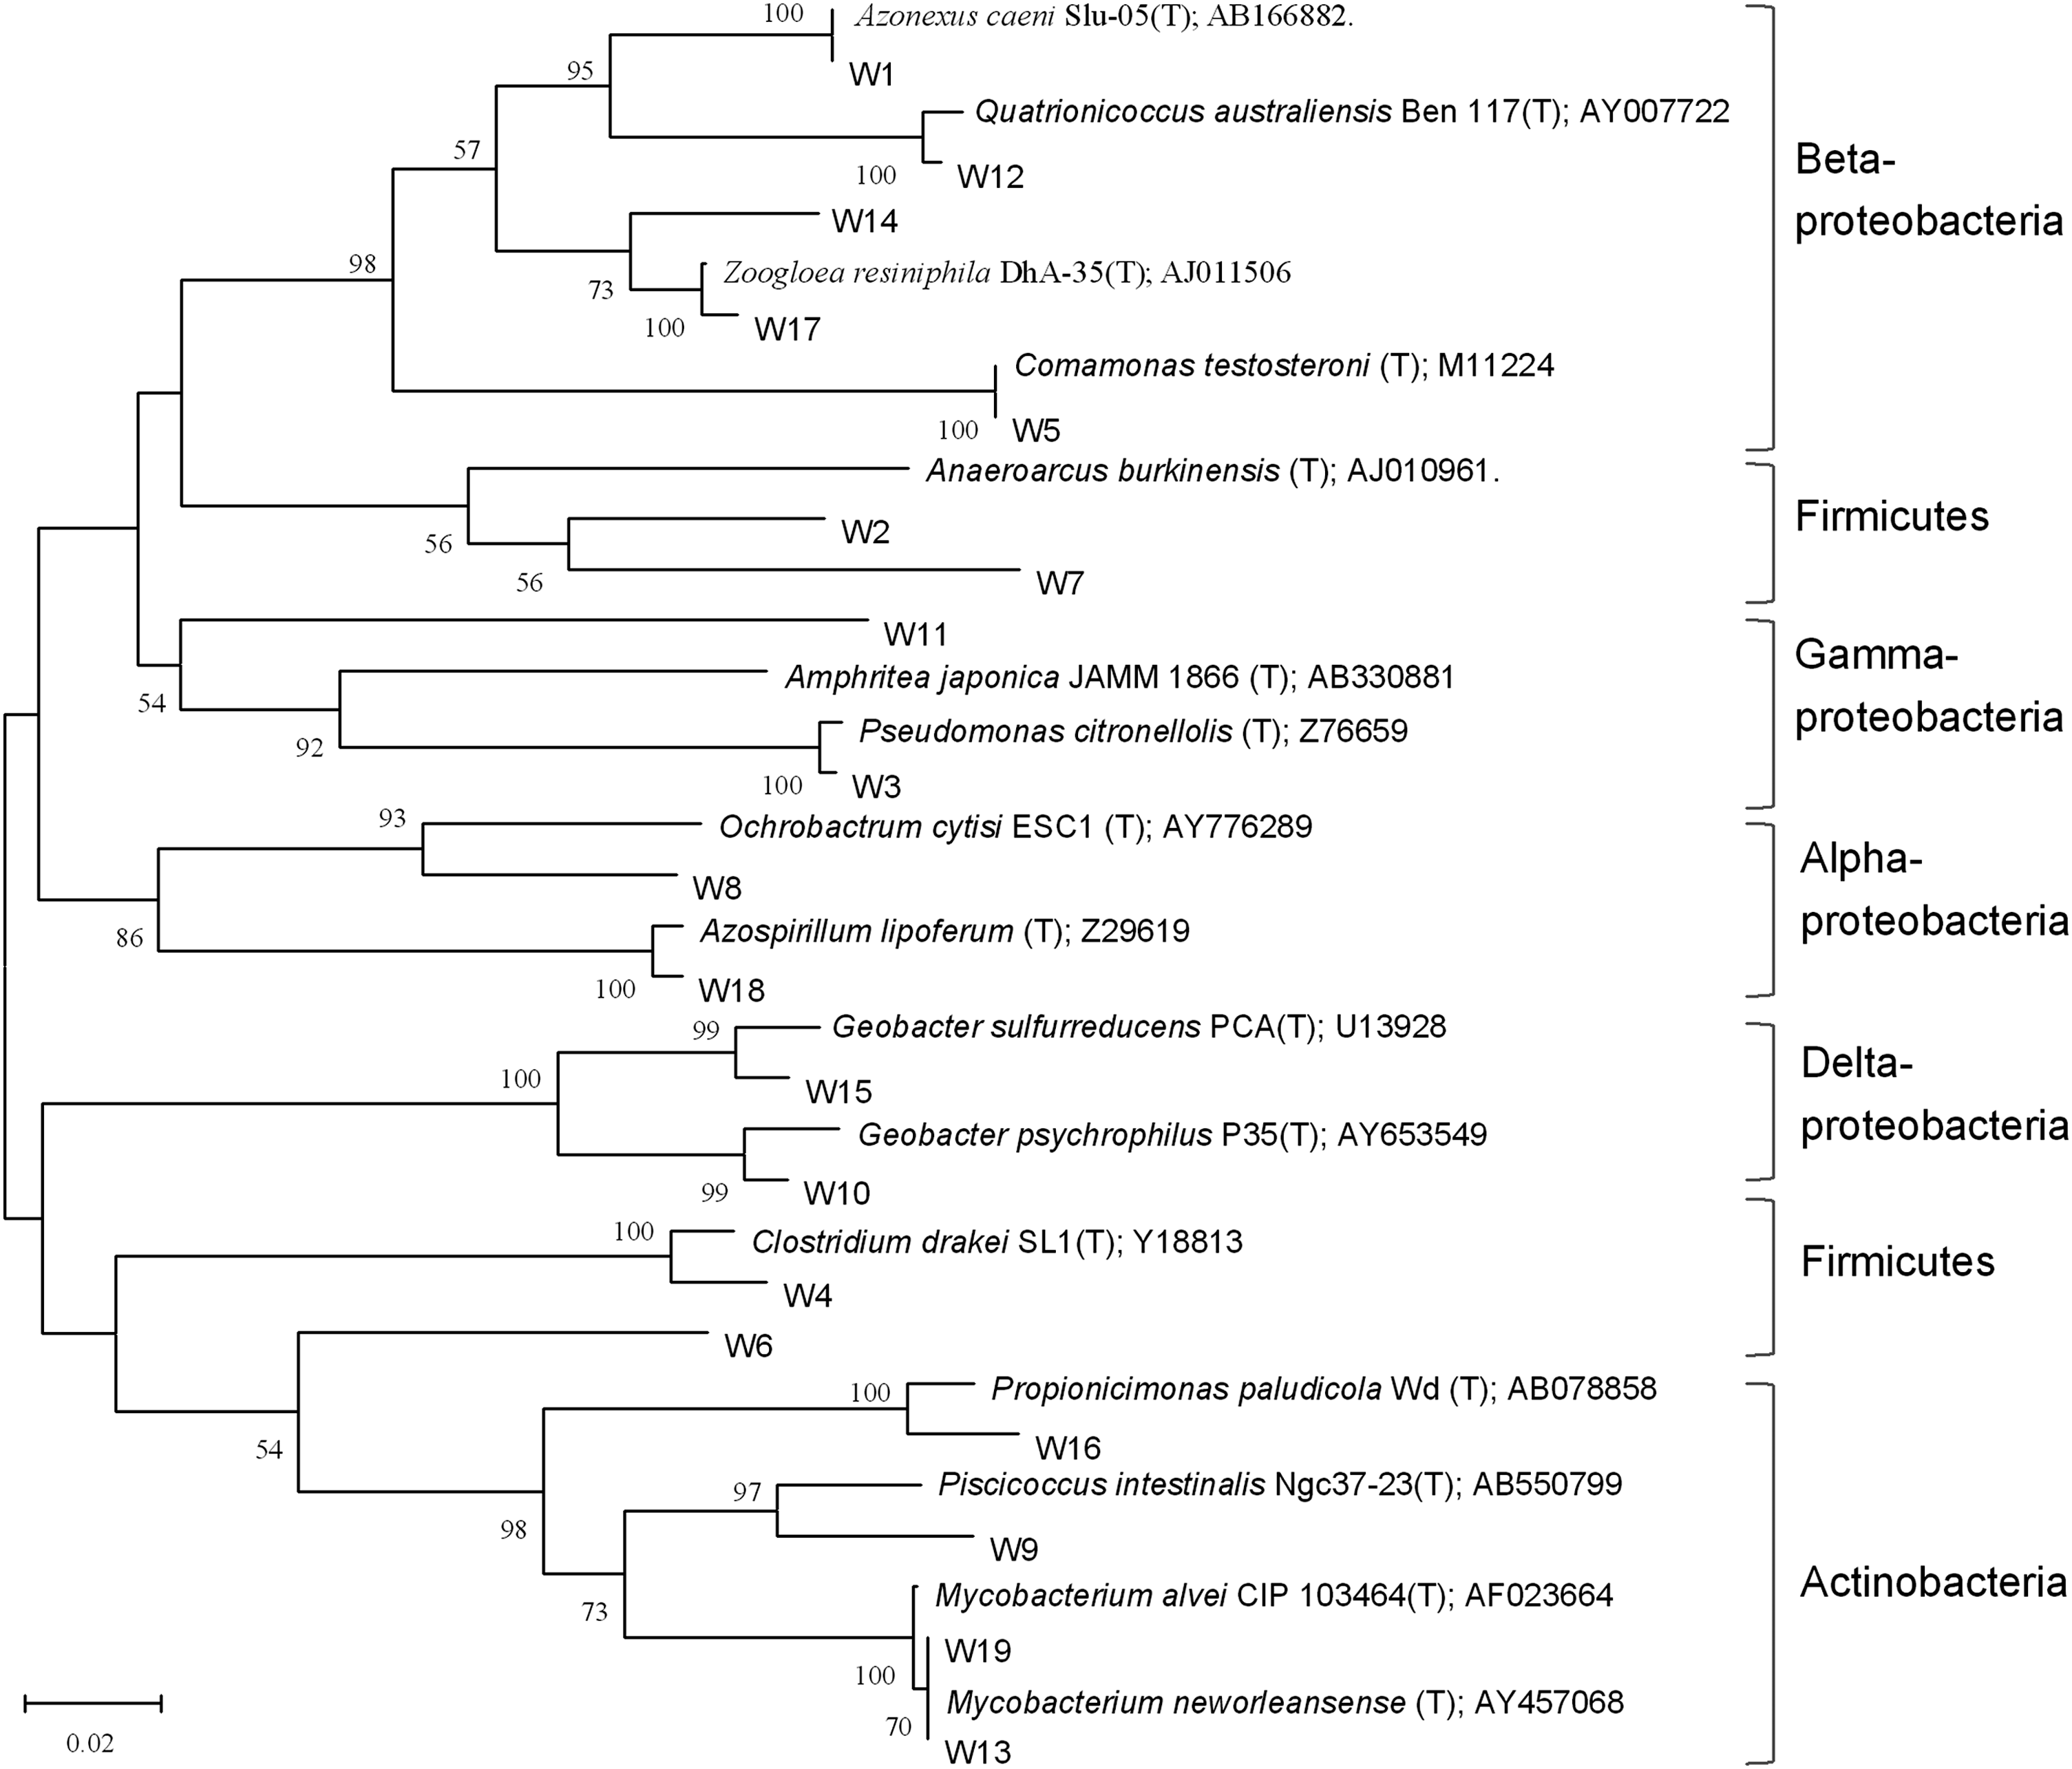
Phylogenetic tree based on bacterial 16S rRNA gene sequences from DGGE profiles with closest matches and representative sequences in the GenBank database. W1–W19 indicated the bands in DGGE profiles. The tree was generated using the neighbor-joining method with 1,000 bootstrap replicates. Numbers on the branches are their bootstrap values; bootstrap values lower than 50% are not shown. The scale under the tree is the divergence distance (2%).
Substrate switch markedly changed the original structure of anodic microbial community (Fig. 3). There was no more 75% similarity in structure after the substrate replacement. During the course of switch of lactate to acetate, many bands were enriched (i.e., bands 1, 2, 5, and 9) or deactivated (i.e., band 14).
According to the phylogenic tree, the most enriched band 1 showed very high similarity with Azonexus caeni Slu-05T (GenBank Accession No. AB166882). A. caeni Slu-05T was isolated from sludge of a municipal sewage treatment plant. Research showed that this strain grew by degrading acetate and reducing nitrate (Quan et al., 2006). In addition, it has been frequently found in MFCs fed with acetate (Chae et al., 2009; Zhou et al., 2013). Therefore, enrichment of this bacterium might contribute to the acetate degradation and electricity production. However, we did not detect this sequence in the same sample by using the HTS.
The sequence of band 5, enriched by feeding acetate and propionate, resembled Comamonas testosterone (T) (M11224) with very high identity. Juang et al. (2011) found that C. testosteroni revealed stronger power generation capability than other Gram-negative bacteria in their pure culture MFC experiments. Therefore, we might conclude that enrichment of this bacterium in anode enhanced the electricity production. This laid a microbial foundation for the better performance of propionate feeding MFC at the second phase.
Another important electricity production bacterial group was Geobacter spp. We found that the sequences of bands 10 and 15 were similar to G. psychrophilus P35T (AY653549) and G. sulfurreducens PCAT (U13928), respectively. These bacteria are typical Fe (III) reducing bacteria by oxidizing acetate (Caccavo et al., 1994; Nevin et al., 2005). Acetate is the primary intermediate, no matter the lactate or propionate was fed (Koch et al., 1983; Lindgren et al., 1990), hence these two bands were enriched by feeding lactate from inoculum and existed in almost whole operational procedure even if the substrates were changed (Fig. 3). These might guarantee the MFCs performing well after they started up and their high abundance was also confirmed by the HTS results.
Response of anodic microbial communities to substrate change
Relative abundance of different microbial groups in phylum or class level is shown in Fig. 5. PCA result for different microbial communities at the genus level is shown in Fig. 6.
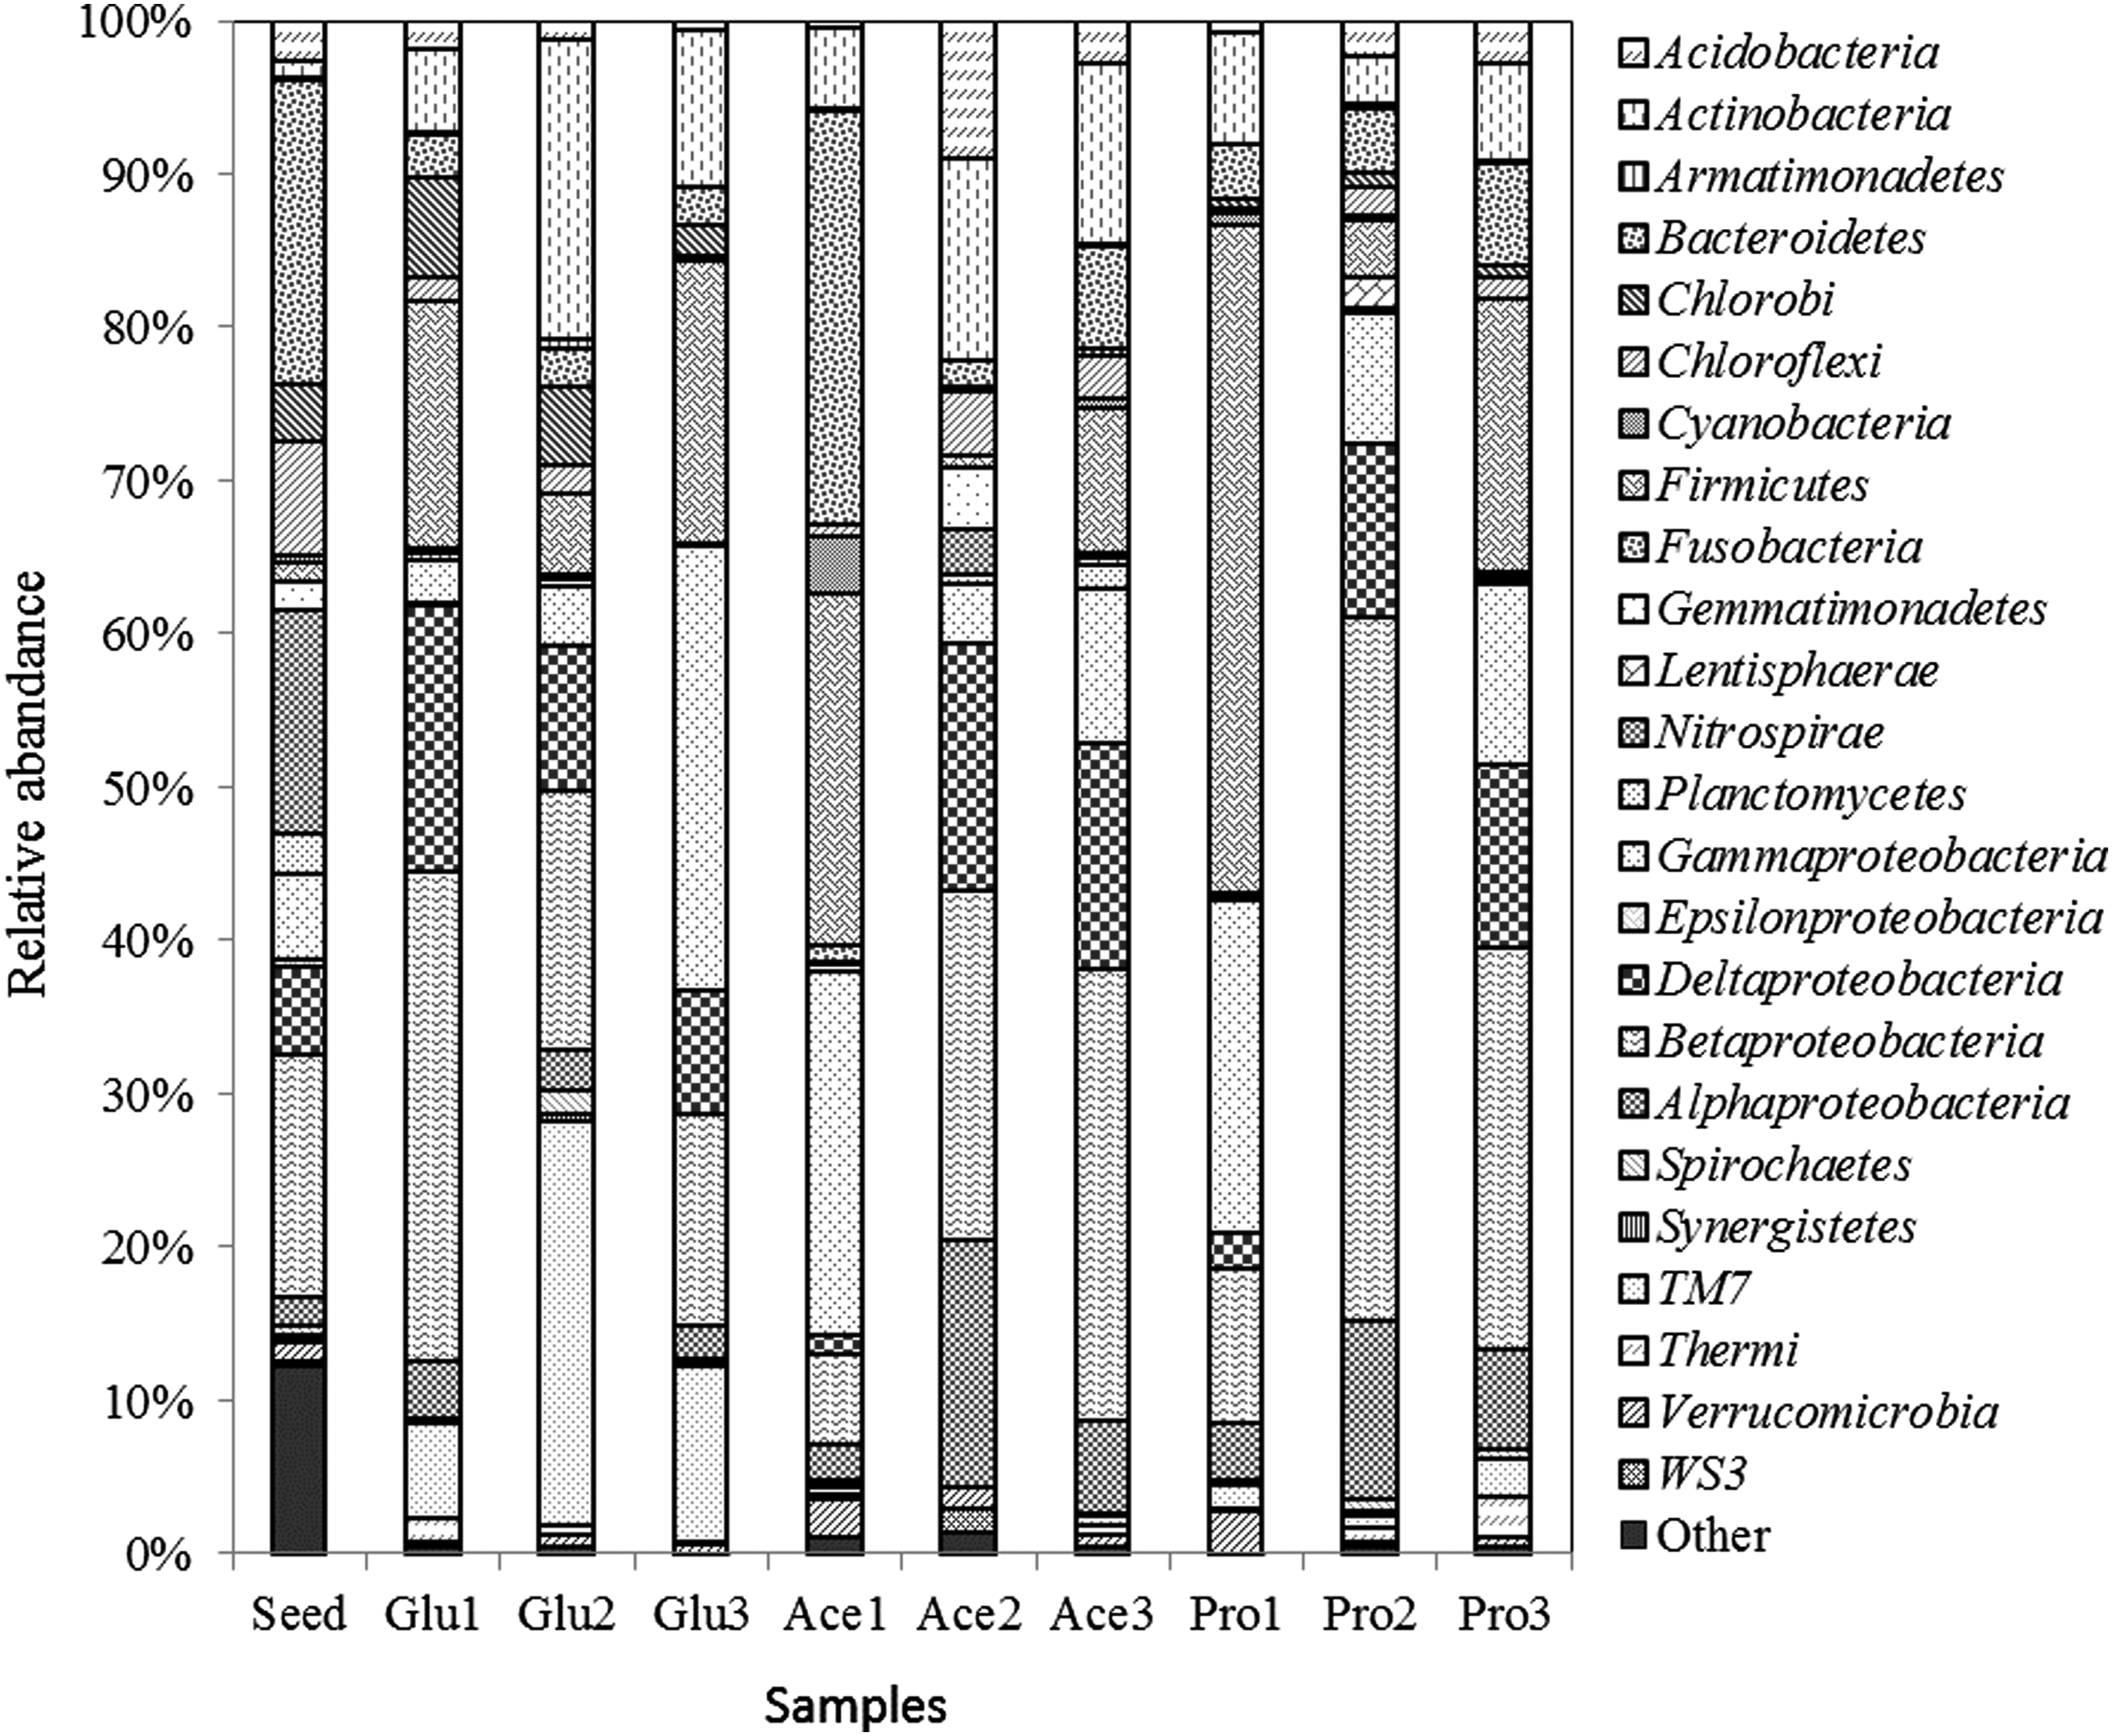
Composition and relative abundance of bacterial communities based on 16S rRNA gene sequences. Bacteria in phylum Proteobacteria were shown in class level, others shown in phylum level. Seed is the activated sludge used to incubate in MFCs; Glu1-3, Ace1-3, and Pro1-3 indicated the microbial communities from anode biofilm at the end of three phases in corresponding MFCs.
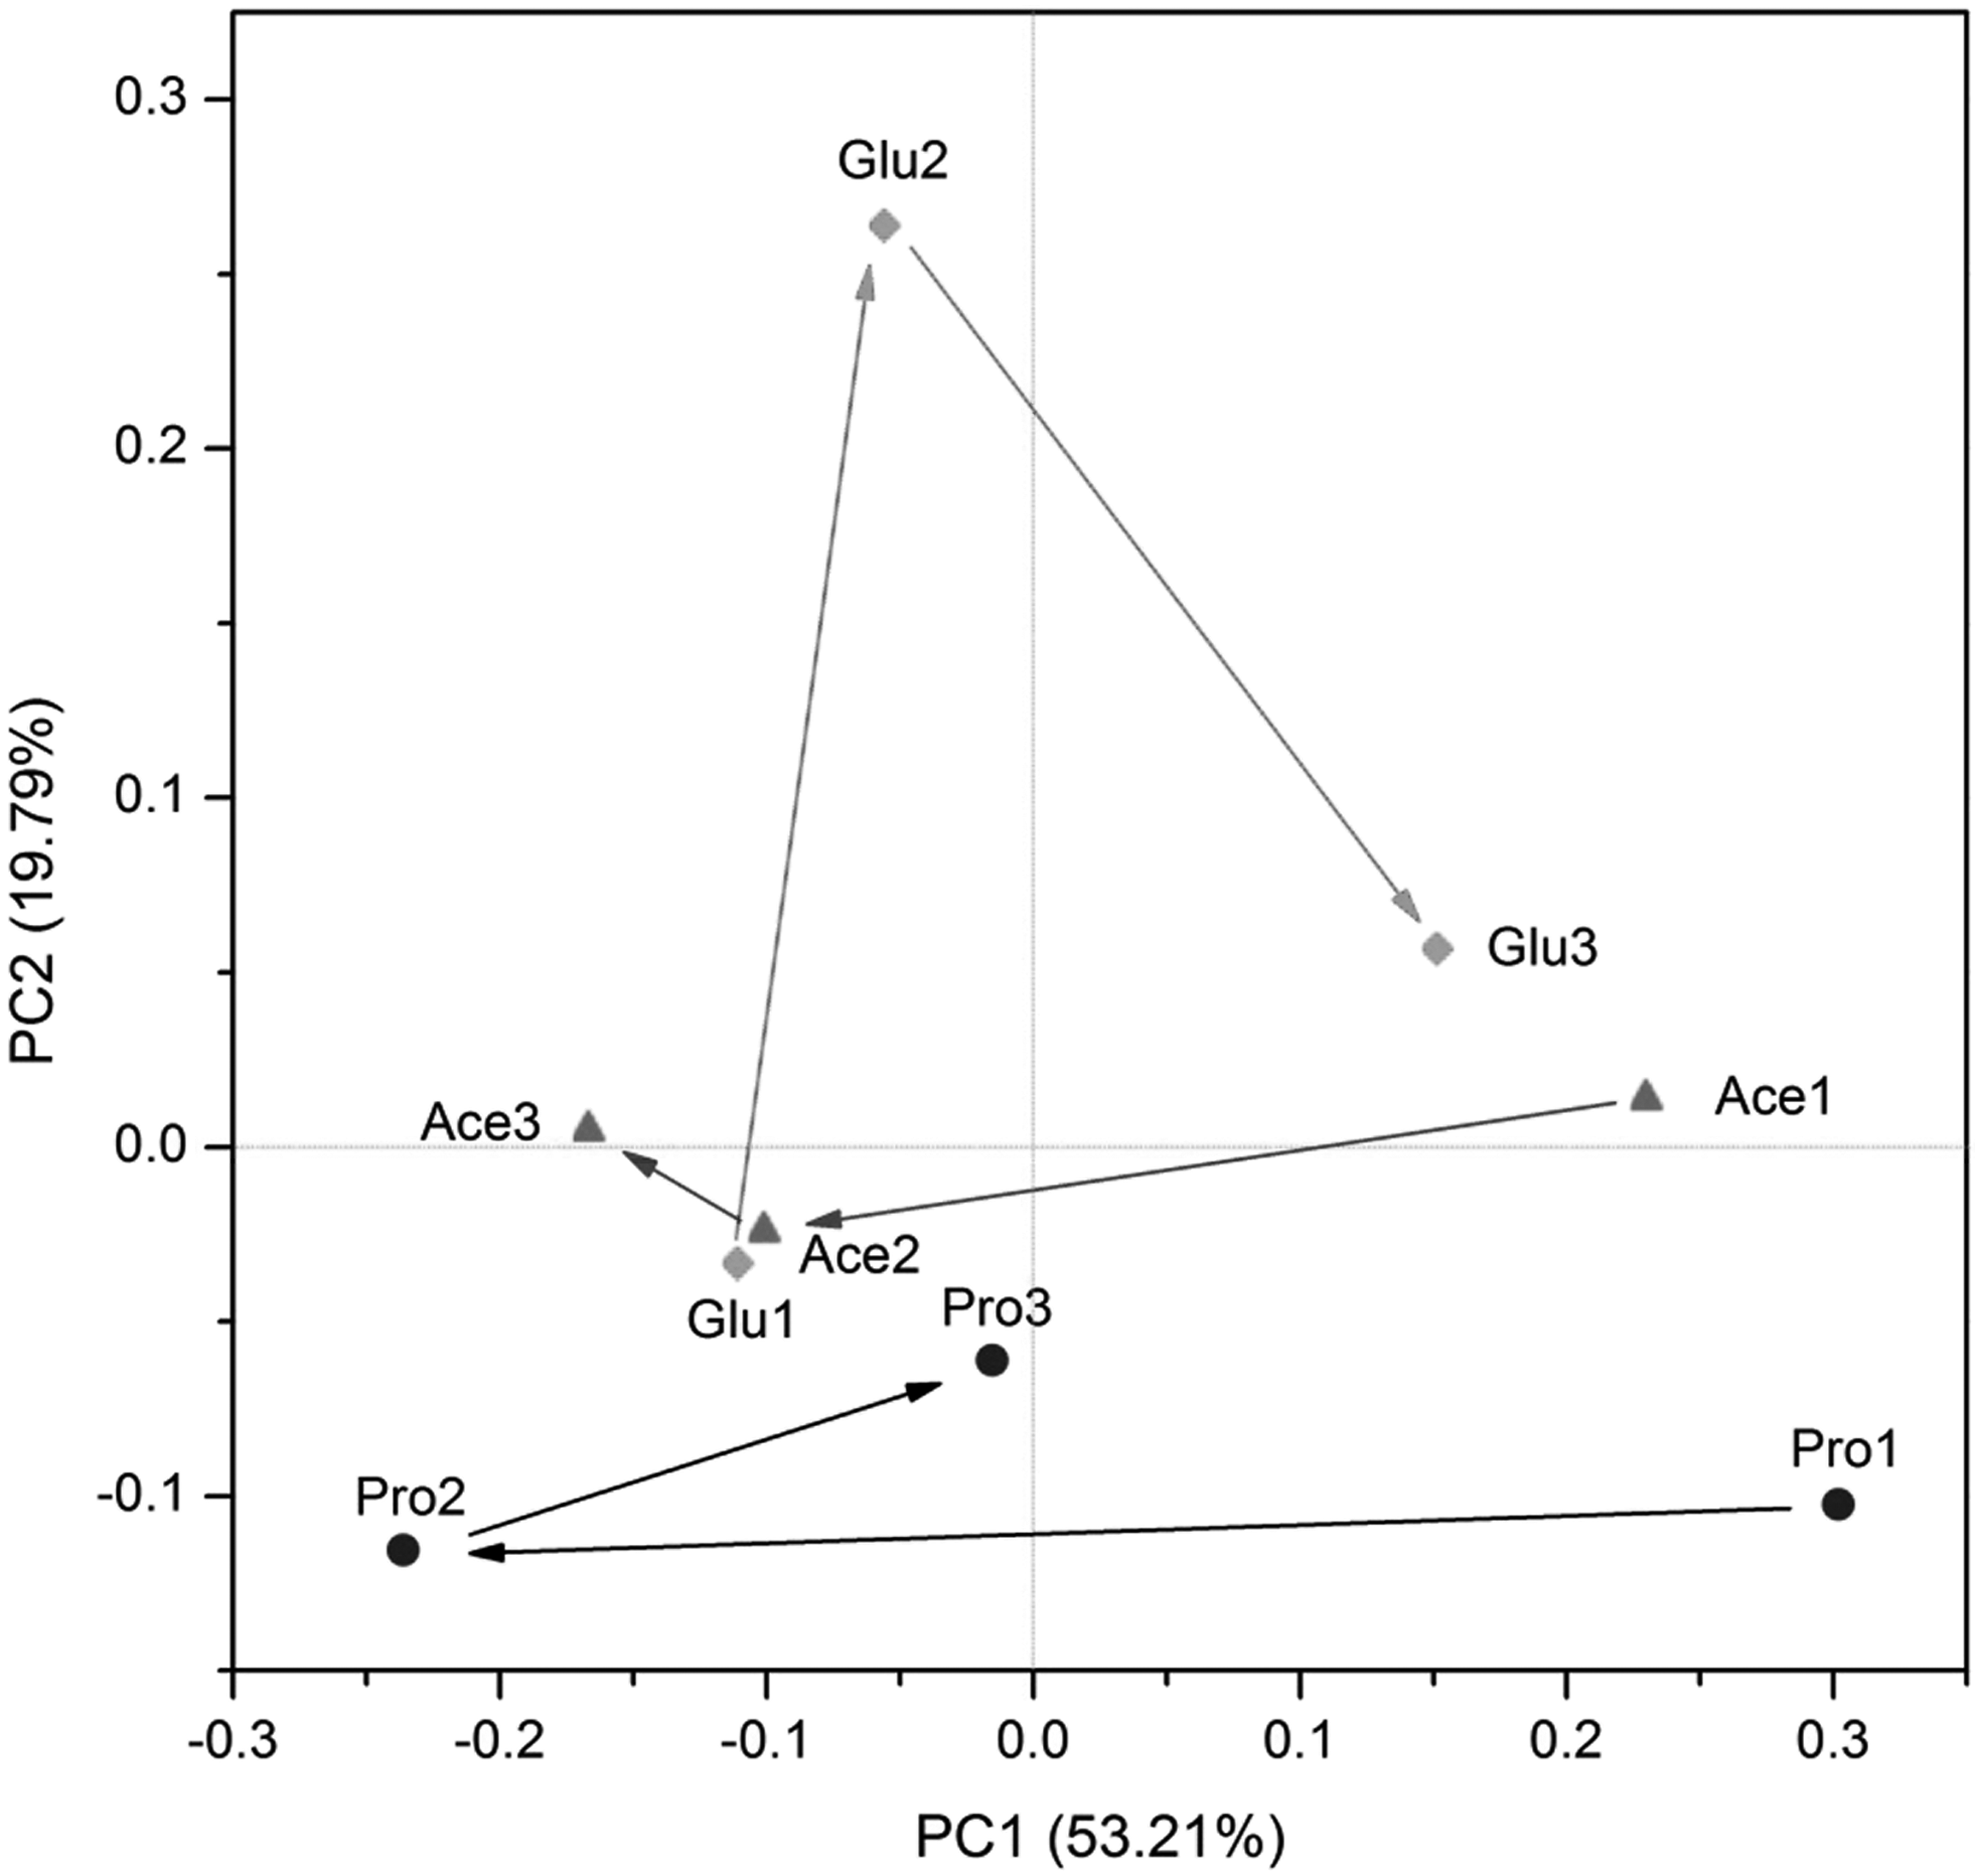
Principle component analysis (PCA) for bacterial community 16S rRNA gene sequences in classes level. Glu1-3, Ace1-3, and Pro1-3 indicated the microbial communities from anode biofilm at the end of three phases in corresponding MFCs.
Similar to the DGGE profiles, the composition and abundance of microbial community in inoculum were quite different from the enrichments. The inoculum was dominated (above 10% in abundance) sequentially by Bacteroidetes (19.90%), Betaproteobacteria (15.70%), and Nitrospirae (14.60%), while the enrichment with lactate was obviously dominated with some other different groups. Although samples Glu1, Ace1, and Pro1 were all enriched by lactate from the same inoculum, the divergence in composition and abundance was obvious, which responded well to the DGGE profiles. This divergence might be ascribed to the facts like some small differences of anode/cathode configuration, bioreactor airproof, or some small influencers that we ignored (Sun et al., 2014).
According to the changes of relative abundance of different bacterial groups (Fig. 5) and PCA result (Fig. 6), nutrient change resulted in a big variation of composition and abundance of microbial community. Samples Glu2, Ace2, and Pro2 ran away from their initial enrichments fed with lactate. The samples Ace2 and Pro2 moved along the coordinate axis PC1, while the Glu2 moved along the PC2 (Fig. 6). This indicated that glucose feeding led to different changes in microbial community composition comparing with acetate and propionate feeding.
Glucose is a little more complex than the acetate and propionate; its fermentation and degradation required more diverse microbes to cooperate (Chae et al., 2009). This led the microbial community in glucose-feeding bioreactor into another direction. However, it is very strange that Glu1 is similar to the Ace2. We cannot deduce the reason why they grouped together based on the present data and this should be further investigated.
The composition and abundance of microbial communities in the established genera were shown in Table 1. Difference in predominant microbial populations could be observed in different MFC anodes enriched with lactates. Sample Glu1 dominated with genera Anaeromusa (13.89%), Geobacter (9.51%), Dechloromonas (6.06%), and Zoogloea (5.05%); Pro1 dominated with Anaeromusa (42.59%) and Pseudomonas (10.92%). Compared with that, genus Acinetobacter (8.37%) was the dominant group in Ace1.
Only defined genera were shown.
Seed is the inoculated activated sludge used to start up the bioreactors; Glu1, Ace1, and Pro1 refer to the anodic enrichment feeding with lactate; Glu2, Ace2, and Pro2 indicate the enrichment with glucose, acetate, and propionate, respectively; Glu3, Ace3, and Pro3 are the anodic enrichment when the substrates return back to lactate.
The switch of lactate-to-acetate led to the increase of Kaistobacter (from 0% to 1.30%), Sphingomonas (from 0.04% to 1.07%), and Rhodoplanes (from 0.02% to 2.92%). However, we did not yet find the electricity-producing reports on these bacteria. The typical electricity-producing Geobacter spp. were still not high in abundance (0.45%) at this phase (Ace2). This might mean there are many unknown electricity-producing bacteria that are not fully identified (Logan, 2009). Uliginosibacterium (from 0.01% to 1.90%), Dermatophilus (from 0.02% to 1.48%), and Propionicimonas (from 0.27% to 3.98%) were enriched by glucose feeding in sample Glu2. Michaelidou et al. (2011) found that Propionicimonas-related bacteria were the dominant population in the anodic liquid feeding with acetate. Geobacter (from 1.62% to 10.29%), Novispirillum (from 0% to 4.68%), Dechloromonas (from 3.30% to 22.46%), and Azospirillum (from 0.02% to 1.44%) were enriched due to the change of lactate to propionate.
Geobacter species within class Deltaproteobacteria are considered as typical exoelectrogens (Lovley et al., 2011). Abundance of Geobacter sequences in sample Pro2 enriched by propionate increased from 1.62% to 10.29% (Table 1). Seeing that power densities of MFC had positive correlation with the relative abundance of Geobacter spp. (Sun et al., 2011), the high abundance of this genus species led to the best power density with 1.65 W/m3in the three bioreactors. It further confirmed the microbiological bases in anodic biofilm for the high electricity producing efficiency when the MFC fed propionate.
Research found that some species of genus Dechloromonas were important denitrifying phosphorus accumulating bacteria, and they were capable of degrading completely monoaromatic compounds to CO2 under anaerobic conditions or in the presence of nitrate as an electron acceptor (Carosia et al., 2014). This group of bacteria was frequently detected in anodic biofilm of MFC with high abundance (Kim et al., 2007), which suggested that they might take part in or contribute to the electricity generation. Azospirillum is a free living, best characterized nitrogen-fixing plant growth-promoting rhizobacteria and they are commonly found in electrode biofilm community for MFCs (Park et al., 2014).
Microbial communities affected by secondary lactate feed
We evaluate whether microbial communities are resilient when we switch the substrate back to the original one. According to Fig. 3, the structure of anodic microbial communities of samples Glu3 and Pro3 both obtained 95% similarity with the original profiles when the substrates were changed back to lactates. This indicated that their communities were able to restore with outside condition.
When the outside environmental condition returned back to its original condition, most of microbial communities would revive. This was confirmed by HTS. According to Fig. 6, when substrates in the anodic chambers were replaced by lactate, the developing direction of microbial communities on anodes almost turned back except for acetate feeding MFC. We could find some identical dominant populations between Glu1 and Glu3 and Pro1 and Pro3 (Table 1). The genera Anaeromusa, Geobacter, and Pseudomonas are good examples. After being enriched by lactate feeding first, their abundances were enhanced again by lactate feeding secondly.
Anaeromusa species in Glu1, Ace1, and Pro1 were remarkably enriched by lactate, and they dominated again when lactate fed secondly in samples Glu3, Ace3, and Pro3. The high abundance of Anaeromusa species indicated that this group undoubtedly played a very important role in lactate degrading and electricity production in anodic biofilm. Anaeromusa species have previously been described as amino-acid utilizing organisms. However, Borole et al. (2009) first obtained an enrichment of exoelectrogenic biofilm communities dominated by Anaeromusa species with a high abundance of 41%. Therefore, they believed these bacteria actually took part in the electricity producing process.
The change of Pseudomonas spp. in abundance almost presented same tendency. They were obviously enriched by the second feeding of lactate with high abundance of 26.76% in Glu3, 2.75% in Ace3, and 5.53% in Pro3. Pseudomonas spp. were widespread Gram-negative aerobic Gammaproteobacteria. However, we found that they frequently dominated in lactate-feeding anaerobic bioreactor (Zhao et al., 2008). They might take charge of fermenting lactate and depleting oxygen, and thus, keep the anaerobic bioreactor in a good condition for other anaerobes. This would benefit to the electricity production in the MFC (Qu et al., 2012).
Conclusions
Performance of MFCs responded well to the substrate switch. If the lactate was replaced by one of its intermediates, such as acetate, the MFC performance would respond rapidly. However, if lactate was replaced by glucose/propionate or acetate was changed to lactate, it needed a little longer time for the MFC to recover. Substrate conversion markedly affected the original structure and composition of anodic microbial community. Some important exoelectrogenic bacteria, such as Geobacter spp. and Comamonas testosterone, were enriched by feeding propionate. The dominant populations enriched by lactate feeding first were enhanced again when lactate was fed secondly. The microbial communities would revive with the outside environmental conditions.
Footnotes
Acknowledgments
All authors thank Dr. Yenjung Sean Lai at Arizona State University for his excellent editorial assistance. This work was financially supported by the Natural Science Foundation of China (Grant No. 51579049 and 51509044), the Science and Technology Project of Shandong Province (Grant No. 2016GSF115004), and the Maritime Science and Technology Program of China.
Author Disclosure Statement
No competing financial interests exist.