
Abstract
Abstract
A novel chelating adsorbent, modified sawdust (MS), was synthesized by grafting quaternary ammonium on the cellulose of sawdust, was first designed for high performance U(VI) removal. The property MS was characterized by scanning electron microscopy, energy dispersive X-ray, X-ray diffractometer, and Fourier transform infrared spectroscopy. Removal efficiency of U(VI) for MS and raw sawdust (RS) was evaluated at different dosages, pHs, contact times, and temperatures. Results showed that maximum U(VI) removal efficiencies of 99.7% and 72.8% for MS and RS, respectively, were observed at adsorbent dose of 0.1 g, contact time of 2 h, pH 4.5, and temperature 30°C. Adsorption equilibrium of U(VI) onto MS was well described by the Langmuir isotherm model. Also, the thermodynamic result showed that the adsorption process was feasible, spontaneous, and endothermic in nature. Adsorption kinetic data were fitted well with a pseudo-second order model. High U(VI) removal performance for MS was attributed to the adsorption of U(VI) on amine groups, followed by U(VI) chelation. Results indicate MS has great potential in treating uranium-contaminated water.
Introduction
U
In recent years, biosorption has been employed for many times to scavenge heavy metal ions from wastewater. Compared with conventional treatment methods, biosorption is seen as a low-cost, energy-saving alternative and high efficiency for adsorbing metals in low concentration. Several cheap biosorbents have been evaluated for the removal of U(VI) from aqueous solutions, such as tea waste (Ding et al., 2012), bark (Mustafa et al., 2016), grapefruit peel (Zou et al., 2013), citrus waste (Saleem and Bhatti, 2011), rice straw (Li et al., 2013), and pine sawdust (Zou and Zhao, 2012). Generally, the adsorption capacities of crude agricultural by-products are not high; therefore, for improving the adsorption capacity, chemical modification was used (Vaughan et al., 2001; Šćiban et al., 2008).
Sawdust is one of the most attractive biosorbent among agricultural by-products, which has been used to remove U(VI) from aqueous solution (Zou and Zhao, 2012). It proves to be a low-cost adsorbent largely due to its composition that mainly includes cellulose (40–50%), hemicellulose, and lignin (Salazar-Rabago and Leyva-Ramos, 2016). By using various reagents such as formaldehyde (Baral et al., 2006), citric and tartaric acids (Yang et al., 2010), and sulfuric and phosphoric acids (Argun et al., 2007; Meena et al., 2008), the sawdust was modified; and the chemically modified sawdust (MS) presented a higher adsorption capacity compared with the natural sawdust.
This work was aimed at enhancing the adsorption capacity of sawdust toward U(VI) from aqueous solution by the introduction of amine groups to the sawdust surface. Sawdust was chemically treated to produce the sawdust quaternary ammonium salt type chelating adsorbent (MS), its adsorption kinetics and thermodynamics for removal of U(VI) ions from aqueous solutions were analyzed in detail, and the adsorption mechanism of U(VI) on MS was also elucidated.
Experimental
Materials
Sawdust used in this study was obtained from Hengyang, China. U3O8 was provided by School of Nuclear Resources and Nuclear Fuel Engineering, University of South China. A stock solution of U(VI) was prepared by dissolving U3O8 in the mixture of HCl, H2O2, and HNO3. Working solutions were prepared by diluting the stock solutions. Epichlorohydrin (ECH), N,N-dimethylformamide (DMF), diethylenetriamine (DETA), and triethylamine (TEA) were purchased from Tianjin Kermel Chemical Reagent Co., Ltd., China. All chemicals used in this study were analytical reagent. Adjustment of pH was undertaken by using 0.1 M HCl or NaOH solution.
Synthesis of sawdust quaternary ammonium salt chelating adsorbent (modified sawdust)
The sawdust was crushed and ground, and then sieved to a desired 60 mesh screen. Next, the sawdust was repeatedly washed with distilled water and then dried in oven at 353 K. At last, the obtained sawdust (raw sawdust [RS]) was stored in a desiccator for use.
RS (2.0 g) was treated with 250 mL of aqueous NaOH solution (30 wt%) at 80°C for 1 h under constant stirring in three-neck flask (Zhang et al., 2007; Xie et al., 2013). Then, the alkali-treated RS was reacted with 10 mL of ECH in the presence of DMF (Orlando et al., 2002) at 100°C for 1 h under constant stirring to facilitate etherification. Subsequently, 6 mL DETA was added and the slurry was stirred for 1 h at 100°. After being crosslinked, 8 mL TEA (Orlando et al., 2003) was added and the slurry was stirred for a further 4 h at 100°C to obtain sawdust quaternary ammonium salt type chelating adsorbent (MS). MS was separated by filtration and rinsed with distilled water up to pH 7. After filtering by a vacuum pump and drying in oven at 80°C for 12 h, the MS was derived. According to the above steps, a possible schematic illustration of the synthesis of MS is shown in Fig. 1.
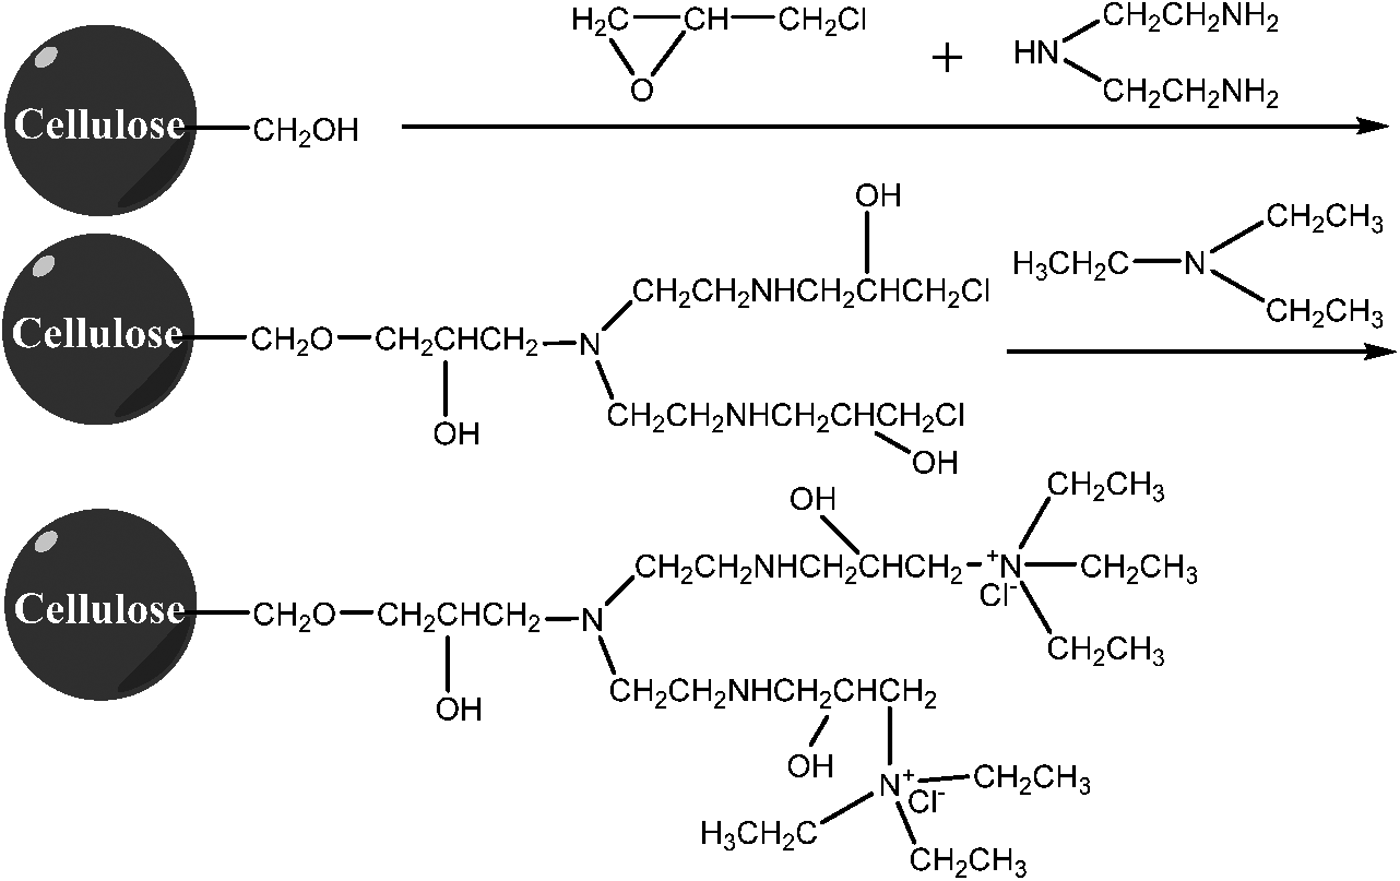
Possible synthesis route of MS. MS, modified sawdust.
Adsorption experiment
A series of U(VI) ion adsorption experiments on the MS was carried out by the batch method. The effect of the adsorbent dose, solution pH, temperature, contact time, and U(VI) ion initial concentration on U(VI) ion adsorption was investigated. A certain amount of MS and 100 mL of U(VI) solution with desired concentration were added to the conical flasks and then shaken at 150 rpm in a temperature-controlled shaker. The desired pH of the suspensions was adjusted by 0.1 M HCl or NaOH solution. Immediately after the suspensions were shaken for the desired time, the suspensions were filtered and the residual concentration of U(VI) was analyzed by the UV spectrophotometer (GB6768-86, 1986). The removal efficiency and adsorption capacity of adsorbent were calculated from the initial concentration (C0) and the equilibrium concentration (Ce) using the following equations:
where C0 is the initial U(VI) concentration (mg/L), Ce is the concentration of U(VI) at the equilibrium time (mg/L), V is the volume of U(VI) solution (L), and m is the mass of adsorbent (g).
Regeneration
Desorption of U(VI) ions were carried out using 0.1 M HCl solution as a desorbing agent. The U(VI) ion-loaded MS was placed in the 100 mL desorption medium at 30°C, with a shaking speed of 150 rpm for 3 h. Then, the samples were washed by deionized water and reconditioned for adsorption in succeeding rounds.
Desorption rate (D%) was calculated by the following equation:
where Wd is the mass of U(VI) (mg) in desorption medium and Wa is the mass of U(VI) (mg) adsorbed on MS.
Characterization
Functional groups of the adsorbent were qualitatively identified by Fourier transform infrared (FTIR) spectroscopy (Thermo). The scanning electron microscopy (SEM) observations and the energy dispersive X-ray (EDX) spectroscopy analysis were simultaneously performed (SEM-EDX; Hatachi S-3000N, Japan). The crystalline phase(s) of each sample was determined with X-ray diffractometer (XRD; Rigaku, Japan).
Results and Discussion
Characterization of RS and MS
SEM-EDX characterization
The images of RS, MS, and MS after adsorption of U(VI) (MS-U(VI)) are shown in Supplementary Fig. S1. When compared with the RS, the surface of MS was obviously rough with irregular and porous pores; this indicates that a heterogeneous grafting layer was formed. A significant change was noticed that the surface of MS-U(VI) was smoother compared with MS; this may be because these cavities were filled with the adsorbed U(VI).
EDX spectroscopy was used to determine the chemical composition of MS and MS-U(VI); the results are shown in Supplementary Fig. S2. It is observed that U element was detected in MS-U(VI) spectrum, while not in MS, which demonstrates that the U(VI) ion was successfully adsorbed onto the MS. These spectrums also reveal that the major constituents of MS are carbon and oxygen with the presence of nitrogen.
XRD characterization
Supplementary Figure S3 shows the XRD patterns of the RS, MS, and MS-U(VI). It is can be seen that the major crystalline peak for RS, which appeared around 2θ = 22°, originated from cellulose crystalline plane 002 (Segal et al., 1959; Bai and Li, 2006; Liu et al., 2006) and shifted marginally to the lower degree after chemical modification. And RS also has a second peak, which appeared around 2θ = 16°, and could be related to the dissociative polysaccharide, it disappeared after modification. These phenomena indicate that chemical modification of RS had damaged the structure of dissociative polysaccharide and increased slightly interplanar spacing. However, the cellulose crystalline body has almost not changed. Compared to the XRD patterns of MS with MS-U(VI), it can be seen obviously that the U(VI) adsorption onto MS did not change the crystalline phase of MS.
FTIR characterization
IR spectra of RS, MS, and MS-U(VI) are shown in Fig. 2. In contrast with the IR spectrum of RS, the increase of some bands, which are related to some groups, was observed in the IR spectrum of MS. The bands appeared at 1,263 and 1,229 cm−1 for MS corresponding to stretching vibration of C–N due to the introduction of the secondary amine group, the tertiary amine group and the quaternary amine group after chemical modification (Gurgel and Gil, 2009; Gurgel et al., 2009; Polowczyk et al., 2016). And the band intensity of C–O at 1,050/cm significantly increased after modification, which is reasonable to assume that most of alcoholic groups in RS had been converted to ether groups.
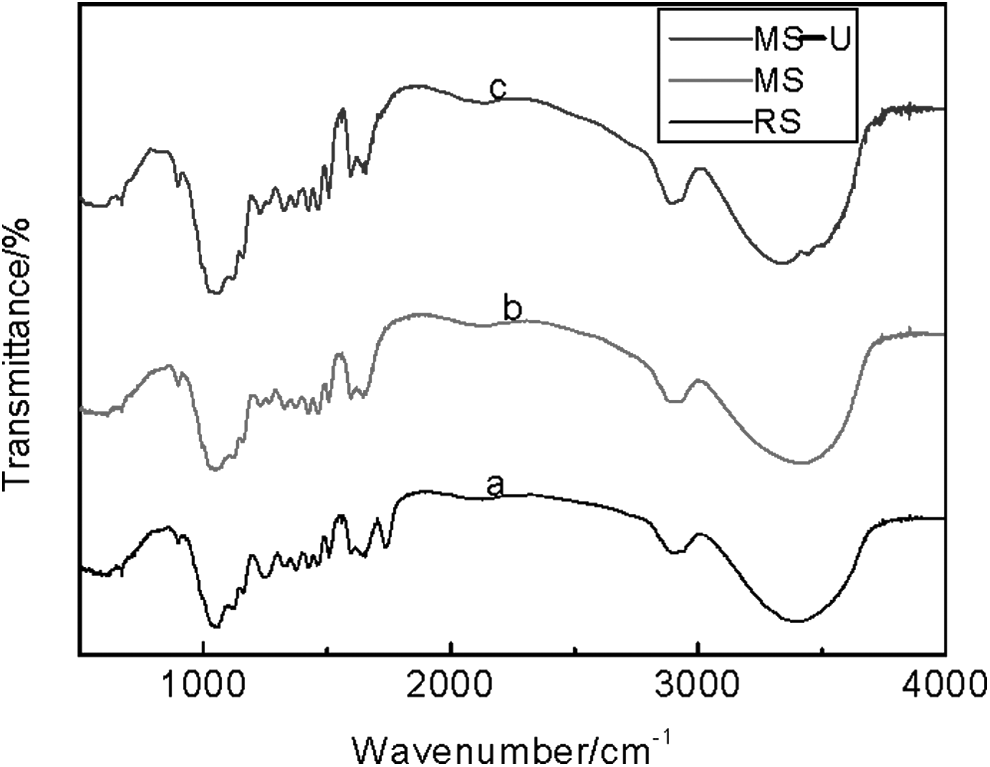
FTIR spectra of RS
For the IR spectra of MS, the broadbands at 3,430/cm represent bonded −OH and −NH groups (Sheng et al., 2004). The bands observed at about 1,263 and 1,229/cm correspond to the C–N stretch. There was clearly a blue shift from 3,430 to 3,334/cm, corresponds to −NH group after U(VI) adsorption onto MS, and the intensity of the C–N band at 1,263 and 1,229/cm slightly decreased, which suggests that the amine groups have taken part in the process of U(VI) adsorption. The analysis suggests that surface amine groups of MS played an important role in U(VI) adsorption.
Adsorption of U(VI) onto MS
Effect of the absorbent dosage
The effect of MS dosage on U(VI) adsorption by MS is shown in Fig. 3. Obviously, the removal efficiency of U(VI) increased rapidly from 63.20% to 99.80%, since the adsorption sites increased greatly, when adsorbent dosage increased from 0.40 to 1.00 g/L. Then, the MS dosage increased from 1.00 to 1.60 g/L and the adsorption efficiency had slightly increased. On the contrary, the adsorption capacity of U(VI) for MS was observed to decrease. This phenomenon could be attributed to unsaturation of the adsorption sites and aggregation of adsorbent resulting from high dosage (Tong et al., 2011). The removal efficiency of U(VI) tended to stabilization, when adsorbent dosage was greater than 1.00 g/L. Therefore, the optimum dose of MS was 1.00 g/L, and this dosage was adopted in the following experiments.
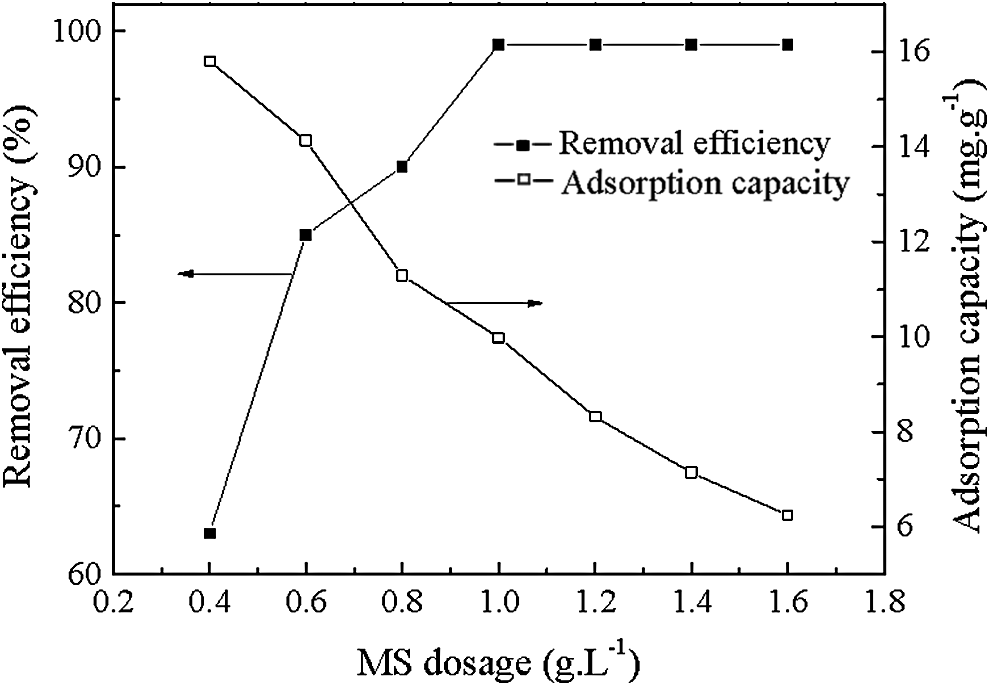
Effect of adsorbent dosage on adsorption capacity and efficiency (initial pH of solution = 5.0, initial concentration of solution = 10 mg/L, temperature = 25°C, contact time = 180 min, and agitation rate = 150 rmp).
Effect of solution pH
One of the crucial parameters that affect the adsorption effect of U(VI) is the pH. In general, some surface functional groups of the adsorbent and the form of metal ion in aqueous solution determine the removal efficiency of metal ion (Gurgel and Gil, 2009). Figure 4 shows U(VI) ion adsorption onto both MS and RS under different pH values. It could be clearly seen that the effect of solution pH on MS and RS was almost the same. The sorption of U(VI) increased rapidly when pH value was below 4, stabilized at pH values between 4 to 5, and decreased slowly when pH value was above 5. At the same time, the adsorption efficiency of U(VI) onto MS was higher compared with RS at pH values from 2 to 7, which is attributed to MS having more amine functional groups to participate with U(VI) ions adsorption by complexation reaction or chelating. As for MS, at low pH values (pH <4), the higher concentration of hydrogen ions could effectively result in fewer ligands being available for U(VI) ion binding (Sheng et al., 2004). The typical dependence of U(VI) ion adsorption on pH implies that the weak basic amine groups of MS could be protonated or partly protonated. Therefore, at low pH values, the binding sites were readily occupied by protons, and this led to a competition between hydronium and U(VI) ions for the free binding sites.
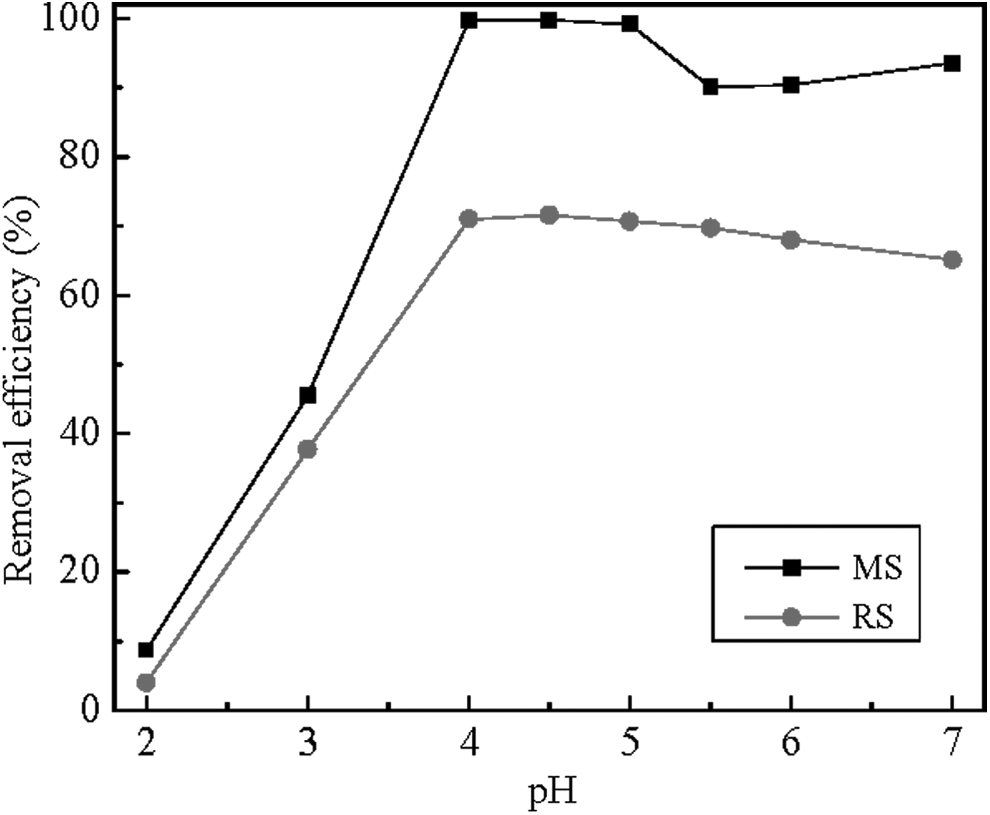
Effect of pH on adsorption (MS dosage = 1.0 g/L, initial concentration of solution = 10 mg/L, temperature = 25°C, contact time = 180 min, and agitation rate = 150 rmp).
With the increase of solution pH (i.e., fewer H3O+), surface groups of adsorbent (MS) became deprotonated; then, more and more ligand groups were available for U(VI) ion binding; meanwhile, the free electron pairs of amine groups were likely increased. In addition, the removal efficiency of U(VI) decreased gently with pH value above 5; this could be explained by both the forms of U(VI) in the aqueous solution and the surface functional groups of the MS. Firstly, the dominant form of U(VI) is UO22+ at pH values less than 5, with the increase of pH value, U(VI) starting to extensive hydrolysis (the percentage of hydrolyzed ions UO2OH+, UO2 (OH)2, UO2 (OH)3−, UO2 (OH)42−, (UO2)3 (OH)5+, (UO2)3 (OH)7− increase) (Roach and Zapien, 2009). Secondly, U(VI)-hydroxide could not well form complex with the amine groups of MS due to the uranyl cations banded with hydroxyl.
Effect of contact time
Supplementary Figure S4 displays the effect of contact time on U(VI) adsorption on the modified (MS) and pristine (RS) sawdust. It can be obviously seen that MS had a higher U(VI) removal efficiency compared with RS for the whole adsorption process. For both MS and RS, the removal efficiency increased rapidly at the first 60 min and subsequently the rate of increase became slow; in the end, the adsorption tended to equilibrium at 120 min for both MS and RS with removal efficiency estimated about 99.7% and 70.6%, respectively. This phenomenon is attributed to that adsorbent had a large number of adsorption sites at the initial stage, and then more and more adsorption sites were occupied until saturation.
Effect of temperature
The removal efficiency of U(VI) as a function of temperature is shown in Supplementary Fig. S5. For both of MS and RS, the removal efficiency increased gently with the rise in temperature, which indicates that U(VI) adsorption onto MS or RS was an endothermic process. Also, the U(VI) adsorption efficiency of 99.7% for MS was higher compared with RS with 72.8%.
Regeneration and reusability
Regeneration and reusable properties of adsorbent are very important for further practical application. The desorption study of adsorbent (MS) was performed by washing with 0.1 M HCl solution and five times adsorption–desorption cycles were carried on; the corresponding results are shown in Fig. 5. It can be deduced that strong acid solution was an ideal strippant for MS-U(VI). It also shows that the adsorption capacities of MS for U(VI) slightly decreased from 99.9% to 86.5% after five cycles. These results indicate that MS has potential to apply in practice.
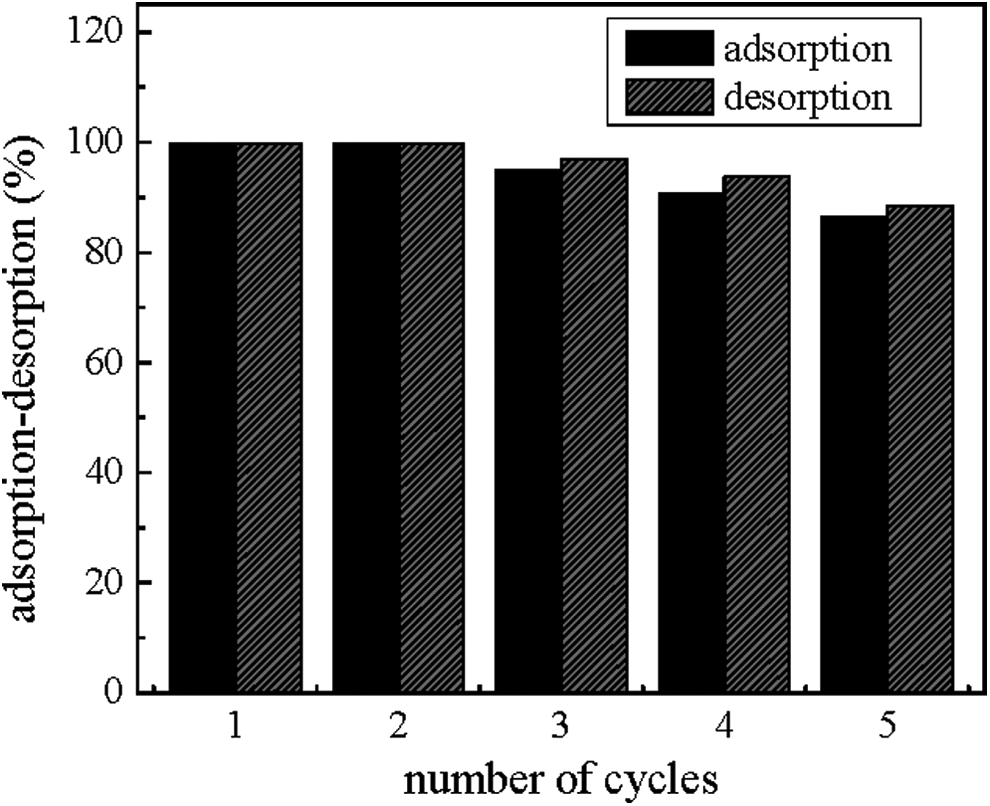
Adsorption and desorption percentages of MS for U(VI) in five consecutive cycles.
Adsorption kinetics
Adsorption kinetics describe the rate of U(VI) adsorption onto MS, and the equilibrium time is controlled by it. In practice, the parameters of adsorption kinetics are very important to design batch adsorption systems. In this study, pseudo-first order model, pseudo-second order model, Elovich, and intraparticle diffusion were applied to elucidate the kinetics of U(VI) adsorption onto MS.
Pseudo-first order model
Kinetic data of adsorption could be well fitted by an exponential decay function, which indicates that the adsorption kinetics were elucidated by the pseudo-first order model (Rout et al., 2015). It is based on the assumption that film diffusion dominates in the adsorption process and can be linearly expressed as follows:
where qt and qe are the amounts of U(VI) adsorbed on MS at time t and at equilibrium (mg/g), respectively; k1 is the pseudo-first order rate constant (/min). The fitting result of this model for U(VI) sorption is shown in Fig. 6a.

Kinetics plot:
Pseudo-second order model
Pseudo-second order model is based on the assumption that adsorption process is chemisorption involving valence forces through exchange or sharing of electrons between sorbent and sorbate (Febrianto et al., 2009). The pseudo-second order kinetics can be linearly expressed as follows:
where k2 is the pseudo-second order rate constant (g/[mg·min]). The fitting result of this model for U(VI) sorption is shown in Fig. 6b.
Elovich equation
The Elovich equation (Oke et al., 2008) is another kinetic equation. It assumes that the surfaces of adsorbents are energetically heterogeneous and adsorbates are neither desorption nor interaction (Sen Gupta and Bhattacharyya, 2011). Elovich equation is in linear form as follows:
where a and b are Elovich equation rate constants (g/mg). The linear plot of qt versus lnt is shown in Fig. 6c. The parameters calculated from pseudo-first order, pseudo-second order, and Elovich equation are shown in Table 1.
As seen in Table 1, the calculated qe obtained from the pseudo-second order model (10.152 mg/g) was more closer to the experimental value (9.978 mg/g) than that from the pseudo-first order model (14.153 mg/g). What is more, the coefficient of determination (R2) of pseudo-second order kinetic model (1.0000) was greater compared with the pseudo-first order model (0.9096). At the same time, the lower correlation coefficient (0.9025) suggested that the experimental data poorly fitted the Elovich kinetic model. Therefore, the adsorption kinetics of U(VI) by MS can be better elucidated by the pseudo-second order kinetic model, which indicates that the process of U(VI) adsorption onto MS is chemisorption.
Intraparticle diffusion model
To further study the diffusion mechanisms, the kinetics data are analyzed by the intraparticle diffusion model (Wang et al., 2006). In general, the adsorption process of porous adsorbent will have a multistep diffusion process. These steps include the transport of adsorbate, film diffusion, intraparticle diffusion in the pores and in the solid phase, and finally adsorption on the sites (Ngah and Fatinathan, 2008). The amount adsorbed (qt) is proportional to the square root of time (t1/2), as per the relationship given by Weber and Moris (1962):
where k3 is intraparticle diffusion rate constants (mg/[g.min1/2]). According to the model, if the diagram is a straight line, then the intraparticle diffusion dominates the adsorption process, but if the diagram displays multilinear plots, such plots indicate that there were two or more steps of diffusion process for the adsorption process. The intraparticle diffusion plot is shown in Fig. 6d.
As can be seen from Fig. 6d, the plot for U(VI) adsorption exhibited a piecewise-linear pattern with three different gradients. It indicates that three steps of diffusion process took place for U(VI) adsorption onto MS: (i) the instantaneous adsorption or external surface adsorption; (ii) the gradual adsorption stage or intraparticle diffusion, which the adsorbates got through to the mesopores and micropores was a rate-limiting step; and (iii) the final stage where the adsorption started to reach equilibrium(Chen et al., 2014; Wang et al., 2015). The straight line of the second stage did not pass through the origin, indicating that the intraparticle diffusion was not the only rate-limiting step for the whole adsorption process and chemical complex reaction might be involved.
Adsorption isotherms
Adsorption isotherm is significant to comprehend the interaction between ions or molecules of adsorbate and surface active sites of adsorbent, and optimize the use of adsorbent. Typically, 100 mL of U(VI) ion solution with different initial concentrations from 15, 25, 35, 50, 60, 70, 80, and 90 to 100 mg/L was stirred for 120 min at different temperatures (298, 308, and 318 K), and the other parameters such as 100 mg MS and pH of 4.5 were kept constant. The adsorption capacity of MS versus the equilibrium concentration of U(VI) in solution under different temperatures is shown in Fig. 7. Clearly, the U(VI) adsorption capacity enhanced with the increase of the initial U(VI) concentration.

Adsorption isotherm of U(VI) onto MS at three different temperatures.
To describe the behavior of U(VI) adsorption onto MS, Langmuir and Freundlich isotherm model were applied in this study. The Langmuir isotherm model is employed to describe the irreversible homogeneous monolayer adsorption, while the Freundlich isotherm model assumes a heterogeneous adsorption process (Hadi et al., 2015). The experimental data of isotherm were analyzed by Langmuir and Freundlich equation as follows:
where qe is the adsorption capacity of the adsorbent (mg/g); qm is the maximum adsorption capacity of the adsorbent (mg/g); Ce is the equilibrium concentration of the adsorbate in the solution(mg/L); KL is the Langmuir constant (L/mg); KF is the Freundlich constant; and 1/n is the heterogeneity factor. The parameters of Langmuir and Freundlich equation are presented in Table 2.
Results show that the Langmuir model is preferable to the Freundlich model in simulating the adsorption experiments. This indicates that U(VI) adsorption onto the MS surface is homogeneous monolayer adsorption. The maximum adsorption capacity (qm) of MS increased from 46.95 mg/g at 293 K to 63.69 mg/g at 313 K, demonstrating U(VI) adsorption as an endothermic process.
Adsorption thermodynamics
The thermodynamic parameters such as enthalpy change (ΔH°), entropy change (ΔS°), and Gibbs free energy change (ΔG°) for U(VI) adsorption were calculated using the Gibbs free energy equation and the linearized Van't Hoff equation (Zhang et al., 2010) as follows:
where ΔG° (kJ/mol) is the change of free energy, ΔH° (kJ/mol) is the change of enthalpy, ΔS° (kJ/mol) is the change of entropy, T (K) is the absolute temperature, R is the ideal gas constant (0.008314 kJ/[mol·K]), and K is the dimensionless equilibrium coefficient. The sorption equilibrium constant K was calculated by plotting lnKd versus Ce and extrapolating Ce to zero, and dimensionless K value was obtained by multiplying K value by 1,000 (Milonjic, 2007; Yang and Jiang, 2014):
The plot of ΔG° versus T is shown in Supplementary Fig. S6; the thermodynamic parameters ΔH° and ΔS° were evaluated from the intercept and slope of the linear plot and are listed in Table 3.
The ΔG° values are negative for U(VI) adsorption onto MS at all the different temperatures and indicate that the adsorption process was spontaneous. More importantly, the positive ΔH° value indicates that U(VI) sorption onto MS is an endothermic process, which means the adsorption capacity of MS would be increased when the temperature went up. This also suggests that U(VI) adsorption on MS was mainly chemisorption mechanism (Zhao et al., 2015), which might be ascribed to the chelation of amine groups of MS. The ΔS° value of the adsorption process is positive, which indicates increased randomness at the solid–liquid interface in the adsorption process of U(VI) onto MS. This is presumably due to the free molecules increased at the solid–liquid interface (Gupta et al., 2009; Velickovic et al., 2012).
Conclusions
In this work, the adsorbent (MS) containing amine groups was successfully synthesized through the reaction between RS, DETA, and TEA. The U(VI) ions removed from aqueous solution by MS were found to be effective and economic. A maximum removal efficiency of 99.7% was observed at the conditions of an adsorbent dose of 0.1 g, contact time of 2 h, pH 4.5, and temperature 30°C. Compared with RS, the U(VI) removal efficiency for MS increased by 26.9%. The adsorption process of U(VI) on MS followed the pseudo-second order kinetic model and intraparticle diffusion was not the only rate-limiting step. Equilibrium data demonstrate that adsorption of U(VI) onto MS was fitted well with the Langmuir isotherm model, implying that the process was homogeneous monolayer adsorption. Thermodynamic studies indicate that the adsorption of U(VI) onto MS was a spontaneous and endothermic process. The U(VI) ion combined with amine groups of MS through strong complexation, as the result of EDX and FTIR analyses. All these results suggest that the prepared MS has great potential in treating uranium-contaminated water.
Footnotes
Acknowledgments
This work was supported by the National Natural Science Foundation of China (51174117) and the Innovation Platform of Open Fund Project for Universities in Hunan Province (15K106).
Author Disclosure Statement
No competing financial interests exist.
References
Supplementary Material
Please find the following supplemental material available below.
For Open Access articles published under a Creative Commons License, all supplemental material carries the same license as the article it is associated with.
For non-Open Access articles published, all supplemental material carries a non-exclusive license, and permission requests for re-use of supplemental material or any part of supplemental material shall be sent directly to the copyright owner as specified in the copyright notice associated with the article.