
Abstract
Abstract
The research herein focused on the first step of the phenomena of surface cleaning by hydrogen peroxide and advanced oxidation treatment, namely chronicling preferential accumulation of nanometer-scale gas bubbles at the solid–residue interface. To demonstrate this phenomenon, the authors coated asphalt onto a glass slide, then immersed the slide in 3% hydrogen peroxide (H2O2) at pH 9, then projected laser light against the opposing side of that glass slide at an angle. As a significant original contribution to science, nanoscale surface imaging quantitatively detected H2O2-induced bubbles that had 70–400 nm dimensions; and it revealed that these bubbles congregated along 50–80% of the asphalt coating's fringe. Tests further showed that when H2O2 and O3 dosing was followed by cavitation and ultrasonics, organic coatings abruptly dislodged from silica grains. With the high resolution of this Surface Imaging Spectroscopy, this laser apparatus could discern between (a) the clear glass slide, (b) regions of asphalt adhesion to the glass, (c) infinite air, and (d) most significantly, regions where nanoscale gas bubbles congregated under the lip of asphalt's fringe. Microscopic cleaning process of the removal of asphalt from a glass surface has been observed directly. The authors have proposed the removal mechanism to be due to the formation of gas bubbles at the interface that accumulate underneath the edges of the asphalt coating. This accumulation eventually assisted the removal by prying the asphalt coating off the surface as the formation and reaction progressed along the interface.
Introduction
I
Cavitation occurs when rapid changes of pressure occur in the flow field of moving water, and cavitation can be induced by hydroacoustics or ultrasonics. Cavitation bubbles are formed in the low pressure regions (Mason and Peters, 2002). Then the subsequent explosive collapse of these cavitation bubbles release intense energy at the local nanoscale, and this phenomenon is key for separating residues from a grain surface. The local temperatures that can be produced as a result of cavitation bubble collapse can be as high as 4000–5000°K at the local nanoscale, whereas the pressures can be as high as 1700 atm at the local nanoscale (Flint and Suslick, 1991; Didenko et al., 1999). Also, cavitation of water generates the hydroxyl radical (HO•) (Flint and Suslick, 1991; Didenko et al., 1999). This highly reactive radical plays an important role in the breakdown of any organic compounds that may have coated the surfaces of clay and sand particles; and this consequently enhances the effectiveness of the separation process (Kalumuck and Chahine, 2000; Abdelraheem et al., 2015, 2016).
Yet others have observed that advanced oxidants produce radicals and highly oxidizing compounds that degrade organic compounds in solution. Ozonation, when coupled with ultrasonics and/or cavitation, yields more hydroxyl radicals than does mere ozonation (Milan-Segovia et al., 2007). Also, HO• radicals result from decomposing ozone within a cavitation region (Mason and Lorimer, 2002). Ultrasonics and cavitation have also been deployed in water treatment: Matilainen and Sillanpaa (2010) observed that ultrasound significantly reduced membrane fouling that was otherwise caused by natural organic matter (NOM) adhering to the membrane surface. Moreover, a high dose of H2O2 plus O3 diminished NOM by 78% and assimilable organic carbon by 50%. Cheng et al. (2016) reported that ozonation efficiently degraded polychlorinated biphenyls in freshly spiked soils. Petit et al. (2015) studied the combination of ultrasound, microbubbles, and cavitation for the degradation of fibrin when lysing blood clots in the human body. In their study, they introduced radiolabeled fibrin into human blood clots, and then exposed the clots to an array of ultrasound, phospholipid microbubbles, and doses of recombinant tissue plasminogen activator (rtPA). This combination enhanced fibrin degradation significantly (66%) compared with rtPA alone (52%). Rayaroth et al. (2016), Zupanc et al. (2014), and Gogate and Patil (2015) surmised that cavitation could mineralize pharmaceutically active compounds, when using a very high level of cavitation. Czaplicka et al. (2013) applied ozone oxidation and photo oxidation with ozone to industrial wastewater that had been generated in the process of wet dedusting of shaft furnace gases. These AO processes removed a third to half of the organic substances.
In all of the above water and wastewater treatment studies, the authors had to resort to very high doses of H2O2 and ozone and very intense levels of cavitation to decompose the targeted organic compounds, even while the targeted compounds appeared at very low concentrations, relative to natural organic compounds, in the municipal water and wastewater applications.
However, when the principles of AO are applied in a foundry setting, the aim of the process instead focuses on separating coatings from surfaces, and this requires less AO dose than would be needed to fully mineralize target compounds in water. Our team found, for example, that a mixed consortium of advanced oxidants will remove organic residues from foundry clay surfaces, after these residues coated onto clays following the pyrolysis of coal that had been mixed with the clay (Wang et al., 2005). Following advanced oxidant cleaning, the clay surface could uptake as much water vapor or methylene blue as pristine clay could.
Furness-Newburge has developed their Sonoperoxone® and Pneu-Col® processes that use H2O2, ozone, cavitation, and ultrasonics. These novel systems have been installed on more than 50 foundry lines that have the capacity to produce 10% of America's iron castings. In these full-scale foundries, this process has diminished clay, coal, and sand use by 25–35%; and they have also diminished foundry hazardous air pollutant emissions by 50–75% (Andrews et al., 2000; Neill et al., 2001; Land et al., 2002; Glowacki et al., 2003; Goudzwaard et al., 2003; Wang et al., 2006; Fox et al., 2007, 2008a, 2008b). These savings can represent hundreds of thousands of dollars per year per foundry. These savings correspond to several percent of a foundry's overall operating costs (Torielli et al., 2014).
In the foundry and coal processing setting, the primary objective has been to dislodge viscous asphalt-like materials from sand and clay surfaces, or detach silts from coal fines. Although AO and hydroacoustic cavitation (HAC) have been implemented extensively in the foundry industry, the underlying principle for its effectiveness, relative to gas microbubble formation and cavitation, had not previously been studied experimentally; particularly when dislodging adhered material from solid surfaces. The novel aim of the work herein has been to fundamentally study and visually appraise the extent to which H2O2 caused nanobubbles to form at the solid–coating interface.
Thus, to appraise the first step in this detachment mechanism, the authors herein employed a Surface Imaging Spectroscopy technique, while using H2O2 to clean glass slides that were coated with asphalt. Thin flat Pyrex glass was used as the surrogate for silica sand because the glass was made of silica just as the silica grains were, and hosted similar surface properties and adhesion phenomena. Also, the spectroscopy apparatus could usefully discern surface imaging through this transparent glass, whereas this could not be achieved through an irregularly shaped silica grain. Asphalt was used as a surrogate for the tar-like organic residues that accumulate on sand grains when foundry green sand is heated, because asphalt hosts many of the same physical and chemical properties.
With this imaging apparatus, the authors appraised the hypothesis that H2O2 dislodges viscous asphalt-like materials from silica surfaces, at least in part, as the H2O2 reacts with the asphalt—especially at this stressed interface, and in the process mineralizes a small fraction of the asphalt into CO2 gas bubbles. Also, the H2O2 can directly decompose into the gases O2 and (theoretically) H2 (Mason and Lorimer, 2002; Mason and Peters, 2002). The gases could be generated at the edge of the asphalt coating or at the defects of the coating, where H2O2 has penetrated through to the asphalt–glass–solution interface; and the gases could preferentially accumulate at this interface. In full-scale applications, the authors further reasoned that once these nanoscale compressible bubbles congregated at this interface, the intense pressure oscillations of ultrasonics and/or cavitation could explode the bubbles, and this force could tear asphalt and tars away from the silica glass or grains.
The key objectives of the Surface Imaging Spectroscopy experiments and the pilot test herein have been to (a) test the first step for these hypotheses, namely that gas was indeed congregating at the asphalt–glass–solution interface, and to (b) visually demonstrate in a pilot unit how dramatically a combined AO process can dislodge tar-like residues from sand grains when processing spent foundry green sand.
Experimental
Materials
An in-house, custom-made, cylindrical Pyrex-glass sample cell was designed to facilitate the experiments. This sample cell hosted an inner tube with an opening of ¾ inch in diameter, which was enclosed by an outer tube that was used for heating water circulation (Fig. 1). Precleaned microscope slides, of dimension 1″ × 3″ × 1.2 mm, were obtained from Becton Dickinson Labware, Franklin Lakes, NJ.
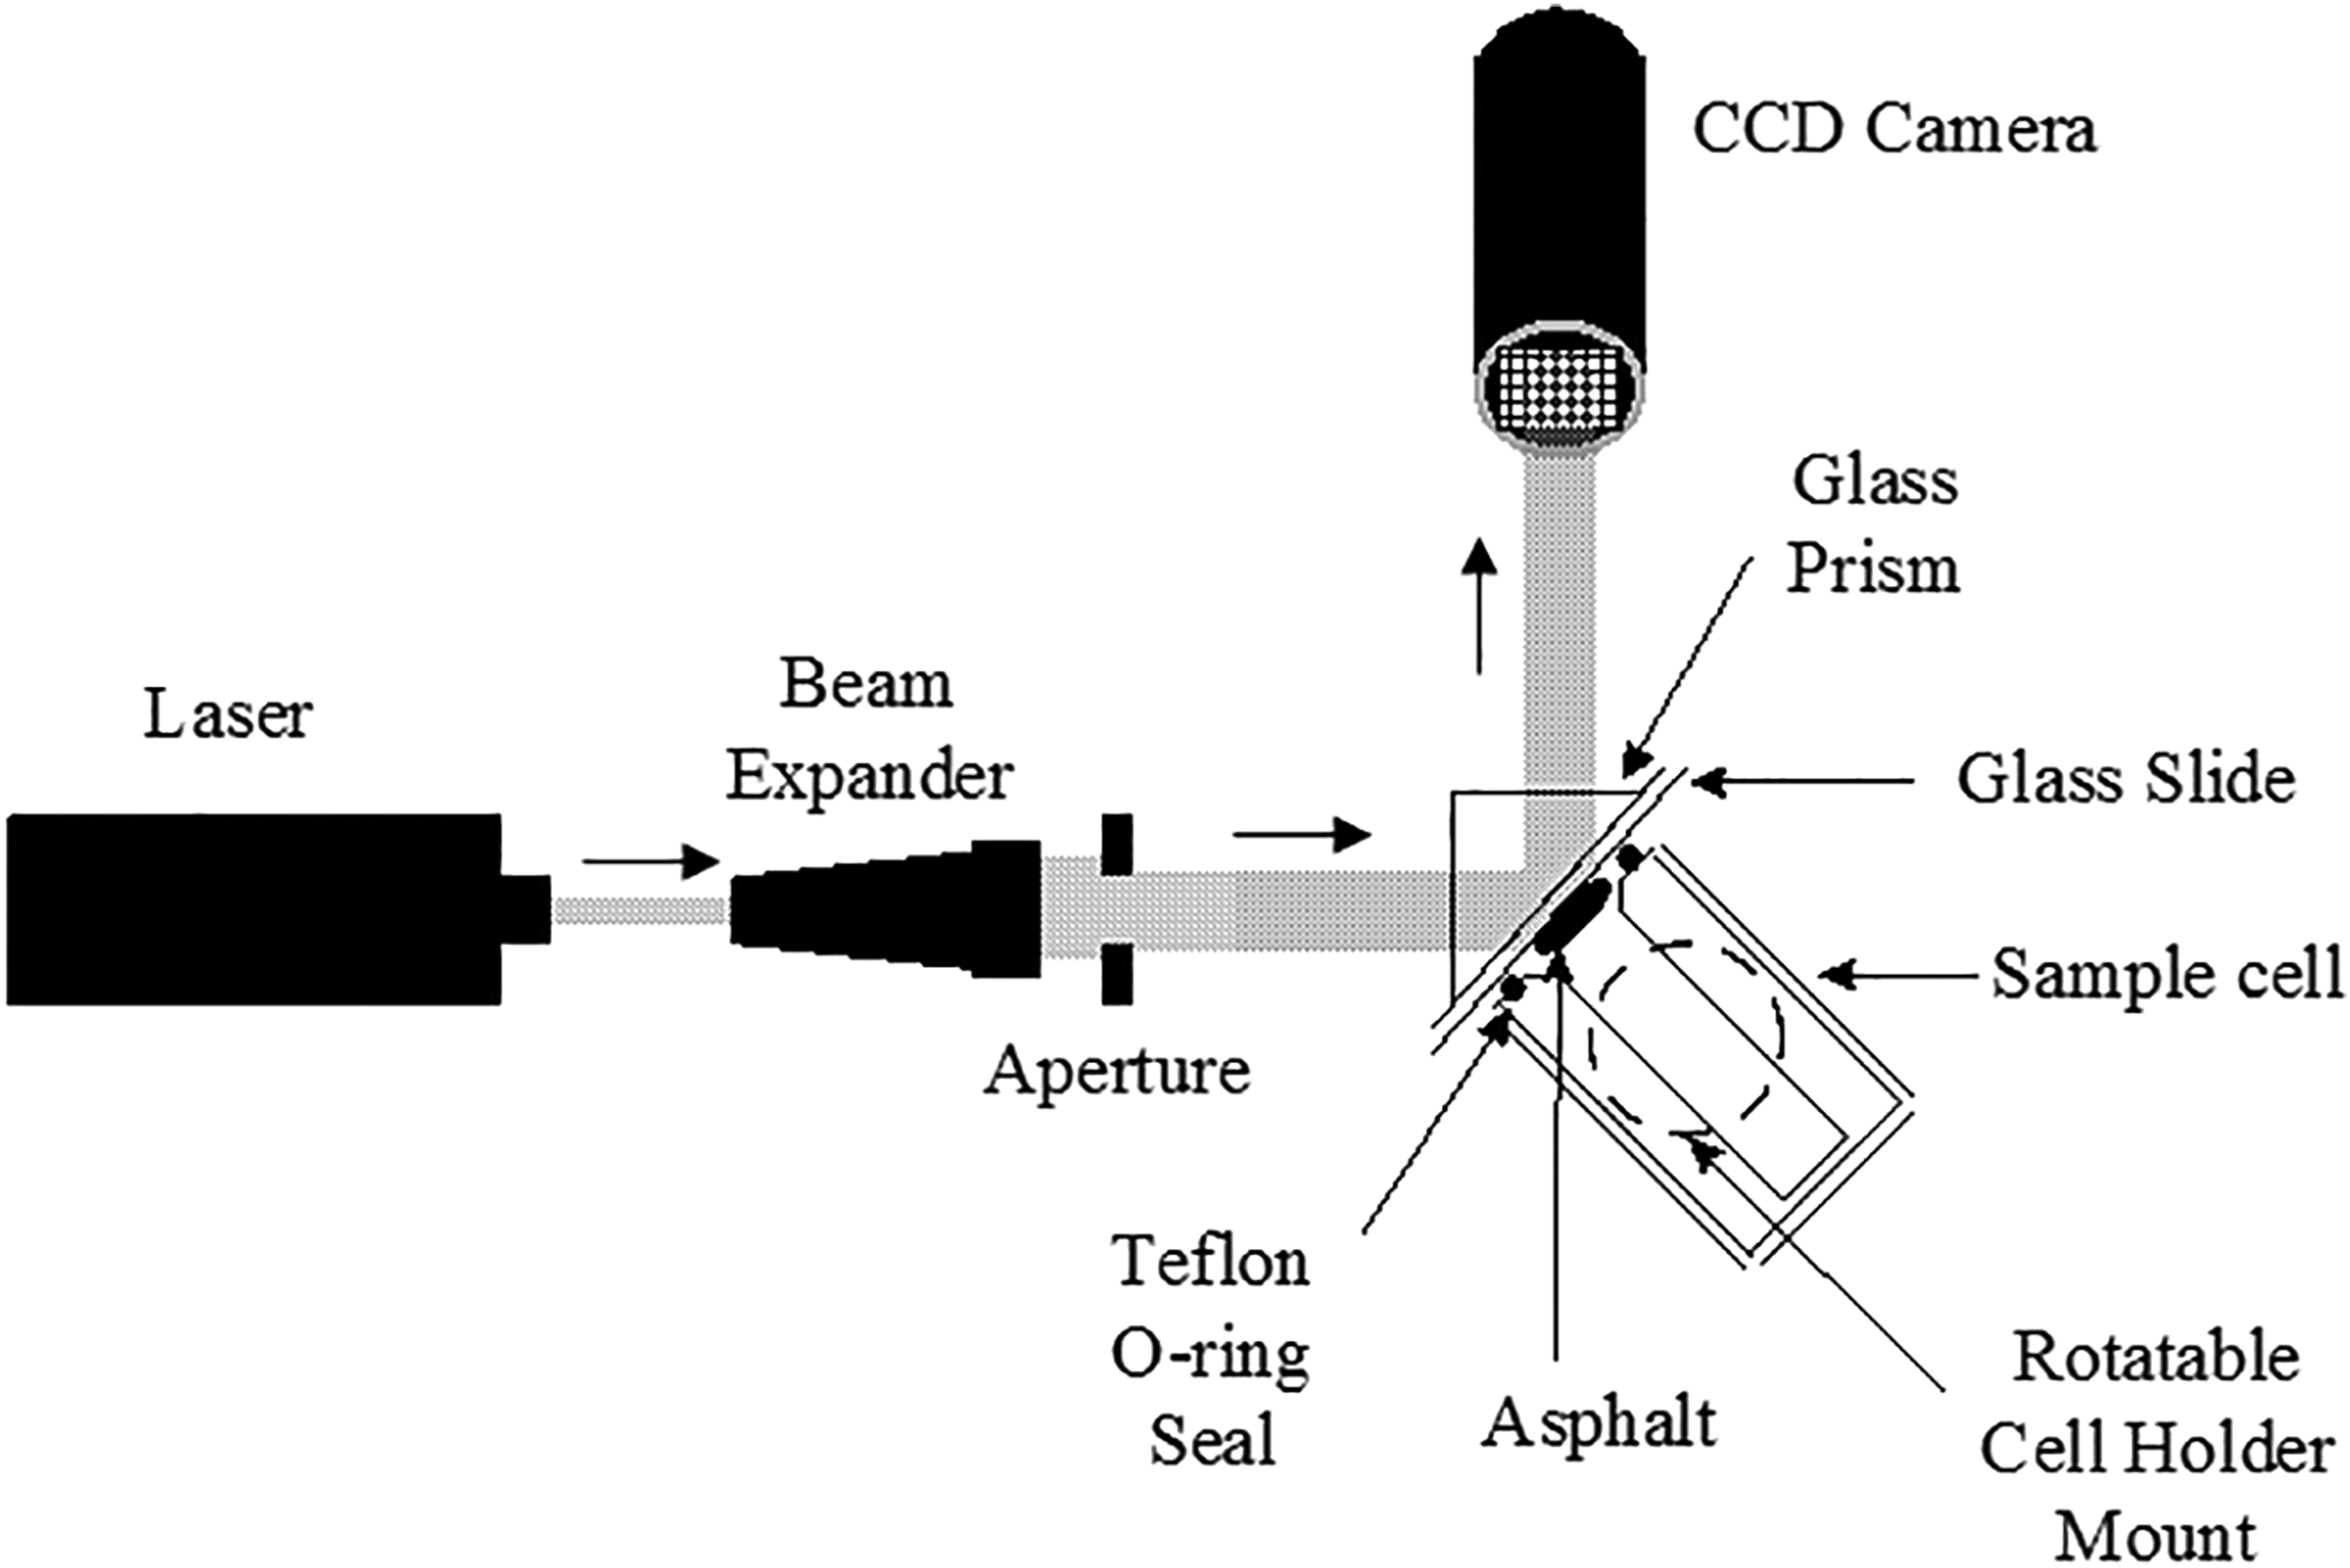
Schematics of Surface Imaging Spectroscopy Assembly.
The incident beam was generated by a low-power, high-stability, He-Ne laser (Melles Griot). It had a maximum output of 5 mW at a wavelength of 632.8 nm. The reflected beam was captured by a monochrome, ½″ interline transfer, charge-coupled device (CCD) digital camera that had a minimum sensitivity of 0.2 lux. The CCD camera's window had a dimension of 6.4 × 4.8 mm, and it had 510 (H) × 492 (V) pixels. Each pixel had a horizontal length of 12.7 μm and a vertical height of 9.8 μm. The CCD camera was connected to a computer through a video capture card for images/data collection and storage. The glass prisms were made of BK-7 Schott glass, with a refractive index of 1.515 at 632.8 nm. The camera, glass prisms, and a beam expander (20 × ) were obtained from Edmund Scientific Co. Roofing Asphalt (Premium Liquid Roof Coating, Fibred, 1995 vintage) was obtained from Agway, Inc., Syracuse, NY, and used as received.
Experimental procedures
Asphalt was applied to the center of a glass slide using a brush to form a thin coating of about 1 μm (10,000 nm) thickness, that is, as thin as possible. This layer may have had inherent variations in thickness. The asphalt was dried in a vacuum oven for ∼1 h to allow for longer experimental times and thus sharper unequivocal nanobubble images than if it was fresh. The breadth of the dried coating was ∼3/8″ to ½″ in diameter. The asphalt-coated glass slide was then coupled to the glass prism using an optical coupling agent. The prism/slide assembly was attached to the opening of the sample cell's inner tube through a Teflon O-ring seal, with the asphalt coating facing inward (i.e., on the side of the glass slide that was opposite from the laser light incidence). Next, the incident laser was aligned at a 60° angle of incidence onto the backside of the asphalt-coated slide. The CCD camera was then aligned to catch the reflected beam. The laser beam size was adjusted using an aperture so that the maximum number of detector pixels could be used. This protocol built on similar beam-monitoring protocols was devised by Fisher et al. (1999, 2002) and Hooper et al. (1999).
The laser beam was targeted at the fringe of the asphalt coating, so as to allow observations at the glass–asphalt–solution interface. The sample cell was then filled with water and heated to the desired temperature. After the desired temperature of 70°C was reached, concentrated H2O2 and NaOH solution was injected into the cell to achieve 3% H2O2 and pH of about 9. The pH 9 and 70°C were chosen because this was close to the more favorable cleaning condition (of pH 9.5 and 70°C) found by Zhang and Cannon (1999), while also offering clear, clean, unequivocal images. The data collection was started immediately after introducing the H2O2 solution into the cell. Typically, data collection was performed at approximately five frames per second. The entire experimental process was also monitored on a television set. With this (intentionally somewhat slow acting) chemistry formula, virtually all of the asphalt became dislodged from the glass surface over the course of about an hour.
The authors monitored the contact angle between the asphalt and glass surface by directing the same CCD camera at the side-view edge of the glass–asphalt interface (Fig. 2). The changes in the asphalt–glass contact angle were then recorded over time.
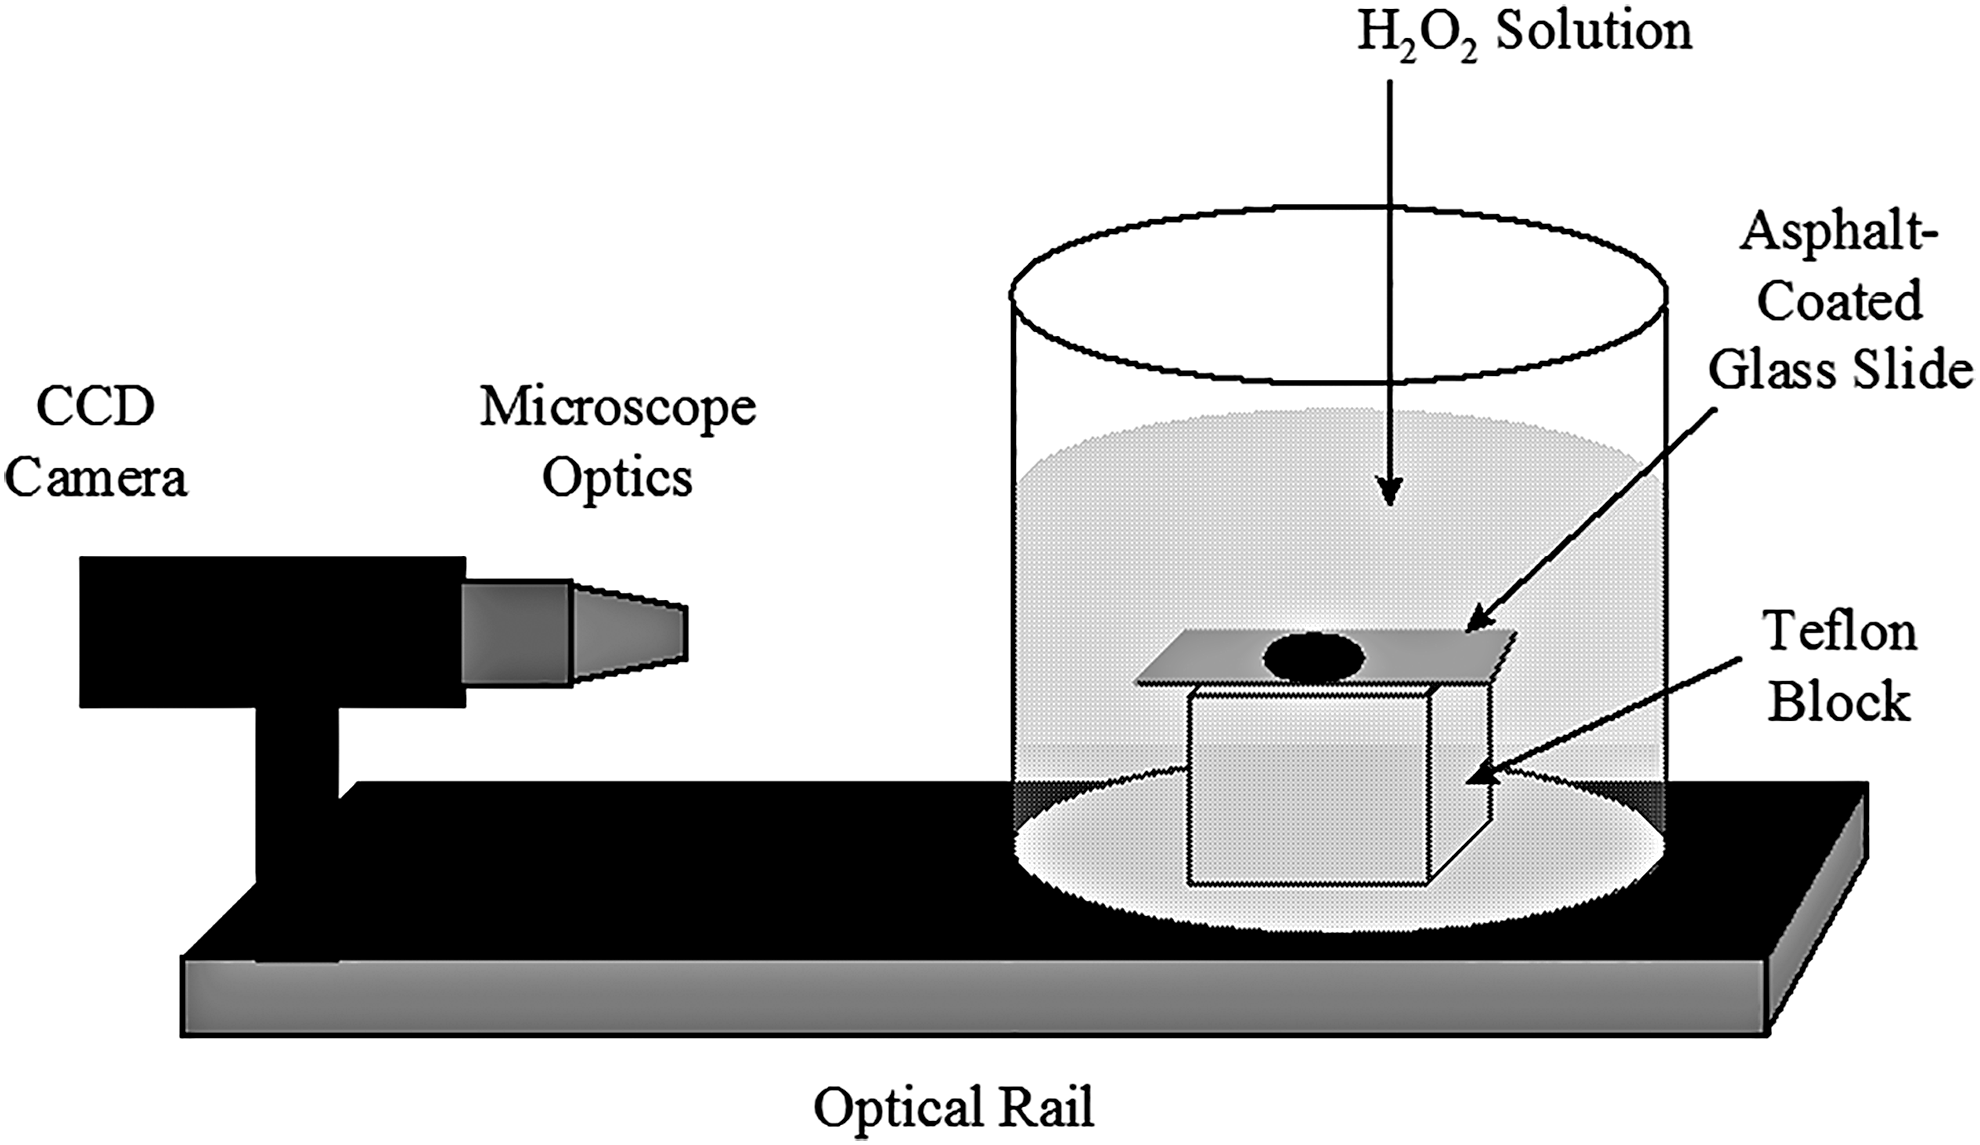
Schematics of the contact angle measurement assembly.
The authors employed Surface Imaging Spectroscopy to monitor the progression of asphalt removal from a glass surface. By this protocol, a laser beam impacted a glass slide from the underside, that is, the opposite side from where the asphalt was coated on the glass. This apparatus distinguished between (a) regions of asphalt coating, (b) clean glass surface, (c) regions where gas pockets had become wedged between the glass and the lip of the asphalt coating, and (d) regions with infinite air (i.e., large air pockets).
Schematics of the Surface Imaging Spectroscopy setup are shown in Fig. 1. The laser beam was initially expanded to produce a larger uniform beam through a beam expander. The laser beam was then attenuated with neutral density filters in the cases when the reflected beam produced detector (camera) saturation. An aperture was also used to tailor the expanded laser beam to a suitable size. When the beam passed through the glass prism, it was reflected off the backside of an asphalt-coated glass slide and captured by a CCD camera. The slide was affixed to the glass prism using an optical coupling agent (n = 1.48 and 632.8 nm). The sample cell's outer tube was connected to a temperature-controlled water recirculator (Neslab) with an accuracy of ∼± 1°C. The sample cell and prism were mounted on a rotation stage that allowed the laser angle of incidence to be adjusted. The images of the reflected laser that were captured at the CCD camera were stored on the computer as movies (AVI video files). Data collection of up to 15 frames (images) per second was possible during the experiment. Real-time images were also monitored directly on a separate television set that was connected to the output port of the video capture card.
Surface Imaging Spectroscopy is a surface-sensitive imaging technique based on the refractive index (optical constant) property of a medium. The Surface Imaging Spectroscopy technique functions by exploiting the optical behavior of the interface while monitoring the reflected light. The amount of reflected light is dependent upon the angle of incidence, the wavelength of light used, and more critically, the refractive indices of the two media present at the interface. Specifically, when an incident beam of a fixed wavelength is passed from a medium with a higher refractive index to a medium with a lower refractive index at a fixed angle of incidence, the intensity of the reflected light from the interface will increase with decreasing refractive index of the second medium. The incident beam typically has a penetration depth beyond the interface into the second medium that is a fraction of the wavelength of light used. Hence, this Surface Imaging Spectroscopy technique is very sensitive to any changes to the refractive index at the interface—indeed, sensitive to within a few hundred nanometers when visible light is used as the incident beam. Furthermore, the reflectivity curves (i.e., the changes in intensity of the reflected light as a function of the angle of incidence) of an incident beam for a specific medium can be simulated by using a model algorithm developed by Parikh and Allara (1992), and built on the work by others (Yeh, 1988; Hietpas, 1997).
Figure 3a shows such an angle-dependent simulation of the reflectivity curve for a He-Ne laser that was traveling through a glass prism and reflecting off a prism face that is in contact with water on its underside. When the laser interacts with the glass–water interface, the light can be reflected (as shown in the figure), or it can refract and pass into water, with both intensities being angle dependent. No amount of the light is absorbed by water. As shown in Fig. 3a, all of the light refracts at incident angles less than ∼55° (where 90° = grazing), and is not observed at the detector. Between 55° and 62°, the light begins to reflect from the interface, whereas total internal reflection occurs at an angle of ∼62° and greater.
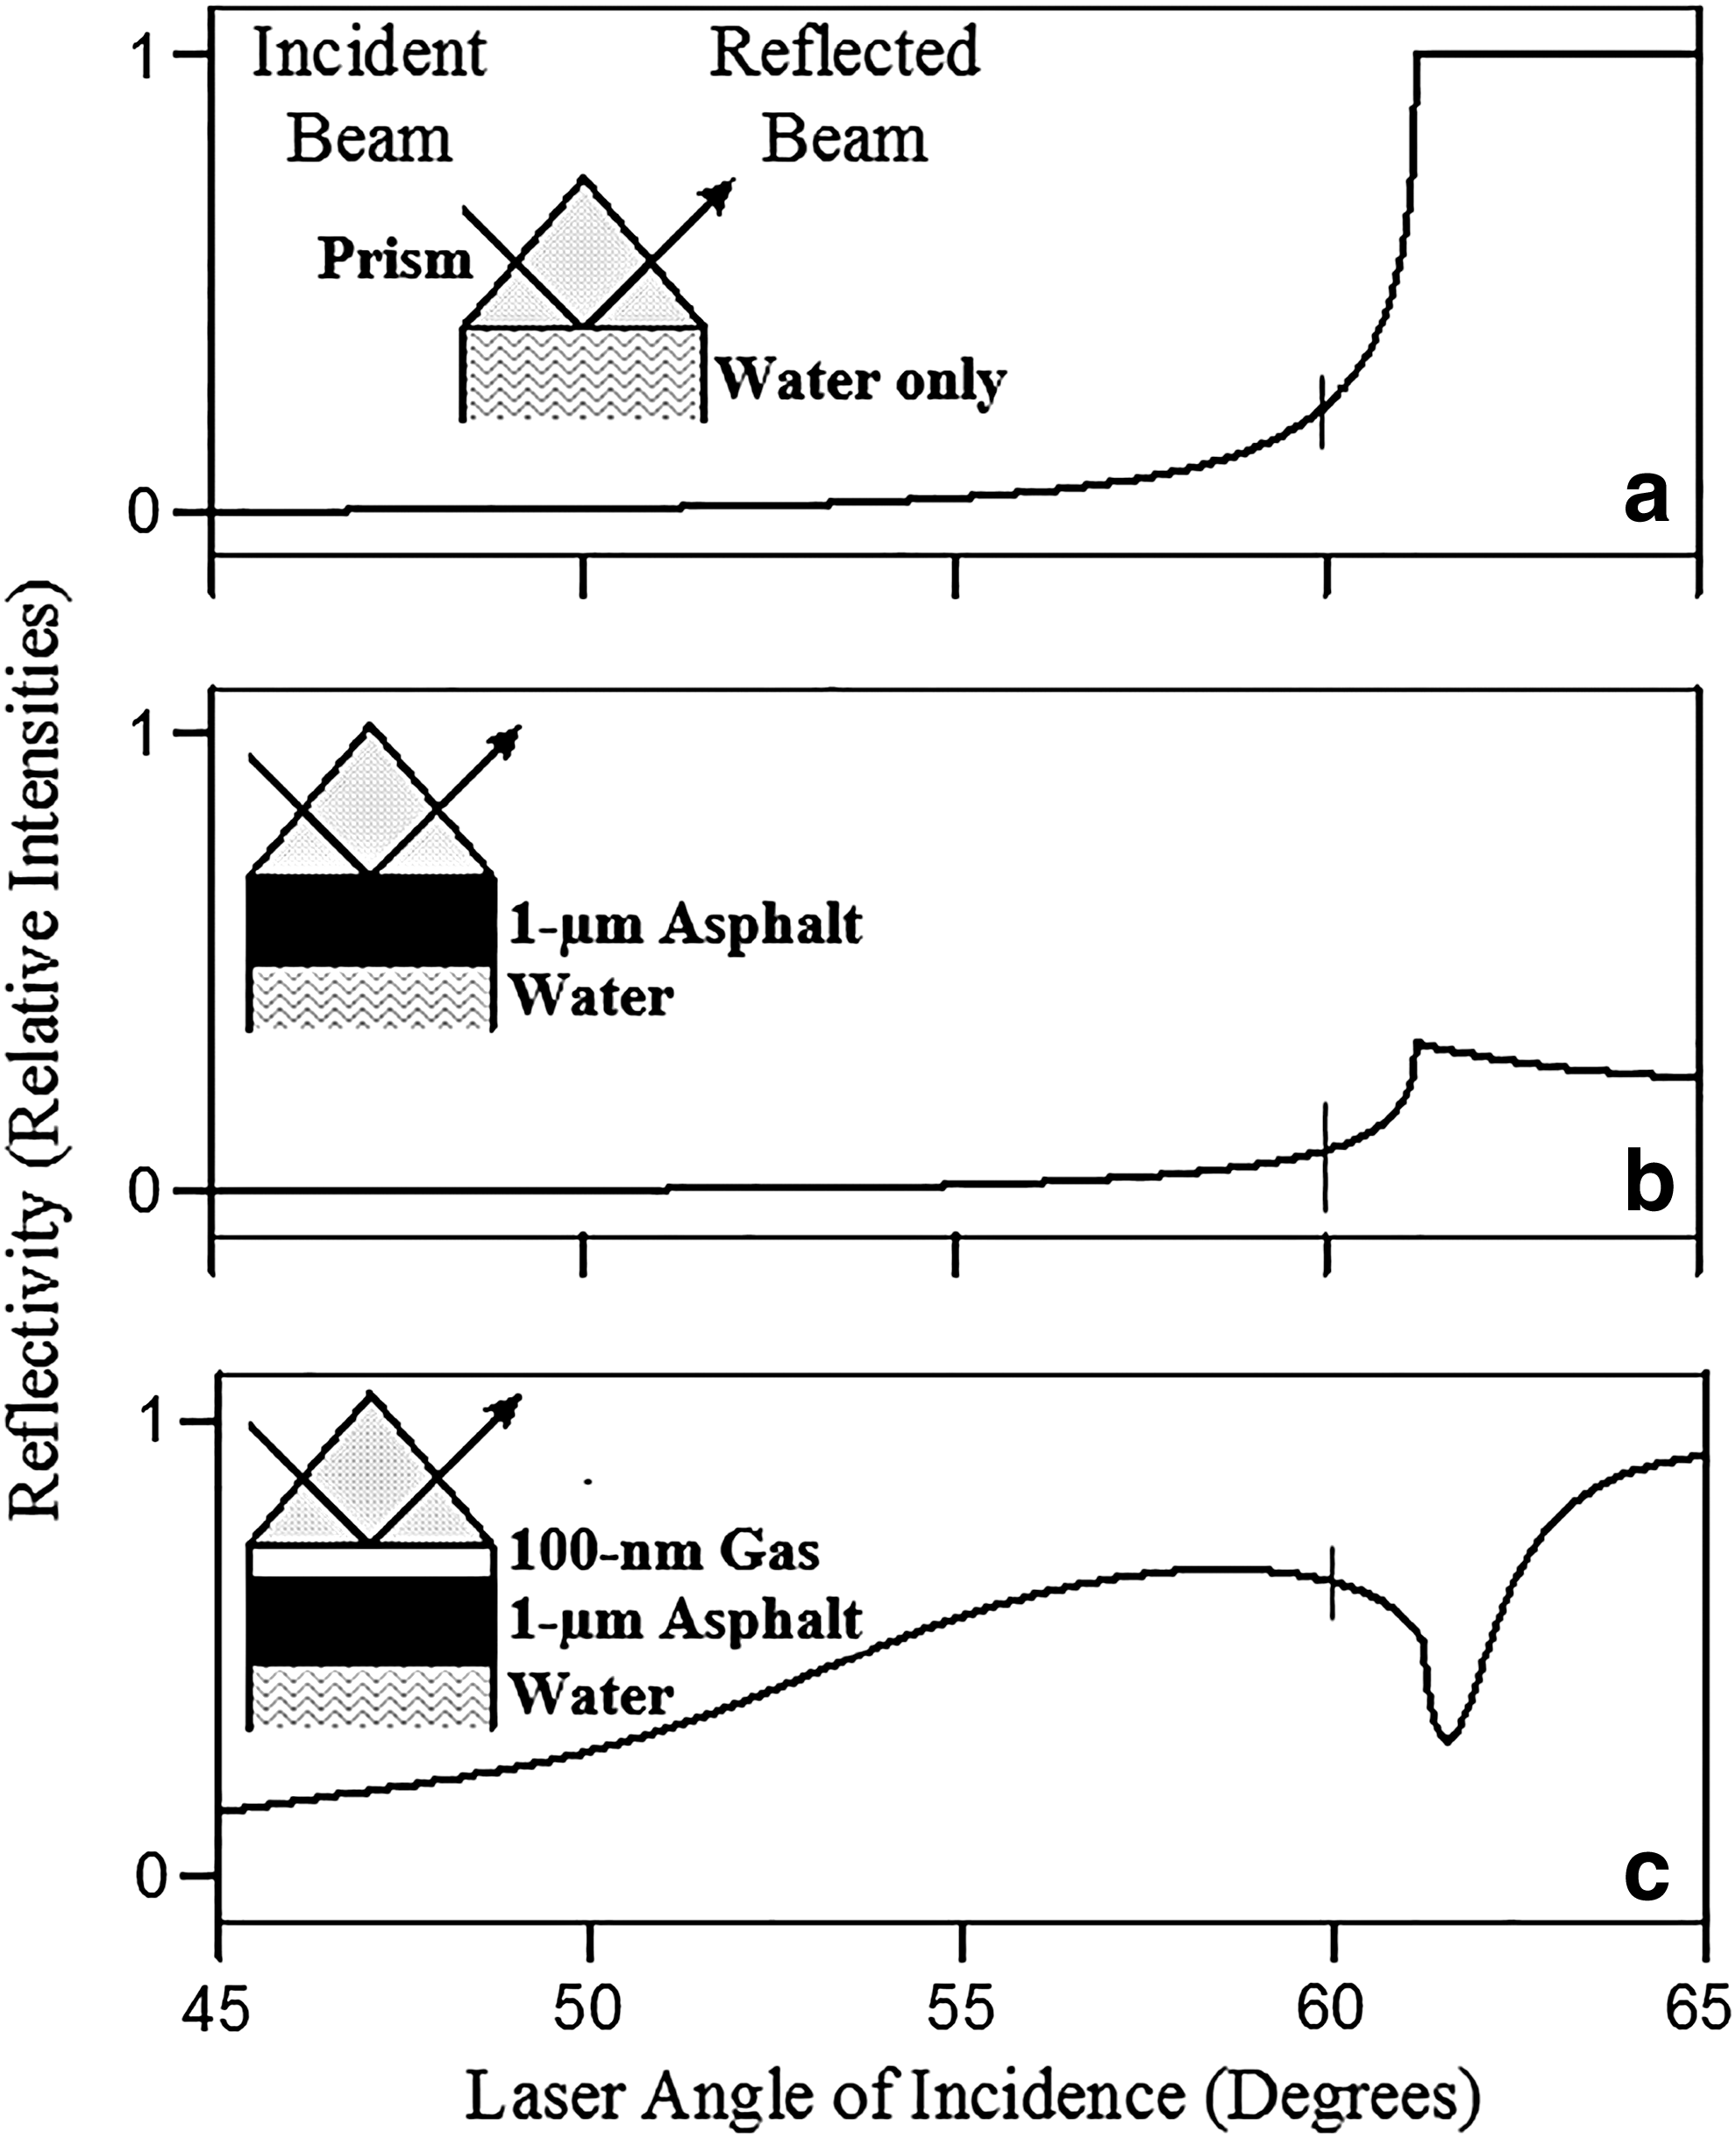
Simulated reflectivity curves. A He-Ne laser reflected at the interface of a glass prism and
Figure 3b shows how this reflectivity curve is altered when a 1-μm-thick layer of asphalt is applied to the glass surface. Since asphalt absorbs some of the light, the reflectivity curve is affected by this behavior, as shown in the figure. Finally, Fig. 3c demonstrates the shape of the reflectivity curve with a 100-nm-thick gas bubble layer simulated between the asphalt and the glass prism. By comparing these three curves, it is observed that a wide reflectivity variation occurs at ∼60° incident angle, and that dramatically different surface images will be detected for these three conditions. It is this feature that renders the Surface Imaging Spectroscopy experiment to be surface sensitive to the changes of the media, as opposed to simply filming the process from the asphalt side using a microscope.
Furthermore, the reflectivity curve is also affected by the size of the gas layer. Figure 4 demonstrates the changes in intensity that will be observed at the detector for a gas bubble that is growing underneath a 1-μm (10,000 nm)-thick asphalt layer at a fixed angle of 60°. As the gas bubble diameter exceeds ∼20 nm, the reflectivity increases with increasing size of the gas bubble rapidly. When the diameter is greater than ∼50 nm, the observed reflectivity is greater than it would be if there is only water present at the interface. For bubbles of ∼400 nm or larger in size, the reflectivity becomes as great as that of infinite air, namely a sole gas medium, and when nanobubbles reach this 400 nm size under the lip of the asphalt, the beam apparatus can no longer distinguish nanoscale bubbles from infinite air that resides within the water medium—other than is inferred by its proximity under this lip. This demonstrates that the laser beam at its setting of 632.8 nm can penetrate to ∼400 nm under these conditions.

Simulated reflectivity curves at 60° laser angle of incidence. A He-Ne laser reflected at the interface of a glass prism and a gas bubble underneath a 1-μm asphalt layer at an incident angle of 60°.
Demonstration-scale pneu-col hydroacoustic cavitation system
The authors also operated a demonstration-scale HAC system, manufactured by Furness-Newburge (Fig. 5). This Pneu-Col system included cavitation, an ultrasonics chamber, settling pipes, recirculation piping, a holding tank, and an ozone generator. This demonstration-scale unit, designed for foundry sand reclamation, included a 400 gallon tank, an 11.5 HP submersible pump, two sand settling tubes, and connecting piping (Fig. 5). Hydraulic cavitation was induced ahead of the tube header pipe, and ultrasonics was induced within the tube header pipe. Each of the settling tubes hosted two pneumatically operated diaphragm valves, one at the top, which regulates sand conveyance into the tubes; and the second at the bottom, which regulates the discharge of processed sand. The two settling tubes are referred to as Tube A, the first tube in flow direction; and Tube B, the second tube in flow direction. For the demonstration-scale unit used herein, the header pipe between Tube A and B was clear plastic, so that the pipe's contents could be observed and videoed (video images were captured in the header just above Tube A). Advanced oxidants were maintained with sparged ozone (O3) to saturation levels; and the H2O2 addition maintained at about 1000 ppm H2O2 dose. Other advanced oxidants became generated as products from the continuous ultrasonics and induced hydraulic cavitation, as these were reacted with the O3 and H2O2. The ultrasonics induced the carbon residues to become vigorously released from the sand grain surfaces.

Sand reclamation system flow schematic, showing the pump, tank, induced cavitation, ozone, H2O2, and ultrasonics in the header pipe above the two sand collection tubes. Boxed area at C is region of photos in Fig. 10. H2O2, hydrogen peroxide.
Results
Microscopic cleaning process
Intensities of the reflected light by each of the media were measured during these experiments. The intensities were expressed as the detector counts, which ranges from 0 for the lowest intensity (total darkness, i.e., black) to 255 for the highest intensity (detector saturation, i.e., white when appearing as bubbles, or red when appearing within the liquid phase of the photos). These values are shown in Table 1. The relative intensity is given as the recorded intensity divided by 255. The intensity of gas bubbles was determined from data that were collected near the end of the asphalt removal process, where bubbles on the glass slide were prevalent.
Intensities dependent on coating thickness.
Intensity variations result of interference fringes.
Intensities dependent on bubble sizes.
Red superimposed on regions that reached 255 counts.
H2O2, hydrogen peroxide.
Microscopic images of the cleaning process, as observed in a typical experiment, are shown in Fig. 6. These images were selected from the experimental data file, that is, frames of the AVI movie file. The time elapsed since the start of the experiment has also been shown for each frame. It should be noted that these raw images were upside down since they were recorded through the camera lens. As shown in Fig. 6, it was observed that the removal of asphalt occurred primarily at the asphalt–glass–solution interfaces; and cleaning subsequently progressed from the fringes, toward an inward and upward direction (shown as downward in these upside down images). There were also occasions when some of the removal was initiated in the center of the asphalt and subsequently progressed outward from there. The authors observed that these cleaning processes that progressed from the center outward occurred less consistently and were slower than when cleaning proceeded from outside toward the middle. It was observed in these videos and images that asphalt removal occurred fastest at the asphalt–glass–solution interfaces, rather than in regions of bulk asphalt. This has been demonstrated by Fig. 6, which reveals the asphalt remaining at 0, 9, 22, 31, 36, and 40 min. Highlighted from Figs. 6 and 7a is an actively cleaned section, as it proceeded from 22 min H2O2 contact (Fig. 7b) to 31 min (Fig. 7c). In Fig. 7b and c, the highest intensity spots have been enhanced, so as to be represented by clear white areas. These white spots depicted detector counts that were greater than 217. As shown in Table 1, this value represented an intensity that was at least 5% higher than what would have been expected when the glass slide was in direct contact with the H2O2 solution at 128–207 counts. When intensity reached 255 counts, the authors depicted the response in white (if under the lip of the asphalt), or red (if away from the asphalt). As shown in Fig. 7b and c, nearly all of the red regions that depict infinite air appear beyond the fringe of the residual asphalt. Based on the relative intensity, many of these bubbles shown as white in the photographs appeared to have sizes between ∼50 and 400 nm (compare results to Fig. 4). Moreover, at the time frames of 22 and 31 min, about 70–90% of the asphalt's periphery hosted these white gas bubbles. Moreover, when comparing Fig. 7b to c, one notes that the most asphalt removal occurred where bubbles had been most prominent, as depicted by the bays in Fig. 7c; and it was the least where bubbles appeared least prominently, as depicted by the residual asphalt peninsula in Fig. 7c. This signified the dramatic effect that was incurred by these gas bubbles when they wedged themselves under the lip of the asphalt, so as to pry the asphalt away from the glass surface. Although this Surface Imaging Spectroscopy protocol did not host the sensitivity to discern which gas phase occurred at this interface, it is well known that H2O2 can decompose into both H2 and O2 gases. Moreover, CO2 gas can form when radicals fully mineralize organic matter to CO2.
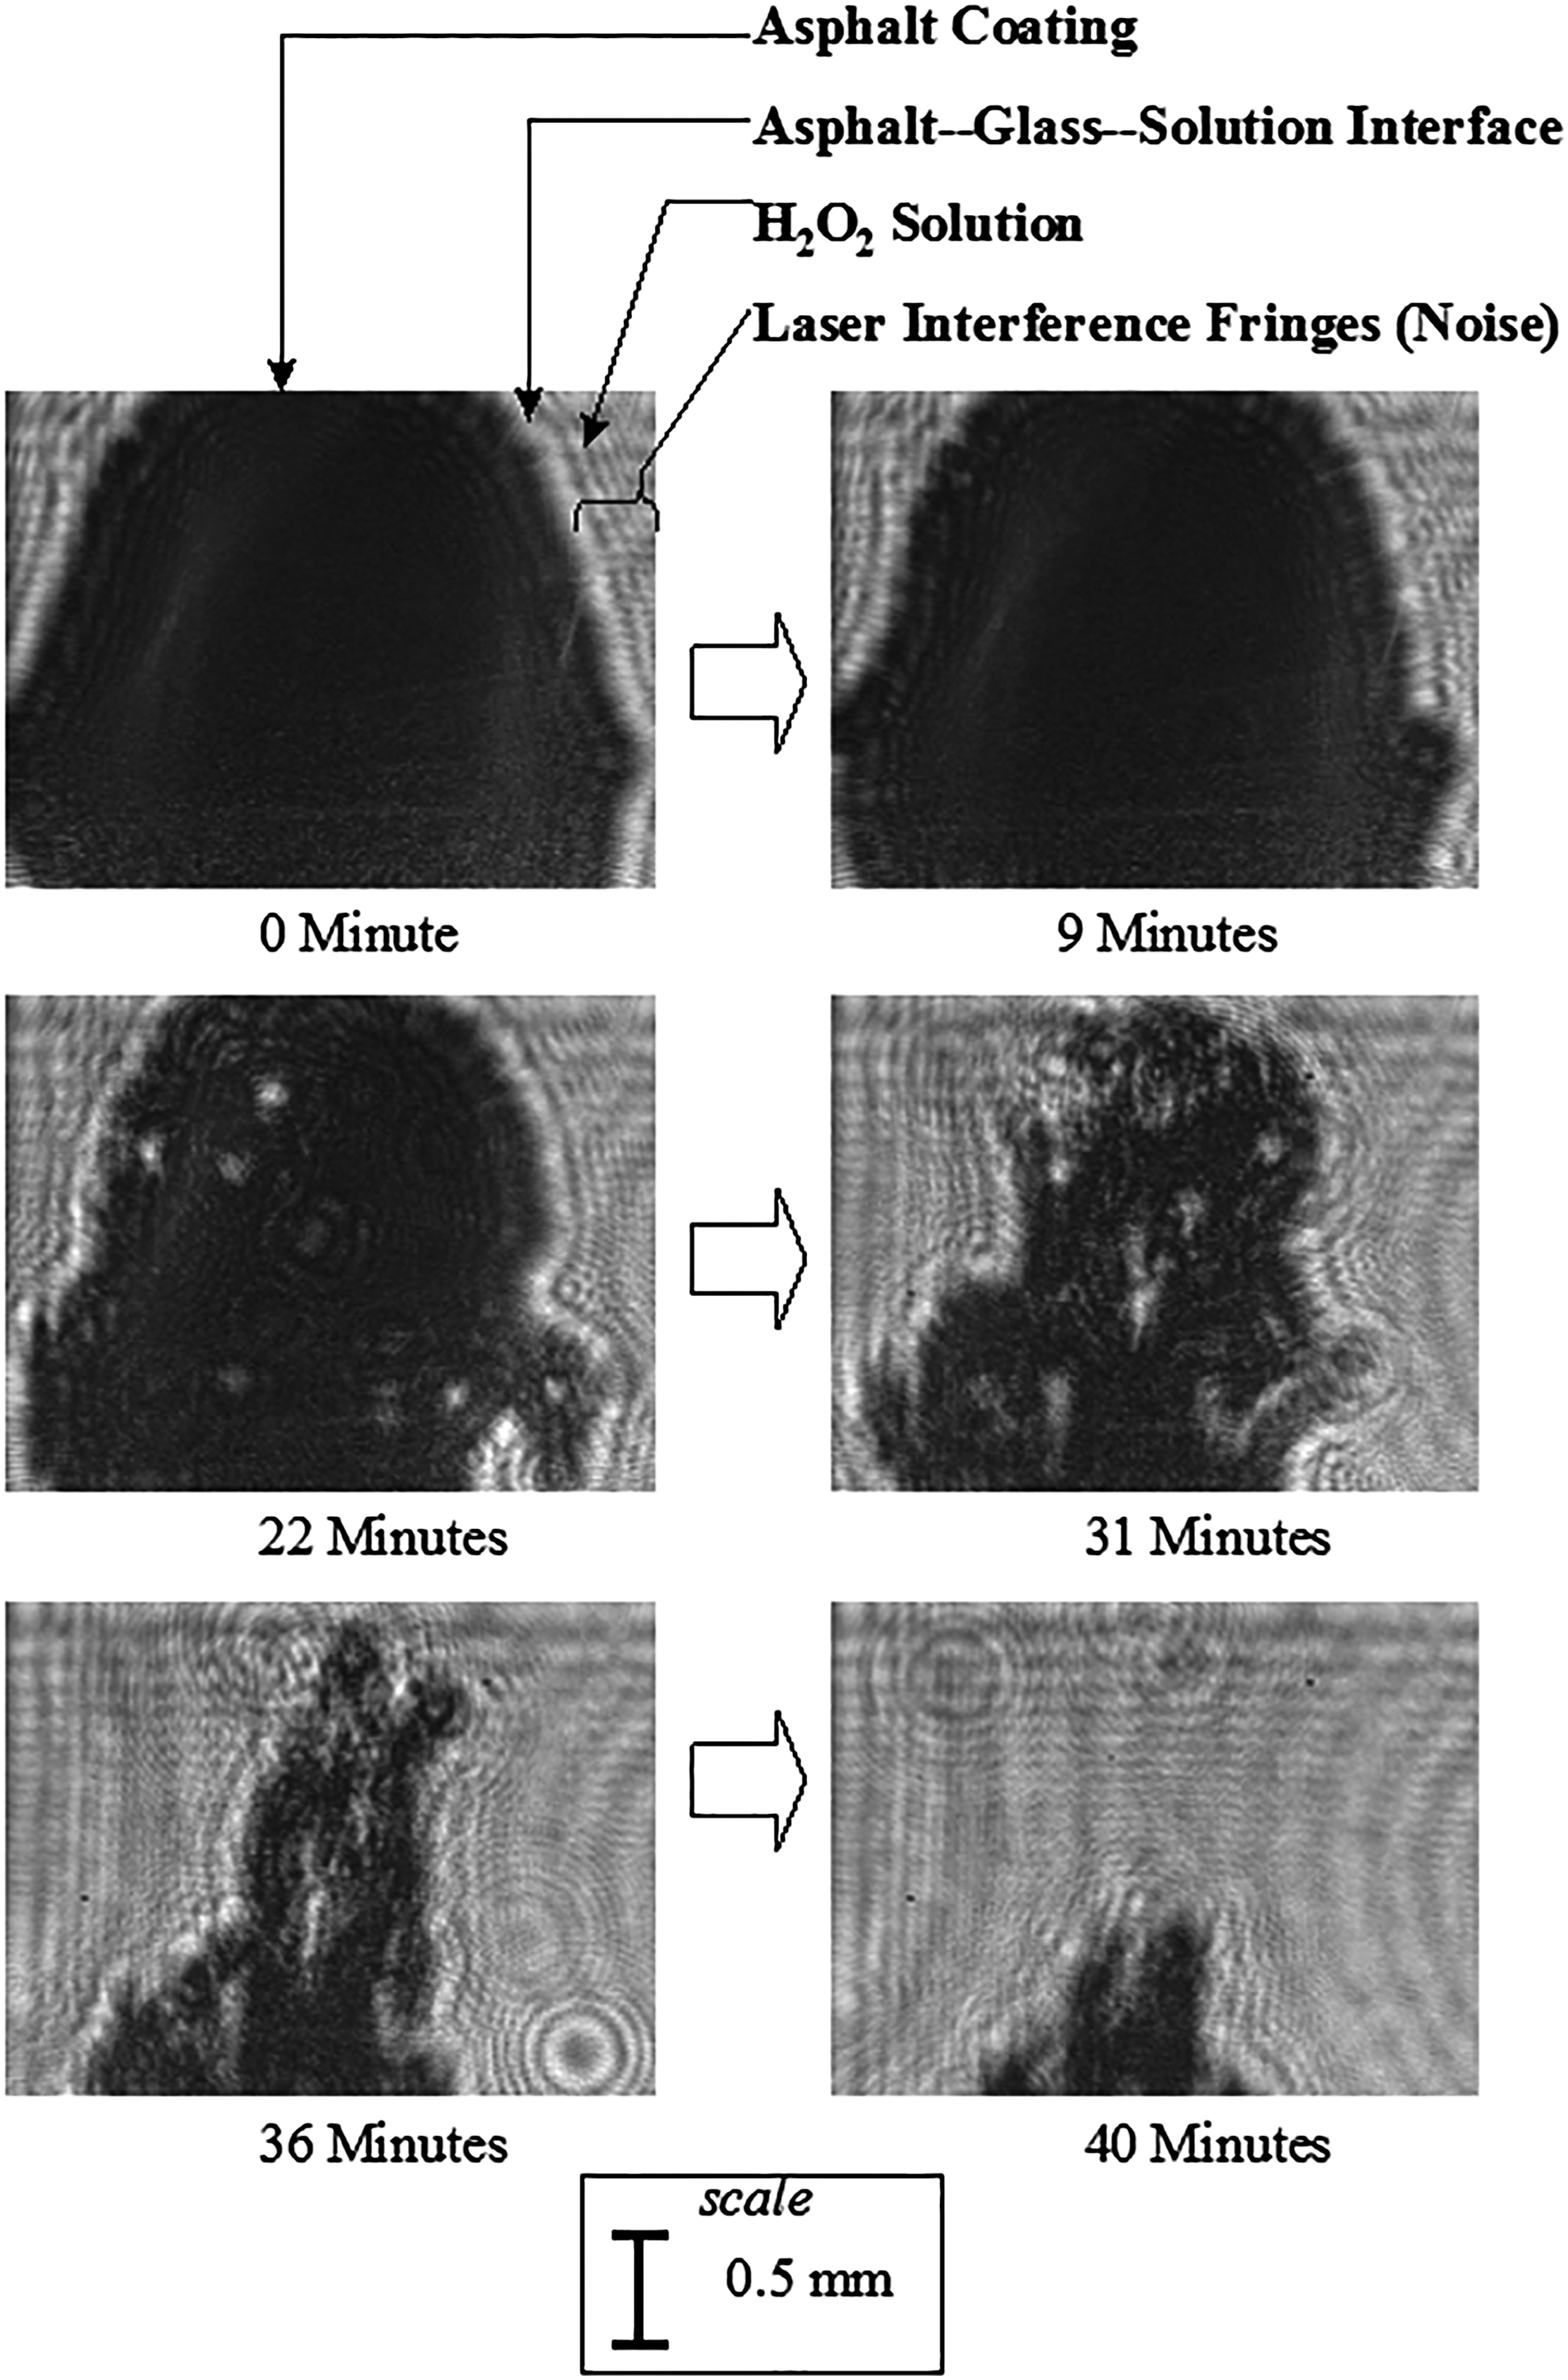
Surface Imaging Spectroscopy of microscopic cleaning process. Three percent H2O2 at 70°C and initial pH ∼9.

Enhanced Surface Imaging Spectroscopy of microscopic cleaning process. Three percent H2O2 at 70°C and initial pH ∼9.
Contact angle measurements and results
The authors further investigated the microscopic cleaning process at the asphalt–glass–solution interface by using the contact angle instrument that was shown in Fig. 1. This instrument monitored changes in the asphalt contact angle during the cleaning process as the asphalt was being removed. The contact angle experiments were conducted using a 3% H2O2 sample at ∼50°C and an initial pH ∼9. This sample was also air dried for 30 to 45 min before measurements. As shown in Fig. 8, when the asphalt-coated slide was first immersed in the H2O2 solution, the initial contact angle measured was ∼31° ± 3°. This angle, however, increased with time and eventually reached ∼138° ± 3° when the asphalt became lifted off the glass surface after about 25 min of immersion. In Fig. 8, representative photographs of the contact angles have been shown at the start and finish of these experiments. When the contact angle exceeded 90° (and possibly as it approaches it) the gas bubbles congregated under the lip of such a recessed region to create a wedging effect.

Contact angle measurements. Three percent H2O2 at ∼50°C, initial pH ∼9.
In contrast, for the control experiment during which the asphalt-coated slide was immersed in water at ∼50°C and pH ∼9, but without H2O2, the contact angle increased from an initial value of 24° ± 3° at the start of the experiment to only ∼79° ± 3° after about 27 min of immersion, as shown in Fig. 9. Moreover, the asphalt had not become removed hardly at all, even after 40 min of immersion. Indeed, during nearly the full span of time, the contact angle remained unchanged.

Contact angle measurements. Water at ∼50°C, initial pH ∼9.
When employing mere 3% H2O2 at pH 9, this prying effect was gradual, occurring over the course of about a half hour to an hour. However, when such H2O2 (plus ozone) is coupled with ultrasonics and cavitation, this phenomenon can become dramatically rapid, as narrated in the Discussion section below. The intense pressure waves that are induced by cavitation and ultrasonics could reverberate most pronounced through this gas bubble/compressible fluid that becomes wedged between the asphalt and solid; and this vigorously collapses the bubbles, thus tearing the asphalt away from the solid.
Operation of demonstration-scale pneu-col hydroacoustic cavitation system
The authors fed waste green sand from a full-scale foundry (at a rather light load) into the demonstration-scale Pneu-Col HAC system that had been adapted with a clear plastic ultrasonics chamber. Initially, all HAC unit operations were activated, with the exception of ultrasonics, while about 1,000 ppm H2O2 was also fed through the unit. As evidenced by video images, when ultrasonics was not included, the waste green sand grains proceeded through the clear plastic region virtually unnoticed (Fig. 10a). Then, at the word “go,” the team turned “on” the ultrasonics system; immediately—within less than a second—the video camera recorded that the organic coating was sheared off of the sand grains, creating nearly flat flakes of 0.2–1 cm dimensions that flung into the walls of the ultrasonics chamber (Fig. 10b–d). These flakes then exited from the chamber. These images highlighted how rapidly and intensely this combination of H2O2, O3, cavitation, and ultrasonics cleaned this asphalt-like residue from the sand grains. Before this treatment, the waste green sand grains appeared as in Fig. 11a—with a thick layer of black organic residue on their surface. However, following Pneu-Col HAC-AO, the sand grains were cleaned of most of their residue, as shown in Fig. 11b.

Pneu-Col® hydroacoustic cavitation system viewed at settling pipe tee (boxed area C in Fig. 5).

Green sand before
Discussion and Full-Scale Application
The interaction between the asphalt coating on glass slides and a H2O2 solution was studied by using Surface Imaging Spectroscopic technique. As shown in Fig. 6, most of the very active cleaning process was associated with high reflectivity intensity spots at the asphalt–glass–solution interfaces. These spots depicted bubbles that had become wedged under the lip of the asphalt. The more prominently these bubble spots appeared, the more rapidly the asphalt removal proceeded. This observation occurred repeatedly in multiple experiments, and we have shown one such representative depiction of this phenomenon in Figs. 6 and 7. Based on optical principles, the high-intensity spots could only be caused by a medium that has a refractive index that is smaller (i.e., detector counts that are higher) than that of an aqueous solution or water since these spots were at least 5%, and up to 16%, more intense than what could possibly be reflected by water. Among the possible media involved in these experiments during the cleaning process, only gas (H2 or O2 or CO2) generated during the process could cause such behavior (Table 1). Air could hypothetically create such a high refractive index, but it is highly unlikely that any air could consistently find its way to the asphalt–glass–solution interface, since the glass–asphalt interface was submerged under several inches of water. Thus, the authors surmised that these high-intensity spots were indeed caused by generated gas, presumably oxygen, hydrogen, or carbon dioxide that was generated by the decomposition of H2O2, or its radicals' reaction with the asphalt. The intensity of these bright spots are consistent with the simulated intensities of gas bubbles at the glass–asphalt interface, which further supports this hypothesis (Fig. 3).
The higher contact angle observed at the asphalt–glass–H2O2 solution interface, as compared with that at the asphalt–glass–water interface, also confirmed the interaction between the asphalt and the H2O2 solution. Presumably, the high contact angle was the result of the reaction between the asphalt and H2O2 at the interface that weakened the adhesive force while the asphalt coating was being pried away by the generated gas. The microscopic asphalt lip created by the high contact angle may also have contributed to keeping the generated gas bubbles affixed to the interface, thus allowing the reactions to spread along the glass surface.
Based on these experimental observations, a possible chemical/physical mechanism for the removal of the asphalt from a glass surface using an alkaline H2O2 solution is proposed, as shown in Fig. 12. The interaction and the removal occurred primarily at the asphalt–glass–solution interface. The H2O2 and its radicals appeared to react with the asphalt so as to weaken the adhesion between the asphalt and the glass at the interface. As this reaction continued, it generated gas (O2 and/or H2 or possible CO2), which congregated underneath the asphalt edges, and the contact angle between the asphalt and the glass surface dramatically increased. Eventually, the buoyancy of the gas pockets could have caused the asphalt to be pried off the surface as the reaction spread along the surface and the adhesion between the asphalt and the surface was altered. In light of these Surface Imaging Spectroscopy experiments and the demonstration-scale tests with the Pneu-Col process, we propose a cleaning process that is summarized as a three-step mechanism:
1. From H2O2, the free radicals HO•, O•, etc. form, and they degrade the asphalt, while apparently focusing their attack at the stressed interface between the glass and asphalt. 2. These radical-induced reactions release gas bubbles, such as O2 or CO2 (and possibly H2), which congregate at the exposed fringe of the asphalt–glass interface. The radical attack at this interface, coupled with the prying effect of these bubbles, gradually dislodges the asphalt from the glass surface. 3. In full-scale operations, when ultrasonics and cavitation are coupled with H2O2 and ozone, the induced intense pressure swings will burst these nanobubbles and cause the organic residue to be blasted away from the solid surface.

Schematics of the proposed mechanism of the asphalt cleaning process by hydrogen peroxide.
This Pneu-Col and Sonoperoxone process has been implemented in foundries, where molten iron is poured into green sand molds and the iron solidifies into the molded shape. After the mold cools, mechanical shakers separate the iron product from the molds, and the green sand is disaggregated. Green sand is comprised of mostly silica sand, but also includes some clay, coal fines, water, and organic additives. During intense molten iron exposure, the coal and organic additives pyrolyze, while releasing volatile organics. These volatiles diffuse outward through the green sand mold and then recondense on the surface of the sand and clay grains that reside in the more remote regions of the mold that remain cooler. This condensate forms an asphalt-like coating on the sand and clay grains, and this coating interferes with its molding strength. The green sand mold retains its strength and shape integrity through water–clay–sand adhesion that requires hydrophilic surfaces. In opposition to this, the recondensed organic coating creates hydrophilic surfaces that cannot retain these hydrophilic bonds. In highly automated conventional foundries, the green sand can be recirculated through the molding, pouring, and shake-out process about 15–20 times, until the hydrophobic organic coating accumulates so much that molding properties decline. When this decline occurs, some of the dead clay, coal, and sand must be replaced with fresh materials.
However, to compensate for this, the novel AO systems, Sonoperoxone or Pneu-Col, by Furness-Newburge, will dislodge the organic asphalt-like coating from the sand and clay surfaces, and allow much of these sand, clay, and coal materials to be reclaimed, and recirculated through the green sand process. Wang et al. (2005, 2006) conducted laboratory-scale mechanistic studies of this process and discerned that following exposure of sand grains to coal pyrolysis residues, AO cleaned the sand surfaces and rendered them more hydrophilic than did mere cleaning in water. Moreover, sonication diminished the size of the bentonite clay platelets, created more clay surface per mass of clay, and this lead to an increase in the bonding efficiency of the bentonite.
As a yet further application of this novel AO system, a Penn State team applied this HAC and sonication process to the silt–coal fine slurry that would conventionally be discharged into silt ponds from coal processing plants. This process hosted a Pneu-Col-containing pilot unit that had been provided by Furness-Newburge. This system included ozone, H2O2, HAC, cyclone separation, and spiral separation. When processing a coal–silt slurry that initially was 64% ash, the HAC deaggregated and separated the good coal fines from the silts to the extent that the spiral product was only 8.5% ash (i.e., the same as large coal chunks), and about 69% of the coal fines that entered the HAC unit could be recovered as cleaned coal product (Barry et al., 2015a, 2015b, 2017; Liu et al., 2017). This could represent considerable savings to a coal processing facility, considering that about 5–10% of mined coal conventionally becomes lost with the silt–coal fine slurry.
Yet further Penn State investigations have focused on developing a novel AO method to replace organic cleaning solvents. The aim has been to replace these with an aqueous-based H2O2 solution (Brant, 1995; Brant and Cannon, 1996; Cannon and Brant, 1998; Zhang and Cannon, 1999, 2001). Using asphalt as a surrogate to the recalcitrant industrial residue, the authors had found that even a relatively low concentration of 3% H2O2 effectively removed asphalt from glass surfaces within reasonable lengths of time. The authors also found that the cleaning was enhanced at a moderately high solution pH (pH 8.5–10.0), mildly elevated temperature (50°–70°), and elevated ferric iron presence (Zhang and Cannon, 1999, 2001).
Summary and Conclusion
In conclusion, the authors appraised a fundamental mechanism pertaining to the removal of organic residues from solid surfaces by AO. As an example of this phenomenon, experiments showed that an alkaline H2O2 solution gradually removed asphalt from a glass surface; and the authors presented a possible chemical/physical mechanism for this removal, as depicted in Fig. 12. The interaction and the removal occurred primarily at the asphalt–glass–solution interface. The alkaline H2O2 generated radicals that appeared to react with the asphalt, and thus weakened the adhesion between the asphalt and the glass at this interface. As this reaction continued, it generated gas (O2 and/or H2 or possibly CO2), which congregated underneath the asphalt fringes' lips, and the contact angle between the asphalt and the glass surface dramatically increased. Eventually, the buoyancy force of the gas pockets apparently caused the asphalt to be pried off the surface as the reaction spread along the surface and the adhesion between the asphalt and the surface was weakened.
In full-scale systems, when this H2O2 is coupled with ultrasonics and cavitation, the compressible product gases succumb to the intense pressure swings incurred by ultrasonics and cavitation. These pressure swings can cause this fringe of wedged bubbles to explode, and tear the asphalt (or other carbonaceous residue) from the glass, sand, or other solid surfaces. With mere H2O2 and high-pH solution, this asphalt-removal process has taken a half hour to an hour—as shown by the Spectroscopy experiments above. However, when H2O2 has been coupled with ozone, cavitation, and ultrasonics, the carbonaceous residues have been removed instantaneously—within seconds.
The collaborative team of Furness-Newburge and Penn State has researched, developed, and installed full-scale AO systems in numerous foundries. The novel AO systems, named Sonoperoxone or Pneu-Col by Furness-Newburge, has benefited the foundry industry by diminishing clay, coal, and sand use by 25–35% and hazardous air pollutant emissions by 50–75%, when compared with conventional operations while not using the AO system (Neill et al., 2001; Goudzwaard et al., 2003; Glowacki et al., 2003; Fox et al., 2008a, 2008b). This has achieved savings of hundreds of thousands of dollars per year per foundry, while diminishing net overall energy consumption within the foundry by 2–5% (Torielli et al., 2014). These full-scale Sonoperoxone and Pneu-Col systems will generally use about 50–100 square feet of floor space, whereas diminishing materials use and pollution for a foundry that spans a city block. This technology may represent one of the largest full-scale uses of AO in a manufacturing setting anywhere; and it is based on fundamentals presented in this article.
Footnotes
Acknowledgments
This research was funded in part through the Emissions Reduction Research Center, which included support from the National Science Foundation, Environmental Protection Agency, Navy, Army, and about 10 industries. Further support originated from a Penn State College of Engineering Graduate Excellence Fellowship.
Author Disclosure Statement
No competing financial interests exist.