
Abstract
Abstract
Membrane biofouling, caused by bacterial biofilm formation is a significant obstacle for membrane filtration processes because it reduces pure water permeability. Recent studies have shown that bacterial communication pathways, known as quorum sensing (QS), trigger biofilm development. QS inhibiting compounds (QSIs) have been identified as an important key to disrupt QS pathways and ultimately reduce biofilm production. In this study, two known QSIs, vanillin and cinnamaldehyde, were physically attached onto polyamide thin-film composite reverse osmosis (RO) membranes to enhance membrane in situ antibiofouling potential. QSI attachment altered the membrane surface contact angle to reflect the property of the QSI, but there were no significant changes in salt rejection and pure water permeability. Under biofouling conditions, the QSI-modified RO membranes experienced a minimal loss in permeate flux compared with one of the control membranes in a high-pressure RO system. QSI attachment significantly reduced polysaccharide production (>15%), live bacteria (>58%), and dead bacteria (>61%) on the membrane surface in the bench-scale biofouling studies using a mixed culture of biofilm forming marine bacteria. Results of this study indicated that QSI membrane modification has the potential to achieve in situ reduction of membrane biofouling for RO seawater desalination.
Introduction
W
However, biofouling compromises membrane performance and remains a major challenge for the membrane industry. In the Middle East alone, it is estimated that ∼70% of seawater RO membrane desalination plants endure membrane biofouling (Khedr, 2011). Biofouling is caused by the deposition and aggregation of bacteria and their metabolic products on the membrane surface (Flemming and Schaule, 1988; Costerton, 1995; Flemming et al., 1997). During a RO fouling event, the applied pressure compacts the fouling layer, which reduces the ability of the crossflow velocity to efficiently shear off particles and organics that accumulate on the membrane surface (Abdul Azis et al., 2001; Lee and Kim, 2011). As a result, increased operational pressure and energy demand are needed to maintain original flux conditions (Abdul Azis et al., 2001; Lee and Kim, 2011; Katebian and Jiang, 2013).
When the permeate flux, permeate water quality, or operational pressure varies by 10–15%, membranes are usually cleaned using a collection of acidic and basic compounds to reestablish membrane performance by degrading constituents in the biofouling layer (Bonné et al., 2000; Fritzmann et al., 2007; Reverberi and Gorenflo, 2007). Chemical cleaning processes are known to be inefficient to restore membrane performance for long periods of time because (1) degraded organic matter in the surrounding environment becomes readily available and further stimulates the growth of surviving bacteria on the membrane surface; (2) surviving bacteria may develop a tolerance to chemical cleaning agents; and (3) frequent cleanings degrade the polyamide thin film over time (Davies et al., 1993; Bonné et al., 2000; Fritzmann et al., 2007; Reverberi and Gorenflo, 2007; Katebian et al., 2016).
Recent progress in bacteriology has identified the important role of quorum sensing (QS) pathways in biofilm development. During QS, bacteria communicate with each other by producing and secreting signaling molecules that accumulate to a threshold level based on the local bacterial population density (Dobretsov et al., 2007). Kim et al. (2009) reported that 60% of biofilm-forming bacterial species on fouled RO membranes produced QS molecules.
Thus, QS inhibiting compounds (QSIs) known to interfere with or suppress QS pathways offers a potential approach to impede biofilm formation at a biological level. The most relevant QSIs to diminish RO membrane biofouling for seawater desalination are cinnamaldehyde (CNMA) and vanillin (VA). Both compounds are known to inhibit Gram-negative bacterial biofilm formation, the dominant biofoulant species on fouled RO membranes in seawater desalination plants (Niu et al., 2006; Brackman et al., 2008; Kappachery et al., 2010; Zhang et al., 2011; Ponnusamy et al., 2013). CNMA has been shown to further suppress the bacterial QS pathway responsible for communication between Gram-negative and Gram-positive bacteria (Niu et al., 2006; Defoirdt et al., 2007; Brackman et al., 2008), which may have broader impacts on biofilm formation. Our previous research showed that CNMA and VA in the bulk fluid effectively reduced marine biofilm production in a static incubation chamber (Katebian et al., 2016). The antibiofilm capabilities of these QSIs lessened in a crossflow membrane system due to the hydrodynamic and membrane surface properties (Katebian et al., 2016). Therefore, the focus of biofouling control has more recently shifted toward surface modification methods to entrap QSI and improve in situ antibiofilm potential (Lee et al., 2011a; Kim et al., 2013; Zodrow et al., 2014; Wood et al., 2016).
The goal of this research was to incorporate CNMA and VA onto the surface of RO membranes to enhance membrane in situ antibiofouling capability. This study demonstrated membrane modification through physical adsorption and investigated membrane permeability and salt rejection rates after QSI attachment in a high-pressure RO system. The antifouling properties of QSI-modified membranes were examined in a well-controlled high-pressure RO system using a mixture of marine bacterial isolates known to cause membrane biofouling. Biofilm development on QSI-modified and unmodified membranes were examined and compared using confocal microscopy. QSI incorporation and retention on the membrane surface was observed under Raman microscopy.
Experimental Protocols
QSI modification of RO membranes
Stock solutions of CNMA (≥95%; Sigma-Aldrich) and VA (≥98%; Sigma-Aldrich) were dissolved in methanol and deionized water (DI H2O), respectively. For membrane surface modification, QSIs were further diluted to 1,200 mg/L in DI H2O, which was previously determined to be an effective concentration to reduce marine biofilm in the bulk fluid (Katebian et al., 2016).
Either QSI (CNMA or VA) was incorporated onto two commercially available and commonly used seawater grade polyamide RO membranes, Dow Filmtec™ SW30XLE (Midland, MI) and Hydranautics SWC5 (Oceanside, CA) following previously reported deposition methods with minor modifications (Wang et al., 2006; Azari and Zou, 2012; Hilal et al., 2012). Briefly, the virgin RO membrane was soaked in DI H2O overnight to remove the protective layer. The membrane was then placed into a crossflow cell (Tangential Flow Filtration Membrane Cassette, Pall; Fig. 1) to expose the thin film surface to the QSI solution (1,200 mg/L) at a crossflow velocity of 0.005 cm/s for 24, 48, and 72 h with recirculation and no permeation. Afterward, the membrane was washed by recirculating fresh DI water through the membrane cassette for 15 min to remove any unattached QSI. The modified membranes were stored in DI water at 4°C and dried before Raman analysis.

Illustration of apparatus used for QSI incorporation onto the polyamide thin film RO surface. QSI, quorum sensing inhibiting; RO, reverse osmosis.
Stability of QSI attachment to the RO surface was evaluated by continuously flushing the membrane surface in the flow cell with DI water at a cross-flow velocity of 0.01 cm/s for 24 h without recirculation and permeation. Retention of QSI on the modified RO surface was examined under Raman microscopy to determine if there was any significant reduction in QSI signal peaks compared with the original modified membrane.
Raman analysis of QSI attachment on RO surfaces
Raman in vivo microscopy (Renishaw) was used to assess QSI attachment and retention on the modified membrane surface. The Raman spectra of virgin RO membrane surfaces, VA (powder), or CNMA (liquid) in their natural state were first acquired to establish the baseline condition for comparison with QSI-modified RO membranes. Samples were placed directly under the diode laser at an excitation of 532 nm (visible light range) under 50,000 magnifications. Spectra were collected using 3 mW of laser power and 2 s exposure time from five random locations for each sample. The baseline was corrected for all spectra using WIRE 3.4 software (Reinshaw). The maximum amount of QSI deposited onto the membrane surfaces was determined based on statistically significant differences in the expected QSI signal peak areas on the membrane exposed to CNMA or VA for 24 to 72 h using a two-tailed t-test with a 95% confidence level in Microsoft Excel.
Membrane performance and surface property characterization
Permeability and salt rejection rates for the QSI-modified RO (QSI-RO) membranes were investigated in a high-pressure cassette holder (CF402, Sterlitech, Fig. 2) using DI H2O as the feed solution (Zodrow et al., 2014). At 25°C, the starting pressure was set to 450 psi with a crossflow velocity of 15 cm/s for membrane compaction and equalization. Afterward, the flux rate was monitored for 60 min using a digital balance to continuously record the permeate weight. At the end of the permeability test, the membrane salt rejection rate was measured by switching DI H2O with 50 mM of sodium chloride solution in the feed tank. After the system reached steady-state conditions, conductivity measurements were taken of the feed and permeate streams to calculate the salt rejection rate.
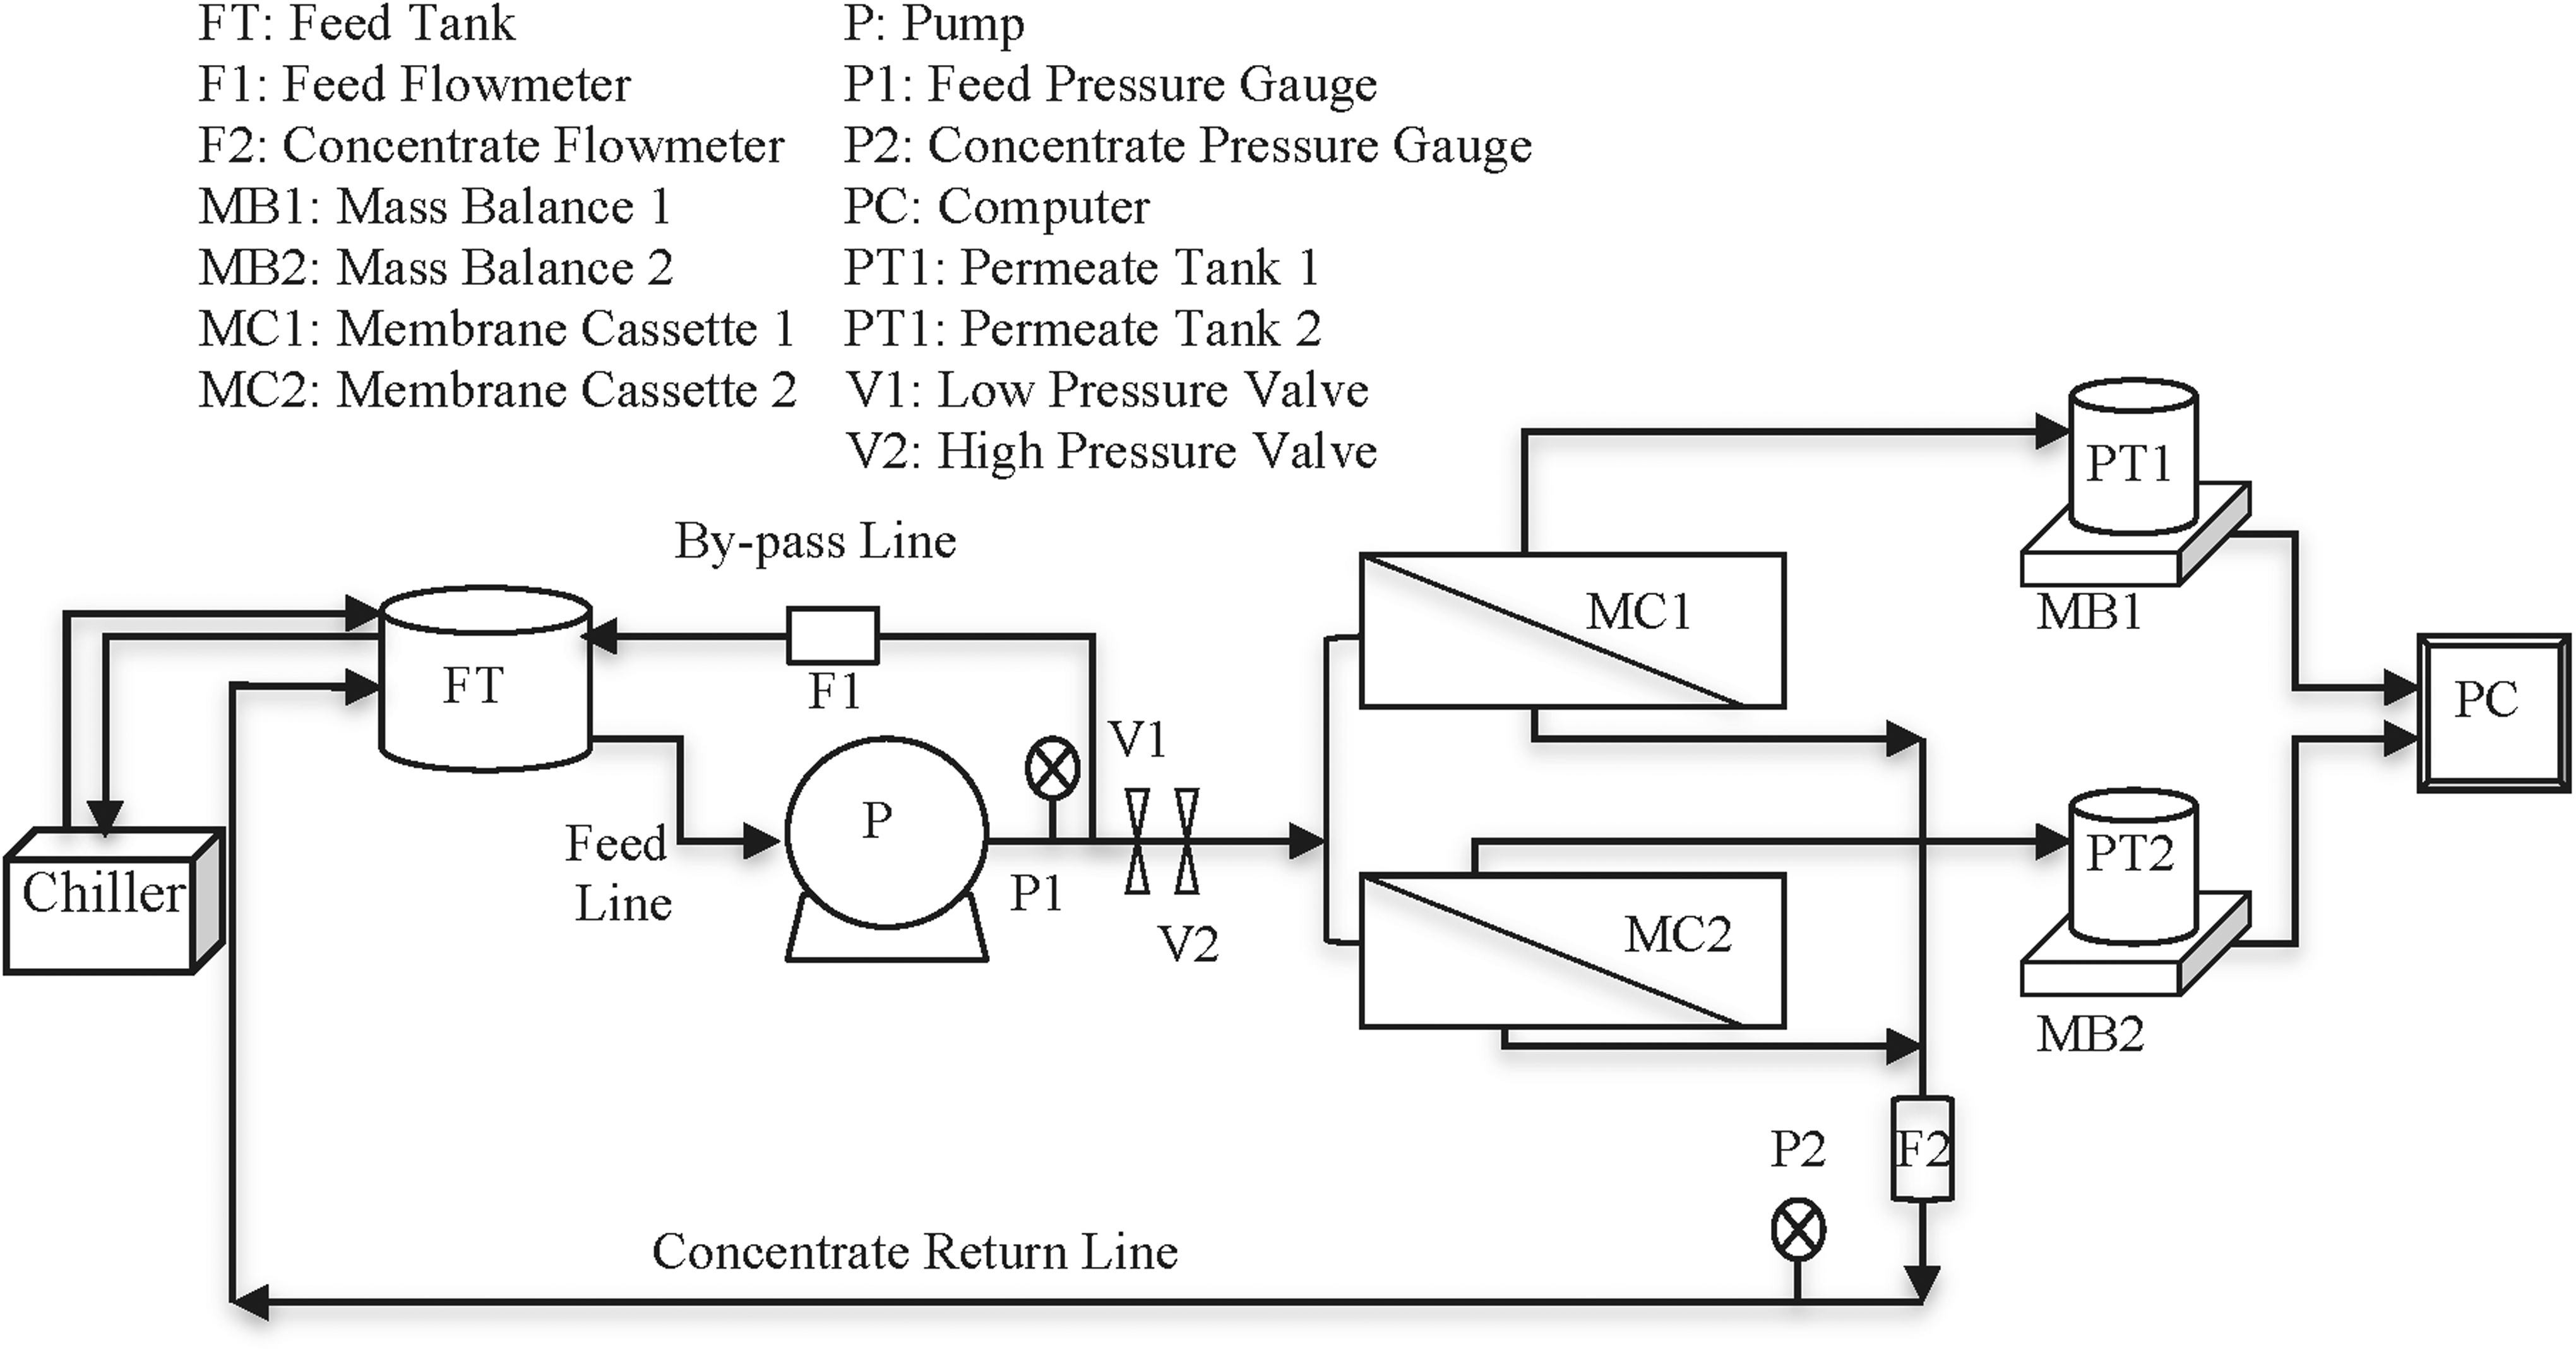
High-pressure RO membrane system set up for investigation of QSI-RO membrane characteristics and biofouling properties.
Hydrophilicity of the QSI-RO membrane was tested using the sessile drop contact angle method with a Goniometer (Rame-Hart) as presented in previous studies (Marmur, 1996; Vrijenhoek et al., 2001; Subramani et al., 2009). Briefly, 1 μL of DI H2O was placed on each dried membrane surface at room temperature (∼22°C). Once the water droplet reached a semistable state (<10 s), an image was acquired. The left and right contact angles were measured using ImageJ LB-ASADA plugin program. The process was repeated 10 times and averaged to ensure the reliability of the measurement.
Pure water permeate flux, salt rejection, and contact angle measurements of the QSI-RO membrane were compared with virgin RO membranes under the same testing conditions. Statistical differences between the QSI-RO and virgin membranes were determined using a two-tailed t-test with a 95% confidence level in Microsoft Excel.
QSI-RO membrane antibiofouling capability
Biofouling rates of the QSI-RO and virgin RO membranes were examined under a rapid fouling condition as shown in Figure 2. Bacterial strains, Alteromonas sp. (B2 and B4) and Shewanella sp. (B1 and B3), isolated from fouled RO membranes at a desalination pilot plant in Carlsbad, CA were used for the fouling study. These four marine bacteria are part of the dominant class of known biofouling bacteria commonly isolated from fouled RO membranes (Zhang et al., 2008; Bae et al., 2011; Lee and Kim, 2011; Chun et al., 2012; Katebian and Jiang, 2013). The bacterial strains were cultured using artificial seawater medium as previously reported (Paul, 1982; Zhang et al., 2011).
At the start of the fouling experiment, either QSI-RO or virgin membranes were placed into identical high-pressure flat sheet membrane cassette holders (CF402, Sterlitech, Fig. 2) fed with artificial seawater flowing at 15 cm/s under a feed pressure of 450 psi at 25°C. Artificial seawater originally developed by Paul (1982) was used as the feed solution to ensure a consistent condition for all fouling experiments. The ingredients of the artificial seawater include NaCl (377.57 mM), MgSO4 (81.42 mM), CaCl2•2H2O (16.19 mM), KCl (7.38 mM), NaHCO3 (1.90 mM), KBr (0.67 mM), SrCl2 (0.21 mM), NaF (0.06 mM), Na2HPO4 (0.06 mM), Na2SiO3 (0.03 mM), NH4NO3 (0.02 mM), Na2EDTA (0.08 mM), H3BO3 (0.06 mM), FeCl3•6H2O (0.01 mM), MnCl2•4H2O (0.02 mM), CoCl2•6H2O (8.41 × 10⁻⁴ mM), ZnCl2 (2.31 × 10⁻³ mM), and CuCl2•2H2O (1.64 × 10⁻⁵ mM). After overnight stabilization, equal portions of four bacterial cultures were seeded into the feed solution at 1:100 dilutions. In addition, peptone (0.31 g/L) and yeast extract (0.06 g/L) were added to the feed tank as organic nutrients to accelerate the fouling rate. Under this condition, a thick biofilm layer can form within 24 h.
The drip permeate flux rate was continuously monitored during the experimental period while the concentrate stream was recirculated back to the feed tank. Cell density within the feed tank was periodically measured using an optical density of 600 nm (OD600, Biophotometer, Eppendorf). At the end of the experiment, the biofouled membranes were removed to assess membrane biofilm formation. QSI retention on membrane surfaces was investigated under Raman microscopy to determine any loss in the QSI signal peak areas in comparison with the original QSI-RO membranes using the two-tailed t-test with a 95% confidence level in Microsoft Excel.
Membrane biofilm characterization
Biofilm development was analyzed by characterizing live cells, dead cells, and polysaccharides on sections of biofouled membranes. The fluorescent nucleic acid stains (FilmTracer™ LIVE/DEAD® Biofilm Viability Kit; Invitrogen), SYTO9 (green) and Propidium Iodide (red) were used in conjunction to differentiate between live (green) and dead (red) cells. SYTO 9 is capable of permeating live cells' membrane to stain the bacterial genome, whereas Propidium Iodide can only enter damaged cell membranes (dead cells). Con A lectin stain (Concanavalin A Conjugates; Invitrogen) was used as an indicator of the polysaccharide content as the stain binds to mannose and glucose residues similar to the exopolysaccharide excretion from Alteromonas sp. and Shewanella sp. tested in this study (Raguenes et al., 1996, 1997; Herzberg and Elimelech, 2008; Cao et al., 2011). For membrane staining, SYTO 9 and Propidium Iodide were mixed in a 1:1 ratio in DI H2O. Con A was diluted in PBS (10 mM, pH 7.5) to a concentration of 100 μg/mL (Herzberg and Elimelech, 2008). The freshly prepared stain solutions were added separately to the membrane surface and incubated in the dark for 20 min at room temperature. Membranes were then rinsed with DI H2O or PBS and stored in the dark at 4°C until analysis.
Confocal Laser Scanning Microscopy (CLSM, Zeiss LSM 700) was used to assess live cells, dead cells, and polysaccharides at excitation/emission wavelengths of 555/580, 480/500, and 555/580 nm, respectively. A Z-stack of the biofilm at each wavelength was acquired at ten locations along the length of fouled membranes for each experimental run. COMSTAT 2 plugin for ImageJ software was used to quantify live cells, dead cells, and polysaccharides (Heydorn et al., 2000; Sauer et al., 2002) on the RO membrane surface. Confocal images were first taken through automatic thresholding using Otsu's method to remove outliers in pixel intensity in the biofilm layer. Any component not connected to the biofilm layer (i.e., floating debris) was then removed using volume filtering. Biomass, the amount of biofilm covering the image stack, was determined by calculating the volume of the biofilm within the Z-stack per substratum area (Heydorn et al., 2000; Sauer et al., 2002; Katebian et al., 2016). Biofilm thickness was calculated by locating the uppermost point above each pixel in the bottom biofilm layer of the Z-stack (Heydorn et al., 2000; Sauer et al., 2002; Katebian et al., 2016). Statistically significant differences between biofilm biomass and thickness on QSI-modified and -unmodified RO membranes were determined using notched boxplots in MATLAB and two-tailed t-tests with a 95% confidence in Microsoft Excel.
Results
QSI incorporation and stability on RO membrane surfaces
Raman spectra of the virgin SWC5 revealed characteristic polyamide peaks at a Raman shift of 1,074, 1,108, 1,148, 1,587, and 1,608 cm−1 (top panels of Fig. 3A, B), which were consistent with past research (Lamsal et al., 2012). The virgin SW30XLE membrane had the same Raman spectra (data not shown) indicating identical TFC material of the two commercial membranes. CNMA- and VA-modified SWC5 membranes also had the same characteristic polyamide peaks at the same Raman shifts (middle panels of Figs. 3A, B, and 4A). Additionally, CNMA-SWC5 membranes had significant peaks at a Raman shift of 1,000, 1,253, 1,627, and 1,677 cm−1 with peak areas ranging from 104 to 105 (Fig. 3A–C). CNMA-SW30XLE membranes also had the same spectra (data not shown) with differences only in peak areas shown in Figure 3C, D. These peaks belonged to C—H, C═O, and C═C bonds on the aldehyde and benzene functional groups of CNMA, which were similar to past research and agreed with CNMA spectral peaks in its natural state as a liquid (Fig. 3A, B bottom panel) (da Silva et al., 1995; Stewart et al., 1997).

Characterization of CNMA attachment onto SWC5 and SW30XLE RO surfaces.
Similarly, VA-SWC5 (Fig. 4A) and VA-SW30XLE (data not shown) membranes shared the same Raman spectra with differences in QSI peak areas ranging from 103 to 105 (Fig. 4B, C). VA-RO membranes and VA in its natural state (powder) shared a major peak at a Raman shift of 1,677 cm−1 (Fig. 4A) (da Silva et al., 1995; Binoy et al., 2005; Aggarwal et al., 2013). Another major peak was observed at a Raman shift of 1,628 cm−1 for VA-RO membranes, which did not correspond to either VA or the polyamide (Fig. 4A).
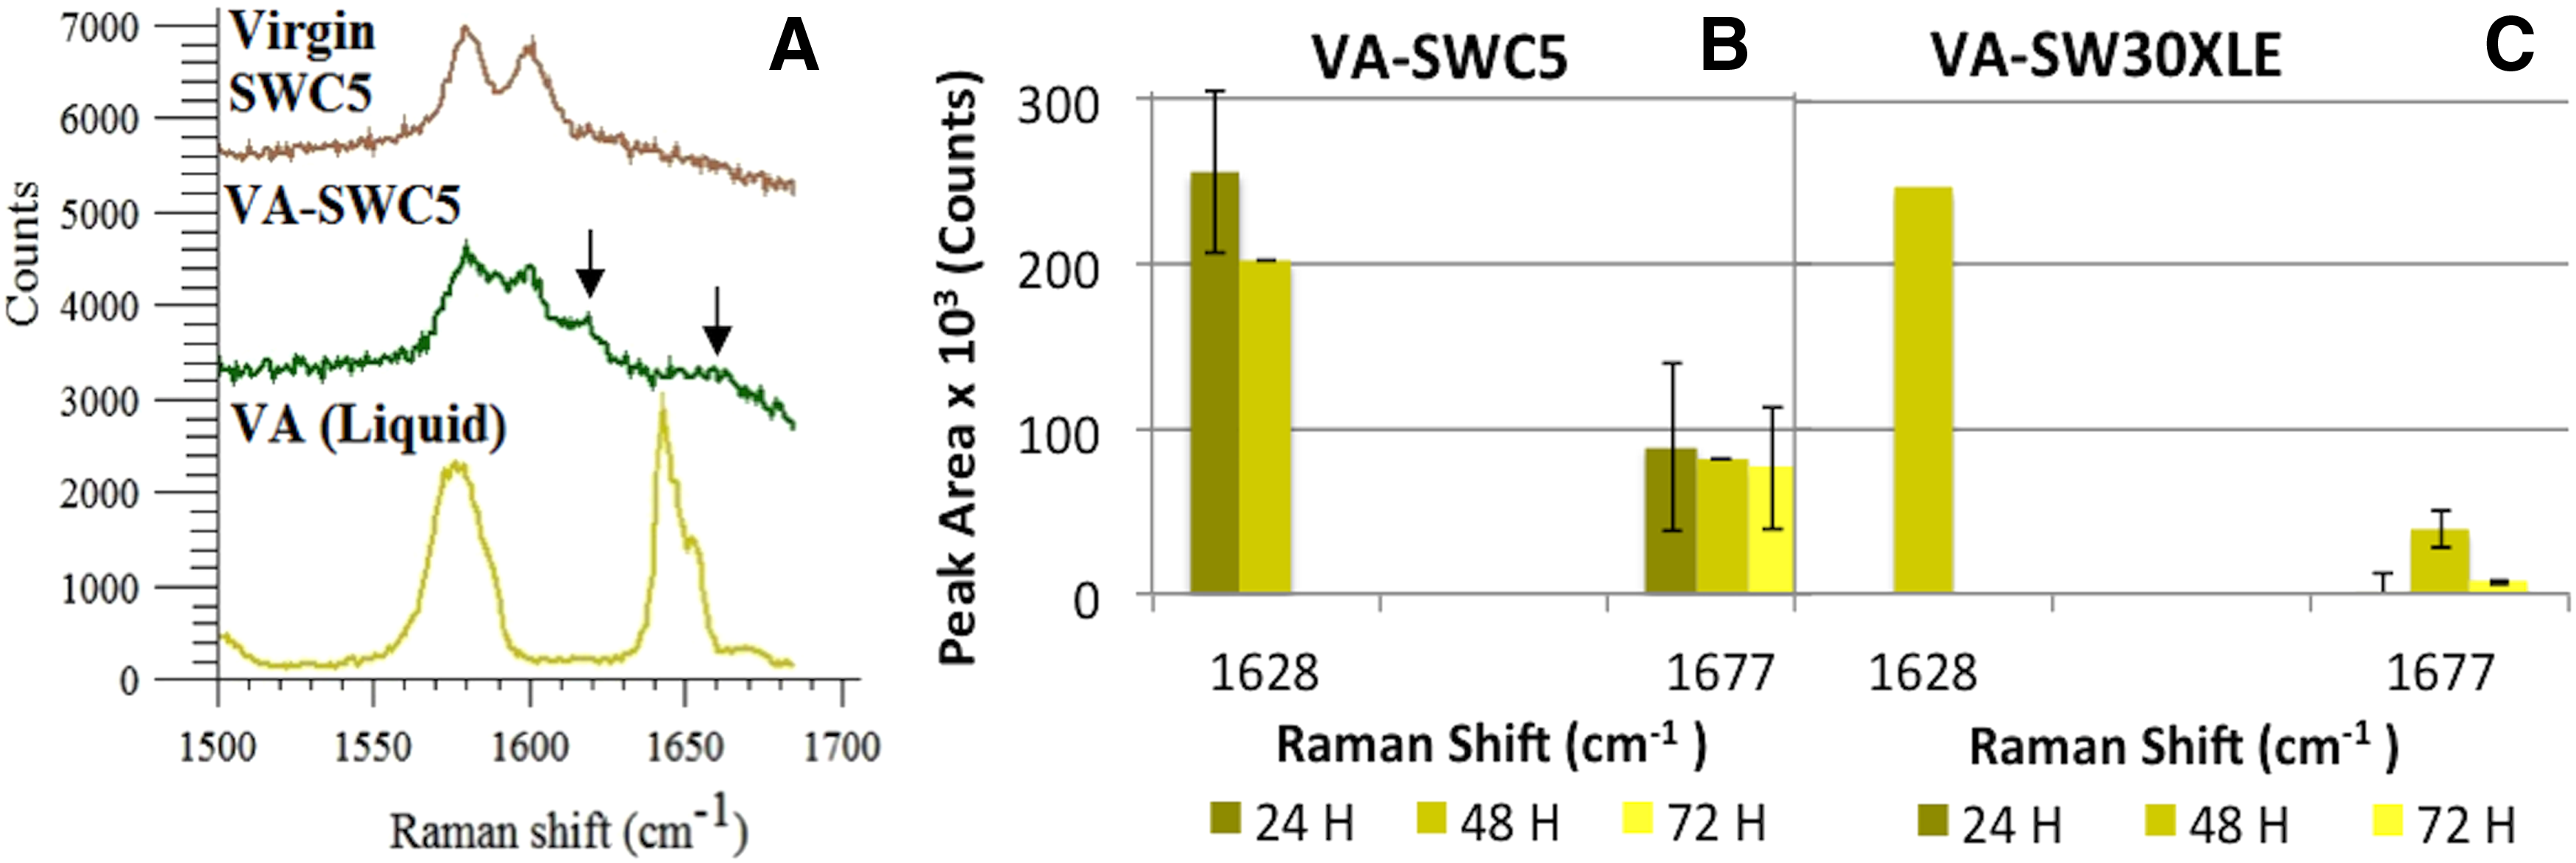
Characterization of VA attachment onto SWC5 and SW30XLE RO surfaces.
Investigation of QSI attachment efficiency on TFC RO membranes over time revealed that there were no significant changes in CNMA adsorption on SWC5 membranes from 24 to 48 and 72 h. However, CNMA attachment to SW30XLE membrane varied with time of exposure to CNMA (Fig. 3C, D). VA adsorption to both membranes also varied significantly with exposure time (Fig. 4B, C). Based on QSI peak areas present on membrane surfaces, the maximum amount of CNMA and VA incorporated onto the membrane surface occurred within 24 h for SWC5 and 48 h for SW30XLE membranes.
It is important to mention that all Raman spectra were taken after washing the membrane by recirculating DI water through the membrane cassette and air drying the membrane. Therefore, CNMA and VA peaks observed on modified membrane surface are from surface-bounded QSI. The stability of QSI on RO surface was further verified by minimal changes in QSI peak areas after flushing the membrane with DI water at high crossflow velocity for 24 h (data not shown). In addition, Raman microscopy results further showed the presence of both VA and CNMA signal peaks at the end of the high-pressure RO biofouling experiment, although peak areas were reduced on the modified membrane surfaces (data not shown).
QSI-RO membrane performance and surface property
Comparing QSI modified with virgin membranes, there were no statistically significant differences in pure water permeate fluxes, although the average water permeate fluxes were slightly lower for modified membranes (Fig. 5A). In addition, there was no significant difference in the salt rejections between QSI-modified and -unmodified RO membranes as shown in Figure 5B.
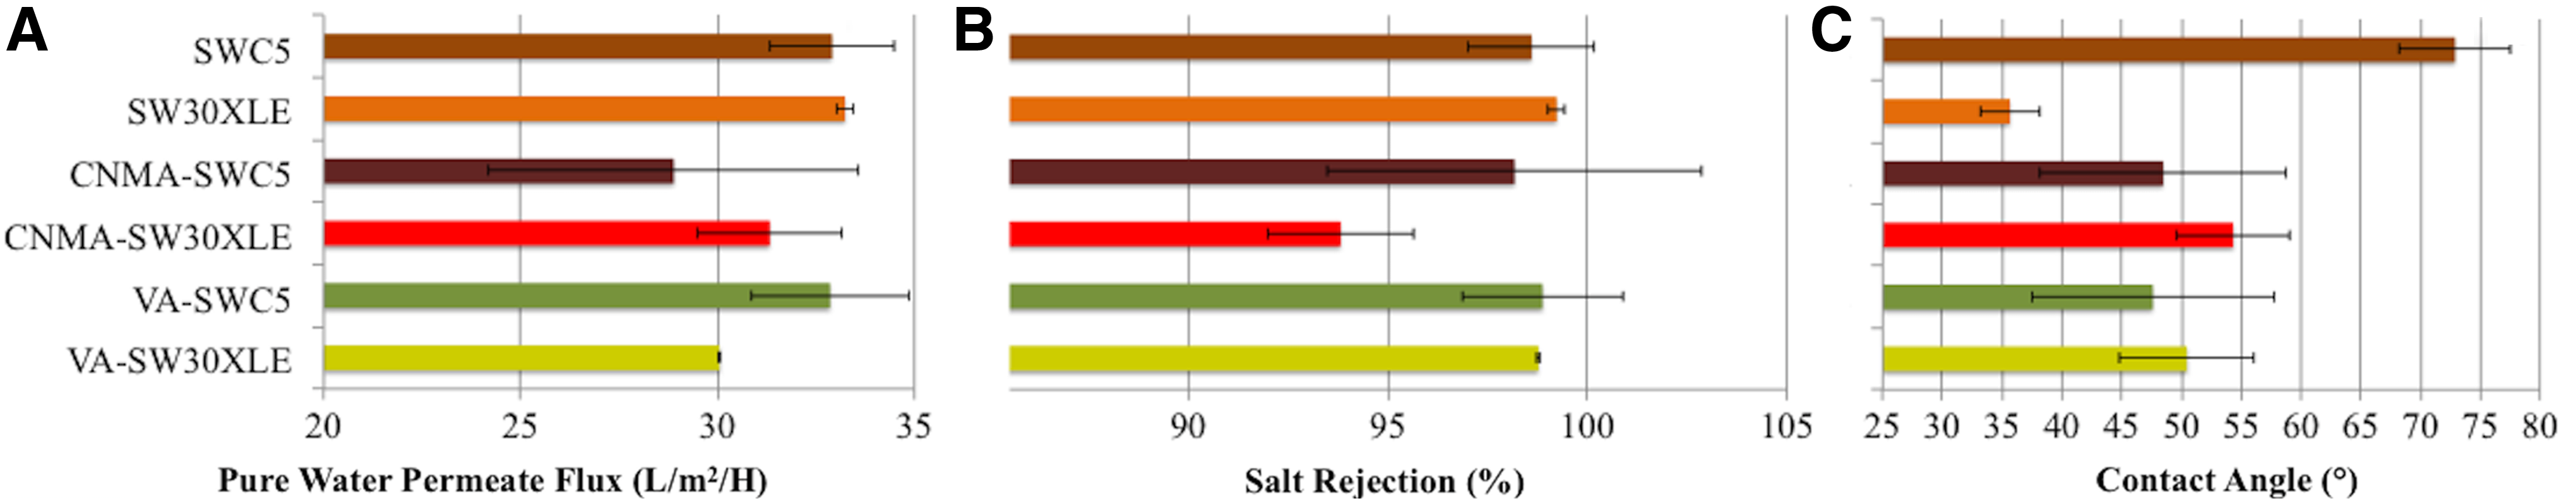
Performance of QSI-modified and virgin RO membranes in respect to pure water permeate flux
Before QSI incorporation, the virgin SW30XLE membrane was significantly more hydrophilic than the SWC5 membrane (McCutcheon and Elimelech, 2008; Lee et al., 2011b) (Fig. 5C). The average contact angle for virgin SWC5 and SW30XLE was 72.89° ± 4.63 and 35.66° ± 2.52, respectively. After QSI incorporation, the contact angle of modified SWC5 membranes decreased to become more hydrophilic, whereas the modified SW30XLE membranes increased to become less hydrophilic (Fig. 5C). QSI incorporation onto the two commercial membranes with different contact angles resulted in membranes with similar hydrophilicity (Fig. 5C).
QSI-RO membrane biofilm reduction
Three-dimensional confocal images revealed that there were decreases in distribution of live cells, dead cells, and polysaccharides between virgin (Fig. 6A–D) and CNMA-modified RO membranes (Fig. 6E–H). COMSTAT 2 results further confirmed that CNMA-SWC5 and CNMA-SW30XLE membranes had statistically significant decreases in live and dead cell colonization on membrane surfaces in comparison with the virgin membrane, ranging from 27.71% to 75.12% (Fig. 7A, B; p < 0.05 for all). There was also a statistically significant decline in the thickness of polysaccharide layer on CNMA-SWC5 (15.53%) and CNMA-SW30XLE (22.80%) membranes (p < 0.05 for both) compared with their respective unmodified membranes (Fig. 7C).
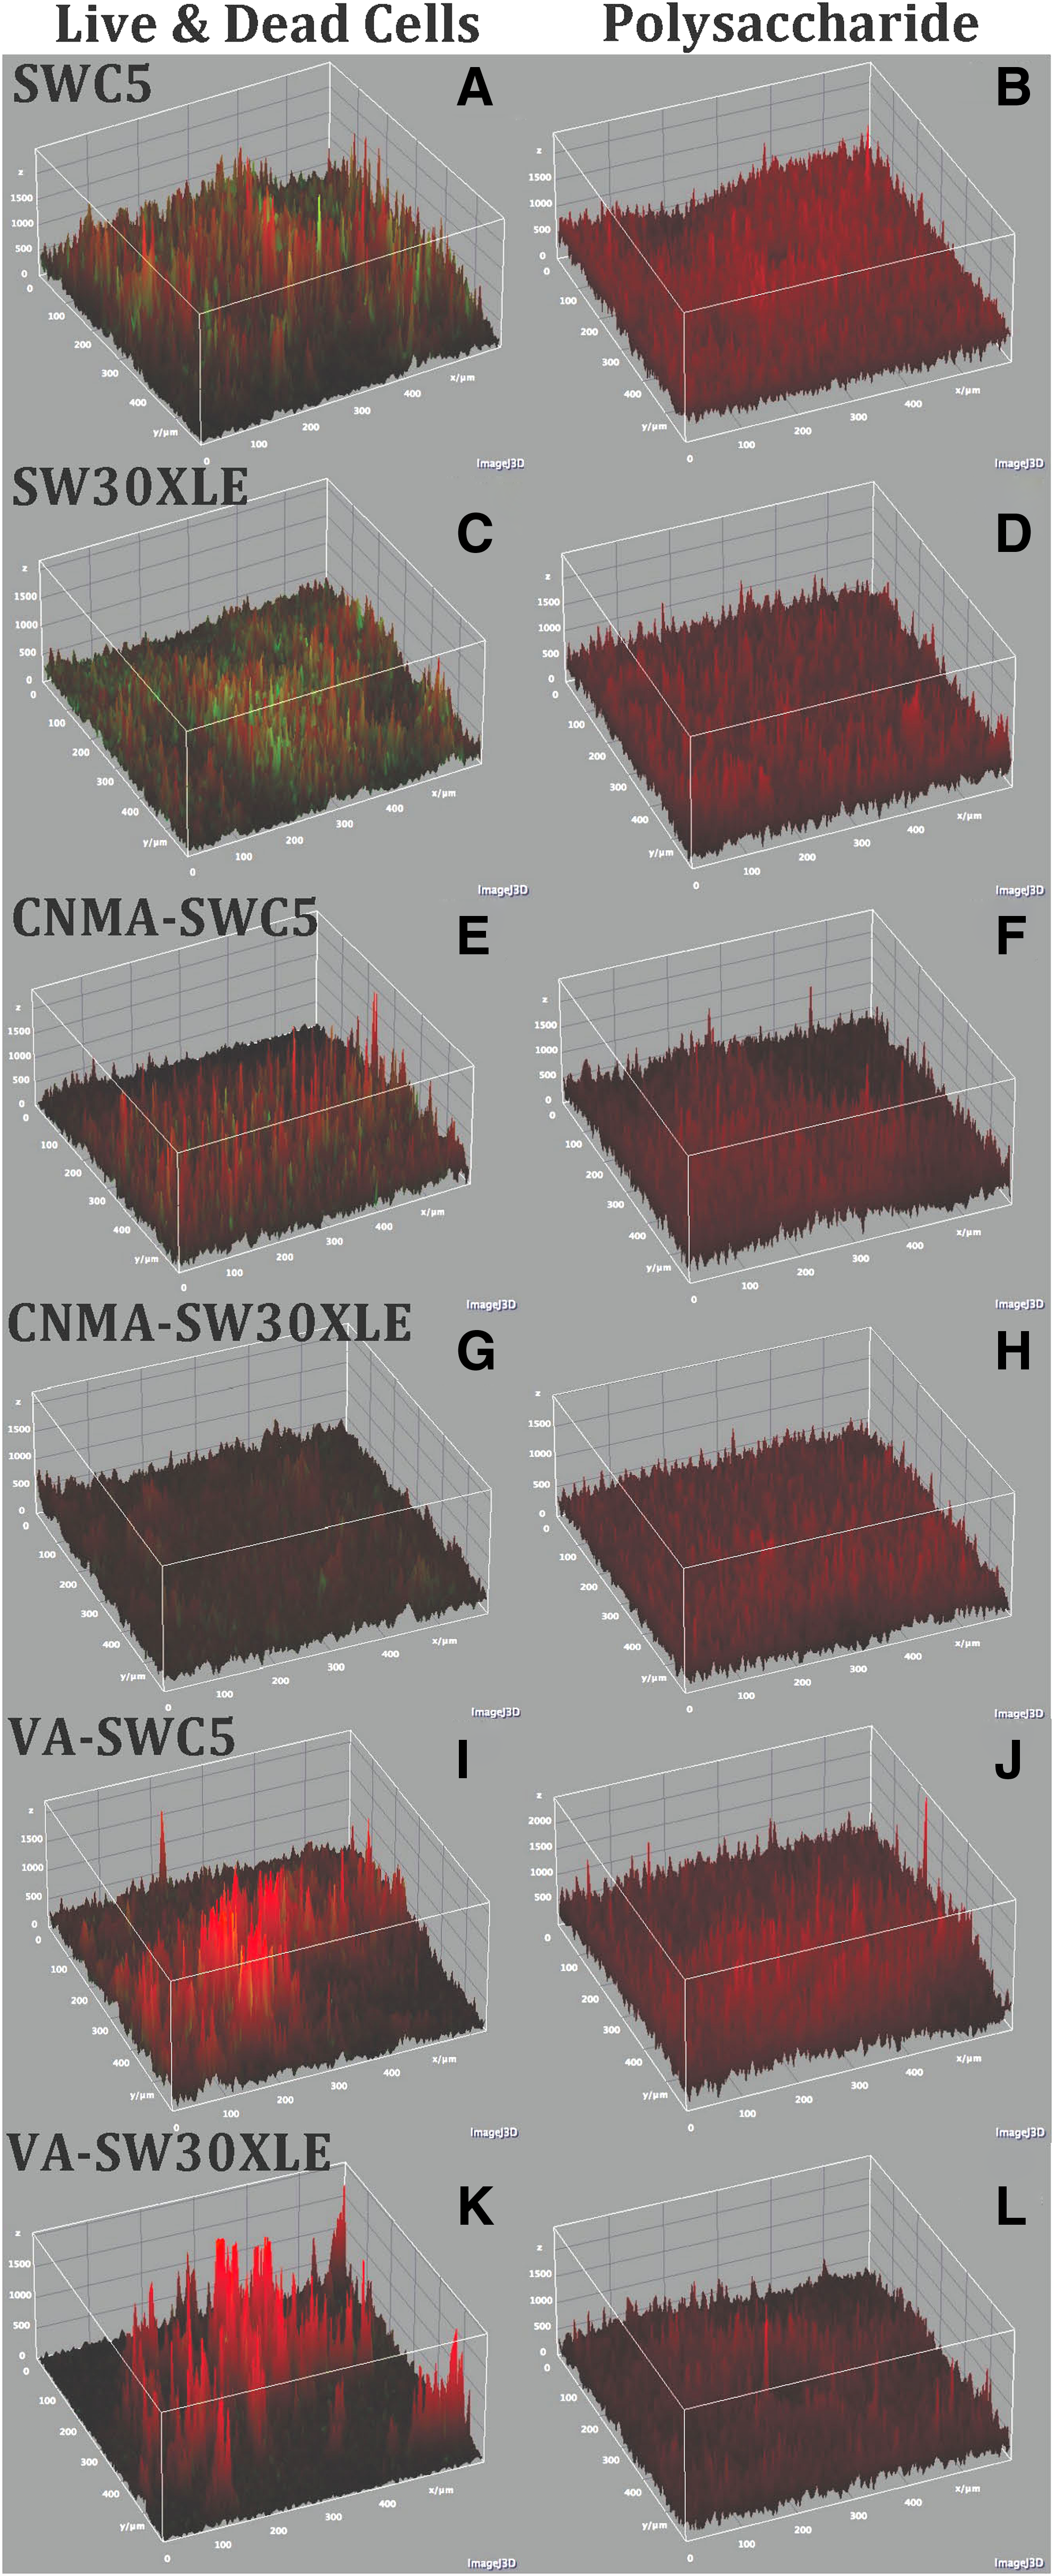
Confocal 3-D images of live (green) and dead (red) bacterial cells
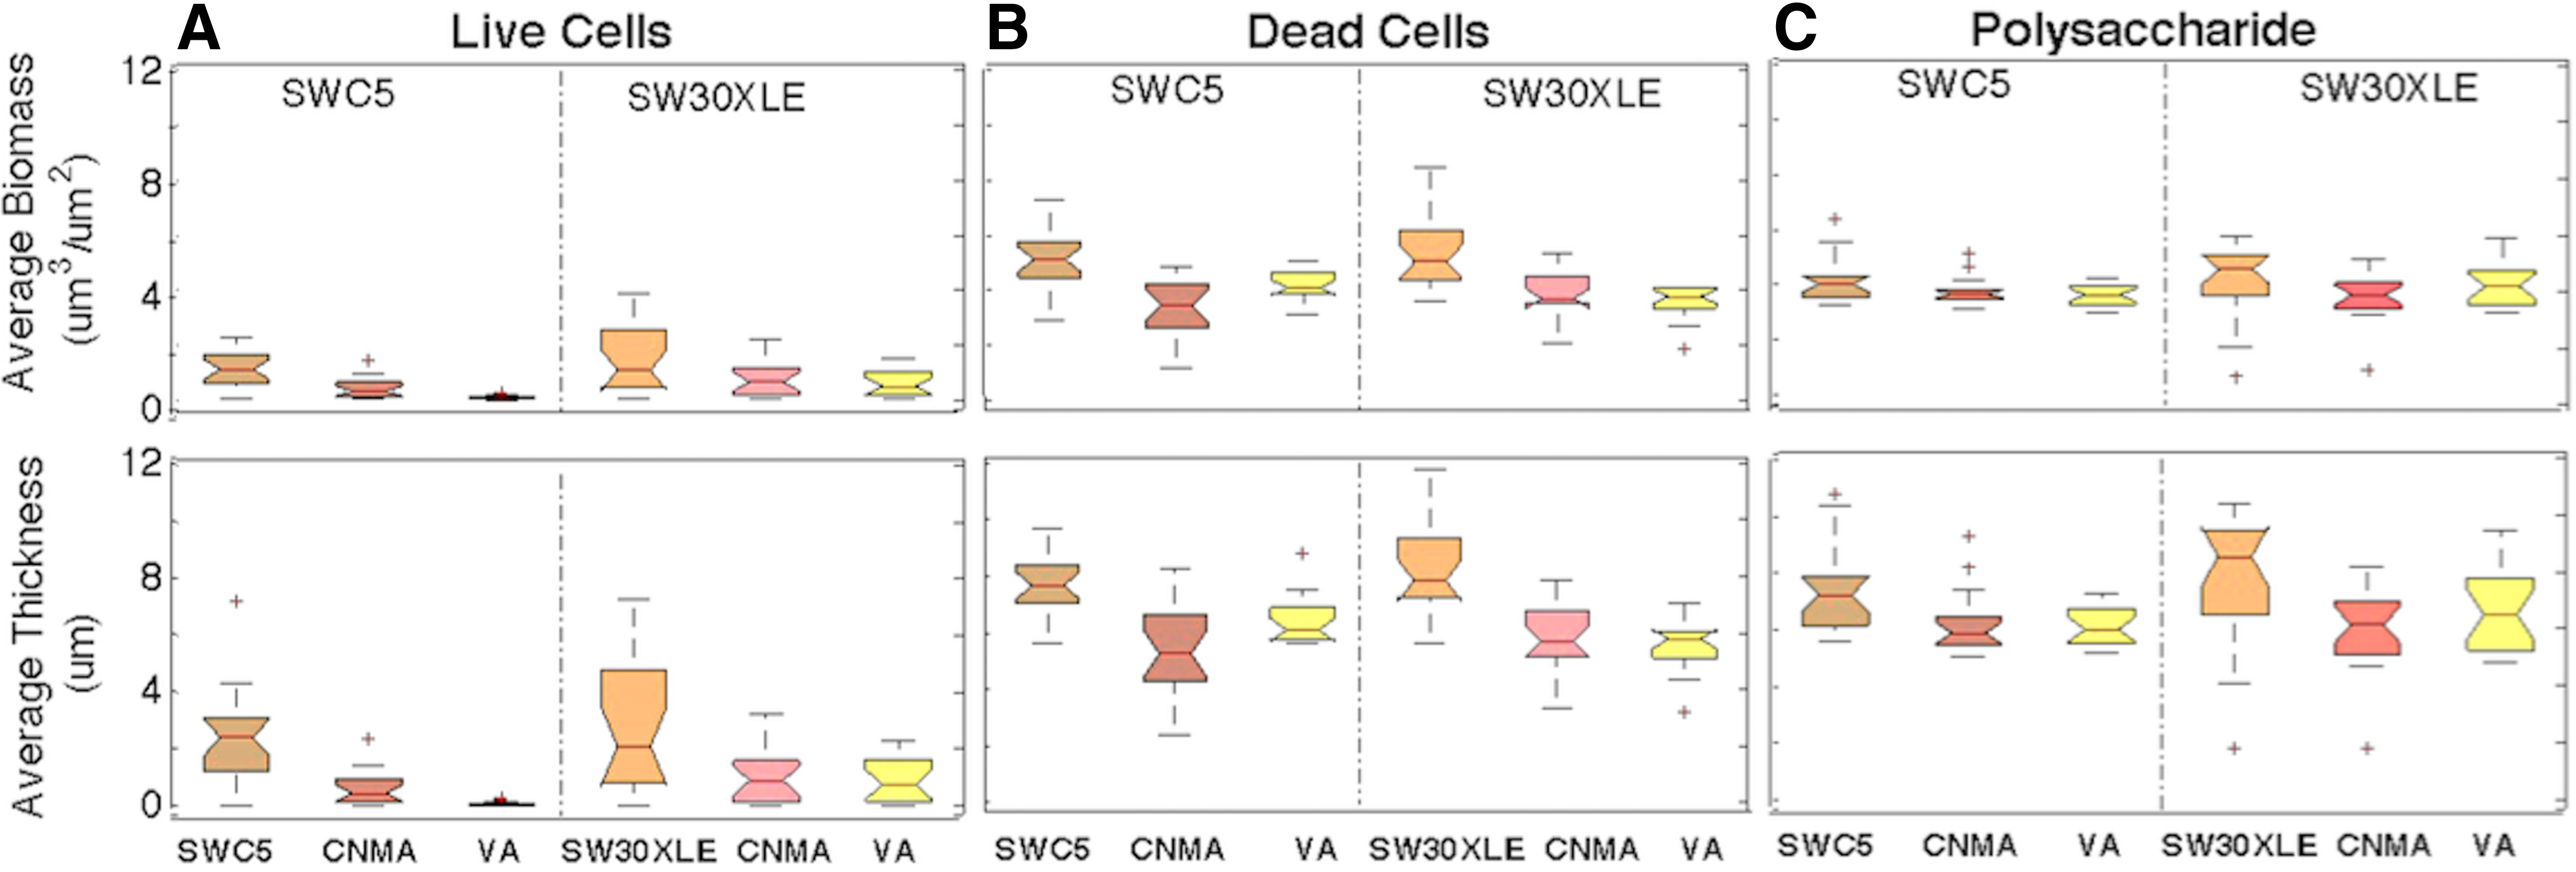
A mixed Alteromonas sp. and Shewanella sp. biofilm formed on virgin and QSI (CNMA or VA)-modified SWC5 and SW30XLE membranes. The antibiofilm capabilities of QSI-deposited RO membranes were evaluated by comparing live cell
Similar to CNMA-modified RO membranes, confocal images showed that there was a significant reduction of live and dead cells on VA-modified membranes (Fig. 6I, K). The decrease in live cell biomass and thickness ranged between 58.39% and 97.83% (p < 0.05 for both membranes). Dead cell coverage on VA-SWC5 and VA-SW30XLE membrane surfaces reduced between 16.41% and 32.57% compared with unmodified membranes (p < 0.05 for all). Three-dimensional images further showed that there was a decrease in polysaccharide production on VA-SWC5 compared with the virgin membrane (Fig. 6B, J), which was confirmed by COMSTAT 2 data revealing a statistically significant reduction in the biomass (11.71%) and thickness (17.68%) of polysaccharides (p < 0.05 for both, Fig. 7C). However, VA-SW30XLE was not significantly different in polysaccharides content in comparison to the respective virgin membranes (Fig. 7C).
Along with consistent observations of biofilm reduction on QSI-RO surfaces at the end of the fouling experiments, the modified membranes experienced minimal losses of initial permeate flux rates over the biofouling period (Fig. 8A, B). The virgin SW30XLE membrane had about 50% loss of its original permeate flux, whereas the QSI-SW30XLE had less than a 34% reduction (Fig. 8B). The difference in flux rates for modified and virgin SWC5 membranes was not as obvious in comparison to SW30XLE membranes. Both QSI-SWC5 and virgin SWC5 membranes had similar initial permeate flux rates, which gradually declined between 15% and 22% over the biofouling period (Fig. 8A). Modified SW30XLE membranes experienced slightly lower initial permeate flux rates than virgin SW30XLE membrane (0.030 ≤ p ≤ 0.044).
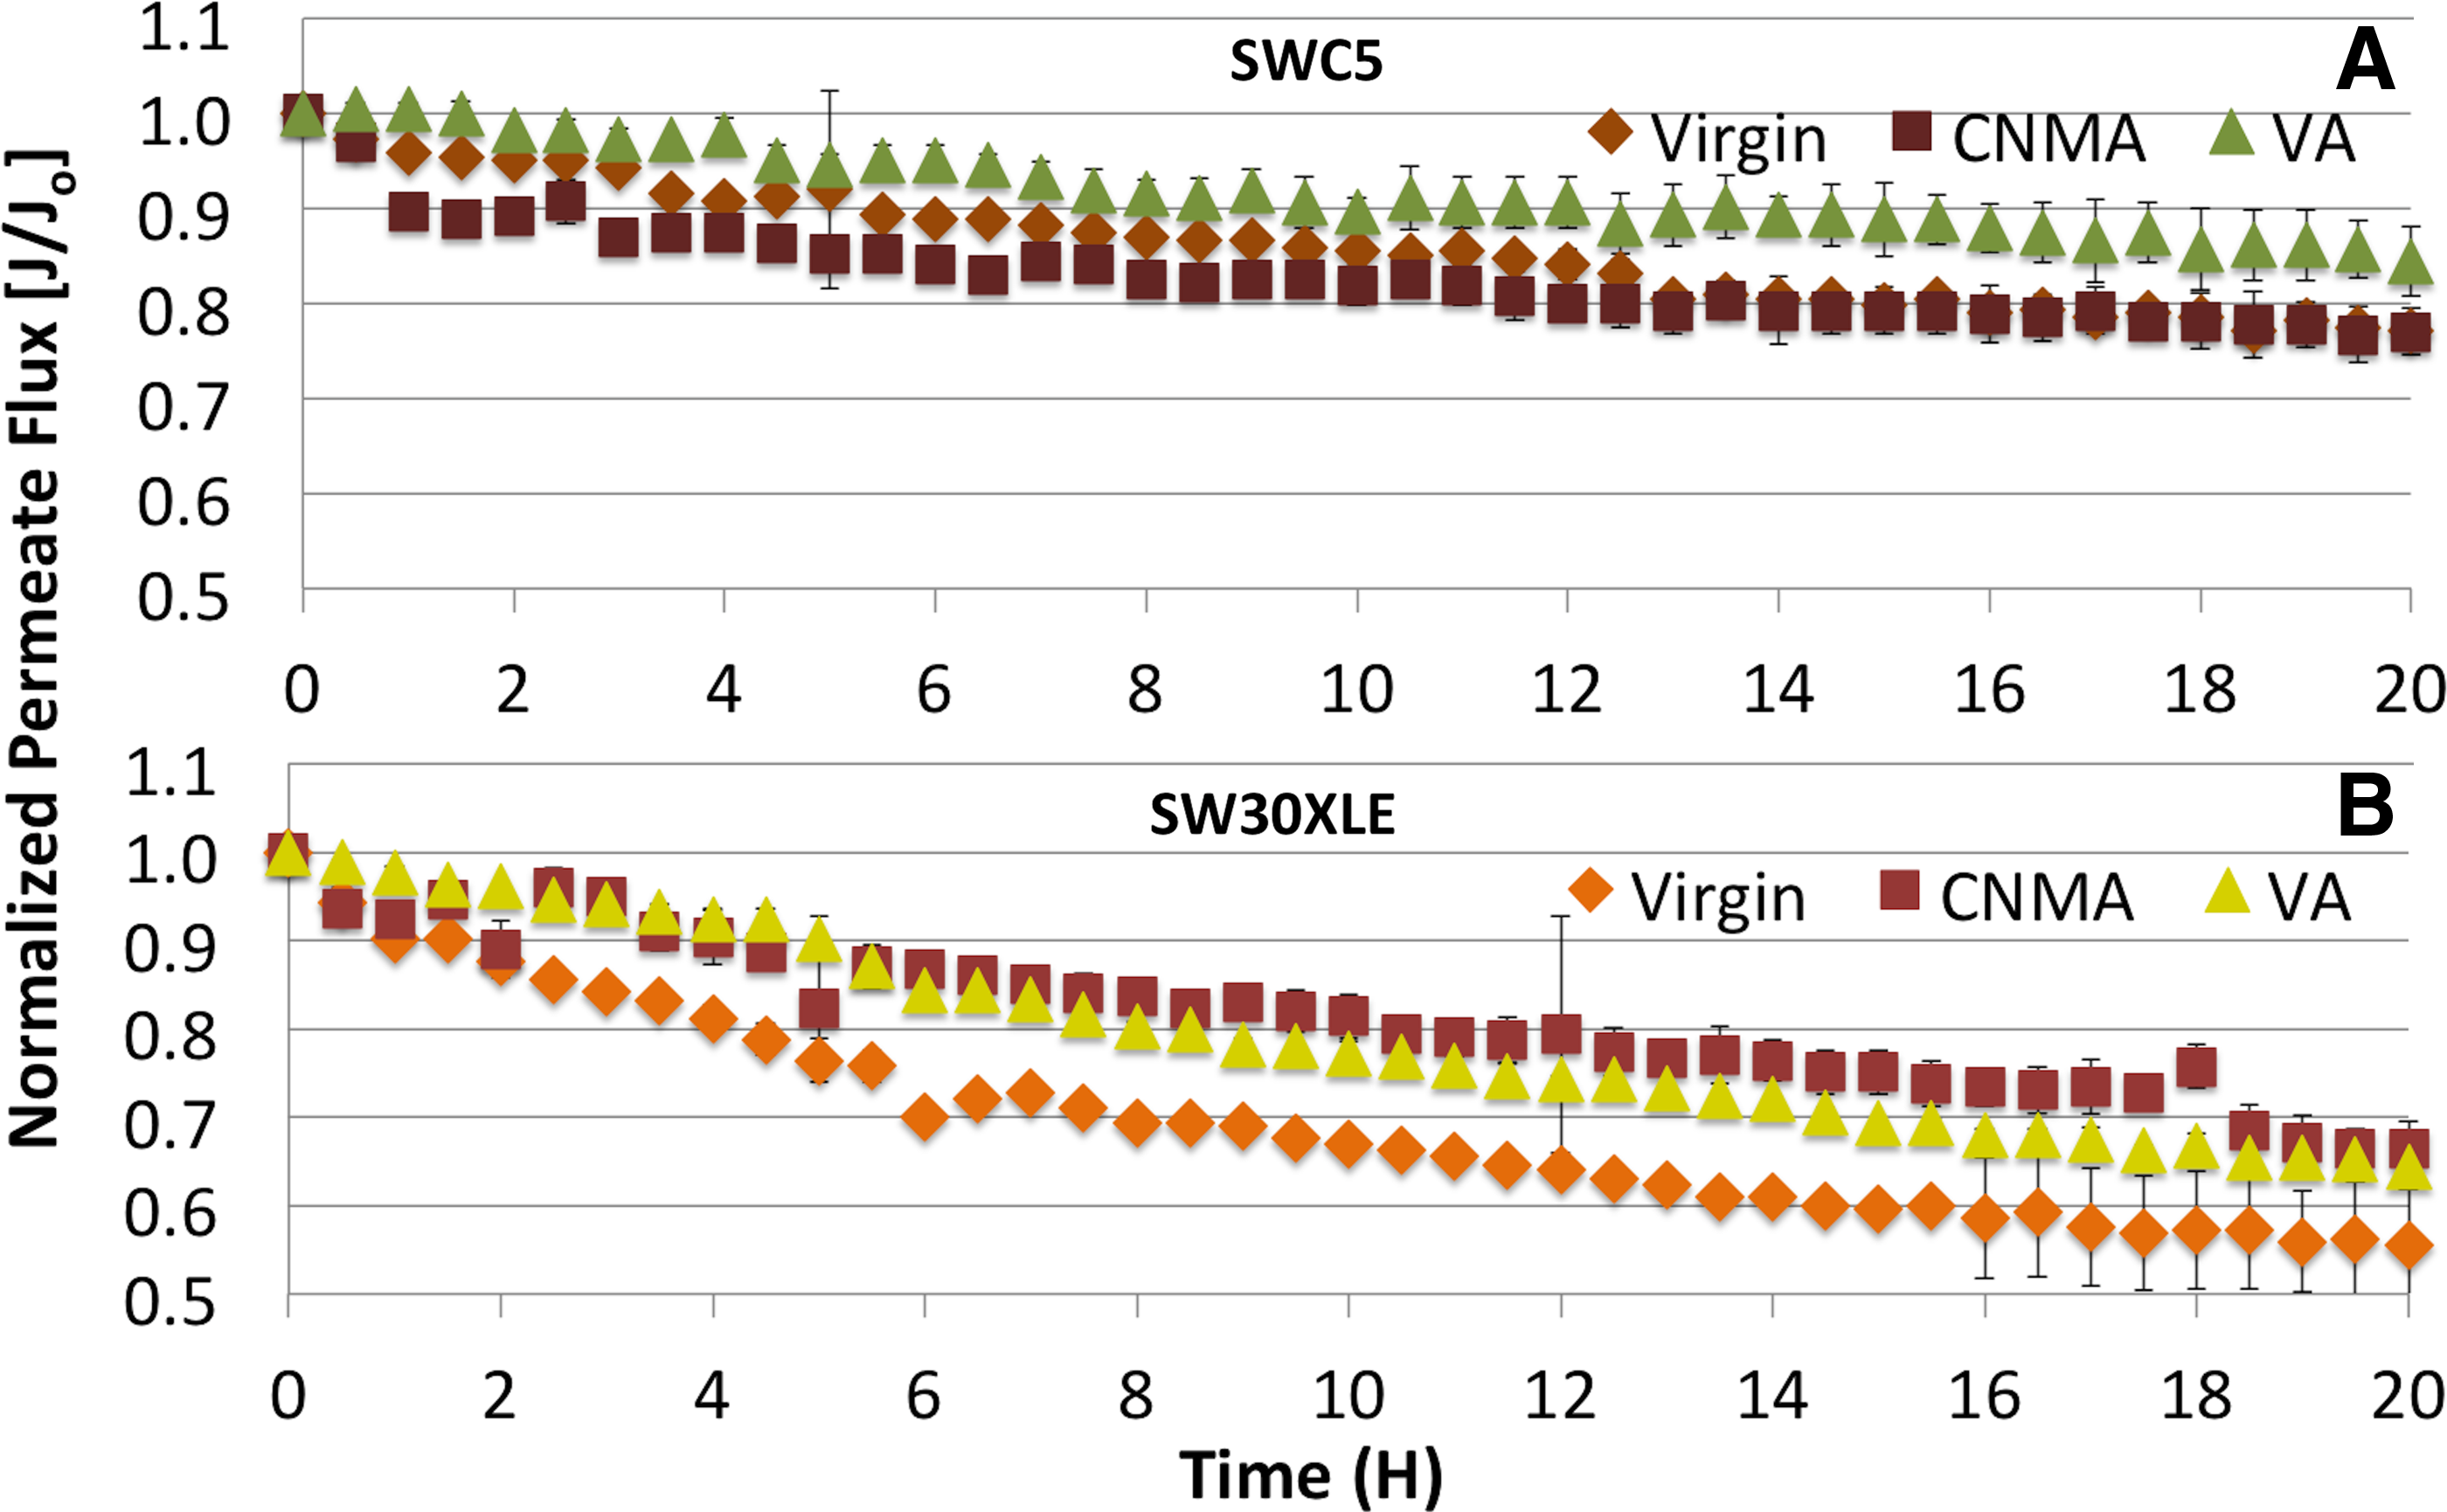
Normalized permeate flux rates for QSI (CNMA and VA)-modified and virgin RO membranes, SWC5
Discussion
Two QSIs, CNMA and VA, were successfully incorporated onto commercially available TFC polyamide RO membrane surfaces through physical adsorption. The incorporation was physically stable upon DI water flushing with high crossflow velocity. Physical adsorption is believed to be the main mechanism of the QSI attachment since no major new chemical bond was observed by Raman spectral analysis. However, we cannot rule out the formation of minor chemical bonds, as indicated by a new Raman spectral peak at 1,628 cm−1 (Fig. 4A) on VA-RO membranes. This peak does not belong to either the membrane materials or VA, but corresponds to a shift base reaction (Socrates, 2004) between the aldehyde (VA) and amide (polyamide) functional groups suggesting that a new chemical bond may be formed.
Even though the two modified commercial membranes shared identical Raman spectra, the maximum amount of QSIs adsorbed to the virgin SWC5 and SW30XLE occurred at different times. Efficiency of QSI attachment onto the membranes could be due to subtle differences in the membrane surface properties. Any differences in the arrangement of the polyamide may hinder or increase QSI affinity to the polyamide surface. This was further evident by the uneven QSI adsorption on the RO surface as illustrated in the large standard deviations in the QSI peak areas (Figs. 3C, D and 4B, C), which was potentially due to the inherent SWC5 and SW30XLE membrane surface roughness.
QSI incorporation on TFC RO membranes can also be noted by changes in hydrophilicity of the membranes. The contact angle of both the virgin SWC5 and SW30XLE membranes changed when the QSI layer formed on the RO surface (Fig. 5C). Since CNMA and VA have limited water solubility due to the presence of hydrophobic (i.e., benzene) and hydrophilic (i.e., aldehyde) functional groups, the QSI layer on the RO membrane surface significantly altered the contact angle to reflect the property of either CNMA or VA.
As the QSI adsorbs onto the polyamide RO surface there is a potential for the QSI to act as a foulant to block water transport through the membrane. Although QSI-RO had slightly lower pure water permeate flux, membrane performance was not significantly compromised. QSI modification also did not impact the overall membrane performance during the fouling period although the initial permeate flux rates of modified membranes also were slightly lower.
In a high-pressure RO system subjected to harsh biofouling conditions, QSI-RO membranes experienced a significant reduction in biofilm coverage on membrane surfaces. QSI-RO membranes also exhibited a slow decline of permeate flux compared with virgin membranes. The mechanism of biofilm reduction for QSI-RO membranes could be due to either the QSI ability of CNMA or VA to block bacterial communication or other not yet understood mechanisms that deserve future research. It was also unclear if the reduction of VA and CNMA Raman spectral peak areas on modified membranes after the biofouling experiment was due to detachment of QSI from the polyamide surface or because of the consumption of QSI by bacteria in serving the function of QS inhibition.
Future research should investigate improving methods for QSI attachment on RO surfaces. It is essential to ensure that the QSI activity remains intact. The antibiofilm capabilities of VA and CNMA rely on the compounds' ability to disrupt bacterial communication by either altering the bacterial QS molecule or reducing the ability of QS molecule to bind to the receptor protein (Niu et al., 2006; Brackman et al., 2008; Ponnusamy et al., 2009, 2013). To achieve continuous slow release of CNMA at the membrane surface, a past study modified the membrane surface with encapsulated CNMA (Zodrow et al., 2014). However, the authors found that the low concentration of CNMA released at the membrane surface did not reduce Escherichia coli biofilm formation (Zodrow et al., 2014). It is possible that either the QSI active site was altered during CMNA encapsulation or that the CNMA concentration released was not sufficient to block bacterial QS. A deeper understanding on the QSI's antibiofilm capabilities and the chemical structure of the QSI is necessary to successfully modify the RO surface. Our study focused on physically attaching QSIs to the RO surface to first gain an understanding of QSI affinity toward the polyamide RO surface to minimize losses in QSI activity.
Conclusions
This study found that the QSIs, CNMA and VA, were physically adsorbed onto two commercially available seawater grade RO membrane surfaces with a maximum deposition time of 24 h for SWC5 and 48 h for SW30XLE membranes. The QSI layer on the RO surface changed the membrane contact angle to reflect the hydrophilicity of each QSI, but QSI incorporation did not change pure water permeability and salt rejection significantly. During biofouling studies using a mixture of Alteromonas sp. and Shewanella sp. biofilm-forming bacteria, QSI-modified membranes experienced a significant reduction in live cells, dead cells, and polysaccharide production with a minimal loss in permeate flux compared with unmodified membranes. The results of this study demonstrated that QSI-modified membranes have the potential to diminish membrane biofilm formation for seawater desalination plants.
Footnotes
Acknowledgments
The funding for this research was provided by Dow Chemical and the Resnick Sustainability Institute under the Dow–Resnick Bridge Program at the California Institute of Technology. The authors would like to thank the committee members of Dow–Resnick Bridge Program for providing valuable suggestions and feedback for the project. They would also like to express their gratitude toward the facility directors at the Laser Spectroscopy and Optical Biological Core Facilities at the University of California, Irvine who provided guidance of the microcopy work. The authors would also like to thank Sterlitech for working with them to provide a high-pressure RO system rental.
Disclosure Statement
No competing financial interests exist.