
Abstract
Abstract
To improve water quality in the Haihe River, 6 cycle routes and 16 water diversion schemes were simulated, and their influence on water quality was analyzed. First, a one-dimensional hydrodynamic and water quality model of the Haihe River was established. Then, according to an orthogonal experiment, 16 cycle schemes were proposed, and an orthogonal experimental table, including 3 factors and 4 levels, was used to optimize the 16 schemes. Average pollutant concentration from Sanchakou to the Erdao Sluice served as the index for orthogonal experiments. Index values were obtained from the model and the influence of three factors on chemical oxygen demand, total nitrogen, total phosphorus, and nitrogen ammonia was evaluated by range analysis. In addition, optimal schemes to reduce pollutants in each route were also obtained. After comparing the simulated results of the optimal schemes in each route, an optimal route was obtained. A combination of the one-dimensional hydrodynamic and water quality models with orthogonal experimental design was found to provide an efficient method to simulate and optimize the schemes, thereby improving water quality by water flow regulation in plain river network regions by taking into account multiple factors such as water cycle route, the operation of sluice, and the water diversion project.
Introduction
P
According to previous studies (Zhou et al., 2013; Julian et al., 2015; Zhang, 2015; Zhao et al., 2015), plain river network regions have superior natural conditions, abundant water resources, developed social economies, and large populations, which are beneficial for social and economic development. However, water resources are subject to high environmental pressures. For example, plain river network regions have slow water velocity and weak water discharge, resulting in a series of environmental and ecological problems. With the development of urbanization and the continuous intervention of human activities, the number of sluices and pump stations in plain river network regions is increasing; thus, rivers are currently divided into different sections, worsening river connectivity. In addition, point source and nonpoint source pollutants are discharged into rivers, which cause severe water-based environmental problems. Therefore, it is important to perform comprehensive water quality and quantity control research on plain river network regions.
Water flow regulation is a method to measure water quality regulation indirectly, and on this basis, technological measures, such as resource recovery and water cycling schemes, have been developed (Mccarty et al., 2011; Jin et al., 2015). These regulations were performed early in developed countries, and some effective measures were carried out. Water diversion projects have also been very effective to improve water quality (Pyka et al., 2016). Mathematical modeling also provides a useful tool to simulate water environment and demonstrate the potential for significant improvements in river water quality (Bach et al., 2014).
In China, rivers have been dredged to improve water circulation, and the total amount of pollutants discharged into rivers have been regulated; in addition, water diversion projects have been carried out (Zhou, 2011; Sheng et al., 2013; Chen et al., 2015). However, although the continuous deterioration of the water environment is currently controlled in local watersheds, the water quality of rivers, lakes, and reservoirs needs long-term improvement.
Water flow regulation is an efficient measure to improve water quality; however, there are many rivers, sluices, and dams in plain river network regions. The number of water cycle schemes will increase if the number of factors considered in the schemes increases. Therefore, it is necessary to select a method to formulate and optimize schemes. In this study, the combination one-dimensional hydrodynamic and water quality model with orthogonal experimental design was used to address this problem.
The Haihe River Basin, a typical plain river network region, represents an important economic, political, and cultural development center in China. In recent years, urbanization, human disturbance, riverbed hardening, discharge of point source and nonpoint source pollutants, and a massive loss of biodiversity have caused problems in the Haihe River mainstream. Although water pollution control in the Haihe River has achieved some goals in recent years, water quality is still poor and poses a threat to the ecological security and development of the economy (Chen et al., 2016; Rong et al., 2016). Therefore, it is imperative to improve the water environment and enhance water self-purification capacity in the Haihe River Basin.
Coupled water quality–quantity technology is based on the hydrodynamic and water quality model, which reflects the mutual influence between the qualitative and quantitative attributes of water resources. It is a comprehensive method that describes water quality and quantity control and has been used widely in water quality and quantity simulation (Zuo and Xia, 2002; Zhao et al., 2003, 2013). To address river blockage, water quality deterioration, and the destruction of the ecological environment, the Haihe River mainstream was selected as the research area and a one-dimensional hydrodynamic and water quality model was established. By using different diversion discharges, diversion durations, and the operations of the Erdao Sluice, 16 water diversion schemes were simulated. The effects of water cycle routes and water diversion on water quality were analyzed by range analysis, and optimal schemes were obtained from an orthogonal experimental design. This study will help improve water quality in the Haihe River mainstream and also provides a scientific basis and technical examples for protecting water ecosystems in plain river network regions.
Study Region
Geography conditions
The Haihe River Basin, located in the northern part of China, lies on longitude 112°–120° E and latitude 35°–43° N, with a drainage area of 318,200 km2. The Haihe River crosses Tianjin City and has many functions, such as drainage, water supply, shipping, and tourism. Its mainstream is the channel into the sea of five major rivers as follows: the Ziya, Daqing, Nanyun, Beiyun, and Yongding Rivers. The reach between the Qujiadian Sluice and Sanchakou in the Beiyun River, the reach between Xihe Sluice and Sanchakou in the Ziya River, and the reach between Sanchakou and Haihe Sluice in the Haihe River were included in the study area (Fig. 1). The Beiyun and Ziya Rivers flow into Haihe River in Sanchakou.
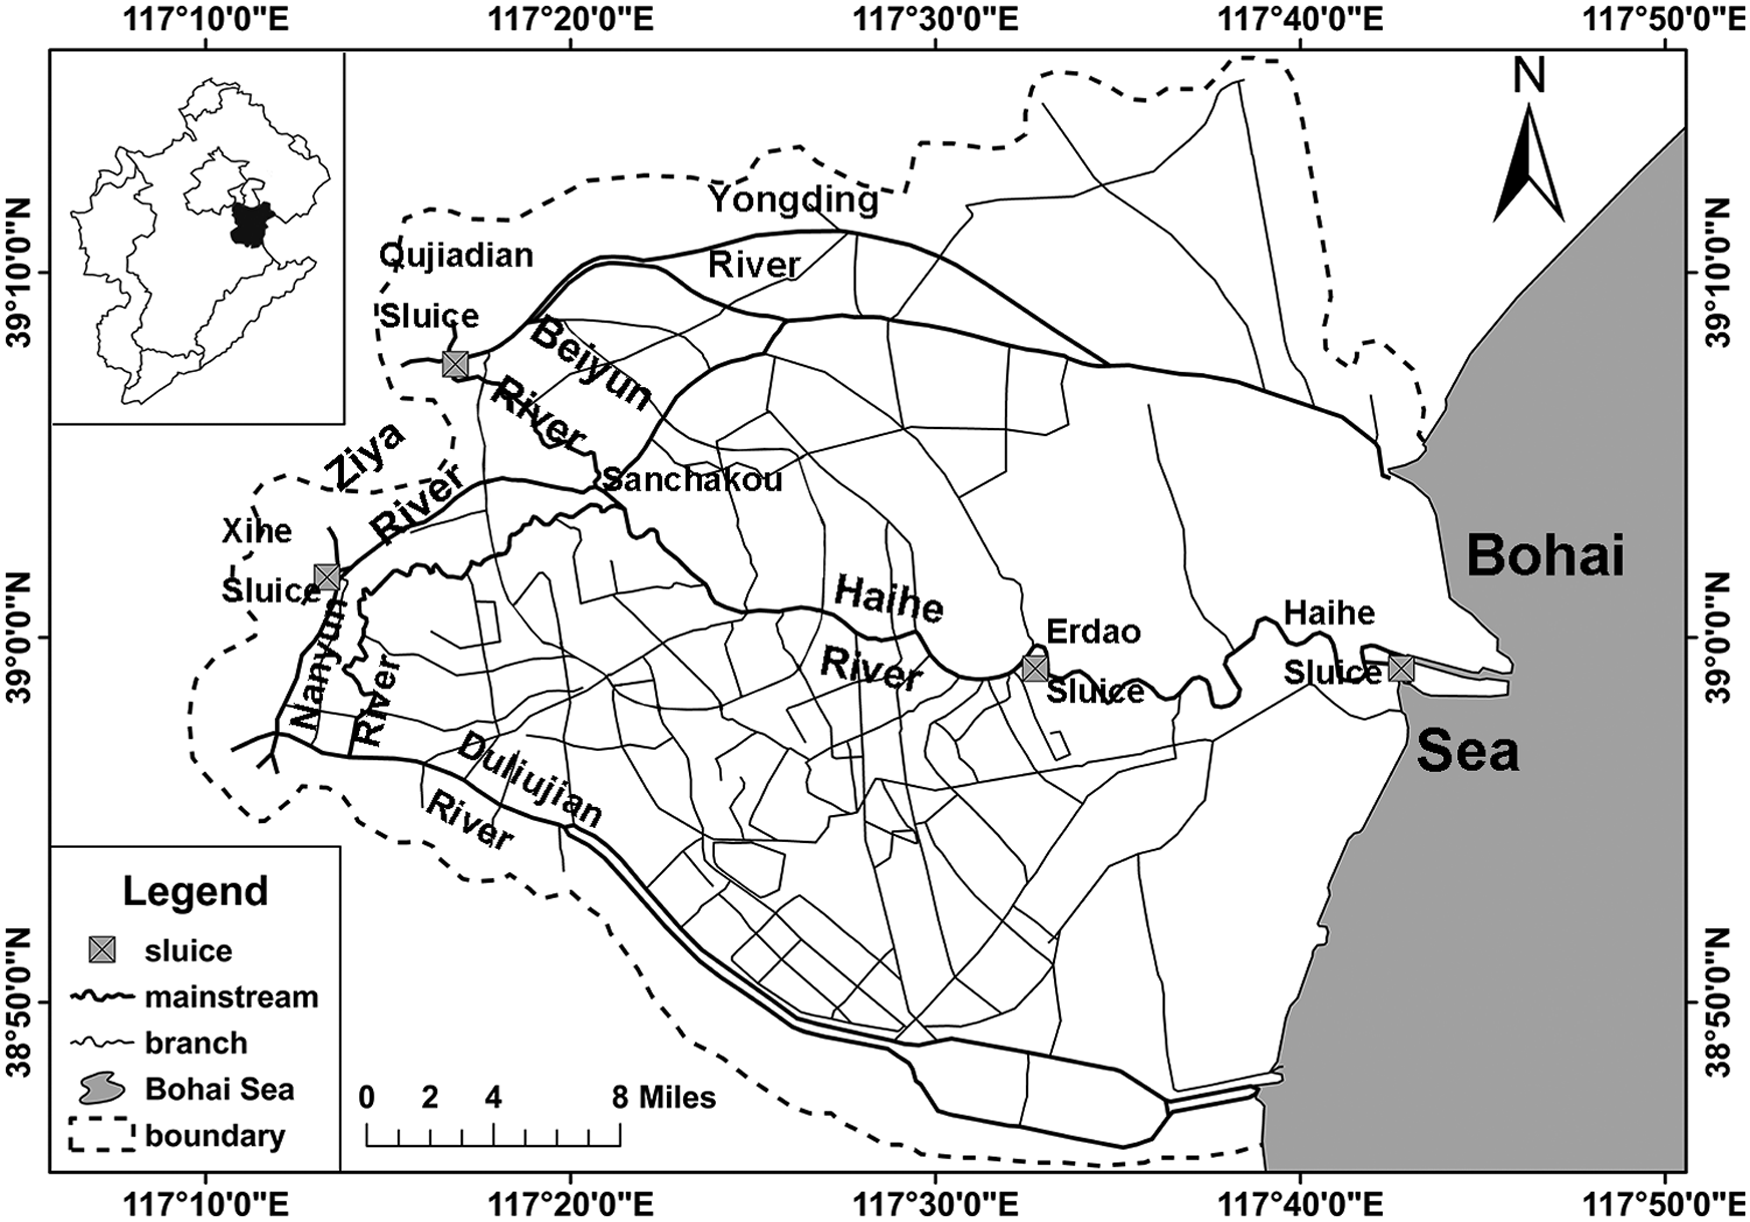
Study area location in Haihe River Basin.
The Beiyun River in the study area has a length of 16.7 km and 24 cross-sections in the model, and the first cross-section in the study area was located in Qujiadian Sluice; the Ziya River in the study area has a length of 15.7 km and 16 cross-sections in the model, and the first cross-section in the study area was located in Xihe Sluice; the Haihe River has a length of 71.5 km and 81 cross-sections in the model, and the first cross-section was located in Sanchakou. The first cross-sections in the Beiyun River and Ziya River in the study area were not the initial points in the two rivers. The distance from initial points in each river to each cross-section was named chainage, and the unit of chainage was meter. The cross-sections were named after chainage, and the location of the cross-sections was assigned based on chainage.
In this study, the first cross-section in the Beiyun River in the study area was named the 55,000 cross-section, which meant the distance from the cross-section to the initial point was 55,000 m; the last cross-section in the Beiyun River in the study area was named the 70,700 cross-section, which meant the distance from the cross-section to the initial point was 70,700 m. These naming methods of cross-sections were applied to the Ziya River and Haihe River as well. The chainage ranges in each river were 55,000–70700, 11,000–27,740, and 0–71,500.
Current state of water pollution
Environmental quality standards for surface water (GB 3838-2002) were published in 2002 in China. According to the standards, water at the Level-I water quality standard should be used as source water and for national nature reserves; water at the Level-II water quality standard should be used for concentrated drinking water of first-class reserves and for spawning grounds for fish and shrimps; water at the Level-III water quality standard should be used for concentrated drinking water of second-class reserves and aquaculture area; water at the Level-IV water quality standard should be used for industrial production and entertainment with no direct human contact; water at the Level-V water quality standard should be used for agriculture and common landscapes.
The Erdao Sluice divides the Haihe River mainstream into two sections; water quality in the two sections has varied in recent years. In 2010, the water quality upstream of the Erdao Sluice reached the Level-IV water quality standard, but the water quality downstream of the Erdao Sluice reached the Level-V water quality standard (Table 1). The water quality of branches was even poorer, and 40% of the water body was black and odoriferous, owing to the cyanobacteria bloom in summer.
COD, chemical oxygen demand; NH3-N, nitrogen ammonia; TN, total nitrogen; TP, total phosphorus.
According to statistical reports of water quality in the Haihe River from 2010 to 2015, the major pollutants in the Haihe River were total nitrogen (TN) and chemical oxygen demand (COD), followed by total phosphorus (TP) and nitrogen ammonia (NH3-N). The current state of pollution is shown in Table 2.
Methodology
One-dimensional hydrodynamic model
MIKE 11 HD applied with the dynamic wave description solves the vertically integrated equations of the conservation of continuity and momentum (the Saint-Venant equations), on the basis of the following assumptions:
1. Water is incompressible and homogeneous. 2. The slope of the bottom is small, thus the cosine of the angle may be taken as 1. 3. Wave length is far larger than the water depth. 4. The flow is subcritical.
The specific forms of the equations are as follows:
where Q is the discharge, m3/s; A represents the flow area, m2; q stands for lateral inflow, m3/s; h is water deep, m; Cz is Chezy resistance coefficient; R represents the hydraulic or resistance radius, m; t is the time coordinate, s; x is the space coordinate, m; α is the momentum distribution coefficient.
One-dimensional water quality model
The one-dimensional advection–dispersion equation for matter in water is as follows:
where C is the concentration of pollutants, mg/L; D stands for dispersion coefficient, m2/s; K is comprehensive decay coefficient, s−1; C2 represents the source or sink concentration, mg/L.
The advection equation is the second term on the left in Equation (3) and the dispersion equation is the third term on the left in Equation (3). Two mechanisms of material transport are expressed by Equation (3) as follows: advective transport is in proportion to discharge, so it is also in proportion to flow velocity. Dispersive transport is related to concentration gradients. Advective transport plays a dominant role in mass transport process in lotic environments. Dispersive transport cannot be neglected in lentic environments. Equation (3) has three basic assumptions as follows: (1) the material is completely mixed at the cross-section, (2) the material is conserved or decays linearly, and (3) Fick's law is satisfied.
Mike 11 AD was used to simulate advective and dispersive transport processes. In this module, changes of nonconservative matter concentrations in time coordinates due to the effect of water flow and concentration gradient were reflected and simulated by the comprehensive decay coefficient as the concentrated expression of complex processes. In fact, a comprehensive coefficient simulated the change, not taking into account the specific changing processes of pollutants, such as denitrification, nitrification, mineralization. The complex pollutant processes influencing concentration were replaced with the comprehensive decay coefficient. The value of the comprehensive decay coefficient was obtained from calibration and validation processes; it was found to be reliable.
Establishment of the One-Dimensional Hydrodynamic and Water Quality Model
One-dimensional hydrodynamic model
Calculation conditions
The basic calculation conditions for the model were as follows:
1. Terrain conditions:
Topographic data were cross-section based on the 1985 National Elevation Standard, and the interval between cross-sections was ∼1,000 m.
2. Hydrological conditions:
Discharge and water level data during the flood season (July 1 to October 1) in 2015 and 2014 were used to calibrate and validate the parameters.
3. Boundary conditions:
Boundaries (Fig. 2) included three outer boundaries, two inner boundaries, and nine lateral inflow processes.
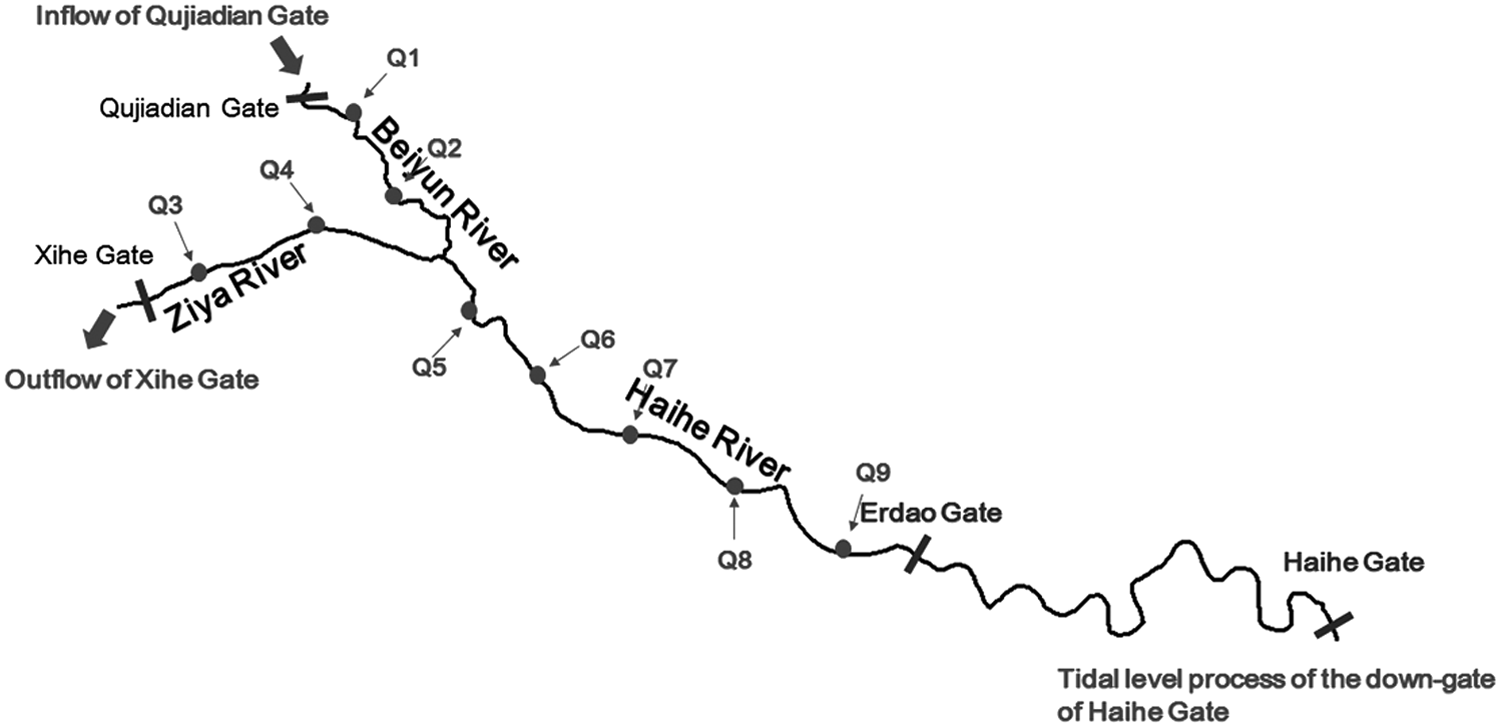
Boundary conditions of hydraulic model.
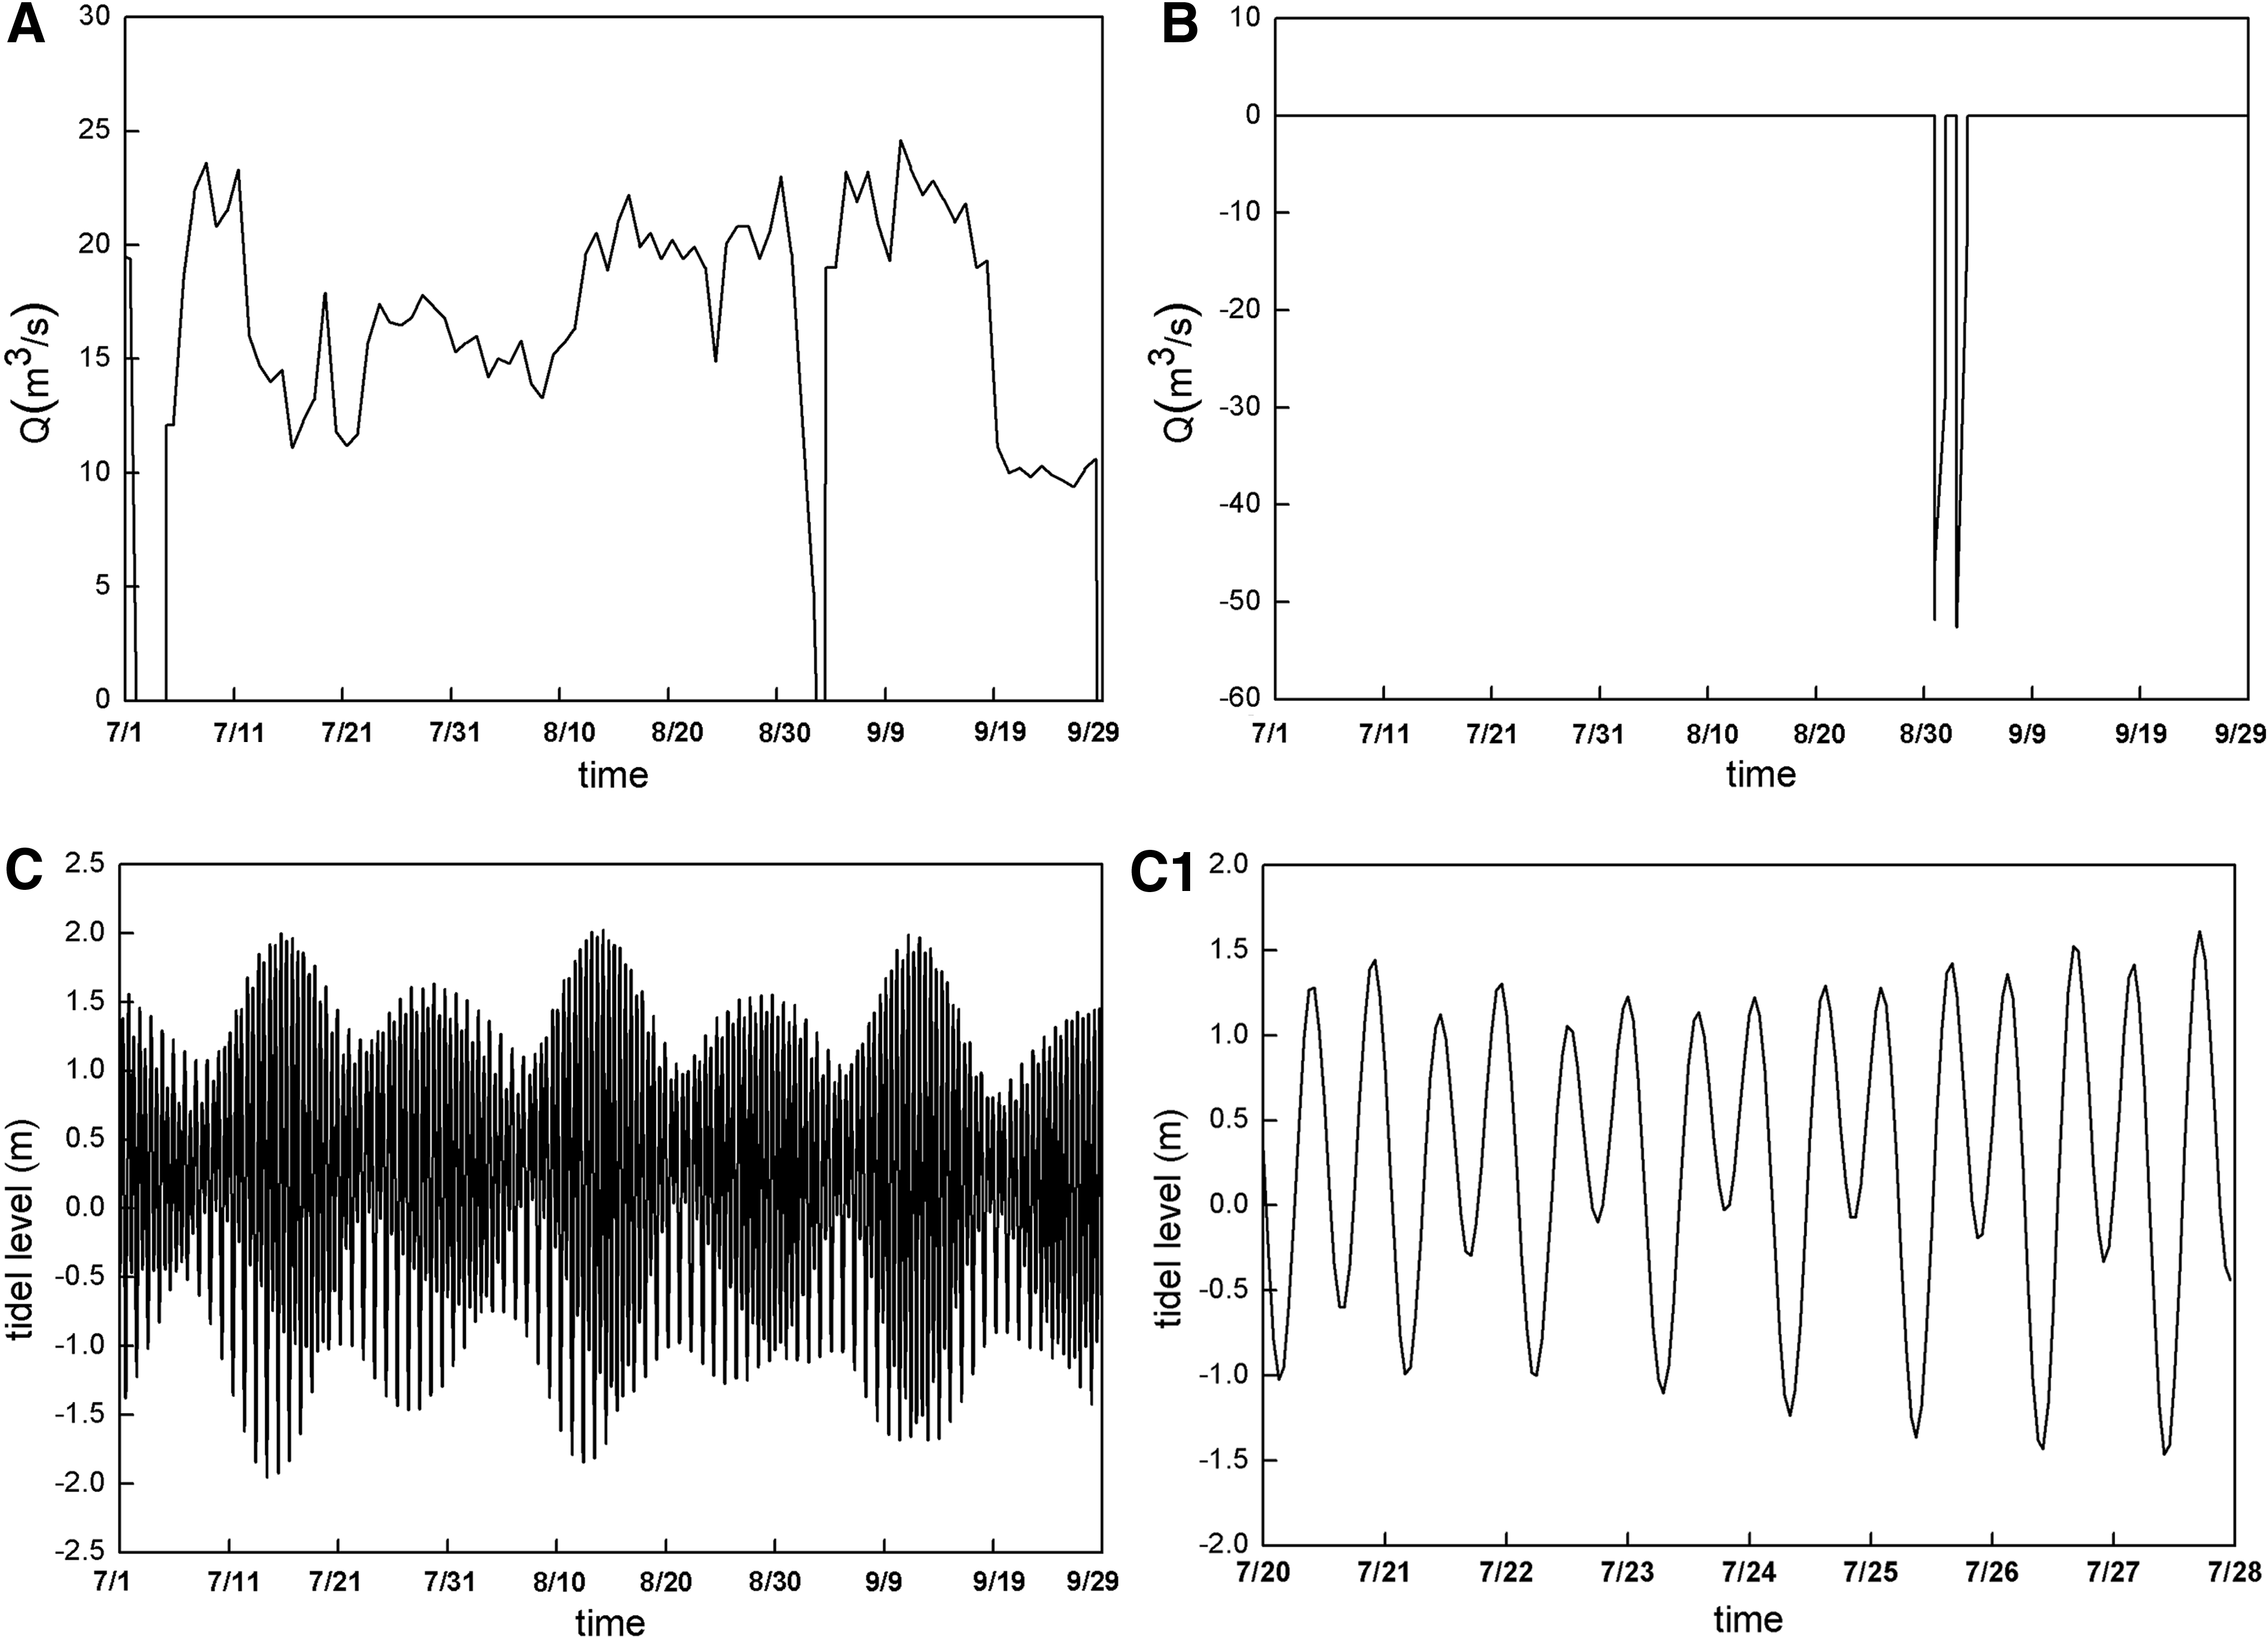
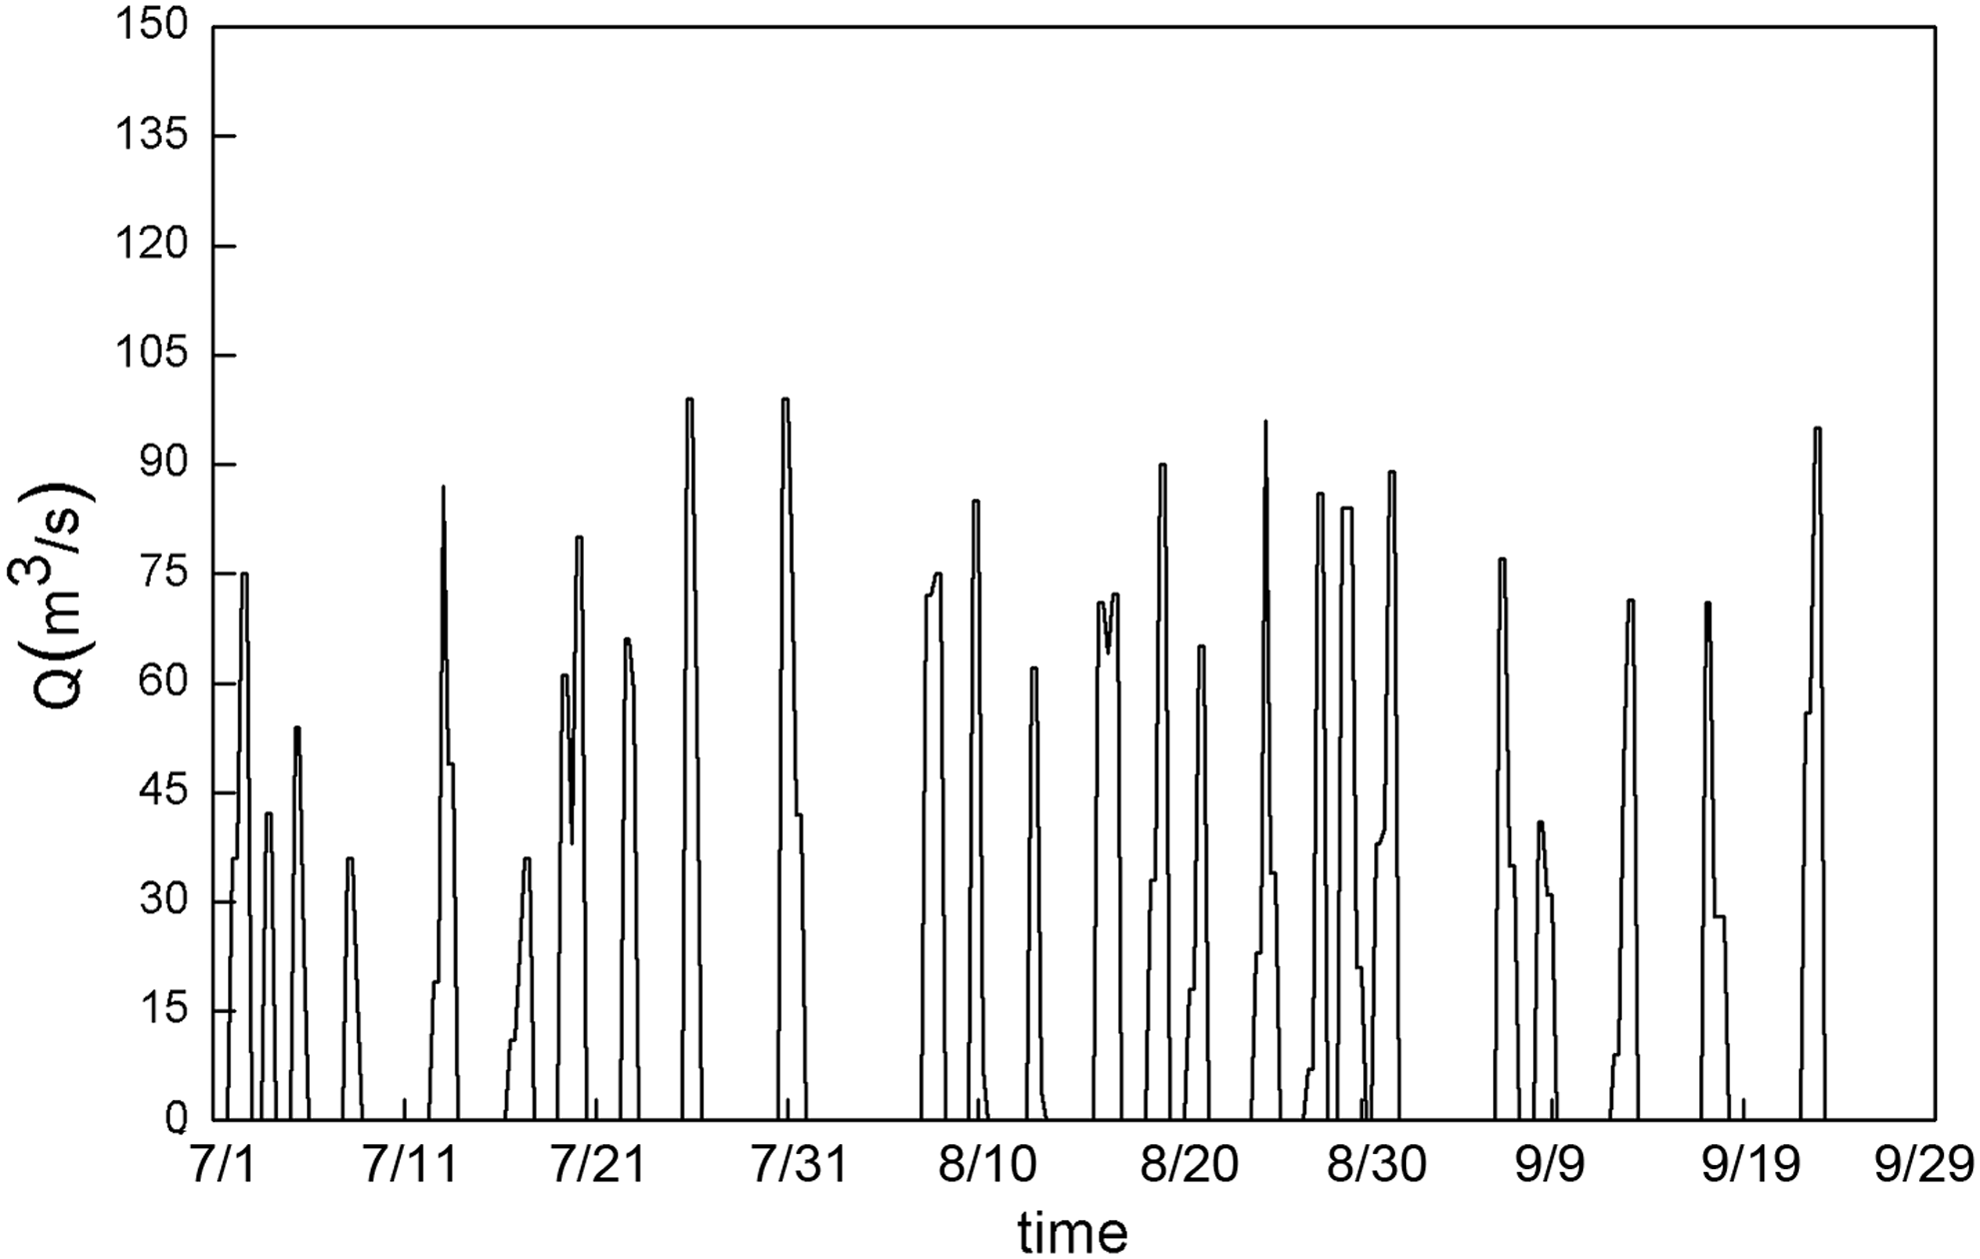
The upstream boundary conditions were the inflow process of the Qujiadian Sluice (Figs. 3A and 4A) and the outflow process of the Xihe Sluice (Figs. 3B and 4B); the tidal level process downstream of the Haihe Sluice (Figs. 3C and 4C) was the downstream boundary condition.

Erdao Sluice and Haihe Sluice were the inner boundaries. The operation of Erdao Sluice was based on measured discharge data (Figs. 5 and 6). Haihe Sluice was closed to prevent sea water intrusion except for when the up-sluice water level was higher than the down-sluice water level.
Calibration discharge.
Validation discharge.
4. Lateral inflow:
The Storm Water Management Model (SWMM) includes a hydrological model, a hydrodynamic model, and a water quality model. It primarily simulates precipitation and runoff generation and is widely used for the simulation of storms and floods in the city.
SWMM was established to study runoff and pollutants generated by rainfall in Tianjin City (Li, 2016). Based on terrain slope data and drainage network conditions, Tianjin City was divided into 415 subcatchment areas (Fig. 7A). To show subcatchment areas clearly, a part of the division diagram, subcatchment areas in city center, is shown in Fig. 7B.
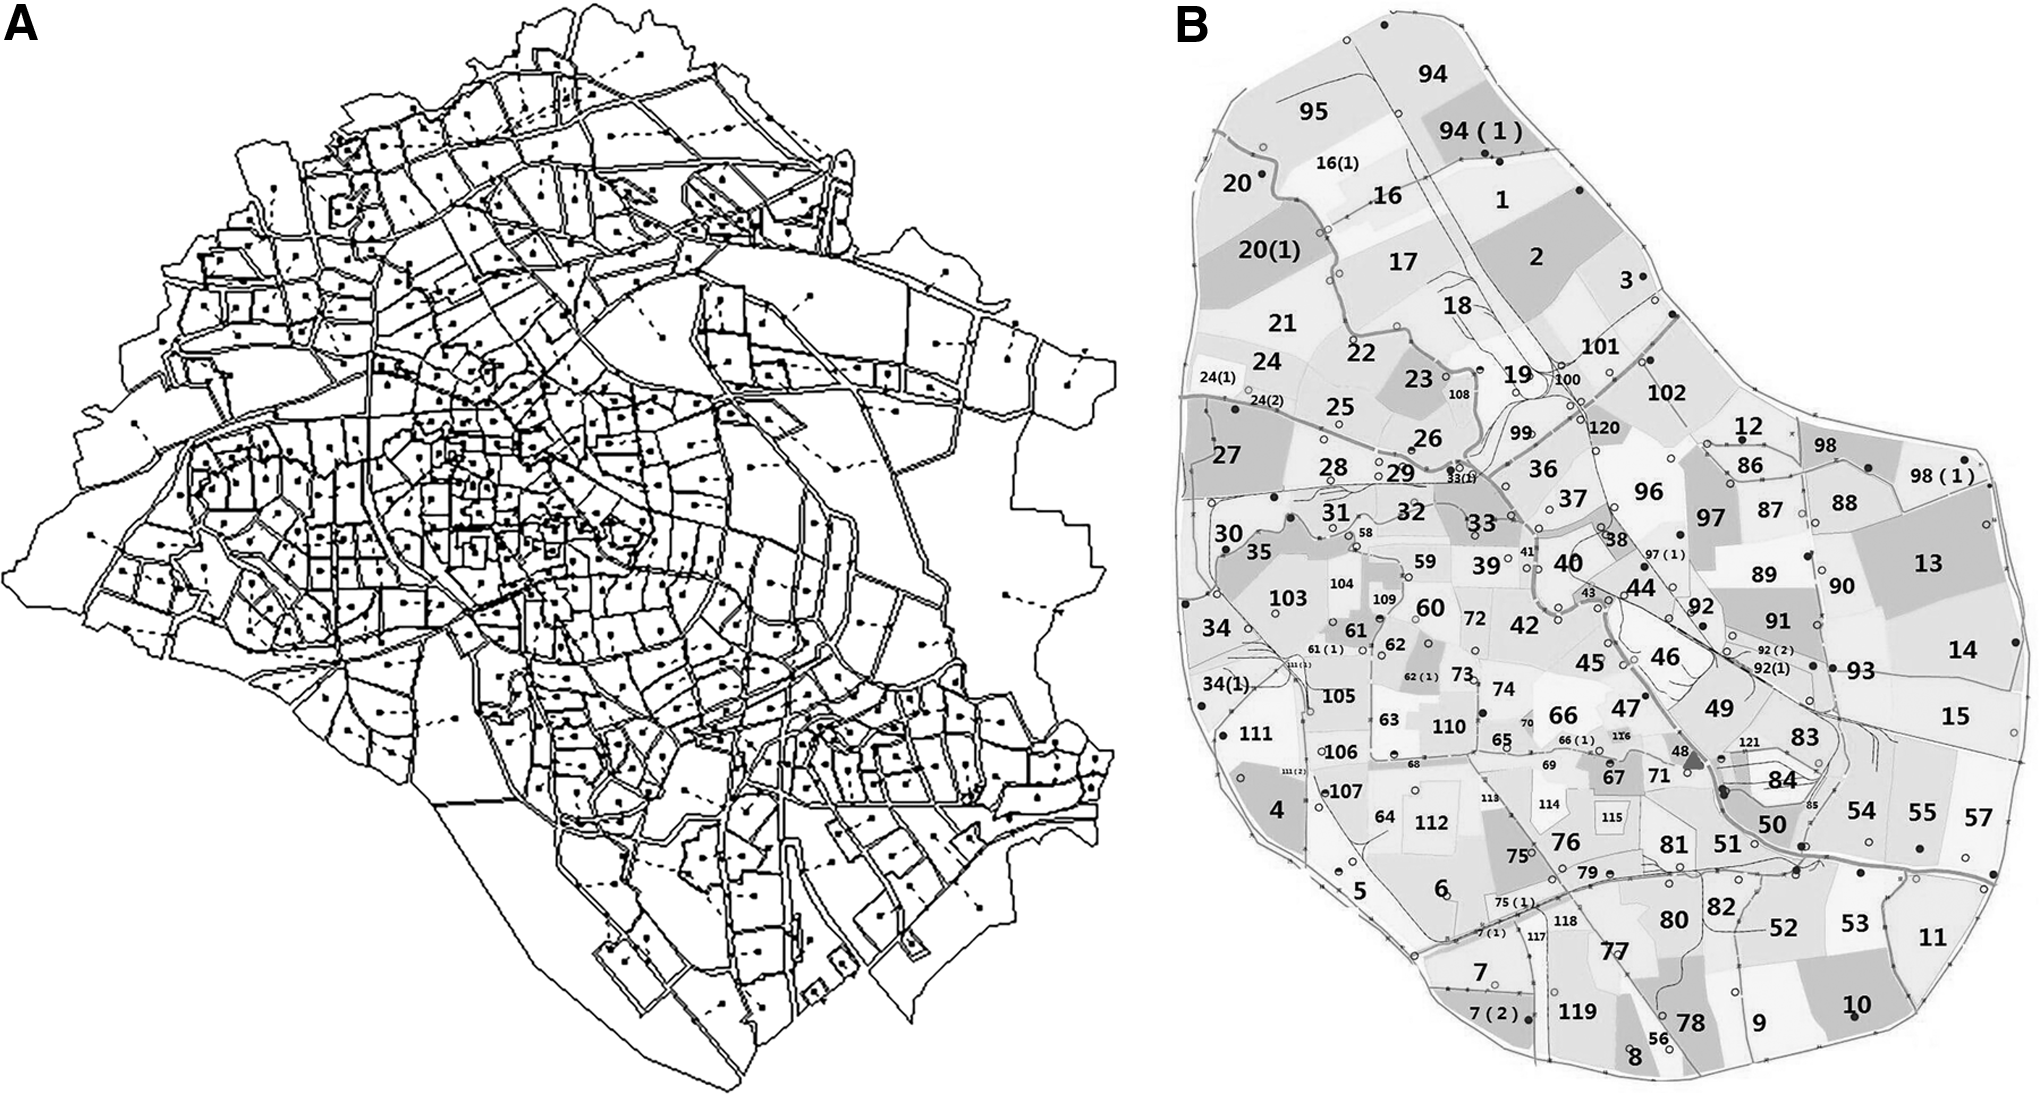
Some parameters in the model were obtained from measurement, such as the area and width of the subcatchment. Other parameters were obtained using measured data of calibration and validation, such as roughness, washoff coefficient, and buildup constant. The model was used to study runoff and nonpoint pollutants in different rainfall conditions, and the results were found to be reliable.
In this study, measured nonpoint pollutant data during the simulation period were short, so the rainfall data during the simulation period were input into Li's (2016) SWMM to obtain runoff and water quality processes of lateral inflows. Although runoff and water quality data of lateral inflows were obtained by simulation, the error was acceptable according to Li (2016), and the results reflected the characteristics of runoff and nonpoint pollutants in Tianjin City.
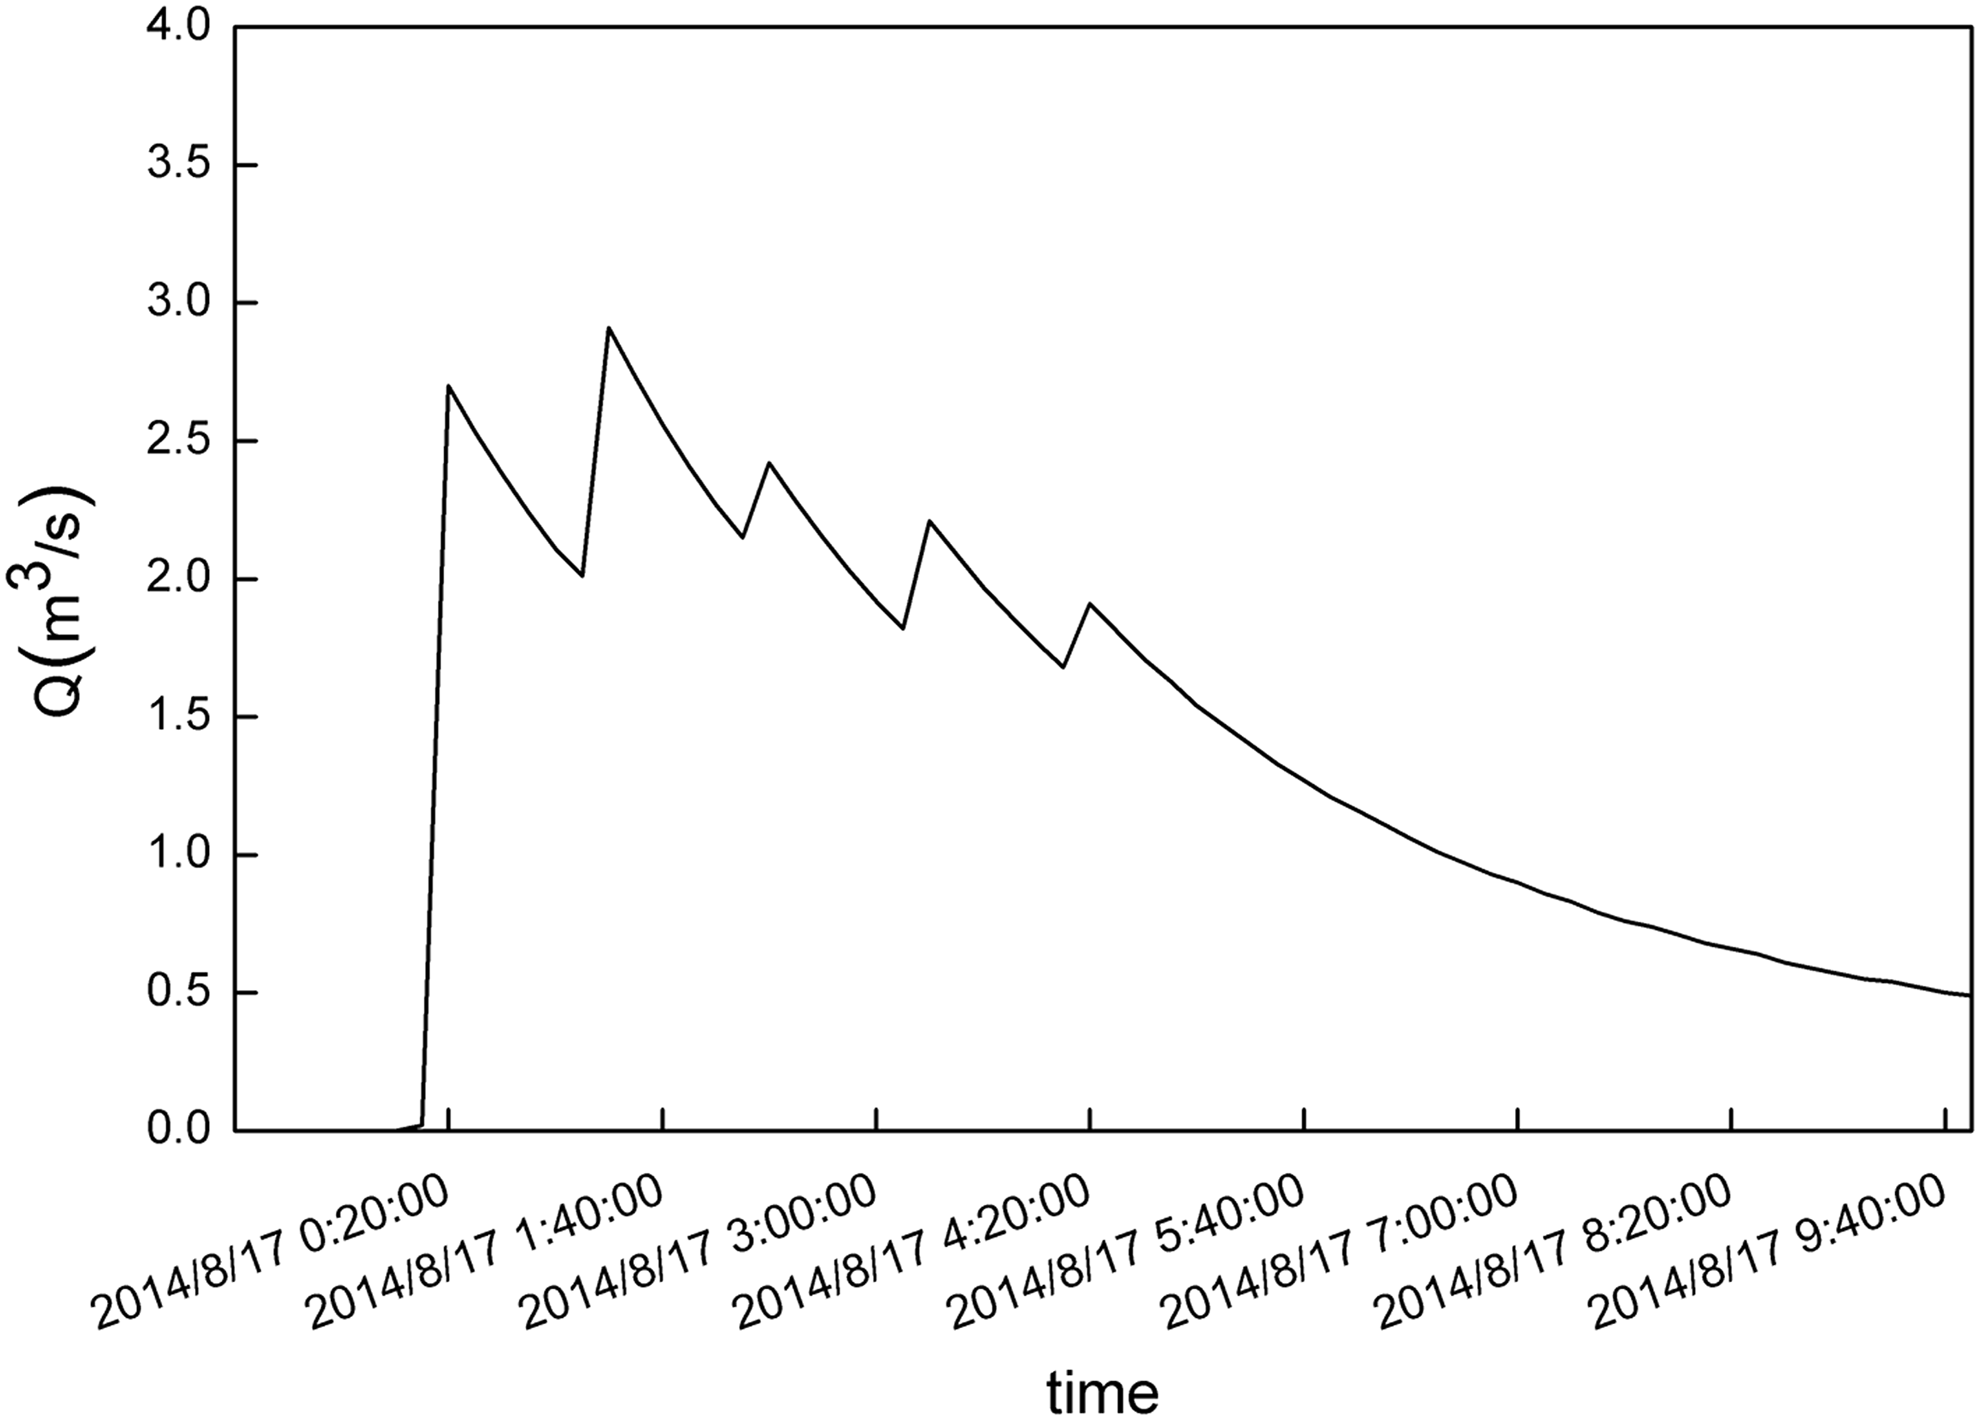
For example, the runoff processes of the Dazhigu Pump Station, marked with a red triangle (Fig. 7B), are shown in Figs. 8 and 9.

Runoff of the model calibration.
Runoff of model validation.
5. Initial conditions:
Data measured on July 1, 2014, and July 1, 2015, were used as the initial water level and discharge (Table 3).
6. Parameter setting:
The main parameter was riverbed roughness. Roughness was obtained by trial and error. First, an initial roughness was set based on relevant references. Then, the simulated water level values were compared with the measured water level values at control sections. If the differences between them were beyond the acceptable range (the relative error could not exceed 13% in this study), the roughness was adjusted. This step was repeated until the differences were within a reasonable range.
Calibration
Data from July to October in 2015 were used for the model. The comparison between simulation values and measured values at control sections, including the Qujiadian Sluice, the Xihe Sluice, Sanchakou, the Erdao Sluice, and the Haihe Sluice, was obtained. The water level from Sanchakou is as an example (Fig. 10).
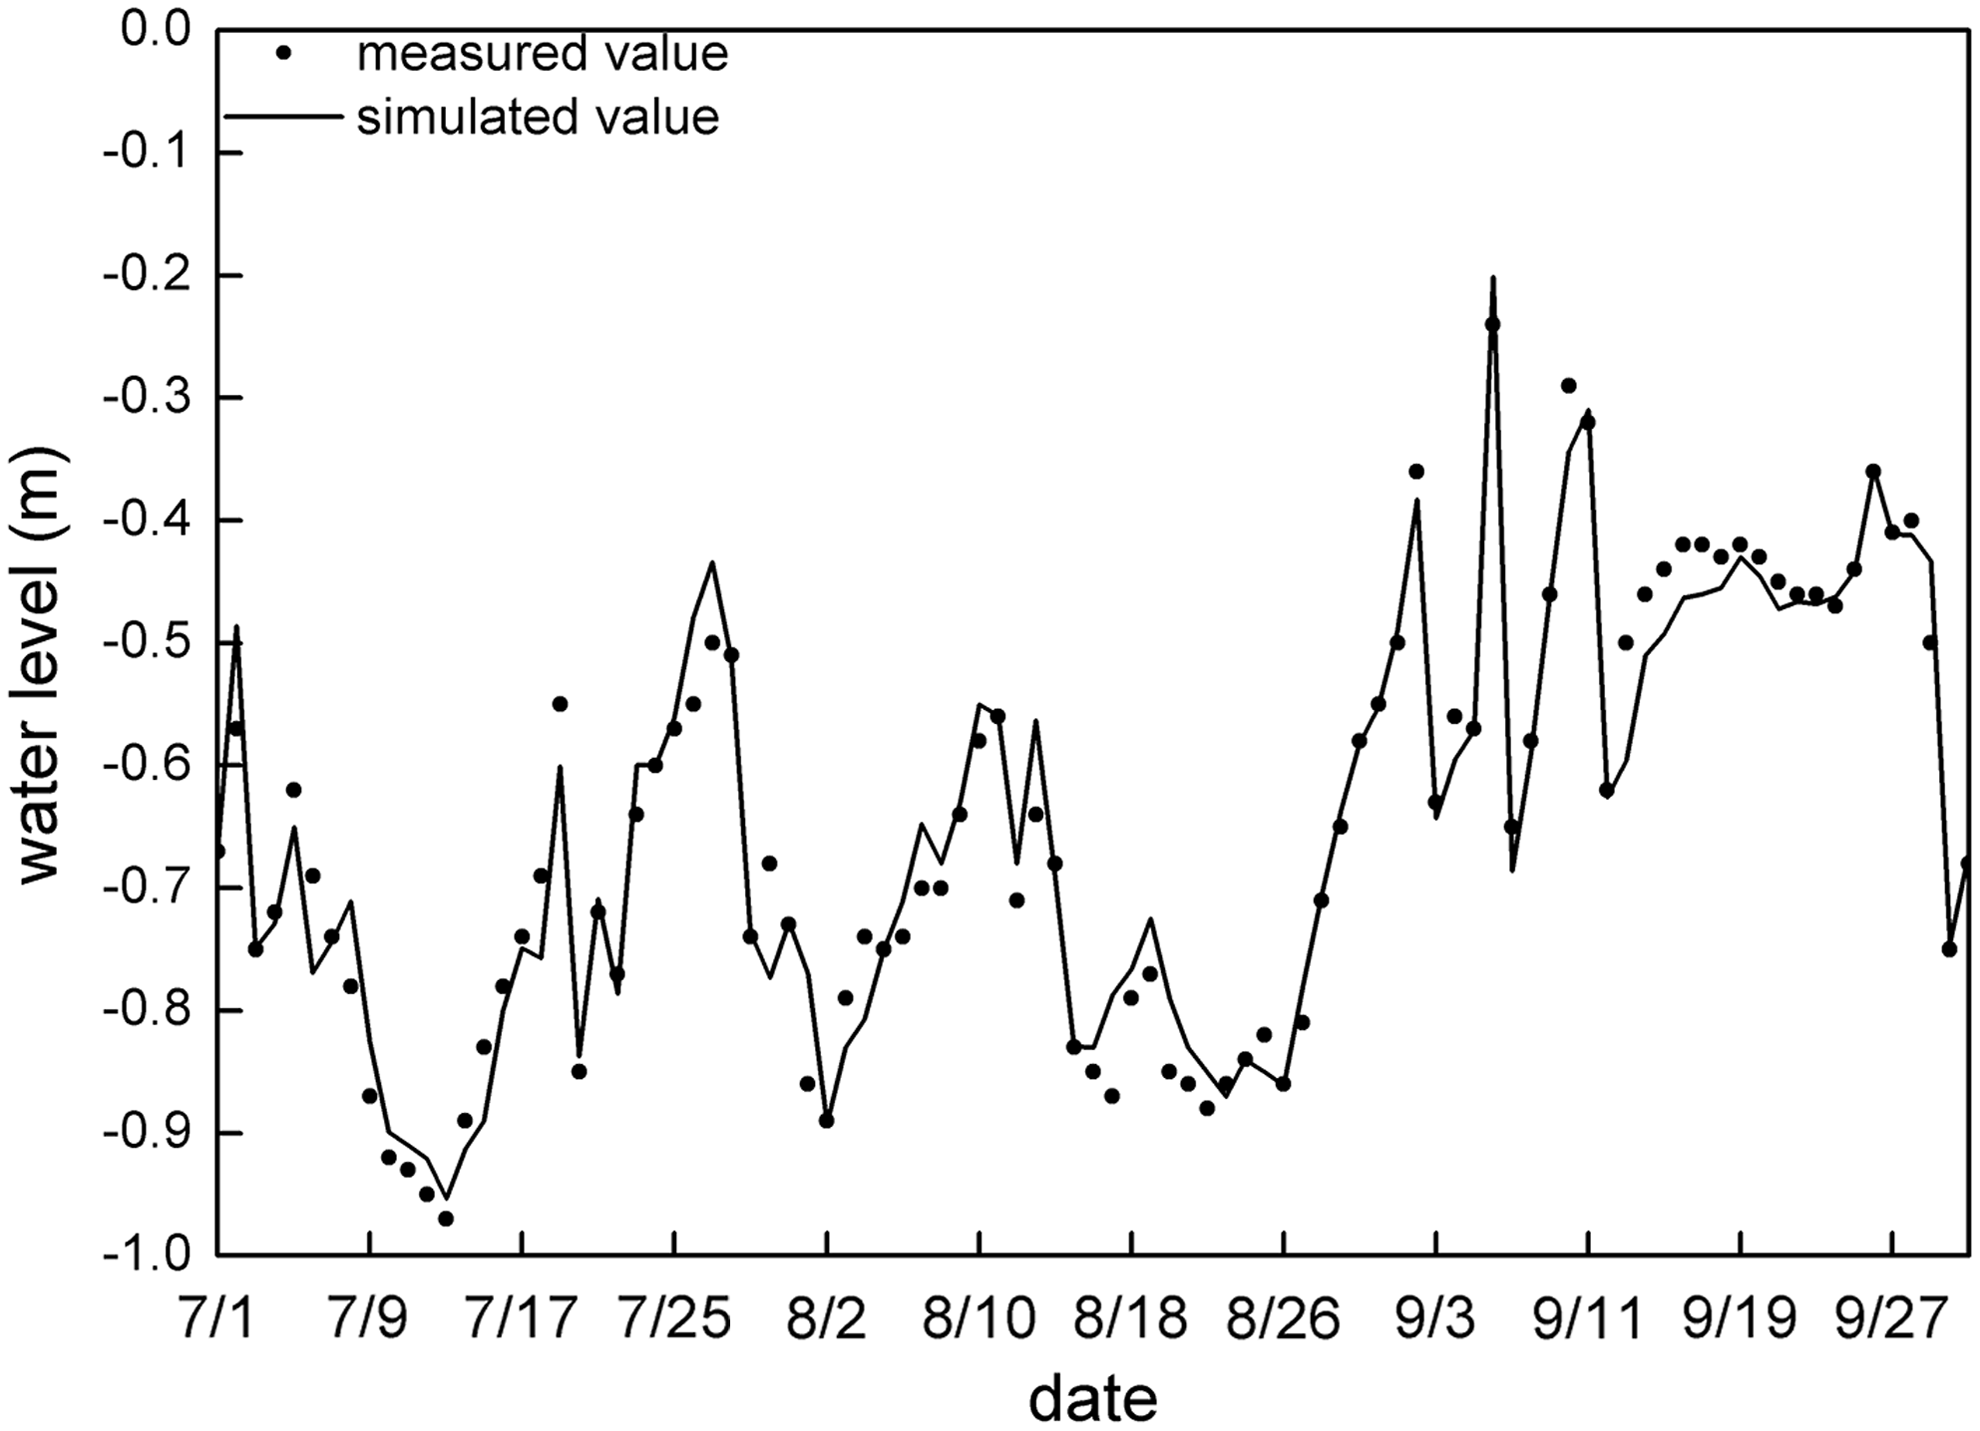
Calibrated water levels at Sanchakou.
Simulated results given in Fig. 10 show the basic trends of variations in measured values. Root-mean-squared error (RMSE) and correlation coefficient (r) were used to evaluate the model accuracy. The smaller the RMSE is, the smaller the difference between simulated values and measured values is; the closer the r is to 1, the better the agreement between simulated values and measured values is.
The two statistical variables are calculated as follows:
where m and s represent measured and simulated values, respectively, n represents the number of measured values, and
The statistical analysis results are shown in Table 4.
RMSE, root-mean-squared error.
The deviation between simulated values and measured values is small; therefore, the error is acceptable and the parameters are reasonable (Table 5).
Validation
Based on the calibrated parameters, the model was validated by using data measured from July 1 to October 1, 2014, and the simulated results and values measured at control cross-sections were compared. The water level at Sanchakou was used as an example (Fig. 11).

Validated water levels at Sanchakou.
The statistical analysis of validated results is shown in Table 6.
RMSE is between 0.024 and 0.035 m; correlation coefficients indicate that the results reach a 95% significance level. Therefore, the riverbed roughness is reasonable and reliable.
One-dimensional water quality model
Calculation conditions
1. Terrain conditions:
The study area and topographic conditions were the same as those used in the hydrodynamic model.
2. Water quality conditions:
Water quality data measured from July 1 to October 1, 2015, owing to their higher integrity and reliability, were used to calibrate water quality parameters in the model; data from July 1 to October 1, 2014, were used to validate the parameters.
3. Boundary conditions:
Water quality conditions of the three outer boundaries based on data from 2015 and 2014 are shown in Table 7.
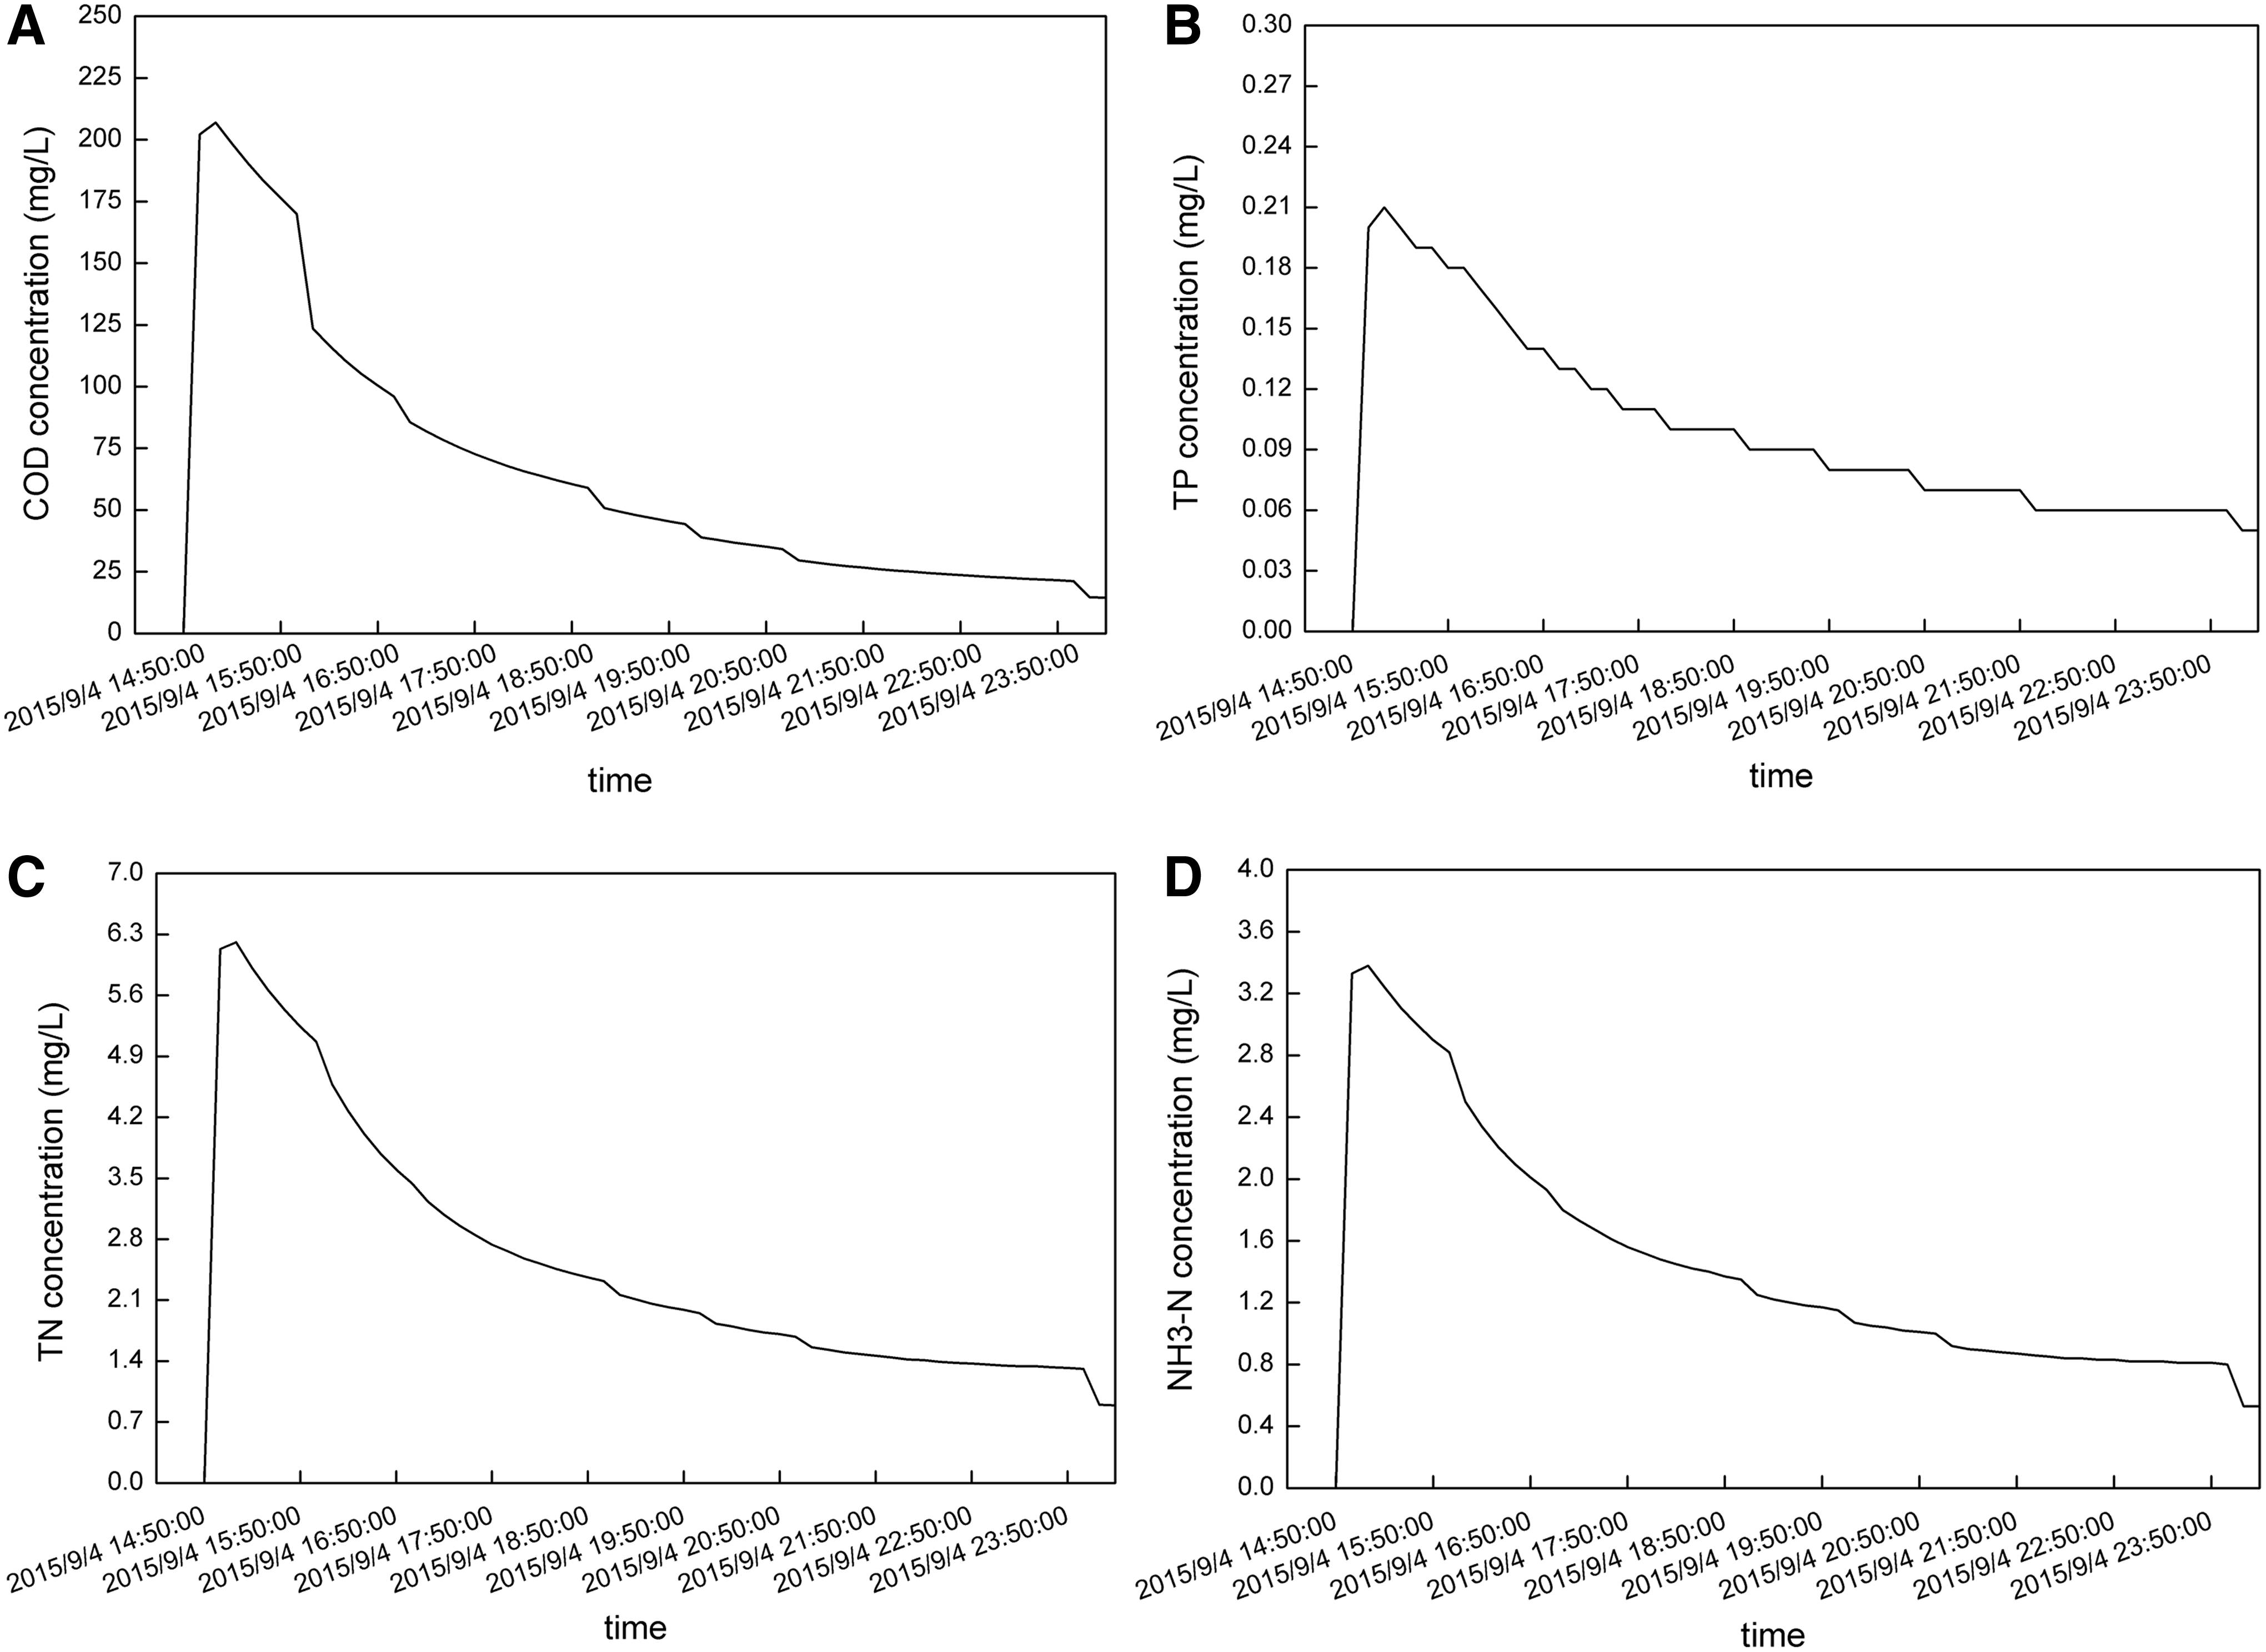
Water quality processes of lateral inflows generated were calculated using the SWMM. The pollutant concentrations in the Dazhigu Pump Station are shown in Figs. 12 and 13.

4. Initial conditions:
The initial water level and discharge were the same as those used in the hydrodynamic model. Concentrations of water quality components from July 1, 2014, to July 1, 2015, were set as the initial water quality parameters. The values at control cross-sections are shown in Table 8.
5. Parameter settings:
The one-dimensional water quality model was established based on the pollutant advection–dispersion equation; the main parameters of the equation were the dispersion and decay coefficients.
The Haihe River mainstream is located in the plain river network region, and the entire terrain is flat; the dispersion equation could not be neglected. However, flow velocity was high due to the inflow discharge upstream and lateral inflow generated by rainfall during the flood season. Therefore, advective transport should play a dominant role in mass transport process. In addition, dispersion coefficient changes only had a small effect on the simulated results by sensitivity analysis. Wang et al. (2008) reported similar findings in the Hanjiang Plain. Therefore, the dispersion coefficient was set at an experimental constant (20 m2/s).
The comprehensive decay coefficient was used to characterize the complex pollutant processes in water by describing the water's self-purification capacity against pollutants and the daily decay rate of pollutants in water (Wang et al., 2006; Guo et al., 2008). The comprehensive decay coefficient was affected by many factors, including flow rate, discharge, pH, water temperature, and concentration gradients. Therefore, comprehensive decay coefficient was uncertainty and dynamic.
The comprehensive decay coefficients of COD, TP, TN, and NH3-N were obtained by the trial method due to this uncertainty.
Calibration
The model was calibrated with data from July 1 to October 1, 2015, and parameters were adjusted repeatedly such that the errors between simulated values and measured values fell within an acceptable range. Reasonable comprehensive decay coefficients of pollutants were obtained. The water quality calibration results at Sanchakou are shown as an example (Fig. 14).
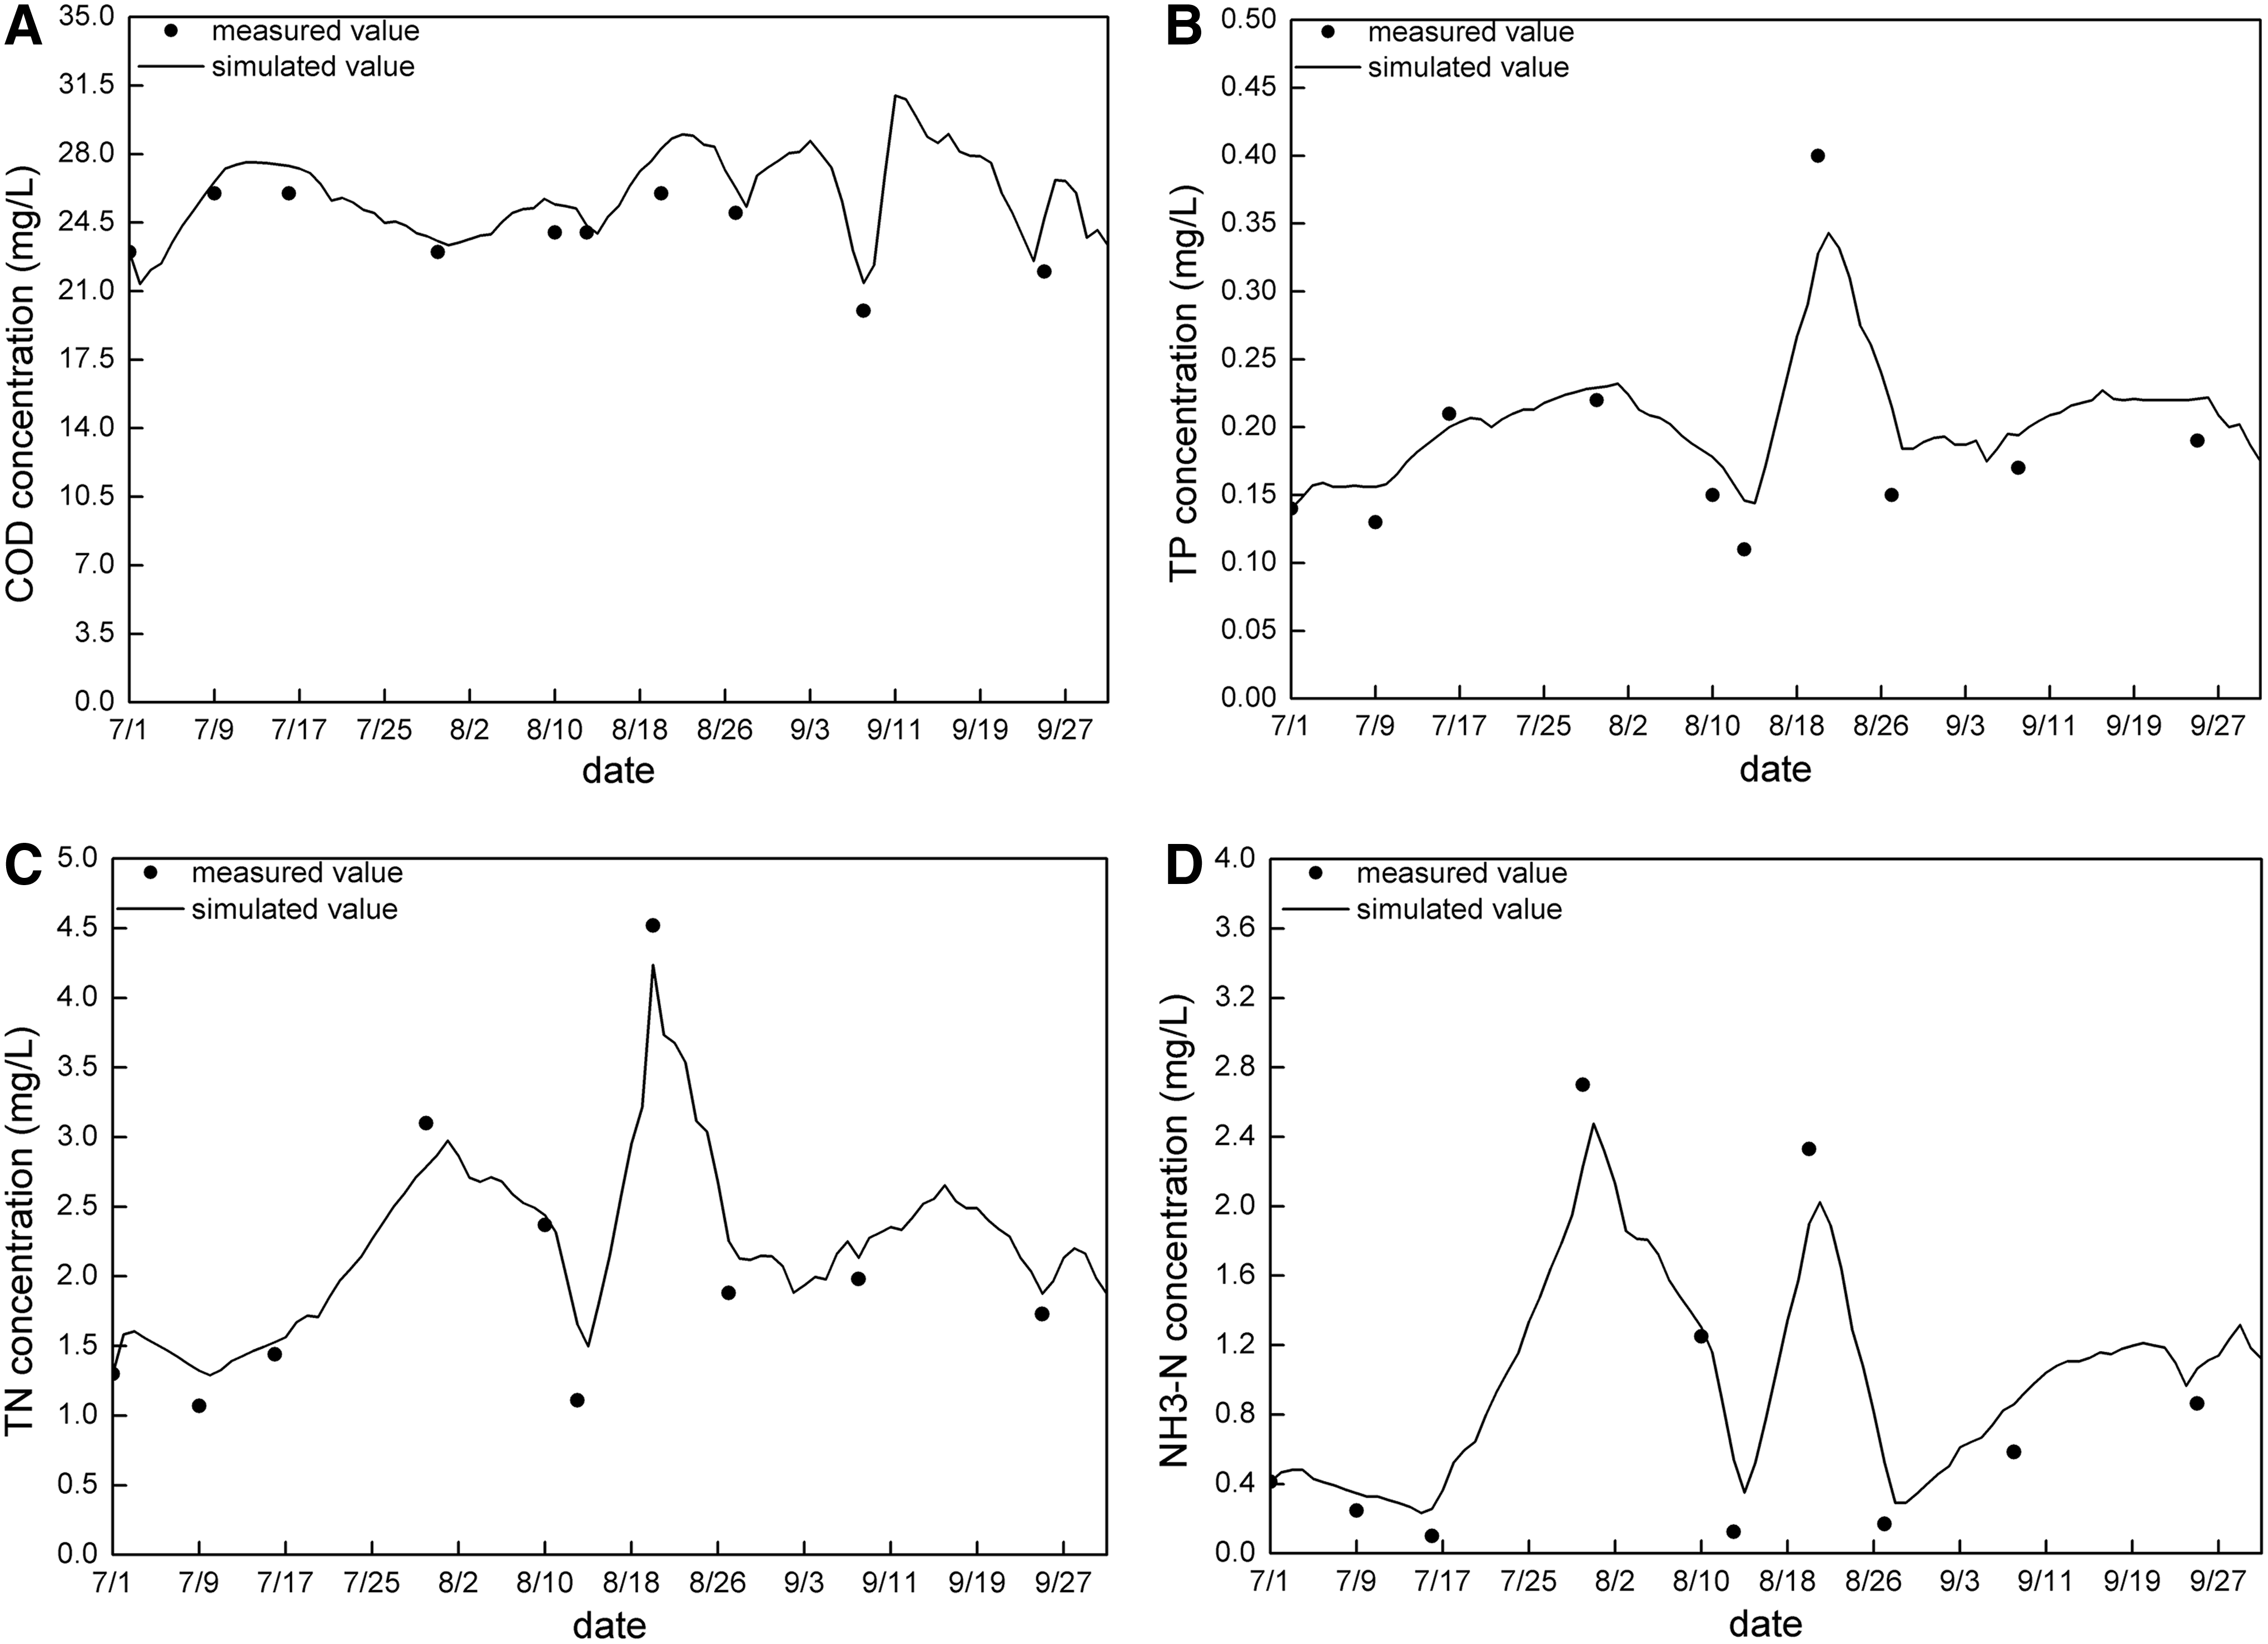
Figure 14 shows that variations at each pollutant concentrations calculated from the model are consistent with the measured concentration. The calibrated comprehensive decay coefficients of the pollutants are shown in Table 9.
Validation
The model parameters obtained in the calibration in the one-dimensional water quality model (Table 9) were validated using data from July 1 to October 1, 2014. The validated results of water quality at Sanchakou are shown as an example (Fig. 15).

Simulated pollutant concentrations are consistent with the measured values. Although some deviation exists, the trends of the simulated and the measured values are essentially identical. Therefore, the comprehensive decay coefficients are found to be reasonable and reliable.
In conclusion, this model can be used to simulate the hydrodynamic and water quality processes and can also be used as a computational tool for further study of water quality.
Use of Orthogonal Experiments to Study Optimization of Water Quality and Quantity Regulation
Factors and levels in orthogonal experiments
Water diversion discharge and water diversion duration of the Qujiadian Sluice were two main factors that influenced the water cycle of the mainstream and branches of Haihe River; the operation of Erdao Sluice was a secondary factor. Different levels of these 3 factors were combined to form 16 water cycle schemes according to the orthogonal table.
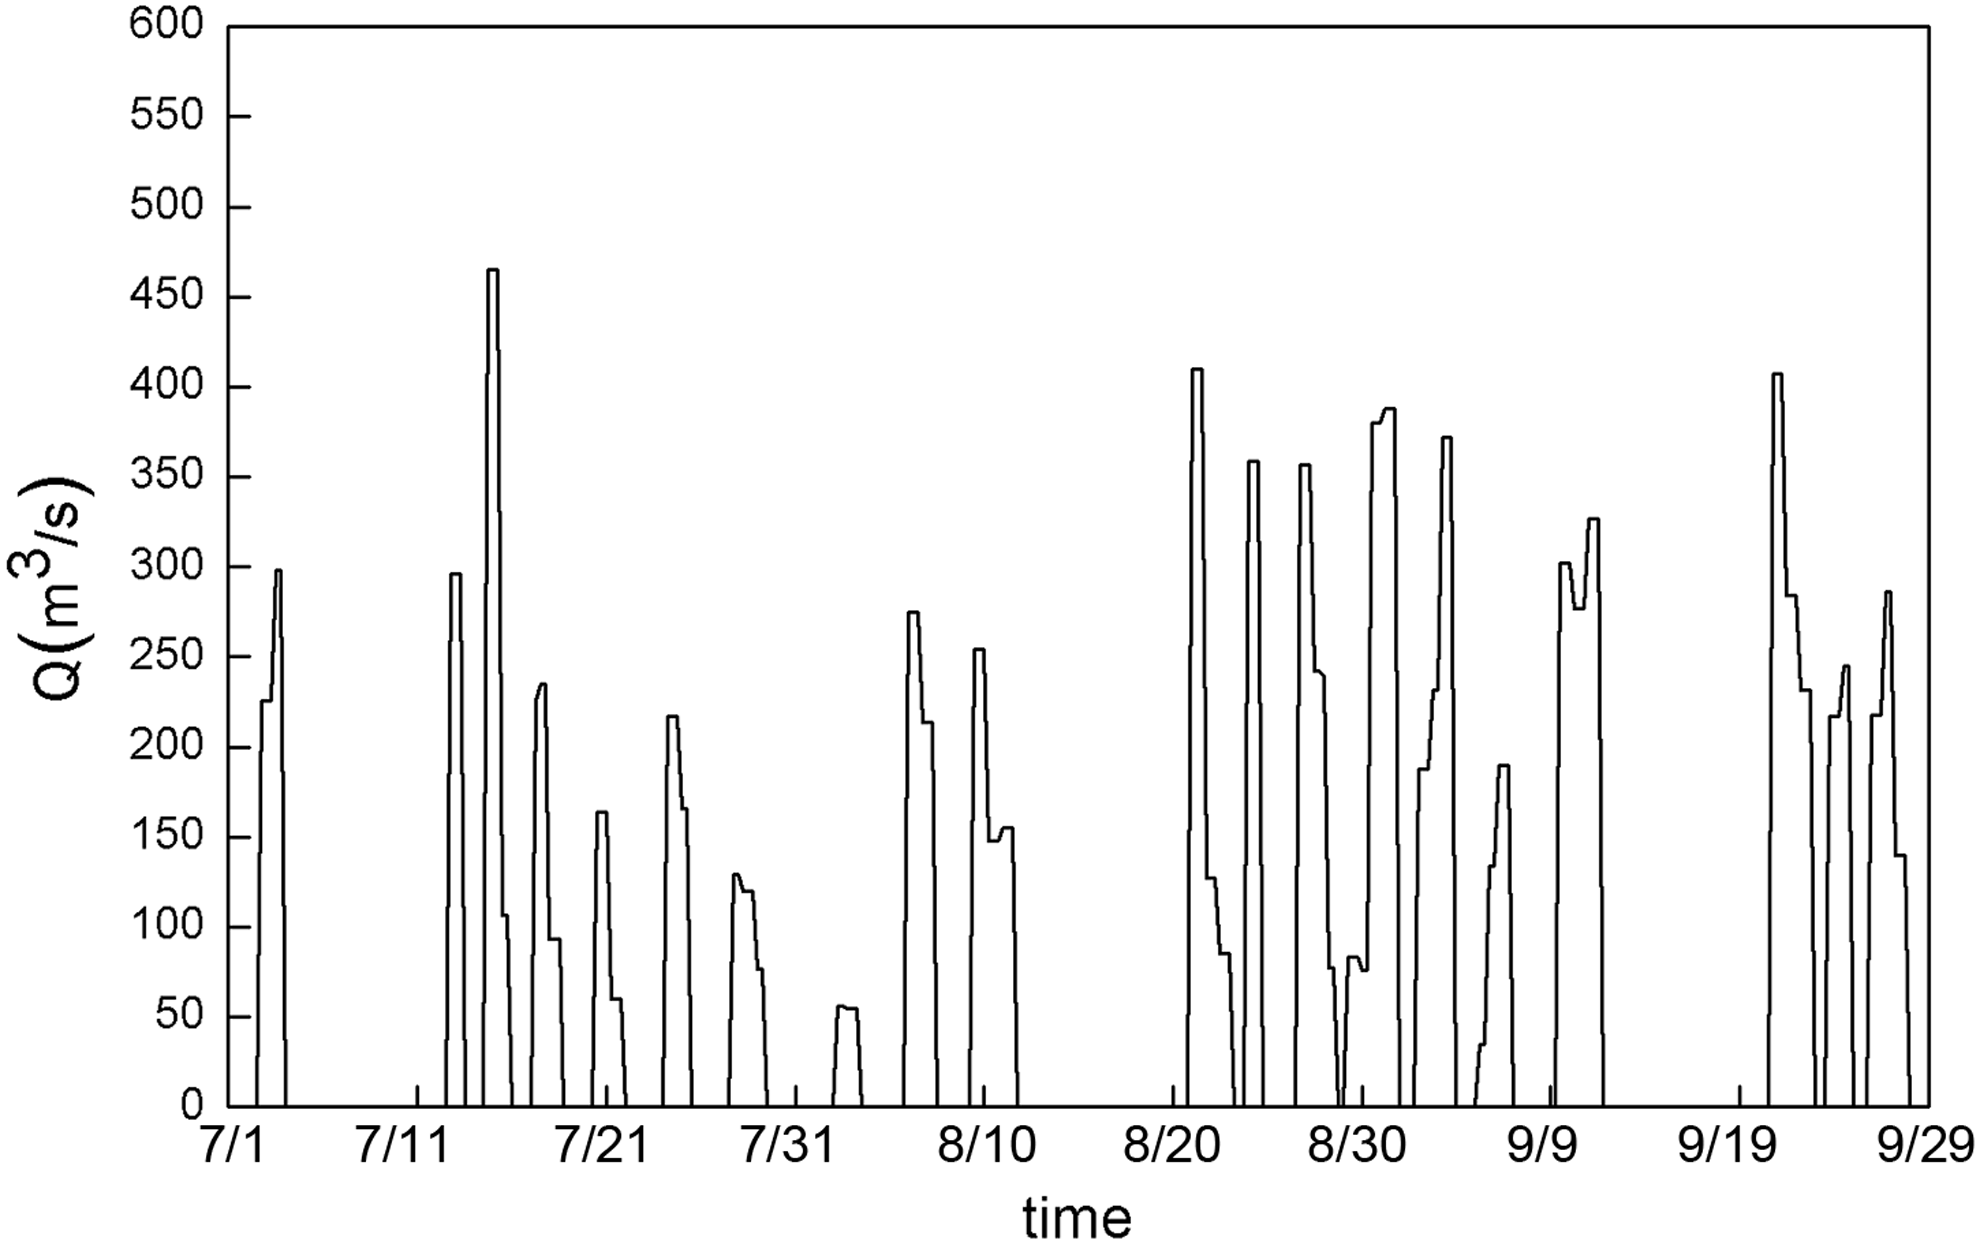
Level choice of water diversion discharge
Water diversion discharge levels were selected by ranking the measured discharge values in the Qujiadian Sluice in 2014 and 2015 to get the values of water cycle schemes in orthogonal experiments close to those of the actual situation; all values were between 0 and 30 m3/s. The range was divided into four groups as follows: 0–7.5, 7.5–15, 15–22.5, and 22.5–30 m3/s (Fig. 16); the average values of each group were selected as the four level values (6, 10, 20, and 24 m3/s).
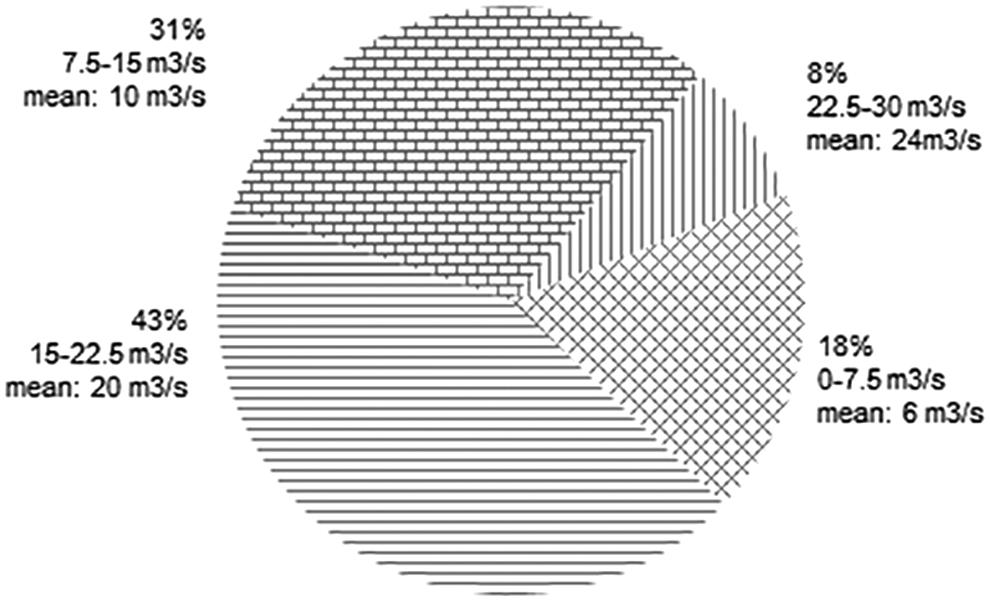
Distribution and average value of water division discharge.
Level choice of water diversion duration
According to the diversion data in Qujiadian Sluice in 2014 and 2015, the duration of water diversion varied from 10 to 15 days to several months. Long water diversions restrict water self-purification if the water quality of the water diversion is poor. Therefore, 60 days was selected as the upper limit of water diversion duration. The four levels of water diversion duration were 15, 30, 45, and 60 days.
Level choice of the operation of Erdao Sluice
To guarantee drainage function during flood season and landscape water level during the nonflood season, the operation of Erdao Sluice is described according to four assumptions as follows:
1. To guarantee flood control function during flood season and prevent seawater encroachment, the sluice is opened when the up-sluice water level is higher than the flood control water level (−0.61 m) and the down-sluice water level. 2. According to the measured data of Erdao Sluice in 2015, the sluice was opened when the up-sluice water level was higher than −0.5 m and the down-sluice water level. 3. According to the lower limit of landscape water level during the nonflood season, the sluice is opened when up-sluice water level is higher than −0.11 m and the down-sluice water level. 4. According to the upper limit of landscape water level, the sluice is opened when up-sluice water level is higher than 0.39 m and the down-sluice water level.
The levels of each factor in the orthogonal experiments are shown in Table 10.
Orthogonal experiments
Water cycle schemes for the mainstream and branches of Haihe River
The water diversion cycle schemes were obtained using the orthogonal experimental table L16(43) (Table 11).
In the mentioned 16 schemes, basic conditions were the same, except for water diversion discharge, water diversion duration, and the operation of Erdao Sluice.
Boundary conditions and initial conditions for the Haihe River mainstream
1. Boundary conditions:
Discharge and duration of water diversion in the Qujiadian Sluice were based on different combination schemes. The discharge of the Xihe Gate was 0. The downstream water level boundary in the down-sluice of Haihe Sluice was the tide level in 2015. Haihe Sluice is opened when the up-sluice water level is higher than down-sluice water level to prevent seawater encroachment.
Quality of the diverted water was set according to the data in the down-sluice of the Qujiadian Sluice in 2015 as follows: COD concentration was 14.7 mg/L, TP concentration was 0.13 mg/L, TN concentration was 1.3 mg/L, and NH3-N concentration was 0.47 mg/L. Diverted water may improve water quality in the Haihe River, as the pollutant concentrations of the diverted water were lower than the average concentrations in the Haihe River.
As the main functions of rivers during the flood season are flood and waterlogging control, water quality requirements are not as strict as those during the nonflood season. Therefore, this study only evaluated ways to improve water quality during the nonflood season.
2. Initial conditions:
Water quality measured on April 23, 2015, was the poorest in 2015, and was selected as the initial water quality value (Table 12).
COD and TN concentrations both exceeded Level-V water quality standard; water quality in the Ziya River Bridge was the poorest. Overall, the concentrations of TP and NH3-N were relatively lower, and those of COD and TN were higher.
The initial discharge of control cross-sections was 0 in all schemes; initial water levels were set with the data measured on April 23, 2015 (Table 13).
Boundary conditions and initial conditions of branches
1. Boundary conditions:
To improve the water quality, this study summarized six cycle routes (Fig. 17).

The Mingzhu pump station and Dongchangyin pump station are used to transfer mainstream water into branches as the water in the Haihe River mainstream scarcely flows into the branches. When only one pump station was used in the route, the discharge was 6 m3/s; when both pump stations were used, the discharge of each pump station was 3 m3/s.
2. Initial conditions:
According to the data, the initial water level of the branches was −0.6 m. The initial water quality was at Level-V.
Range analysis and scheme optimization of the orthogonal experiment
Average concentrations of pollutants from the Sanchakou to Erdao Sluice at the end of the simulation were selected as evaluation indexes to demonstrate the effects of water diversion schemes. Taking route 1 as an example, at the beginning of the simulation, the average concentrations of COD, TP, TN, and NH3-N were 39.66, 0.12, 2.27, and 0.53 mg/L, respectively. The average concentrations at the end of the simulation for 16 orthogonal experimental schemes are shown in Fig. 18.
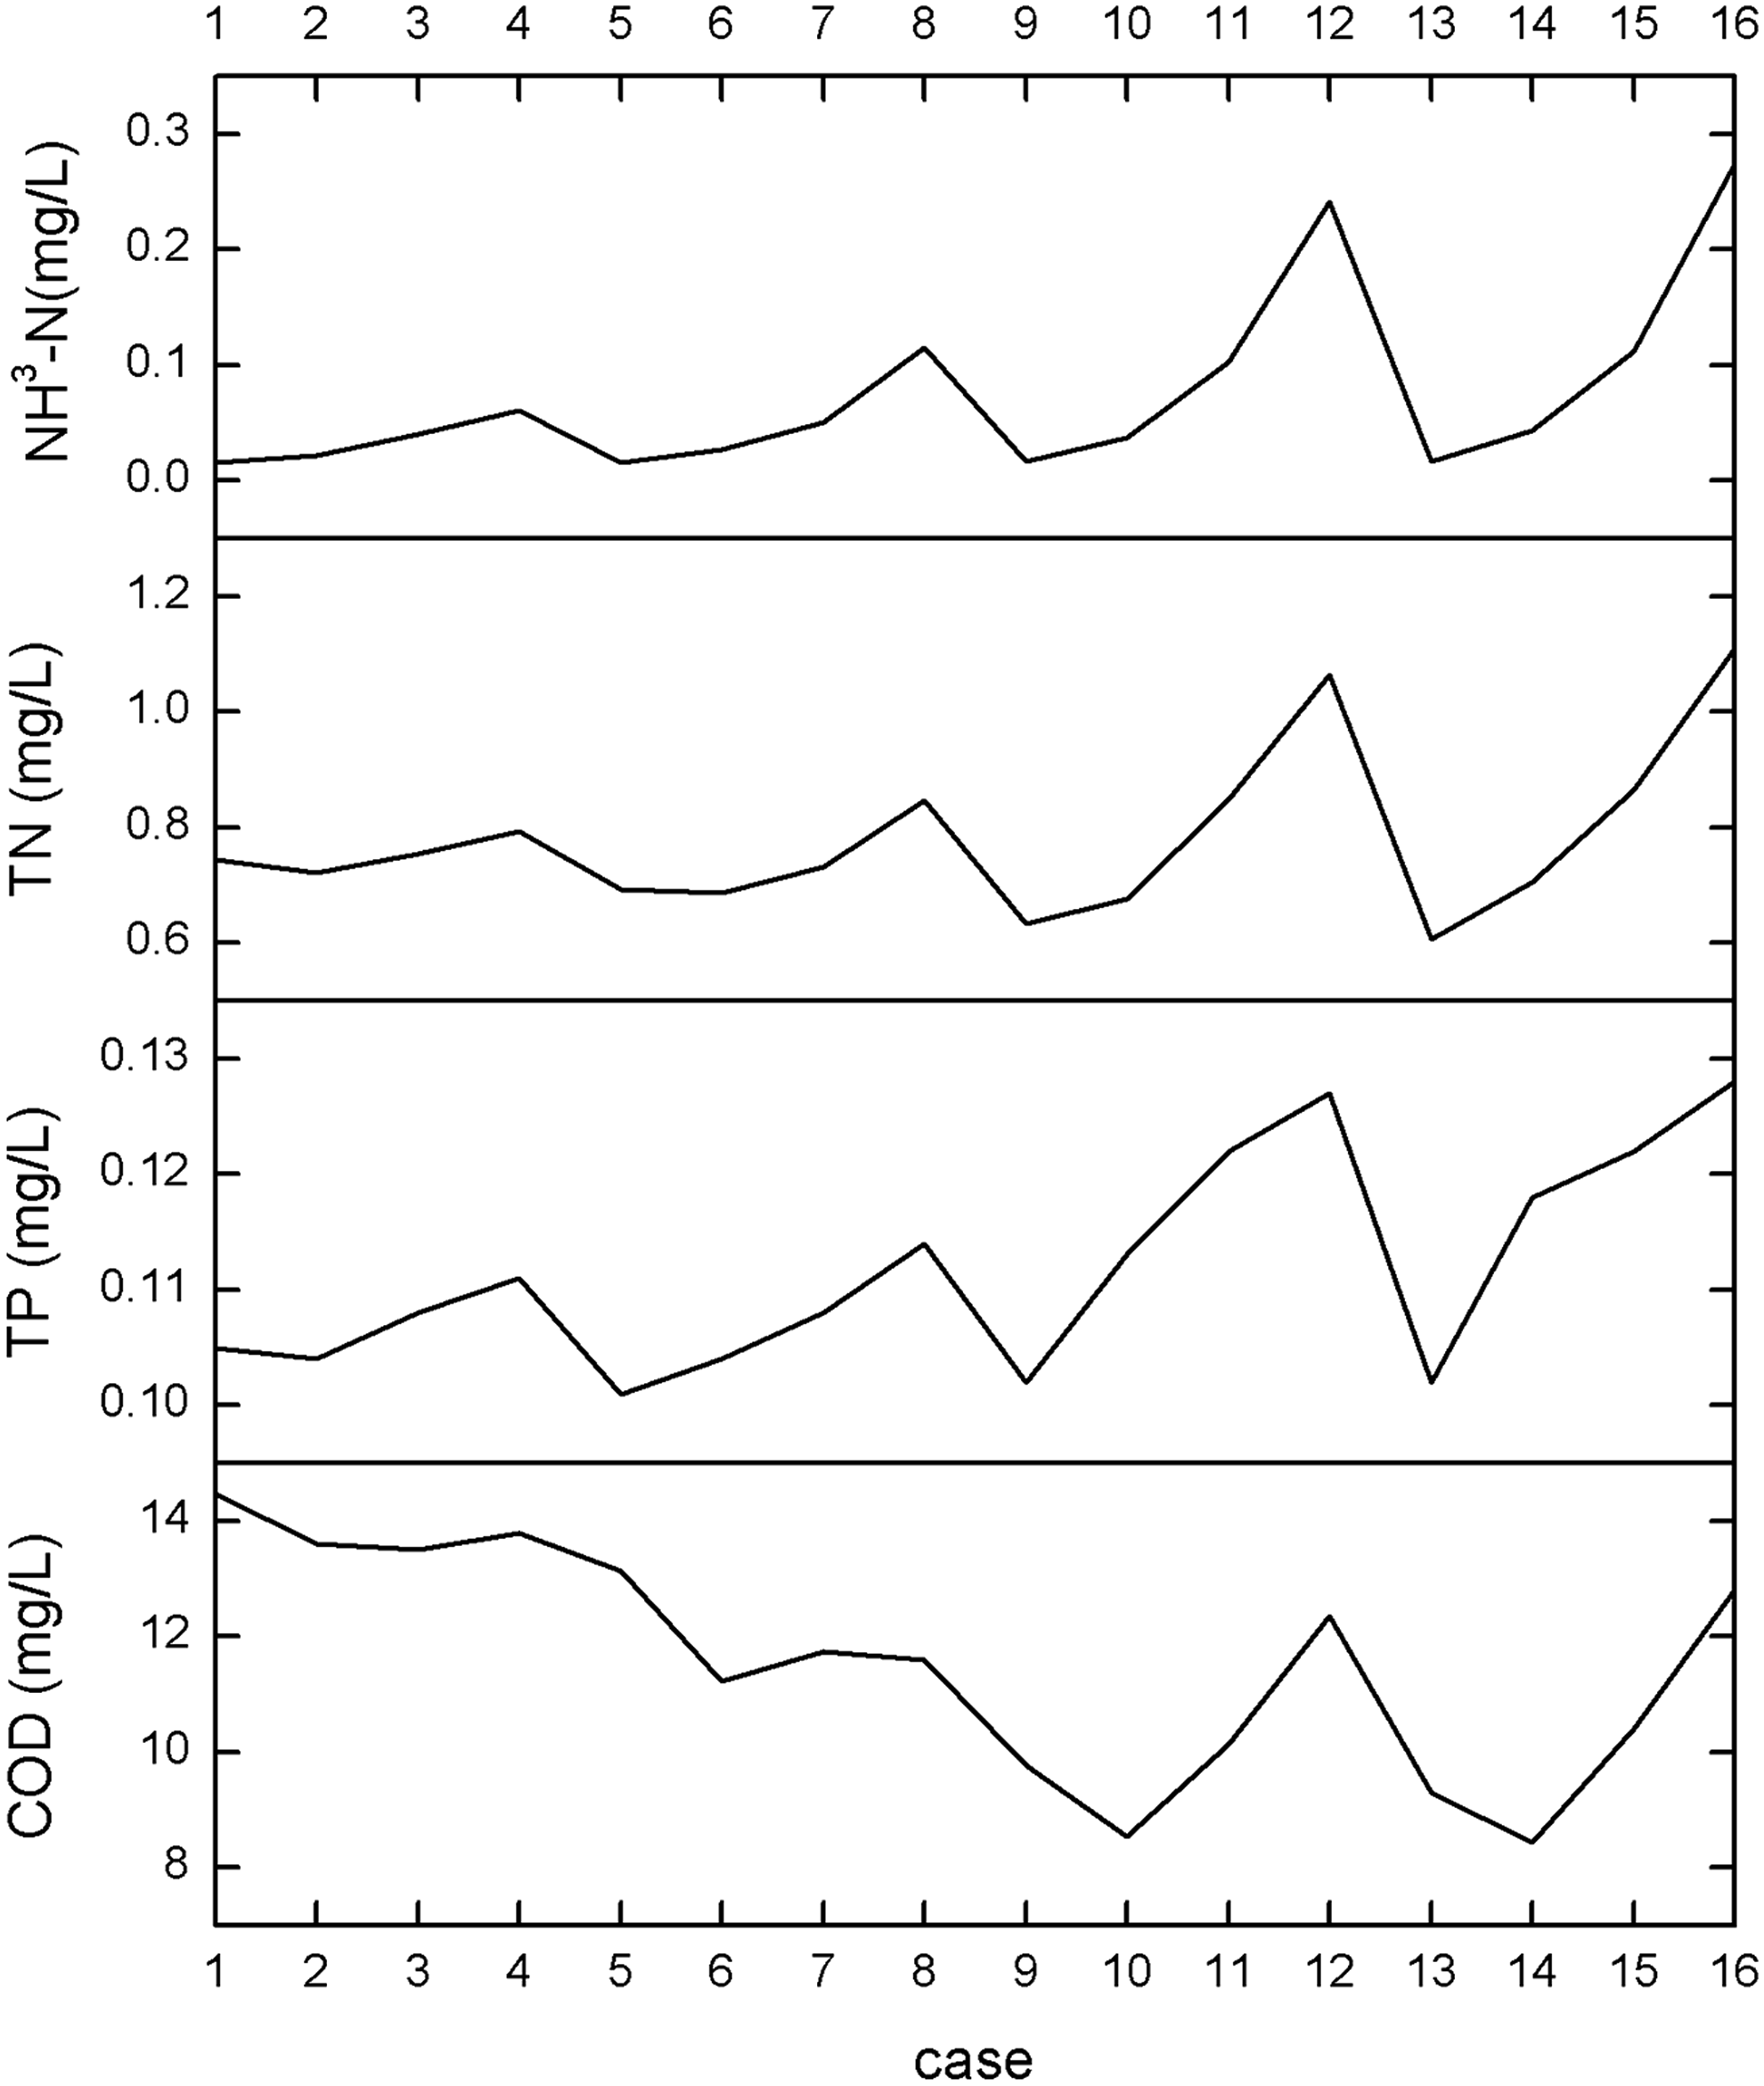
Index values of 16 schemes in route 1.
As shown in Fig. 18, the average concentration of COD is dramatically reduced, with the decay rate ranging from 63.5% to 78.7%, as the COD concentration of the diverted water is 14.7 mg/L, which is better than initial water quality. The comprehensive decay coefficient of COD is 0.015 per day, indicating that the water is at self-purification capacity. Under the double effect of water diversion and self-purification capacity, improvement by the 16 schemes on the COD concentration is excellent. However, the average concentration of TP is not significantly reduced. In contrast, the average concentration of TP is higher than its initial concentration in some schemes, because the TP concentration of diverted water (0.13 mg/L) is slightly higher than the initial TP concentration (0.12 mg/L), and the comprehensive decay coefficient of TP is 0.005 per day, resulting in very limited self-purification capacity of TP. Therefore, the 16 schemes have little effect on the average TP concentration. The average concentration of TN is reduced, with a decay rate ranging from 51.1% to 73.3%; this behavior is similar to that of COD. The concentration of NH3-N is decreased, with the decay rate ranging from 48.3% to 97.0%, which is mainly due to NH3-N having a large comprehensive decay coefficient (0.063 per day); however, the decrease in the NH3-N concentration is lower when the water diversion duration is much longer. For example, the diversion duration of scheme 1, scheme 2, scheme 3, and scheme 4, as well as the average concentration values of NH3-N, increased gradually at the end of the simulation because long-term water diversion weakened the water's capacity to self-purify NH3-N. To further analyze the effects of water diversion discharge, water diversion duration, and the operation of sluices on each water quality index, range analysis was used to analyze the average concentration of COD (Fig. 18). Analysis results are shown in Table 14.
The effect of the three factors on the average concentration of COD follows the order of A > B > C; water diversion discharge is the most important, followed by water diversion duration and operation of the sluice. The ranges of the other water quality indexes are obtained through the same method, and the different effects of three factors on the concentrations are obtained. As seen in Fig. 19, the average concentrations of TP, TN, and NH3-N are mostly affected by water diversion duration (50%, 55.7%, and 52.7%, respectively). In general, the effect of water diversion on Haihe River water quality is more important than that of the sluice operation. Therefore, management departments should give priority to water diversion discharge and water diversion duration when they choose water cycle schemes.
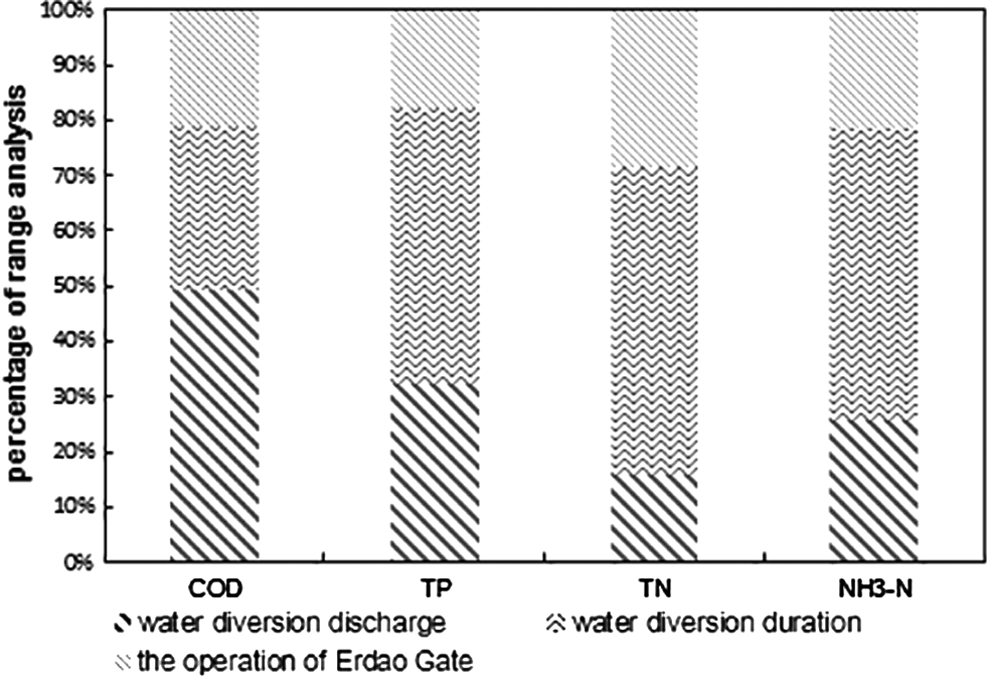
Percentage of range analysis results of four water quality indexes.
As seen in Table 14, A3B2C3 represents the optimal combination of COD. Theoretically, the average COD concentration should be minimized when the optimal combination is simulated. To validate this result, the optimal combination is simulated and the average concentration of COD is found to be 8.418 mg/L, the smallest value observed across the 16 schemes.
Optimal combinations of TP, TN, and NH3-N in route 1 are A2B1C4, A2B1C4, and A1BAC4, and the average concentration values are 0.107, 0.723, and 0.018 mg/L, respectively.
The average concentrations of TP, TN, and NH3-N calculated from each optimal combination, however, are not the smallest, as model simulation is a very complex process. Water diversion discharge, water diversion duration, and sluice operation have interdependent relationships in the model. Nevertheless, the orthogonal experiments are mathematical methods that do not fully take into account all relationships among factors and physical processes.
To overcome the shortcomings of the orthogonal experiment, the scheme that makes the concentrations of pollutants lower is selected as the optimal scheme by comparing the results of optimal combinations with those of the 16 schemes.
The optimal schemes are shown in Table 15.
According to the statistical results, the optimal schemes of water quality and quantity that minimize the concentrations of TP, TN, and NH3-N all occur in cycle route 5, and the optimal scheme that minimizes the concentration of COD occurs in cycle route 6. Although the concentration of COD in route 5 is not smaller than that in route 6, the difference is small; the concentration of COD in route 5 is far smaller than those in other four routes; as a consequence, route 5 is considered as the optimal cycle route.
Discussion
Previous studies on the optimization of hydrodynamic and water quality simulation focused on situations in which a single factor was controlled (Belayneh and Bhallamudi, 2012; Yang et al., 2013; Kunz and Wüest, 2014). Although the single-factor control schemes make simulation and parameter adjustment more feasible, the potential for improving water quality is far less compared with schemes that take into account multiple factors. Therefore, we study the influence of multiple factors on water quality optimization for more precise results.
This study combined the one-dimensional hydrodynamic and water quality models with orthogonal experimental design and evaluated water diversion discharge, water diversion duration, and the Erdao Sluice operation. This approach has rarely been applied to hydrology and water resources field in China. The one-dimensional hydrodynamic and water quality model was established based on measured data. Orthogonal experimental design was additionally used to optimize 16 schemes, representing an innovation. The orthogonal experiment simultaneously studied the effects of multiple factors on water quality and chose representative schemes from all the combinations objectively, thereby decreasing work load and increasing efficiency.
Results of this study have practical implications for water quality improvement. Management departments can prioritize the control of certain severe pollutants according to the findings reported here to improve Haihe River water quality to a greater degree in a limited time. These results may also provide a scientific basis and technical examples to ensure a circle of water quality and aquatic ecosystem in plain river networks.
Although the combination of models and the mathematical methods offers an effective way to optimize cycle schemes, it also requires a large amount of data. Data precision and density have a direct influence on the degree of accuracy of pollution simulations. Through data collection in this study, we found that water quality data in China were available for short periods of time, with long intervals between collections (2 weeks to 2 months) (Chang et al., 2016). In addition, water quality is greatly affected by endogenous pollution (Xing-Hua et al., 2010; Linden et al., 2012); however, this study did not fully consider the effects of endogenous pollution, owing to a lack of data. The optimal scheme mainly controls for external pollutant concentrations to improve water environment. A more comprehensive study in this respect should be undertaken in the future.
Conclusion
This study analyzed water quality and proposed how water diversion projects and water cycle routes could improve the water quality of the mainstream and branches in Haihe River.
The one-dimensional hydrodynamic and water quality model of the Haihe River was established using measured values. In the validation, simulated values were found to be in good agreement with measured values.
The orthogonal table (L16 (43)), which took into consideration water diversion discharge and duration and the operation of Erdao Sluice, was used to optimize water quality and quantity cycle schemes.
According to range analysis of the evaluation index, water diversion discharge and duration were the main factors that affected average concentrations of pollutants; the operation of Erdao Sluice was a secondary factor.
The optimal water diversion scheme was obtained from the orthogonal experimental table and the model, and route 5 was determined to be the optimal route by comparing concentrations in the optimal schemes.
The combination of one-dimensional hydrodynamic and water quality model with orthogonal experimental design can provide an efficient method to simulate and optimize schemes to improve water quality through water flow regulation in plain river network regions.
Footnotes
Acknowledgments
The Major Science and Technology Program for Water Pollution Control and Treatment of China (2014X07203-009) and the Natural Science Foundation of China (51779165) supported this study.
Author Disclosure Statement
No competing financial interests exist.