
Abstract
Abstract
Effect of residential water conservation practices on wastewater treatment was modeled for influent flow reductions up to 54% at constant mass loading rates of COD, TKN, and total phosphorus. Models for three Colorado treatment plants with design flow rates of 0.53, 1.10, and 6.13 m3/s (12, 25, and 140 mgd) were calibrated and validated using the program BioWin 5.0 (EnviroSim LLC, Hamilton, ON). Effluent total ammonia nitrogen, nitrate, nitrite, and total inorganic nitrogen were predicted to increase significantly when the influent flow rate was reduced by greater than 43%, associated with loss of nitrification due to alkalinity limitation and low pH. Modeled populations of nitrite-oxidizing bacteria decreased by as much as 30% and effluent pH fell to below 6.0. Trends are similar for all three plants and nonlinear regression is used to fit model output results for these parameters as a function of flow reduction as the independent variable. Caustic addition was modeled to determine the sensitivity of pH and nitrification to increased influent alkalinity. For one of the modeled plants, the cost of caustic alkalinity addition to achieve an effluent pH of 6.8 was estimated to be $0.14/m3 ($518/million gallons).
Introduction
M
So-called source management practices (Marleni et al., 2012) may be motivated by water sustainability goals, but water shortages resulting from extended drought or increased demand have increased support for user-based demand reduction through household water conservation measures. While reducing the volume of wastewater generated, many practices such as low-volume toilets, low-flow showers, and water-saving automatic washers may not reduce the mass loading of contaminants from domestic water use. Earlier studies have reported that residential conservation practices reduced wastewater flows proportionally; however, mass loading rates of BOD and total suspended solids remained relatively constant, resulting in an increase in influent concentrations of these constituents (DeZellar and Maier, 1980; Min and Yeats, 2011).
In a study of the effect of a prolonged drought on 14 wastewater treatment facilities in California, wastewater flow reductions of 15% to 61% were reported between 1976 and 1977 with a median wastewater flow decrease of 23%. Associated increases in average influent BOD concentrations were between 6% and 82% with a median value of 31%. Data for changes in influent nitrogen and phosphorus were reported for only one facility, which experienced an increase in both influent TKN and inorganic phosphate concentration. Nine of the facilities surveyed reported increases in effluent ammonia concentrations ranging from 1% to 55% with a median increase of 30%. However, the median increase in effluent BOD and total ammonia nitrogen (TAN) mass loading from the California facilities between 1976 and 1977 was close to zero, actually showing decreases of 2% and 1% for BOD and TAN, respectively (DeZellar and Maier, 1980).
A more recent statistical study of 10 wastewater treatment facilities in New York indicated that reduced wastewater flows due to conservation resulted in generally lower effluent total nitrogen concentrations, even after controlling for improved treatment process operation for enhanced nitrogen removal. Factors the authors associated with lower effluent nitrogen were longer hydraulic residence time and greater allowed concentration of mixed liquor suspended solids (MLSS) at the same solids retention time (SRT) (Paulsen et al., 2007). Other studies have found that widespread adoption of residential/commercial water demand management practices, for example, installation of water-saving appliances and/or graywater reuse, may result in 50% or more reduction in wastewater flows (Marleni et al., 2012). A model of the combined application of graywater for flushing and low-flow toilets predicted a 27% reduction in residential water demand and associated increases in influent BOD and ammonia-nitrogen concentrations of 41% and 43%, respectively (Parkinson et al., 2005).
Reduced wastewater flow and related increased concentrations of organic matter and suspended solids resulting from water demand management practices have been studied extensively for their effects on gravity sewers, including decreased velocity, increased sediment deposition, blockage, increased odors, generation of sulfides, methane, and microbially induced concrete corrosion (Nielsen et al., 2005; Marleni et al., 2012).
However, there has been little research on the impact of installation of on-site water-saving fixtures, reduced showering, or clothes washing frequency on wastewater nutrients. In the study by DeZellar and Maier (1980), average effluent TAN from all the facilities was quite high in both the base year, 1976, and the comparison year, 1977, with annual median concentration values of 25.35 and 30.6 mg/L TAN, respectively.
Current discharge limits for nutrients from secondary wastewater treatment facilities are often significantly lower. For example, the current average monthly effluent limit for TAN for one of the larger facilities in the 1980 California study is 3 mg/L, an 82% reduction from the 1977 annual average (USEPA, 2016). The capability and costs of meeting increasingly stringent nutrient discharge limits under conditions of significantly reduced flows and higher influent concentrations of nitrogen and phosphorus are important in light of increasing pressures for reduction of residential and commercial water demand.
Residential and commercial on-site graywater reuse have received more attention in arid regions, especially during times of drought and water supply restrictions. It has been estimated that as much as 50% of the water used by U.S. households for clothes washing, bathing, and lavatory sinks could be reclaimed (Sheikh, 2009). Given that as much as 50% of domestic water demand is for outdoor use, irrigation constitutes a significant potential for residential graywater reuse. Indoor graywater reuse is primarily for toilet flushing and the impact of graywater reuse on wastewater flow and constituent loading is expected to be similar to conservation, depending on the extent of graywater on-site treatment. Estimates for potential wastewater flow reduction range from 26% to 41%, for indoor and combined indoor and irrigation reuse of graywater, respectively, with associated very small increases in mass loading rates and flow proportional increases in wastewater BOD and total suspended solids (TSS), and nutrient concentrations of ∼30% (Friedler and Penn, 2011; Penn et al., 2012).
A major difficulty with graywater reuse as it might impact wastewater flow reduction is the ability to match supply to demand (Mitchell et al., 2002). In general, not all graywater can be captured for indoor use on a daily basis and graywater generally is not captured for outdoor use in cold months. Thus, the most significant impact of both indoor and combined indoor/outdoor graywater reuse appears to be reduction in peak flow rates (Penn et al., 2012).
Like conservation, the extent of changes in wastewater volume and constituent concentrations also is determined by the extent of individual household participation, and one study estimated that percent wastewater volume reductions of 6%, 16%, and 25% corresponded to 20%, 50%, and 80% participation (Bertrand et al., 2008). However, limited adoption of residential graywater reuse, especially in permitted applications, may mean a much smaller actual impact on wastewater systems than would be expected from the amount of graywater generated.
The Soap and Detergent Association sponsored a mail survey of graywater reuse practices sent to 100,000 U.S. households in 1998 with a 61% response rate and a follow-up survey to a subsample of 650 households, which had a 79% response rate. Seven percent of respondents in the larger sample reported reusing graywater. Of these, only 18% had any graywater storage capacity, limiting consistent use, and 93% had no treatment system. Only 30% of graywater reuse operations had dual plumbing systems, instead most respondents collected graywater before it entered the household sewer pipes (The NPD Group, 1999).
Water conservation practices such as direct demand reduction and graywater reuse will reduce wastewater flows and change influent constituent concentrations to varying degrees, and might be expected to affect wastewater treatment performance and costs. The objective of our study was to employ computational models of operating wastewater treatment plants to simulate the impact of varying levels of participation in water demand reduction. Large-scale participation in indoor water conservation is typically less costly to residents and businesses and requires negligible on-site plumbing and treatment infrastructure to achieve significantly reduced wastewater flows (Attari, 2014).
Under certain circumstances such as the long drought in California between 2013 and 2017, conservation of municipal water use by as much as 25% may be mandated (State of California, Executive Department, 2015). Also, with few exceptions, wastewater discharges are regulated by effluent constituent concentrations, which have been reported to increase in response to high demand reduction, rather than effluent mass loading rates (CDPHE, 2012). When model output indicated impacts on effluent water quality severe enough to result in a permit violation, we used the models to estimate costs required to maintain acceptable nutrient discharge levels.
Experimental Protocols
Initially, the modeling of indoor water conservation effects was focused on the 1.1 m3/s treatment plant. However, when the results indicated that nitrogen treatment, especially nitrification, decreased markedly with large flow reductions at constant mass loading rates, the modeling was expanded to include two other plants in the same region. Models of three wastewater treatment plants were developed using the program BioWin (Version 5.0; EnviroSim Associates Limited., Hamilton, ON) and calibrated using 1 to 2 years of influent and effluent water quality and facility design and operation data. The BioWin simulations all were done under steady-state conditions assuming that the extreme levels of indoor water demand reduction would occur under extended drought or long-term water shortage conditions, such as those reported for the 1976–1977 California drought (DeZellar and Maier, 1980; USEPA, 1980).
The three modeled facilities had design capacities of 0.53, 1.10, and 6.13 m3/s (12, 25, and 140 mgd) and annual average flow rates of 0.33, 0.65, and 3.72 m3/s (7.48, 14.82, and 84.99 mgd), respectively. The three plants all are located in north central Colorado and discharge into tributaries of the main stem of the South Platte River. Nutrient discharge limits are discussed later in this article. All three plants operated activated sludge processes with nitrification and denitrification using a Modified Ludzack Ettinger flow scheme for denitrification. Two of the plants, with design capacities of 0.53 and 6.13 m3/s (12 and 140 mgd), also achieved some biological phosphorus removal by recirculation of return activated sludge to an anaerobic tank (A2O process).
In Colorado, there are now uniform statewide nutrient limits for wastewater discharges over 1 mgd built before 2012, which applies to the treatment plants modeled in this study. For total inorganic nitrogen (TIN), the annual median limit is 15 mg/L and the 95th percentile limit is 20 mg/L; for total phosphorus (TP), the annual median limit is 1.0 mg/L and the 95th percentile limit is 2.5 mg/L. Local water quality limits also apply. For example, the discharge permit for the 1.1 m3/s plant has TAN limits taking effect at the end of 2017 that are seasonal, ranging from a low of 1.9 mg/L (August) to 9.0 mg/L (November). pH limits are 6.5–9 (daily) and the nitrate-nitrogen limit is 14.7 mg/L (daily maximum). The discharge permit has no nitrite limit.
Model development, calibration, and validation
The process schematic of the 1.1 m3/s (25 mgd) design capacity treatment facility is shown in Fig. 1. At this plant, activated sludge is wasted directly from the aeration basin to a dissolved air flotation unit for better control of SRT, instead of the typical method of sludge wasting from the secondary clarifier underflow, which is practiced at the 0.53 and 6.13 m3/s plants. The 1.1 m3/s plant consists of three parallel activated sludge process trains with a total volume of 69,273 m3 (18.3 million gallons). Mixed liquor is recirculated to an anoxic zone in each train that is ∼20% of the total aeration basin volume. The internal mixed liquor return (IMLR) maximum capacity is 3.29 m3/s (75 mgd) and the actual IMLR rate is set to ∼100% of the influent flow rate. Solids retention time (SRT) varies between 7 and 8 days in summer and 11–12 days in winter.

Activated sludge process schematic for the 1.1 m3/s (25 mgd) plant, incorporating nitrification and denitrification.
The BioWin simulation model for the 1.1 m3/s (25 mgd) plant was calibrated using influent data from 2014 operation and validated using 5 months of 2015 influent data. The criterion for calibration was to achieve modeled effluent concentration of constituents (COD, BOD, TSS, TAN, nitrite and nitrate nitrogen, and TIN, and pH), and MLSS within 15% of data values. A sensitivity analysis of the calibration parameters was conducted for the adjusted parameters: the maximum specific growth rates for ammonia-oxidizing bacteria (AOB) and nitrite-oxidizing bacteria (NOB) from the default BioWin value of 1.0 d−1, which were decreased to 0.7 and 0.5 d−1, respectively, and the fraction of readily biodegradable COD (rbCOD).
Effluent nitrogen species were relatively insensitive to the maximum specific growth rates at values above 0.6 d−1 for AOB and 0.375 d−1 for NOB. The rbCOD fraction of the influent total COD (TCOD) also was decreased from 0.16 to 0.14 g-rbCOD/g-TCOD to match effluent nitrate concentrations because the BioWin default value caused overestimation of denitrification.
BioWin input data were annual average values based on daily average influent flow rates, daily samples for influent COD, TKN, nitrate, TSS, and TP, pH, alkalinity, calcium, magnesium, and dissolved oxygen. Effluent values used for calibration and validation also were annual averages of daily samples with the exception of nitrite, which was measured thrice per week, and TP, which was measured weekly. Influent flow conditions between 2010 and 2015 have been quite stable at the 1.1 m3/s plant. The average of annual flows is 13.86 mgd (0.607 m3/s) with a standard deviation of 1.55 mgd (0.068 m3/s). This period includes a period in September to October 2013 when the plant influent flow rate increased to ∼50 mgd (2.19 m3/s) after an extreme storm and severe flooding.
Although Colorado is subject to periods of dry weather, the only restrictions that have been imposed during dry periods have been on outdoor irrigation, which did not impact wastewater flow. Average values for influent flow and constituents for both calibration and validation years are shown in Table 1. Model and observed effluent data for the calibration and validation periods are shown in Table 2. Influent and effluent observed data shown in Tables 1 and 2 are average and standard deviation values from 365 daily measurements for flow and pH, and average and standard deviation values for twice weekly measurements of influent TAN, TKN, Nitrate-N, Nitrite-N, TIN, TN, and TP (104 measurements) between January 1 and December 31, 2014.
Table entries are average and standard deviation values of observations of influent flow and water quality. Average values of data from the periods January 1 to December 31, 2014, and January 1 to May 1, 2015, were used as input for BioWin model calibration and validation, respectively.
Table entries are BioWin model output followed by (in parentheses) average and standard deviation values of observations of effluent flow and water quality samples used for calibration and validation, respectively, during the periods January 1 to December 31, 2014, and January 1 to May 1, 2015.
TAN, total ammonia nitrogen; TIN, total inorganic nitrogen; TP, total phosphorus.
Data for 2015 (validation set) consist of average and standard deviation values for 120 days between January 1 and May 1, 2015, taken at the same frequency as the 2014 data, yielding 120 observations for flow and pH, and 34 observations for the other influent and effluent constituents. Calcium and magnesium data are not regularly collected by the wastewater treatment plant. The BioWin input values for Ca and Mg used for calibration and validation both years are from influent samples analyzed in 2013.
Flow reductions of 15% to 54% were simulated using the calibrated models within the range previously reported during the 1976–1977 drought in California (DeZellar and Maier, 1980). Mass loading rates of influent COD, TKN, TP and total suspended solids were assumed to be constant as suggested by previous studies (DeZellar and Maier, 1980; Min and Yeats, 2011), resulting in proportionally increased influent concentrations for TCOD, TSS, TKN, and TP, shown in Fig. 2.
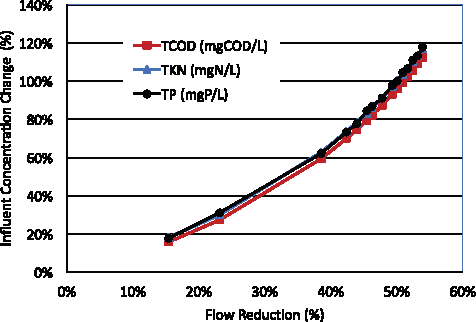
Flow reduction due to indoor conservation efficiency and associated percent changes in influent concentrations of total COD (TCOD), TKN, and TP. Note that the lines for TKN and TP essentially overly each other. TP, total phosphorus.
Influent wastewater pH, alkalinity, nitrate, calcium, and magnesium initially were held to measured wastewater influent values. Data on the effect of residential demand reduction on wastewater quality are scarce, and mostly limited to constituents such as BOD and TSS (Davis and Bursztyansky, 1980; USEPA, 1980). Increased concentration of soap, particularly laundry detergents, which might occur under conservation conditions, can increase alkalinity of reduced wastewater flows (Goel and Kaur, 2012). However, some personal cleansing products are formulated to be neutral or acidic to match skin pH (Boonchai and Pacharee, 2010). Moreover, conservation practices may have other effects on the concentration of inorganic dissolved solids from showering, bathing, and clothes washing. Reductions in both duration and frequency of showers and laundry were reported in surveys during mandated water conservation and droughts (Attari, 2014). While shorter showers and reduced rinsing would increase detergent or soap concentration, reduced frequency of bathing or laundry would have no effect.
Another source of alkalinity in wastewater is hydrolysis of urea (Lew et al., 2009; Lowe et al., 2009). Retaining the base flow condition wastewater alkalinity was particularly important in the modeled impact of increased influent concentration of TKN under high-flow reduction conditions. Low flows in sewers also can have an effect on wastewater alkalinity. All three plants are served by gravity collection systems. Reduced flows and fermentation of deposited organic solids can produce volatile acids and sulfides. Increased odors and requirements for chemical addition to sewers during the 1976–1977 California drought were reported in several systems (Davis and Bursztyanskym 1980).
Availability of oxygen may enhance oxidation of sulfide to sulfuric acid as sewer water levels decrease (Gutierrez-Padilla et al., 2010). In summary, conservation practices may have quite diverse effects on wastewater inorganic dissolved solids, particularly alkalinity. To address the uncertainty around model inputs of alkalinity, after the initial modeling assuming uniform influent values, the effect of increasing alkalinity due to urea hydrolysis and caustic addition was evaluated. BioWin models for the other two plants were developed, calibrated, and verified in the same manner as described above (data not shown).
Results
Overall, the greatest impact of indoor water conservation came at high levels of influent flow reduction and were the result of decreased levels of nitrification, especially nitrite oxidation, as shown in Figs. 3–5 for effluent TAN, nitrite, and TIN, respectively. The results shown are from calibrated BioWin models of all three wastewater treatment facilities described previously. Similar trends for modeled effluent concentrations of TAN, nitrite, and total nitrogen were observed for the three treatment plants. Base case-modeled effluent TAN values for the three plants were uniformly low: 0.22, 0.09, and 0.13 mg/L for the 0.53, 1.1, and 6.13 m3/s (12, 25, and 140 mgd) plants. Respective modeled values of effluent TIN for the base case were more variable: 4.3, 12.8, and 14.0 for the 0.53, 1.1, and 6.13 m3/s (12, 25, and 140 mgd) plants.
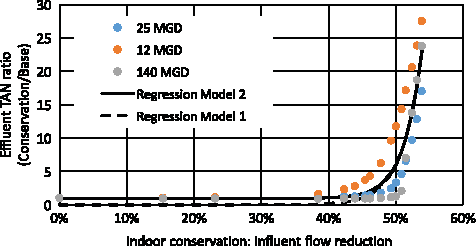
Modeled ratio of effluent TAN for selected levels of flow reduction due to conservation to base effluent TAN (no conservation) from calibrated BioWin models of three Colorado municipal wastewater treatment plants. TAN, total ammonia nitrogen.

Modeled ratio of effluent nitrite-nitrogen (NO2-N) for selected levels of flow reduction to base effluent nitrite-nitrogen (no conservation) from calibrated BioWin models of three Colorado municipal wastewater treatment plants.

Modeled ratio of effluent TIN for selected levels of flow reduction due to conservation to base effluent TIN (no conservation) from calibrated BioWin models of three Colorado municipal wastewater treatment plants. TIN, total inorganic nitrogen.
Larger differences among the plants for the nitrite ratios may be the result of differences in the base model conditions, which were 0.03, 0.12, and 0.37 mg/L NO2-N for the 0.53, 1.1, and 6.13 m3/s (12, 25, and 140 mgd) plants, respectively, and amplification of the differences in the base conditions may have been responsible for the differences in the effluent nitrite ratios at large flow reductions. However, in all three cases, modeled effluent nitrite concentrations increased to fairly high levels: 7.15, 4.69, and 30.73, accounting for 30.5%, 94.2%, and 92.8% of the effluent sum of nitrite plus nitrate concentration, respectively, for the three plants.
Modeled effluent pH for the three plants showed similar trends as indoor water conservation increased, although with differences likely reflecting differences in the amount of nitrification and influent alkalinity: 4.3, 4.76, and 6.0 mM for the 0.53, 1.1, and 6.13 m3/s (12, 25, and 140 mgd) plants, respectively. At the highest level of influent flow reduction at constant constituent loading rates, the modeled effluent pH decreased to less than six, which would require pH adjustment before discharge.
Nonlinear regression analysis for each constituent was made using the nonlinear regression package (“nlr”) in the program R (R Core Team, 2014; Version 3.2.3). The nonlinear regression modeling was done to analyze the combined output from the BioWin models for the three plants to test whether a single model would provide a general relationship between wastewater flow reduction at constant loading rates and biological nitrogen and phosphorus removal. A nonlinear regression model for pH was developed to test an association between flow reduction and pH decrease with the same conservation conditions.
BioWin model results and two fitted nonlinear regression models as determined by the least squares method are shown along with the BioWin output values in Figs. 3–5. The two models fitted are
where y is the ratio of the modeled effluent concentration of the constituent at a given level of conservation efficiency (fractional flow reduction) to the annual average effluent concentration at the normal (base) average flow; x is the fractional flow reduction due to conservation; and a, b, c, and d are fitted regression parameters.
When flow reduction exceeded 40%, the BioWin models of all three plants consistently predicted markedly higher effluent concentrations of TAN, nitrite, and TIN. The trends can be attributed to insufficient alkalinity, the resulting drop in pH, and inhibition of nitrifying organisms, particularly NOB. Denitrification also decreased, likely due to carbon limitation. The fitted line for TIN also showed the largest relative error, likely due to varying levels of denitrification at the three treatment facilities.
Nitrification is strongly affected by pH, especially values below pH 7 (Antoniou et al., 1990). In addition, nitrification consumes alkalinity at the rate of 7.14 g-CaCO3/g-TAN oxidized to nitrate (Nielsen and Bundgaard, 1978). A fraction of alkalinity consumed in nitrification is replaced if denitrification occurs and 3.57 g-CaCO3/g-NO3-N reduced to dinitrogen gas, but depending on the influent alkalinity, the buffering capacity of many wastewaters may be insufficient and low pH inhibition of nitrifying bacteria may occur (Nielsen and Bundgaard, 1978).
The BioWin software (EnviroSim Associates Limited, 2016) has a kinetic switch function (SF) incorporating pH tolerance into the growth rates of both AOB and NOB of the form:
where pHLL is the lower pH limit at which the overall nitrification rate is 50% of the maximum and pHHL is the analogous upper pH limit. The BioWin default values for pHLL and pHHL are 5.5 and 9.5, respectively, for both AOB and NOB. A similar pH tolerance expression for net specific nitrifying population growth was developed by Antoniou et al. (1990) based on laboratory experiments with nitrifying activated sludge cultures and parameters fitted to data by nonlinear regression:
Comparable upper and low pH limits for the half-optimum nitrification rate in Equation (4) were 6.8 and 8.6, respectively. Figure 6 shows computed pH values using Equations (1) and (2). A sensitivity analysis for pHLL is included for values of 6.0, 6.3, and 6.5, as well as the BioWin default value.

Calculated pH tolerance ranges for nitrification rate from Equations (3) and (4). pHLL for Equation (3) varies from 5.5 (default) to 6.5; pHHL is constant at 9.5. Upper and lower pH values for Equation (4) are 6.8 and 8.7, respectively.
BioWin simulations were made using the default pH SF parameters, which provide the widest tolerance range and therefore provided a conservative estimate of the effect of low pH on nitrification. Simulation output values for pH for the range of indoor conservation efficiency using the calibrated BioWin models for the three treatment plants are shown in Fig. 7. Even though the three plants had different levels of influent alkalinity:4.3, 4.76, and 5.2 mM for the 0.53, 1.10, and 6.13 m3/s (12, 25, and 140 mgd) plants, respectively, different influent TKN, and extents of denitrification, the trends in effluent pH values were similar, indicating a significant drop in pH at around 40% influent flow reduction.

Modeled effluent pH for the three wastewater treatment plants based on Equation (4) and BioWin 5.0 default values for upper and lower pH tolerance limits. Lines are least squares nonlinear regression fits to Models 1 and 2 log-transformed to pH values.
The four-parameter nonlinear regression Model 2 was fitted to modeled effluent pH values transformed to [H+] (M) with least-squared parameter and SSE values shown in Table 3. Regression values for [H+] were converted back to pH in Fig. 7. The regression model underpredicted pH values at baseline and small flow reduction conditions, but did better at capturing the simulated effluent pH trends at flow reduction levels over 40% for the three plants.
The dependent variable for nitrogen species is the ratio of the effluent for a given flow reduction to the base case without indoor conservation. [H+] regression parameter values are estimated using predicted effluent pH from the BioWin models.
The modeled effluent TAN, nitrite, TIN, and pH values suggest that the combination of significant flow reductions accompanied by high influent TKN concentrations and insufficient alkalinity resulted in loss of nitrification due to inhibition of NOB and to a lesser degree, AOB. For example, when the influent flow rate was reduced by 50%, the modeled average decrease in the NOB population for the three plants was 31%.
Using the regression model parameters in Table 3, the predicted effluent nitrite increased by a factor of 39. Nitrite may be a particularly sensitive indicator of pH inhibition problems, although there are other factors, for example, dissolved oxygen and ammonia concentration, which can contribute to nitrite accumulation (Anthonisen et al., 1976; Ruiz et al., 2003). pH inhibition of nitrification resulting from insufficient buffering can be avoided by the addition of alkalinity and pH-controlled operation, but increase treatment costs and operational complexity.
Comparison of Models 1 and 2 was made using a likelihood ratio test with the null hypothesis that the four-parameter Model 2 provides a better fit for the four dependent variables, compared with the simpler exponential model. Chi-square (χ2) values of the likelihood ratio were computed for Models 1 and 2 for each y variable and compared to the upper (97.5) and lower (2.5) percentile bounds for (n-k)–(n-m) = (16-2)–(16-4) = 2 df. After comparison with the upper and lower χ2 percentiles (p ≤ 0.05), the null hypothesis was accepted for the regression models for effluent TAN and TIN ratios and [H+], that is, the four-parameter Model 2 was selected. For nitrite, the null hypothesis was rejected and Model 1 with fewer parameters was selected. Inspection of the fitted lines in Figs. 3–5 and 7 provides visual support for the results of the likelihood ratio test.
Particularly, comparison of the regression model results for TIN and pH suggests that the two-parameter exponential Model 1 does a relatively poor job of capturing the mid-range BioWin output for conservation efficiencies between 20% and 40%, especially overestimating the pH drop and increase in the TIN ratio over this range. The BioWin simulation data in Figs. 3–5, and 7 show a “threshold” effect, characterized by relatively stable effluent nitrogen species and pH near baseline (no conservation) values until indoor water conservation efficiency increases to over 40%, when a large increase in effluent TAN, nitrite, and TIN ratios and corresponding decrease in pH were observed. Model 2 generally did a better job simulating this threshold effect compared with the simpler exponential Model 1.
Effluent TP output from the BioWin models of the three treatment plants is shown in Fig. 8. Unlike the nitrogen species trends, which reflected nitrification and denitrification operation at the three plants, effluent phosphorus results depended on whether the plant is operated for enhanced biological phosphorus removal. The 0.53 and 6.13 m3/s (12 and 140 mgd) plants achieved 97% and 70% average removal of influent TP, 6.9 and 4.5 mg/L, respectively, under normal operating conditions, whereas influent TP at the 1.10 m3/s (25 mgd) plant was only reduced by 40% from the influent of 4.5 mg/L without conservation flow reduction.

Modeled effluent TP for increasing levels of indoor demand and influent flow reduction at constant loading. Data points are the ratio of effluent TP normalized to effluent TP with no conservation for the three wastewater treatment plants.
For the plants achieving greater TP removal, reduction in influent flow at a constant mass loading rate resulted in significant reductions in modeled effluent TP, despite higher influent concentrations. For the 1.1 m3/s 25 mgd plant, the trend is reversed: a 50% reduction in influent flow rate and proportional increase in influent TP result in a doubling of modeled effluent TP. As mentioned earlier, the 12 and 140 mgd plants achieved some biological phosphorus removal under normal operations, while the 25 mgd plant was not operated for enhanced biological phosphorus removal.
Changes to aeration requirements and sludge production were modeled at the 1.1 m3/s (25 mgd) plant for the range of conservation conditions (0–54% influent flow reduction). Generally, we expected that solids production and oxygen demand would respond more to changes in mass loading of COD rather than concentration. The BioWin configuration for the plant included the anaerobic digester and dewatering processes; so waste solids were estimated from the dewatered cake. At the maximum flow reduction condition, the primary sludge mass increased by ∼4% from the normal flow (base) condition, and the mass rate of cake solids produced after digestion and dewatering with 54% flow reduction increased by only 2.6%.
The model output for the required airflow rate decreased proportional to the influent flow reduction, reaching a 5.2% savings at the 54% flow reduction condition. A previous study of energy savings at 13 municipal treatment plants in California resulting from reductions in water use estimated that pumping costs were an important source of energy savings during conservation-induced low-flow conditions during the 1976–1977 drought in California. Reduced power consumption occurred both in the collection system and plant itself; however, these savings appeared to be offset by higher chemical costs. A major economic benefit of indoor water conservation practices was savings from the design and operation of new collection and treatment facilities sized for reduced flow conditions (USEPA, 1980).
Discussion
The assumption of constant alkalinity in the indoor conservation modeling did not consider added alkalinity from increased influent concentrations of TKN or other errors resulting from the assumption of constant influent alkalinity. The BioWin program does not compute the contribution of the hydrolysis of urea to alkalinity, which may account for a significant portion of wastewater buffering capacity. Lew et al. (2009) estimated that the molar ratio of alkalinity added by hydrolysis of urea-nitrogen to TAN was 1:1. We evaluated the added alkalinity for the condition of 50% flow reduction using data from the 1.1 m3/s (25 mgd) plant, for which the measured average soluble TKN was 72% of the total influent TKN. Assuming that the source of 80% of the influent soluble TKN was urea (Mbaya et al., 2010) and, conservatively, that complete ammonification of this fraction occurred before the wastewater entered the aeration basin, we estimated that hydrolysis of urea could have contributed 1.4 mM of the total influent alkalinity of 4.76 mM under the base (no conservation) condition. Estimating that the contribution of urea hydrolysis to the influent alkalinity concentration doubles for the case of 50% flow reduction, the adjusted influent alkalinity was estimated to be 5.15 mM.
Under the original assumption that influent alkalinity did not change with increasing conservation, the calculated value for effluent TAN was 0.3 mg/L for 50% flow reduction. When the added alkalinity from the complete hydrolysis of the higher concentration of urea was considered, the modeled effluent TAN decreased to 0.12 mg/L, less than the original effluent concentration of 0.3 mg/L, but still 33% higher than the base (no conservation) effluent TAN concentration of 0.09 mg/L. With the added alkalinity from urea hydrolysis, the modeled effluent pH is 5.97, a value that many still consider too low for stable nitrification (Ruiz et al., 2003).
Sensitivity of the BioWin model to influent alkalinity for the 1.1 m3/s (25 mgd) plant was investigated for two conservation scenarios (48% and 54% flow reduction), where large increases in modeled effluent TAN, NO2-N, and TIN were obtained. The effect of adding alkalinity as Na2CO3 on effluent pH is shown in Fig. 9, and the response of modeled nitrogen species ratios is shown in Fig. 10. As more alkalinity was added, the effluent pH increased and approached the effluent pH with no flow reduction. Effluent TAN and nitrite nitrogen both decreased compared with the modeled values at the 48% and 54% flow reduction scenarios when no alkalinity was added. Comparing Figs. 9 and 10, it appears that the response of nitrification to added alkalinity was more rapid than the pH response.
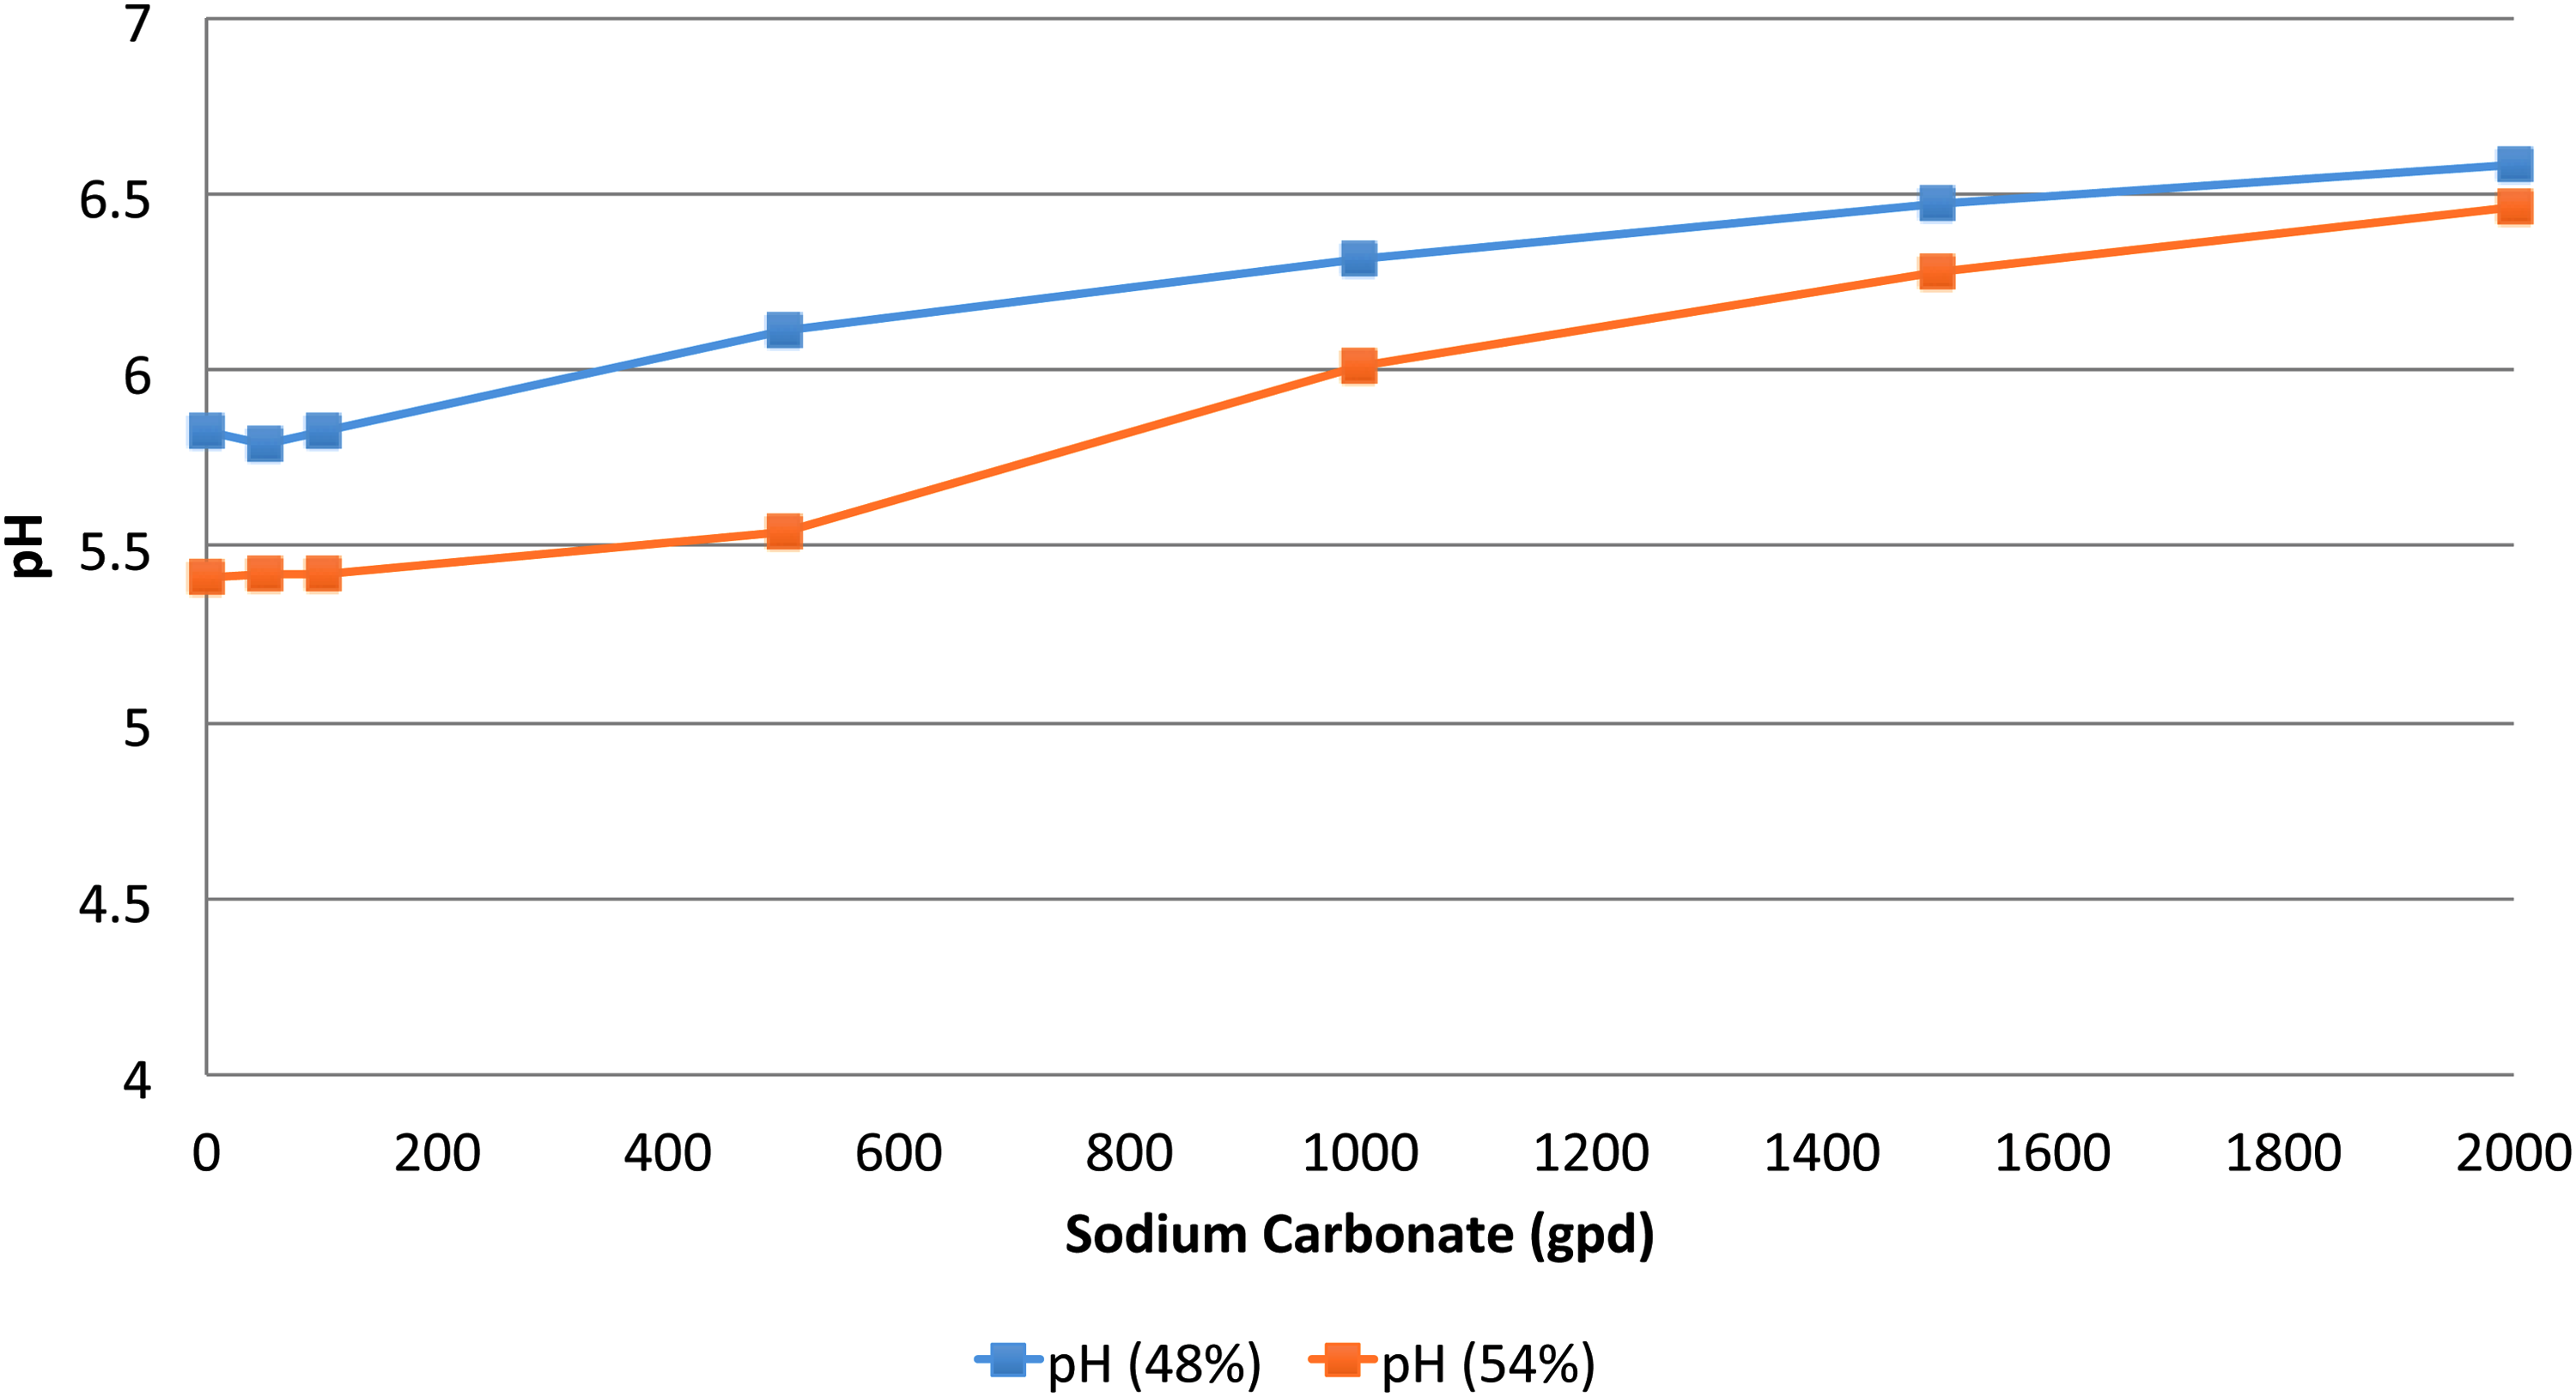
Sensitivity of effluent pH to alkalinity (Na2CO3) addition on effluent pH using the BioWin model of the 1.1 m3/s (25 mgd) treatment plant for two high levels of influent flow reduction.
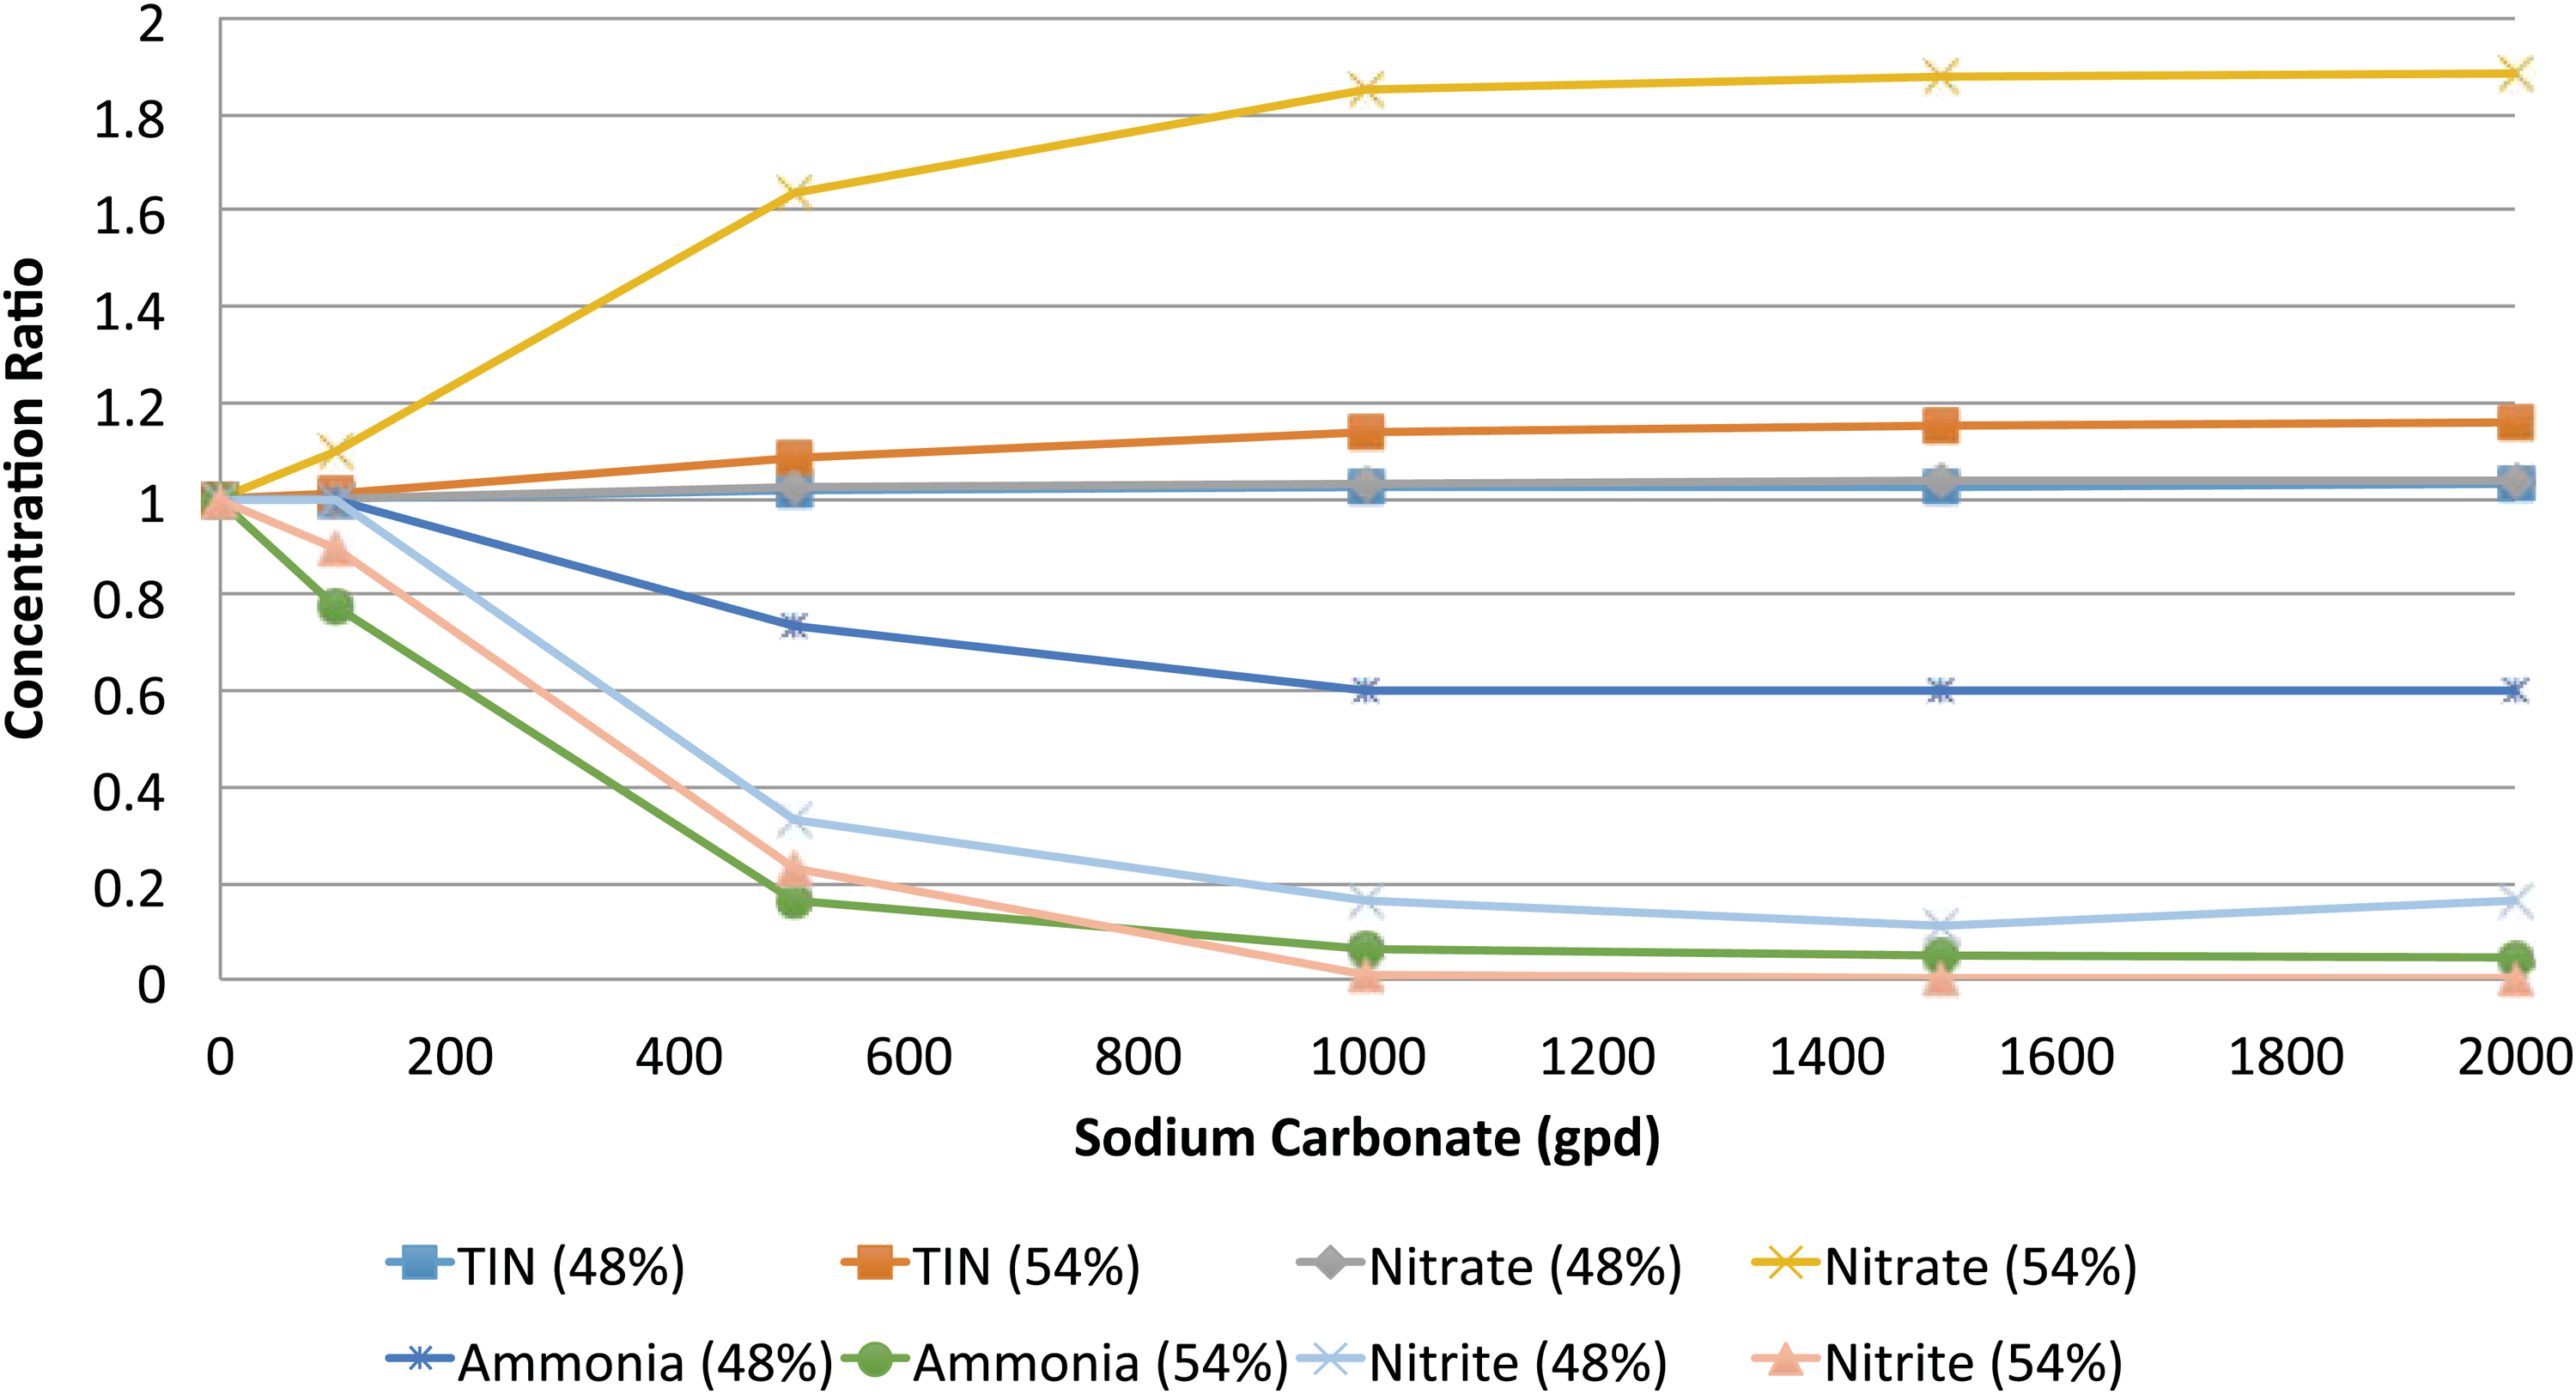
Effect of alkalinity addition on modeled effluent nitrogen species for the 1.1 m3/s (25 mgd) plant. The y-axis scale is the ratio of the modeled effluent concentration for associated levels of added alkalinity to the modeled effluent concentrations at the reduced flow rates with no alkalinity added.
Addition of alkalinity (3,100 kg/d NaOH in 2 N solution) was modeled for the case of 50% flow reduction from 0.64 to 0.32 m3/s (14.8 to 7.4 mgd) at the plant designed for 1.10 m3/s (25 mgd) plant, with the result that the effluent pH increased to 6.76 and effluent TAN decreased to the base (no conservation) level of 0.09 mg/L. At an estimated cost of $1.23/kg, the chemical cost for pH control was estimated to be $1.4 million/year or $0.14/m3 ($518/million gallons), not including storage, handling, and pH monitoring.
As indicated in Fig. 7, the value of the SF and the computed specific nitrification rate were quite sensitive to the lower pH limit. The BioWin default half-saturation value of 5.5 was used in the indoor conservation modeling since that value was used to calibrate the three treatment plant models. However, this value produced a pH tolerance range, which was larger than that suggested by other studies (e.g., Antoniou et al., 1990) that determined experimentally that the lower pH limit was 6.8. Assuming a higher pH half-saturation level of 6.3 in the simulation produced notably different results. For the base case (no demand reduction), the new computed effluent TAN concentration is 0.15 mg/L compared with the effluent TAN for the BioWin default: 0.09 mg/L. For the 50% indoor water demand reduction scenario, the modeled effluent TAN was 0.35, nearly thrice the concentration when alkalinity added from urea hydrolysis was considered at the lower pH limit of 5.5.
In considering the model results, it is important to note that they were based on imposed and unprecedented changes in wastewater flow and constituent loading, not actual data. As stated earlier, there are probably significant uncertainties in the impacts of extreme decreases in wastewater flow rates due to residential and commercial demand reductions in response to water shortages. For the modeled plants, for example, there have not been periods of prolonged flow reduction, much less the more complicated scenario of reduced flows accompanied by diverse domestic water conservation practices.
Overall, it is important to note that the results we obtained from modeling the conservation-derived scenarios that entail significant changes to influent flow and water quality, which are outside the calibration data range, could certainly produce errors associated with extrapolation. A concerted future effort to acquire data from treatment facilities experiencing extreme changes in flow and influent water quality would be an important contribution to the effects found in this study.
However, we suggest that the increased likelihood of water shortages from climate-driven events requiring significant reduction in water use, such as the California drought during 2013–2017 (State of California, 2014), provides a rationale for investigating the effect of such measures on wastewater collection and treatment systems, particularly with respect to nutrient treatment, which may have a particularly large impact on the quality of surface waters experiencing low flows due to drought.
Summary
Models of nutrient removal at wastewater treatment facilities experiencing significant reductions in indoor water demand, resulting in greater than 40% flow rate reduction, at a constant mass loading rate for wastewater organic, nitrogen, and phosphorus constituents resulted in higher influent and treated effluent concentrations of TAN, TIN, and nitrite, due to alkalinity limitation and low pH inhibition of nitrification. The effects were consistent for the three Colorado wastewater treatment plants with design capacities of 0.53, 1.10, and 6.13 m3/s (12, 25, and 140 mgd), designed and operated for biological nitrogen removal. At 50% flow reduction, effluent TAN increased by an average factor of five; nitrite-nitrogen by an average factor of 39; and effluent TIN and nitrate-nitrogen by an average factor of two.
For plants where alkalinity limitation is a concern, large reductions in indoor water use, such as might occur in an extreme drought, alkalinity addition to achieve pH conditions required for nitrification, and stream water quality may be necessary to comply with effluent permit limits.
The addition of caustic alkalinity (NaOH) to meet TIN limits and maintain an effluent pH value of 6.8 was modeled at the 1.1 m3/s (25 mgd) plant assuming 50% influent flow reduction. pH adjustment required 3,100 kg/d 2 N NaOH or ∼0.1 kg/m3, producing an estimated chemical cost of $1.4 million/year, or $0.14/m3 ($518/million gallons).
For two plants achieving enhanced biological phosphorus removal, higher influent TP concentrations during indoor water conservation resulted in lower effluent TP concentration. When removal occurred only by normal biomass growth, effluent TP increased proportionally to the amount of flow reduction.
Under the constant constituent mass loading conditions for COD, TSS, and TKN, the modeled impacts on solids production and airflow requirements were small—a 2.6% increase in digested cake solids production (dry weight basis) and 5.2% reduction in required airflow rate for 54% flow reduction.
Footnotes
Acknowledgments
This research was part of the activities of the Center for Comprehensive, optimaL and Effective Abatement of Nutrients (CLEAN). This publication was made possible by USEPA Grant 83557001. Its contents are solely the responsibility of the grantee and do not necessarily represent the official views of the USEPA. Furthermore, USEPA does not endorse the purchase of any commercial products or services mentioned in the publication.
Author Disclosure Statement
No competing financial interests exist.