
Abstract
Abstract
It has been reported that deep saline aquifers represent the largest geologic CO2 storage resource. To better predict containment effectiveness and long-term reservoir behavior of these formations, it is important to understand the potential geochemically induced changes to the porosity and permeability of both the primary sealing formation and CO2 storage formation rocks. To investigate these potential changes, an experimental study to probe the geochemical interactions of CO2/brine/rock system under geologic CO2 storage conditions was conducted in a static reaction system. Marine shale (primary sealing formation) and Lower Tuscaloosa sandstone (CO2 storage formation) core samples taken from the Plant Daniel CO2 storage test site (Jackson County, Mississippi) were exposed to CO2-saturated brine in a batch reactor at relevant geologic storage conditions (85°C and 23.8 MPa CO2 pressure) for 6 months. X-ray diffraction, scanning electron microscopy, computed tomography, and brine chemistry analyses were performed before and after the exposure. Permeability measurements from the marine shale and sandstone core samples before and after CO2/brine exposure indicated a significant effective permeability change. Sealing marine shale permeability increased following exposure while the permeability of the sandstone from the storage formation was observed to decrease. Analysis results of the primary sealing formation sample (marine shale) at the Plant Daniel CO2 storage test site have not been reported before. The permeability decrease of the Lower Tuscaloosa sandstone sample reported in this study verifies the results reported in a previous study. These results have implications for the integrity of the primary seal in a CO2 storage setting.
Introduction
M
Recent studies have been reported regarding the sequestration of CO2 in geological formations, including a storage capacity estimate for saline aquifers, effects on coal, coupling with enhanced oil recovery, and a modeling study of a CO2 storage project in a reservoir in Cranfield, Mississippi (Haljasmaa et al., 2011; Rodosta et al., 2011; Delshad et al., 2013; Middleton, 2013; Ranjith et al., 2013; Jia et al., 2016). Deep saline aquifers represent the largest volume class of CO2 storage targets (Carbon Storage Atlas, 2015) due to the large pore volume in sedimentary basins and the high density and solubility of CO2 at the pressure and temperatures that exist in saline aquifers (Bachu and Adams, 2003).
Oil and natural gas bearing formations are also recognized as having significant CO2 storage capacity, and CO2 injection into those formations has the added advantage of enhancing the recoverable hydrocarbons, allowing a field to be more profitable. Demonstration scale injections of CO2 storage in saline aquifers and hydrocarbon-bearing formations have been performed, and these experiences generate critical information to build confidence in the viability of those options.
The Southeast Regional Carbon Sequestration Partnership (SECARB) has identified the Lower Tuscaloosa formation in the Southeast region of the United States as a viable injection horizon for large-scale CO2 storage demonstrations (Rodosta et al., 2011). One SECARB project targeting that formation is a small-scale injection conducted at a coal-fired power plant in Escatawpa called Plant Daniel in Jackson County, Mississippi (Rodosta et al., 2011); another is a larger scale injection in the Cranfield oil field near Natchez, Mississippi (Rodosta et al., 2011). For both injection locations the storage reservoir is the Lower Tuscaloosa sandstone formation, and the Tuscaloosa marine shale is the primary confining unit, with the Selma chalk group and Midway shale serving as secondary and tertiary containment units, respectively (SECARB, 2016).
Lower Tuscaloosa sandstone is about 36.5 m thick with an average porosity of 24% and permeability ranging from about 800 to 1,500 mD. The Lower Tuscaloosa sandstone, in southeast Mississippi, is composed of over 90% fine to medium grained sandstone. It is described as white and finely micaceous with a fine clay matrix interbedded with mudstone and siderite nodules (Griffith et al., 2011). The marine Tuscaloosa shale is a fissile, fine-grained, dark-gray micaceous shale with minor interbeds of calcareous, glauconitic sandstone with some argillaceous limestone lentils, laminated claystone, mudstones, and calcareous siltstone. The marine Tuscaloosa shale is predominantly composed of quartz, kaolinite, illite, hematite, and siderite based on point counts of thin section (Griffith et al., 2011). The average thicknesses of the confining systems are 152, 107, and 396 m for marine Tuscaloosa shale, Midway shale, and Selma chalk, respectively (Griffith et al., 2011).
As part of the SECARB projects, CO2 has been injected into the Lower Tuscaloosa sandstone at both sites. About 4,300,000 metric tons of natural and anthropogenic CO2 have been injected at Cranfield at depths from 2,591 to 3,124 m, and about 2,490 metric tons of CO2 have been injected at Plant Daniel at a depth of 2,621 m. As CO2 is injected into saline aquifers, it will dissolve into the formation fluids, form carbonic acid, lower solution pH, and possibly react with minerals in both CO2 storage interval and the primary seal above the interval. The acidification sequences will impact the rock's properties (e.g., porosity, permeability, as well as reactive surface area) (Tutolo et al., 2015; Li et al., 2016; Pan et al., 2016). Better understanding of how rock/brine/CO2 interactions affect injectivity and containment effectiveness will build confidence in the successful operation of subsurface CO2 injection and storage (Delshad et al., 2013).
Investigations into host rock properties using both experimental and modeling studies have been conducted (Morse and Arvidson, 2002; Luquot and Gouze, 2009; Soong et al., 2014b; Zhang et al., 2015). Luquot and Gouze (2009) experimented with flowing CO2-enriched aqueous phase through a carbonate core resulting in porosity and permeability changes from dissolution and/or precipitation at in situ geologic carbon storage (GCS) conditions of 100°C and pore fluid pressure of 12 MPa. Specifically, precipitation of Mg-rich calcite resulted in decreased permeability and porosity. Gouze and Luquot (2011) also conducted an X-ray microtomographic characterization of porosity, permeability, and reactive surface changes during the dissolution of pure calcite in a brine/CO2 mixture and showed that an increase in permeability was due to decreasing the tortuosity for homogenous dissolution. Also, they concluded that extensive GCS in deep saline aquifers that contain carbonate minerals could result in dissolution of these minerals, which could in turn affect permeability (Gouze and Luquot, 2011).
Soong et al. (2014b) found that mineral dissolution/precipitation could occur under GCS conditions for samples obtained from the Mount Simon formation (Indiana). In addition, Zhang et al. (2015) conducted core-scale numerical simulations of Mount Simon sandstone porosity and permeability evolution under GCS conditions. The simulation predicts dissolution of feldspar and quartz with subsequent formation of kaolinite causing a decrease in permeability. A study conducted by Lu et al. (2012) on CO2/rock/brine interaction in the Lower Tuscaloosa formation showed that mineral reactions in the Lower Tuscaloosa reservoir were minor during CO2 injection and brine chemistry remained largely unchanged. The reservoir is composed mainly of minerals with low reactivity (e.g., quartz), which are relatively unaffected by CO2.
Li et al. (2016) conducted a 10-day batch reaction study on rock/water/CO2 interaction at conditions relevant to GCS (T = 100°C, P = 10 MPa) with rock obtained from the Guantao formation of Bohai Bay Basin, China. The major mineral composition of the rock is quartz balanced with K-feldspar, albite, and clay minerals. They reported K-feldspar and albite dissolution as well as the formation of kaolinite, chlorite, and Fe-bearing minerals of pyrite and hematite postreaction. In addition, HCO3, Ca, Mg, and K and trace elements of Al, Cr, Mn, Ni, and Zn in water showed a significant increase postreaction. Tutolo et al. (2015) conducted studies in K-feldspar-rich sandstone from the Eau Claire formation (Indiana) under GCS conditions (150°C, and 20 MPa) using a flow-through apparatus. The results indicated dissolution of feldspar and precipitation of secondary aluminum minerals, such as boehmite. They also reported the decrease in bulk permeability and lower porosity in the postexperiment core samples.
Although laboratory studies have been conducted to investigate the interaction between CO2 and the minerals comprising the storage interval rocks, few studies have been conducted to investigate the interaction between CO2 and the minerals comprising the rock of the primary seal above the CO2 storage interval (Miller et al., 2016; Mouzakis et al., 2016). In fact, dissolution of carbonates and silicates in the primary seal is possible when the seal is in contact with CO2-saturated brine (Miller et al., 2016). The rate of dissolution is dependent on pH decreases in the brine from CO2 dissolution, reactive area/mass transfer properties, rock/water ratio, and rock composition (Morse and Arvidson, 2002; Luquot and Gouze, 2009; Xiao et al., 2017a). Dissolution of carbonates and silicates can result in changes in permeability, porosity, and reactive surface area. Cation concentration increases can supersaturate pore fluids with carbonates, with subsequent precipitation that can further alter porosity and permeability of the primary seal.
To fill this knowledge gap, the present study considers the effects of GCS on a sample from the primary confining unit above the Lower Tuscaloosa sandstone CO2 storage interval (marine shale) through laboratory experiments exposing the sample to CO2-saturated brine for 6 months at in situ conditions. Mineralogical, textural, and geochemical changes as a result of the exposure were determined using X-ray diffraction (XRD), computed tomography (CT) scanning, optical microscopy, scanning electron microscopy (SEM), and brine chemistry analyses. A Lower Tuscaloosa sandstone sample was also exposed to CO2-saturated brine for 6 months and analyzed by XRD, CT, SEM, and so on to verify property changes of another sample taken from the same interval reported in Soong et al. (2016).
Experimental
Core samples and brine
Two core samples from the Plant Daniel test site, ∼2.54 cm in diameter by 5.08 cm in length, were used in this study. One was a marine shale core from a depth of 2,418 m and the other was a Lower Tuscaloosa sandstone core from a depth of 2,611 m. Marine shale is the primary seal of Lower Tuscaloosa sandstone, which serves as the CO2 storage reservoir. The approximate major mineral compositions of the Lower Tuscaloosa sandstone sample and the marine shale sample were determined by semiquantitative bulk XRD analysis (Table 1). The chemical composition of the synthetic brine (Table 2) was designed based on the fluid chemistry of Lower Tuscaloosa brine. The initial pH of the synthetic brine was 5.4. Since the Lower Tuscaloosa brine is in contact with rocks in Lower Tuscaloosa formation for a very long time, the equilibrium condition is expected to have been reached. Therefore, no reactions are expected to take place between the synthetic brine and rock samples before CO2 is added. Before any measurements, the samples spent at least 3 days in a nitrogen-purged desiccator at relative humidity of 8–10%.
Analysis was performed by Weatherford Laboratories.
Reactors and experimental procedures
A set of 1.8 liter (N4683-T-HC-7500 C276) high-pressure vessels (9.53 cm I.D. by 26.67 cm depth) manufactured by Parr Instrument Company, Erie, PA, was used for this study. An open Teflon cell (7.62 cm I.D. × 10.16 cm length) and a smaller Teflon reaction cell (6.35 cm I.D. × 9.52 cm length) were used inside the pressure vessel. An ISCO 260D syringe pump was used to charge each vessel with CO2 and to maintain the pressure in the reactor. Temperature was maintained and controlled within ±1°C. A sketch of the reaction system can be found in Fig. 1.

Sketch of rock—brine—CO2 reaction system. Sample to brine volumetric ratio in Teflon cell #1 is 1:5.
The standard procedure for conducting the experiments was as follows:
1. The Teflon container holding the samples (core and two small chips) and brine was loaded into another large Teflon container in the pressure vessel. 2. The gap between the sample-holding container and the large container was filled with brine. Ensuring the CO2 phase remains saturated with water vapor without substantially altering the salt concentration in the sample-holding container. 3. The pressure vessel was closed and purged with CO2 three times to remove air. 4. The pressure vessel was charged with CO2 to 4.08 MPa and heated to 85°C. 5. CO2 was added to a pressure of 23.8 MPa and held at these conditions for 6 months. 6. On termination of the experiment, the temperature and pressure were slowly returned to ambient, and the samples were removed. 7. The solid samples were rinsed with deionized water multiple times to remove residual NaCl and dried in a desiccator under N2 flow. 8. Liquid from the sample-bearing container was recovered for analysis. The reacted brine analysis is given in Table 2.
Measurements and analysis methods
Before and after the 6-month test, the solids were analyzed by CT scanning, XRD, SEM, and optical reflected light microscopy. Inductively coupled plasma–optical emission spectroscopy (ICP-OES) was used to determine metal concentrations in the liquid samples, but due to high salt concentrations, sample dilution with distilled/deionized water was required. Solutions were analyzed for the full range of metals quantifiable by ICP-OES, including Al, Si, and Fe. The details of cation and anion analyses, XRD, and SEM-energy dispersive X-ray analyses were reported elsewhere (Soong et al., 2014a).
Porosity and permeability of the samples were measured both before and after the exposure. The porosity was measured using a helium porosimeter (HP-401; TEMCO, Inc., Tulsa, OK) at 0.7 MPa at ambient temperature. For the high-permeability sample (sandstone), a TEMCO Ultraperm 500 “flow-through” permeameter was used. The low–medium permeability core (marine shale) was measured using the pressure transient method (details of the method were reported in Siriwardane et al., 2009). The permeability of the core samples measured at the confining pressure close to the depth of the core was collected with various effective pressures to obtain the permeability profile of the core. The initial porosities were 26.5% for the sandstone core and 8.65% for the marine shale core. The initial permeability was 2,955 mD for the sandstone core and 47 μD for the marine shale core.
All the cores were scanned in the North Star Imaging M-5000 industrial CT scanner. Each of the reconstructed pre- and postimages of the 2.54-cm-diameter Lower Tuscaloosa sandstone core has a voxel resolution between 21 and 22 μm. The marine shale pre-exposure core was scanned at a resolution of 32.7 μm and the postexposure core was scanned at 21.2 μm. All resolutions mentioned are not fine enough to resolve the micro- to nano-scale porosity present in a sandstone or shale rock. The undetectable pores may connect larger voids that facilitate mass transport. Instrument settings, operating conditions, parameters are described elsewhere (Soong et al., 2016). The reconstruction properties of the images were selected to provide the highest fidelity rendition of the scanned sample and to construct a 3D volumetric representation of the object. The data were exported as a series of 16-bit grayscale cross-sectional TIFF images of the core. Image postprocessing was performed using the open-source software ImageJ (Rasband, 2014) and PerGeos®.
Results and Discussion
Exposure response of storage formation rock (Lower Tuscaloosa sandstone)
Figure 2 shows the permeability of the Lower Tuscaloosa sandstone measured as a function of effective pressure. The postexposure permeability of 2,400 mD was about 17% lower than the measured prereaction permeability of 2,900 mD in the fresh core at the effective pressure of 35.7 MPa. This result suggests that the CO2/brine exposure alters the pore characteristics by restricting flow and resulting in permeability reductions, and this result is consistent with permeability reduction of another Lower Tuscaloosa core after a 6-month exposure to CO2-saturated brine, as reported in Soong et al. (2016). The initial porosity of the Lower Tuscaloosa sandstone was 26.5%, and the postreaction porosity of the rinsed and dried Lower Tuscaloosa sample was 24.8%, which shows alteration of pore characteristics.
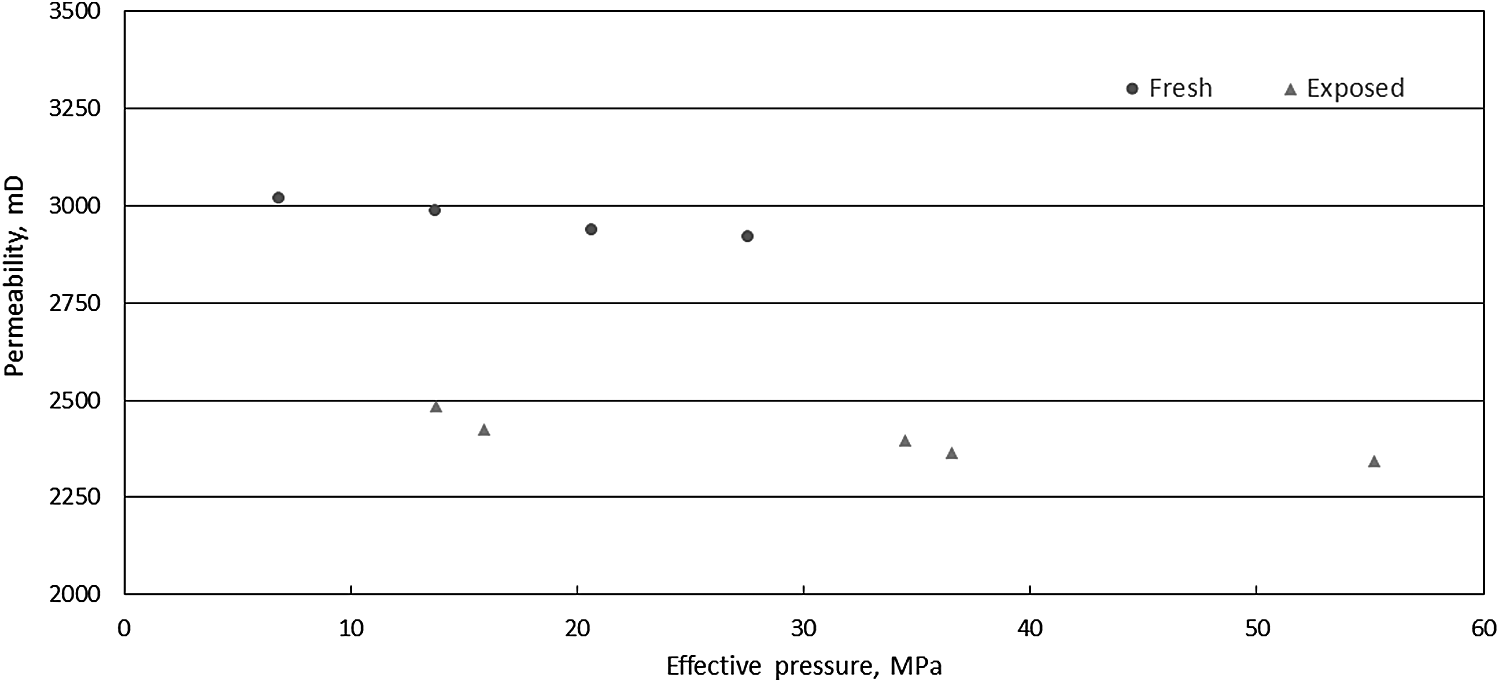
Permeability of Lower Tuscaloosa sandstone as a function of effective pressure.
Figure 3 shows CT analysis results of the sandstone before and after the 6-month exposure to the CO2/brine environment. The pre-exposure scans (Fig. 3A) of the sandstone core were scanned at a 21.2 μm resolution, and the postexposure core was scanned with a resolution of 21.8 μm (Fig. 3B). The pre- and postexposure scans are similar in location for each image pair. Both pore space (dark zones) and higher attenuating minerals within the core (bright zones) can be observed in Fig. 3A and B. Figure 3C (pre-exposure) and D (postexposure) is zoomed-in images from the red square highlighted regions presented in the lower left portion of Fig. 3A and B. The yellow circled region in Fig. 3C shows a gray void structure present in the pre-exposure scan that is no longer visible in the postexposure scan in Fig. 3D. Moreover, higher attenuating minerals (bright spots in Fig. 3C) appear to have been altered after 6 months of exposure to CO2/brine (Fig. 3D). This level of detail was only discernable in the zoomed-in images. The void was located ∼2 mm from the core edge and may indicate that mineral precipitation closed the void after the core was exposed to CO2-saturated brine.
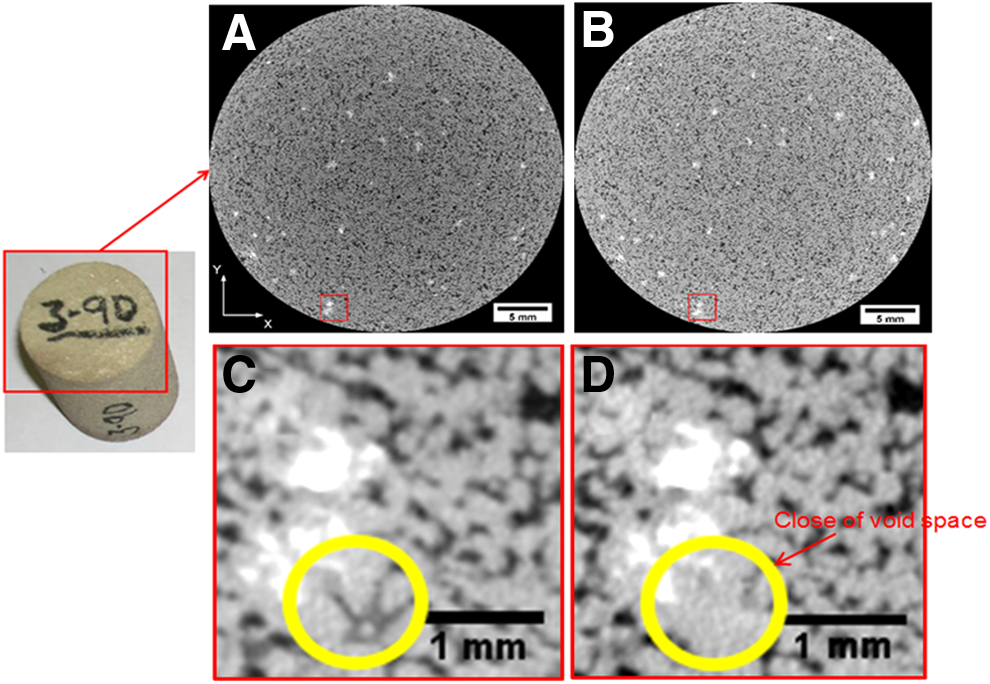
Lower Tuscaloosa
To ensure the observed precipitation was not a result of slight changes in resolution or an error in 2D slice matching from pre- to postexposure, the cropped 2D stacks that included the slices presented in Fig. 3C and D were examined in 3D using PerGeos (Fig. 4A, B). The red 3D pore space disappears from pre-exposure (Fig. 4A) to postexposure (Fig. 4B) further confirming that the pore space closed after 6 months of brine/CO2 exposure. The resolutions of these two scans are not fine enough to resolve the microporosity present in a sandstone core. Microporosity is known to connect larger scale voids and contribute to flow. However, the observed precipitation occurred within a pore ∼200 μm in diameter, well above the resolution detectable within the scans reviewed. Undetectable microporosity may have influenced the observed reductions in porosity and permeability. However, the pores detectable at this resolution would contribute more to mass transport and, therefore, would contribute more to a reduction in mass transport if closed.
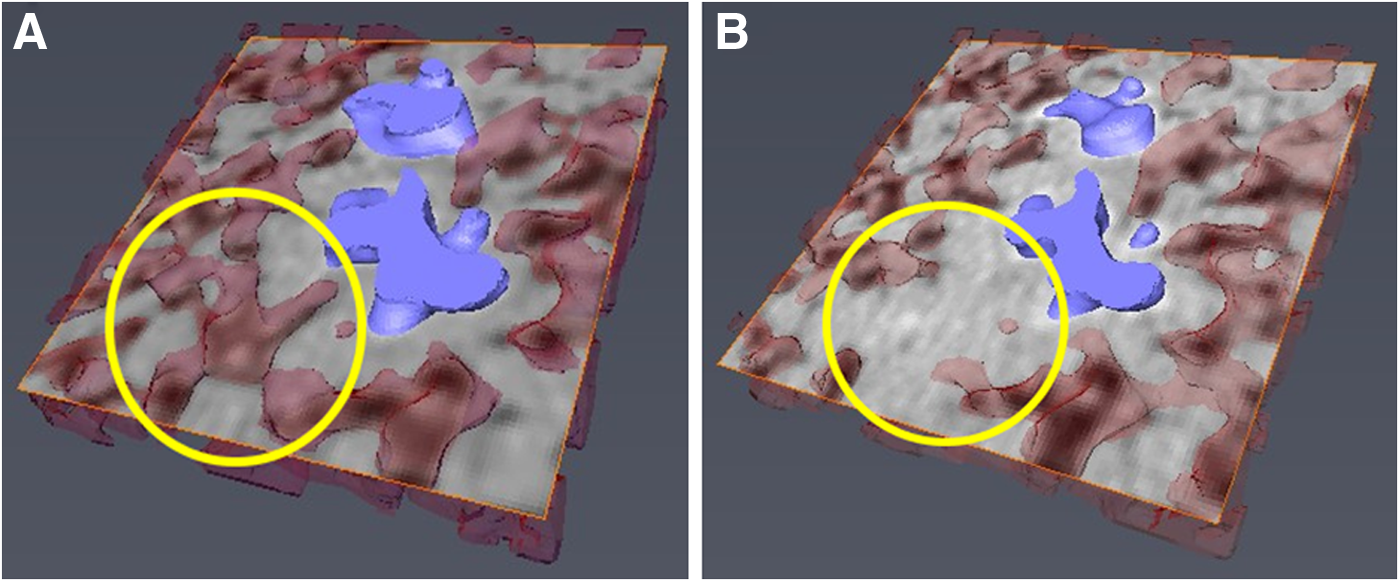
Lower Tuscaloosa sandstone
Based on this evidence, it is theorized that the observed 17% permeability decrease and 6.4% porosity decrease result from mineral precipitation occurring in the sample pores with a net effect of restricting flow. Mineral precipitation may also have occurred within pore throats in the porous medium, thus contributing to net permeability decreases, as illustrated in these CT scans. Studies of acidizing hydrocarbon reservoirs for enhanced oil recovery such as Smith et al. (2013) have identified similar permeability decreases as well as a similar study conducted with CO2/brine/Mount Simon sandstone (Soong et al., 2014b).
Comparing the analyses of the postreacted brine composition with that of fresh brine (Table 2) showed that after the 6-month exposure period, the concentrations of Al, Fe, Mg, Na, and Si had increased. This change in solution chemistry suggested that CO2-acidizied brine dissolved some of the nonquartz minerals.
Figure 5A–F shows selected secondary electron SEM images of the Lower Tuscaloosa sandstone sample. The specific site selected is a feldspar grain (identified based on energy dispersive X-ray spectroscopy), which is expected to be more susceptible to chemical change during exposure. The fresh sample is shown in Fig. 5A and D. Figure 5B and E shows the sample images after 6 months of CO2/brine exposure. Figure 5C and F further illustrate the sample after additional rinsing with deionized water to remove the NaCl deposited on the surface. The NaCl surface deposit was probably formed due to slow diffusion of residual brine out of pore structure to the surface during drying, which is commonly referred to as a “salting out” effect. In the top center of the fresh (Fig. 5D) and exposed (Fig. 5F) circled images, possible evidence of mineral dissolution was observed. Possible mineral dissolution and precipitation were also observed after the 6-month CO2/brine exposure (by comparing middle and bottom circled areas in Fig. 5D [fresh] to those circled areas in Fig. 5F [exposed]). The precipitation of secondary minerals (possibly amorphous SiO2 [am] and kaolinite, as reported in Zhang et al., in press) is possibly the primary contributor to a decrease in bulk permeability. When CO2 is injected into a saline formation, the brine in the reservoir becomes more acidic. The increase in acidity can lead to some dissolution of minor minerals in the sandstone such as feldspar and chlorite that are stable in the original conditions (Fu et al., 2009; Zhang et al., 2016). The increase in cation concentration produced by mineral dissolution can supersaturate the pore solution with respect to other minerals resulting in precipitation of secondary minerals such as SiO2 (am) and kaolinite. Zheng et al. (2015) conducted an experimental investigation of quartz–feldspar–detrital sandstone properties under CO2/NaCl solution/rock interaction. Their results show that the addition of CO2 enhanced the partial mineral dissolution and the compressibility for sandstone, and a permeability reduction is observed. The injected CO2 could be dissolved in pore fluid and precipitated with the calcium, magnesium, and ferrous ions in pore solution from the sandstone skeleton and thus resulted in the permeability reduction (Zheng et al., 2015).
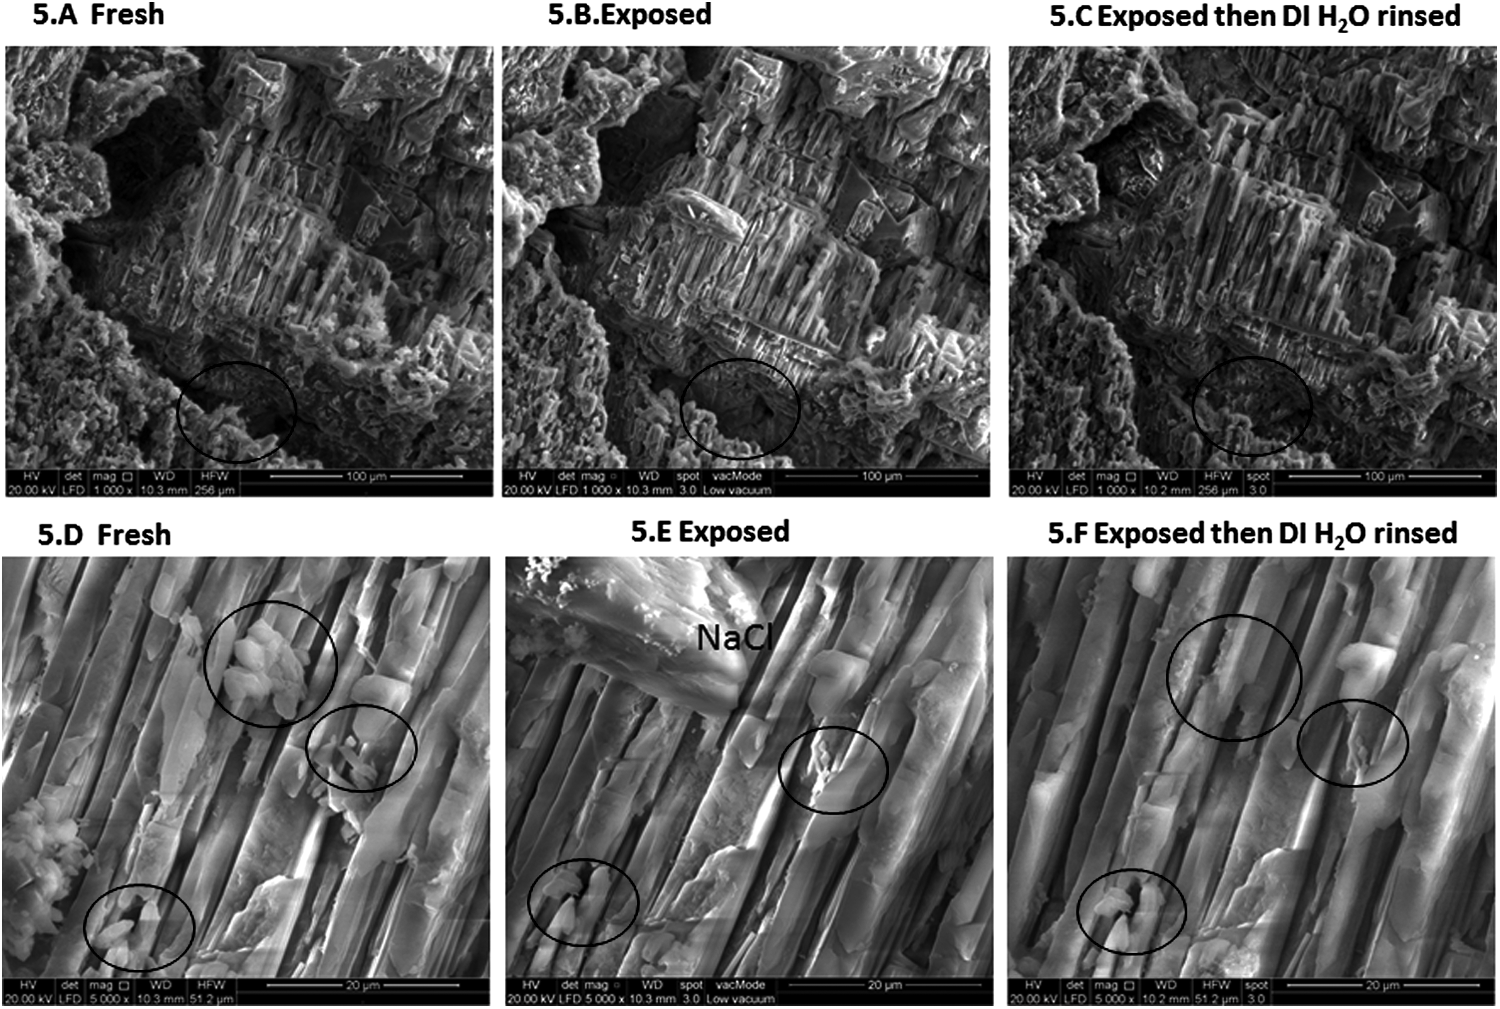
SEM images of the Lower Tuscaloosa sandstone fresh
Exposure response of primary sealing formation rock (marine shale)
Characterization of the marine shale sample was done using the same procedure described for the Lower Tuscaloosa sandstone sample. The permeability that was measured at in situ conditions corresponded to a depth of ∼2,418 m (effective pressure of 33.5 MPa). The Autolab unit (NER, Inc., White River Junction, VT) with argon was used for more precise measurements of the marine shale permeability for both fresh and exposed samples due to the low permeability of shale. Figure 6 shows permeability as a function of different effective pressures. Here, a significant increase in permeability (170 μD of the core when exposed for 6 months vs. 30 μD of the fresh core at the effective pressure of 33.5 MPa) was observed. Mineral dissolution could increase the average size of pathways, which could lead to increased permeability. The porosity of the fresh sample was 8.65%, and the porosity measured after the 6-month CO2/brine exposure was only slightly lower at 8.56%.

Permeability of marine shale as a function of effective pressure.
CT analysis results of the marine shale core before and after the 6-month exposure to the CO2/brine environment are shown in Fig. 7. Figure 7 displays approximately the same slice from pre- (7A) and postexposure (7B). One main fracture spanning the diameter of the core in Fig. 7A appeared to have decreased in size after the 6-month exposure in CO2/brine environment (Fig. 7B). On the contrary, two adjacent fractures were widened in the postexposure image (Fig. 7B). Furthermore, dense materials (bright spots) were formed within the left-most fracture following exposure to CO2-saturated brine (Fig. 7B circled areas).
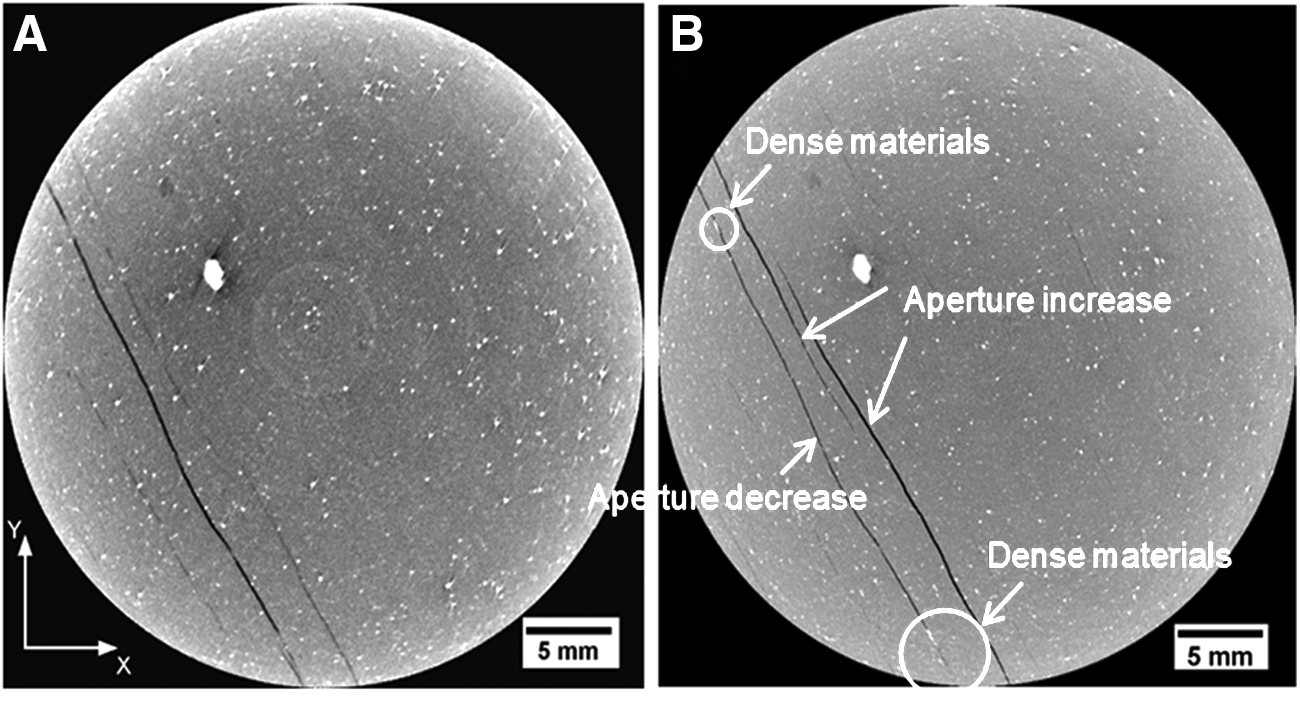
Figure 8 contains resliced images in the YZ-plane for pre- (Fig. 8A) and postexposure (Fig. 8B) samples. Two regions of interest are identified: a red rectangle and an orange oval. The red rectangle focuses on a fracture that became more connected after 6-month exposure. A widened and more connected fracture detectable at the scan resolution would contribute to mass fluid transport. In addition, the orange oval highlights a fracture where some dense mineral growth is apparent after the 6-month exposure (Fig. 8A, B). The combination of both may result in the increase of permeability of the sample after the 6-month exposure. Precipitation caused the main fracture to close in diameter, while two large fractures widened over the 6-month exposure. The additional stresses within the precipitated fracture may have caused the adjacent fractures to expand.

Marine shale resliced images in the YZ-plane.
Both fracture connection and mineral precipitation in the fracture after the CO2/brine exposure are indicated by CT images, and permeability results show that the combination of both causes an increase of permeability of the sample after the 6-month exposure (Fig. 6). To better interpret those results, the nature of these fractures, their relevance to in situ behavior of formation rock, and implications for GCS system performance need to be considered. The evolution of fracture features in the marine shale cores may be related to a geochemical alteration of the sample along a bedding plane due to a preferential geochemical alteration related to compositional differences (e.g., presence of more easily weathered mineral(s) along specific planes). It may also be due to delamination of the sample along the bedding plane after the sample was removed from the in situ confining stress. This decompression and mechanical delamination would be augmented by sample swelling with exposure to brine.
A modified experimental approach would need to be pursued to resolve the extent to which each of these factors contributed to fracture evolution in the marine shale core sample under experimental conditions. Also, because the direction of observed shale fracturing/delamination is parallel to the bedding plane, and nominally orthogonal to the path of leakage through the seal, the change in effective permeability in the X-Y plane, associated with shale delamination that could potentially occur in the marine shale, would not significantly contribute to the change in effective permeability of the seal in the Z direction. A large permeability increase in the Z direction due to delamination cracks would depend somewhat on the degree of interconnection of the cracks. As such, the overall impact to containment effectiveness of the marine shale seal may be negligible in the Lower Tuscaloosa GCS system. Further experimental simulation and modeling are warranted to further explore this idea.
The postreaction brine was analyzed following contact with the marine shale and CO2 (Table 2). Comparing the reacted brine with the fresh brine, the following trends were observed. The concentration of Ca, Fe, Mg, Na, and Si increased after the 6-month exposure period. Except for K, the increases in reacted brine concentration for the marine shale were more than those observed for the Lower Tuscaloosa sandstone core exposure experiment. This observation was not surprising since the shale contains a higher content of minerals (i.e., chlorite, plagioclase, etc.) that are more susceptible to CO2/brine attack. Only a slight increase in the concentration of Ca was observed even though 5% of the marine shale is calcite. Preferred dissolution of silicates such as chlorite and plagioclase over calcite is possibly the reason for slow increase of Ca in solution.
Chemical reactions between reservoir rock and fluids involve two types of minerals: the first type are the relatively fast-reacting minerals, including Ca, Mg, or Fe-rich frame work minerals such as feldspars, clays, micas, and the second type includes minerals such as Fe oxides and quartz, which interact slowly with CO2 (Zheng et al., 2015). The addition of CO2 induced the dissolution of feldspathic minerals, which increased the concentration of metal ions such as K and Na and may decrease the concentration of calcium ions precipitated by carbonic acid. Dissolution of feldspar and other silicates can also lead to supersaturation of SiO2 and precipitation of SiO2 (Miller et al., 2016). In the NaCl/CO2/rock environment, the feldspar reacts with water and generates mica, kaolinite, and so on, while the dissolved CO2 can result in formation of carbonate minerals such as dolomite, calcite, and siderite (Zheng et al., 2015).
Studies of CO2 injection into depleted oil and gas reservoirs have shown that the initial chemical equilibrium between the saline formation fluid and reservoir rock may be disturbed resulting in new chemical reactions (Fischer et al., 2010). Such interactions can result in changes in the physical and chemical properties of the reservoir system (Wigand et al., 2008; Fischer et al., 2010; Soong et al., 2014b; Zhang et al., 2015). The marine shale located above the potential storage formation (Lower Tuscaloosa sandstone) is considered as the primary seal. The observed increase in permeability after the CO2/brine exposure from this study is likely due to the heterogeneity of the core sample and the experimental setup, which resulted in core sample cracking during the exposure period. Those results may not represent actual in situ behavior.
It also can be seen from Table 1 that the major mineral composition is not significantly different between sandstone and marine shale. In addition, marine shale does have more reactive feldspar and calcite than sandstone. Dissolution of reactive K-feldspar and calcite could have created additional connective pathways thus contributing to an increase in permeability after CO2/brine exposure. This might impact the integrity of the long-term storage of CO2. However, the very low permeability of the shale relative to the sandstone and capillary pressure barrier effect would suppress CO2 to enter the pore space of the caprock, which limits bulk rock dissolution and reduces the risk to seal rock formation (Tian et al., 2014; Xiao et al., 2017b). Furthermore, secondary cap rock formation, Selma chalk, above marine shale was found not to be reactive with CO2/brine in our previous study (Soong et al., 2016).
In summary, while potential geochemical alteration of sealing intervals in GCS scenarios could significantly affect local seal behavior, the presence of a relatively thick primary caprock, and secondary low permeability sealing intervals will likely minimize upward CO2 and brine migration. To be specific, even though the primary confining layer to the Lower Tuscaloosa formation (marine shale) shows some evidence of reactivity and fracturing in experimental studies, the presence of Selma chalk as a secondary containment unit gives confidence that effective containment will be ensured.
For the Lower Tuscaloosa sandstone sample, the combined information from XRD, SEM, CT scanning, and brine analysis indicates dissolution of minerals, most likely feldspar, kaolinite, and chlorite in flow pathways along with precipitation of minerals in flow pathways of the Lower Tuscaloosa sandstone sample. For the sandstone sample, mineral dissolution, most likely feldspar, and secondary mineral precipitation in flow pathways had the net effect on decreasing permeability. These results suggest that the injection of CO2 into a deep saline aquifer can affect porosity as a result of both mineral dissolution and precipitation in the formation. The change of porosity due to mineral reactions can adversely influence permeability. This permeability change depends not only on porosity but also on the details of pore space geometry and the distribution of precipitates within the pore space.
In future work, there will be two focuses: (1) to determine if the permeability increase of the marine shale sample results in an impact to containment effectiveness of the marine shale seal in the Lower Tuscaloosa GCS system and (2) to use multiple marine shale samples from different depths to verify the results reported in this study. To address the first, a reservoir-scale model will be developed to investigate how thick the zone will be that has a permeability increase in the marine shale. To address the second, multiple marine shale samples will be obtained from the Plant Daniel CO2 storage site to conduct duplicate experiments.
Conclusions
In this study, chemical interactions between a primary seal sample (marine shale core sample) and CO2-saturated brine were investigated under in situ GCS conditions, as well as a CO2 storage reservoir sample (Lower Tuscaloosa sandstone core sample). The Lower Tuscaloosa CO2 storage reservoir was immediately below marine shale primary seal. The interaction between core samples and CO2-saturated brine was investigated using a 6-month duration static system. CT, XRD, SEM, petrography, brine composition, porosity, and permeability analyses were performed on the samples before and after exposure to CO2-saturated brine under GCS conditions. For the marine shale, the significant change in permeability is due to the combined effects of reactive mineral composition, sample heterogeneity, and sample delamination, although the permeability of the altered shale was observed to be 1,000 times less than the permeability of sandstone. Moreover, after the Marine shale sample was retrieved from deep depth below the surface, the drop in confining pressure might lead to formation of secondary fractures due to decompression and subsequent delamination. The formation of these secondary fractures could lead to overprediction of the permeability increase. For the Lower Tuscaloosa sandstone, there was a 6.4% decrease in porosity and a 17% decrease in permeability found in the sandstone core after it was exposed to CO2-saturated brine for 6 months. The decrease in porosity and permeability was due to feldspar dissolution, migration, and secondary mineral precipitation altering the sandstone pore/crack structure. The low content of active mineral phases in the Lower Tuscaloosa sandstone sample and the high initial porosity of the sample lead to a smaller permeability change for the sample after the exposure. Our previous study suggests that even with an increase in marine shale permeability, the existence of secondary and tertiary seals is likely to provide a stable caprock seal in the presence of CO2.
Footnotes
Acknowledgments
We thank Bryan Tennant for providing the CT images of the studied rock samples. We are also indebted to Dr. T.T. Phan for preparing the brine and to AECOM for conducting the brine sample analysis.
Disclaimer
This report was prepared as an account of work sponsored by an agency of the United States Government. Neither the United States Government nor any agency thereof, nor any of their employees, makes any warranty, express or implied, or assumes any legal liability or responsibility for the accuracy, completeness, or usefulness of any information, apparatus, product, or process disclosed, or represents that its use would not infringe privately owned rights. Reference herein to any specific commercial product, process, or service by trade name, trademark, manufacturer, or otherwise does not necessarily constitute or imply its endorsement, recommendation, or favoring by the United States Government or any agency thereof. The views and opinions of authors expressed herein do not necessarily state or reflect those of the United States Government or any agency thereof.
Author Disclosure Statement
No competing financial interests exist.