
Abstract
Abstract
Impact of a Cambi Thermal Hydrolysis Process™-Anaerobic Digestion (TH-AD) solids treatment method on concentrations of 4 phthalate plasticizers in wastewater sludge samples was explored. Samples were analyzed for diisononyl phthalate (DiNP), diisodecyl phthalate (DiDP), bis(2-ethylhexyl) phthalate (DEHP), and benzyl butyl phthalate (BBP) concentrations during individual stages of the TH-AD treatment process, in biosolids produced by the TH-AD process (Class A biosolids) and Class B biosolids from the same facility produced through the liming of sludges. Results showed significantly higher concentrations of all 4 compounds in Class A biosolids compared to concentrations in Class B biosolids. For DEHP, DiNP, and DiDP, this increase occurred during the anaerobic stage of treatment. Calculations indicate that increases of the four study compounds in Class A biosolids, compared to Class B biosolids, were not solely due to solid reduction during anaerobic digestion and dilution during liming. Overall, implementation of the TH-AD process increased concentrations of phthalate plasticizers in biosolids.
Introduction
P
Phthalates are not chemically bonded to the plastics and polymers in which they are used, allowing the compounds to leach from consumer and commercial products (Dargnat et al., 2009; Cao et al., 2015). For instance, DEHP is frequently used in food packaging and, thus, has been detected in various food samples, such as dairy products, meats, fish, and breads, among others. (Fasano et al., 2012; Erythropel et al., 2014; Cao et al., 2015). Tubing and storage bags containing DEHP and other plasticizers are frequently used in medical settings, and extensive leaching of the compound from this equipment has been observed as well (Erythropel et al., 2014; Gimeno et al., 2014). Leaching of these compounds from consumer and industrial products has led to the detection of these compounds and their metabolites in human (Heudorf et al., 2007; Chang et al., 2013) and environmental samples (Net et al., 2015; Gao and Wen, 2016).
Phthalate plasticizers make up over 90% of worldwide plasticizer production (Beauchesne et al., 2008) and their content in plastics is typically 20–40% (Clarke and Smith, 2011). The extensive use of these compounds in piping and consumer products has led to the detection of these compounds in the wastewater treatment (WWT) process, including wastewater effluent and final solids (Beauchesne et al., 2008; Dargnat et al., 2009; Clarke and Smith, 2011). High-molecular weight phthalate plasticizers have been demonstrated to predominantly adsorb to wastewater solids (Clara et al., 2010; Çifci et al., 2013; Tran et al., 2015a), with approximately 80% of DEHP [log Kow = 8.39 (Saini et al., 2016)] in the WWT process accumulating in sludges (Clara et al., 2010).
In the United States an estimated 60% of biosolids produced are land-applied for beneficial reuse (Lu et al., 2012), leading to concern over the introduction of toxic organic pollutants to the environment through the application of biosolids. A study concerning plasticizers in agricultural fields in France found the sum of nine phthalate plasticizers to be 407 ng/g in the surface soil horizon (0–20 cm) of an agricultural soil, with DEHP accounting for over 50% of the total (Tran et al., 2015a). In China, samples collected from agricultural soils in 123 different regions were analyzed for 15 phthalate plasticizer compounds. The mean sum of the plasticizers was determined to be 1,088 ng/g, again with DEHP demonstrating the highest concentrations of the compounds analyzed (Niu et al., 2014). Phthalate plasticizers in soils have been shown to transfer into vegetation (Sun et al., 2015; Zhao et al., 2015), leach into deeper soil horizons (Yager et al., 2014; Tran et al., 2015a), accumulate in earthworms (Kinney et al., 2010) and to migrate through water runoff from solid waste dumps (Arukwe et al., 2012).
Due to toxicity concerns and the ability of phthalate plasticizers to travel in the environment and into biota, it is important to understand how different WWT technologies influence concentrations of these compounds in biosolids before their land application. Given the desire of WWTPs within the United States to increase resource recovery throughout treatment (WEF, 2014), studying how different technologies that improve resource recovery, such as Cambi THP™, impact concentrations of organic pollutants is vital.
When used as a pretreatment for anaerobic digestion, the Cambi THP results in both increased solid reduction, as well as an increase in biogas production, a renewable resource, compared to anaerobic digestion treatment alone. However, despite its use since 1995, few studies have explored the influence of the Cambi THP in conjunction with anaerobic digestion (TH-AD) on concentrations of organic pollutants. In the only research conducted to date on the influence of a full-scale TH-AD treatment facility, Armstrong et al. (2017) observed that the ability of the process to degrade organic pollutants was very compound specific (Armstrong et al., 2017), indicating the need to further understand the impact that TH-AD treatment has on a variety of compounds.
This study focuses on the influence of the Cambi Thermal Hydrolysis Process™ (Cambi THP) in conjunction with anaerobic digestion (TH-AD) on concentrations of four common phthalate plasticizers in wastewater sludges and biosolids. The objectives of the present study are twofold as follows: (1) to understand the influence that individual stages in the TH-AD process have on concentrations of phthalate plasticizers and (2) compare concentrations of phthalate plasticizers in biosolids produced by the TH-AD process (Class A biosolids) to those in limed biosolids (Class B biosolids) produced at the same facility since the liming of biosolids is a treatment still frequently used in WWTPs located within the United States (NEBRA, 2007).
Materials and Methods
Target analytes
Sludge and biosolid samples were analyzed for the phthalate plasticizers: benzyl butyl phthalate (BBP), DEHP, DiNP, and DiDP. Compound structures and log Kow values are provided in Supplementary Table S1 of the Supplementary Data.
Sample collection and handling
Biosolids and sludge samples were collected from a municipal wastewater treatment plant (WWTP) located in the Mid-Atlantic, United States. The facility, which serves a population of over 2 million residents, treats an average of 1.14 million m3 of raw sewage daily (300 million gallons per day). The facility uses primary sedimentation, activated sludge, nitrification–denitrification, filtration, and disinfection for waste treatment. Sludge at the facility is currently treated using TH-AD (Fig. 1) to produce Exceptional Quality Class A biosolids, as designated by the United States Environmental Protection Agency (US EPA). Briefly, the TH-AD process consists of:

Diagram of Cambi THP™-Anaerobic Treatment Process.
(1) Centrifugation of primary and secondary solids, resulting in a sludge consisting of 15–19% dry solids.
(2) Preheating of sludge at 60–99°C in pulper.
(3) Hydrolysis of sludge under high heat (150–180°C) and high pressure (0.37–0.95 MPa) conditions.
(4) Rapid reduction of heat and pressure in flash tank to 70–115°C. Here the sludge consists of 8–12% total solids.
(5) Anaerobic digestion of sludge at 37°C for 22 days.
(6) Dewatering of sludge by belt presses.
Wastewater sludge was previously treated using liming (approximately 15% by weight) to produce Class B biosolids before the phaseout of the process in February 2015. Liming is still commonly used in most US facilities (NEBRA, 2007). Further details regarding past and present solid treatment at the study facility can be found elsewhere (Armstrong et al., 2017). Biosolids from this WWTP are land-applied on local agricultural fields as a soil amendment.
TH-AD in-line sampling
In October 2016, sludge samples were collected in-line at various locations throughout the TH-AD process, including postcentrifuge, Cambi THP input and effluent (post flash tank), anaerobic digestion, and final solids (Class A biosolids). Sampling locations are provided in Fig. 1. Samples were immediately transferred to the laboratory and stored at −20°C until analysis.
Biosolid sampling
Routine sampling of Class B biosolids from the WWTP occurred on a bimonthly basis beginning in 2005 and continuing until phaseout of this treatment process (liming of sludge) in 2015. The samples were collected from the treatment line, immediately after the liming process, and stored at −20°C until analysis. Routine sampling of Class A biosolids from the facility began in 2014 during start-up of the TH-AD treatment process and continues through present day. Samples were collected after TH-AD treatment and dewatering and stored at −20°C until analysis. A subset of the Class A and Class B biosolid samples collected during these sampling campaigns was used for this study.
Standards and reagents
DEHP (99.7%), DiNP (≥99%), DiDP (≥99%), BBP (98%), d4-DEHP (99.7%), and d4-BBP (98%) were acquired from Sigma Aldrich (St. Louis, MO). Solvents were purchased from Burdick and Jackson® (Morris Plains, NJ) and Fisher Scientific (Hampton, NJ) and were of ultra high performance liquid chromatography (UHPLC) grade. Laboratory-grade sand was procured from Fisher Scientific (Hampton, NJ).
Extraction method
Sludge and biosolids produced by TH-AD treatment contain a high volume of solubilized organics in the liquid faction. Because of this, samples were lyophilized and the solid and liquid faction of all samples were extracted and analyzed together. Compound extraction from lyophilized samples was achieved using a Dionex Accelerated Solvent Extraction (ASE) #300 system (Dionex Corporation, Sunnyvale, CA) according to a previously published method (Reid et al., 2009). Briefly, a solvent mixture of dichloromethane (DCM):acetone (50:50 v/v) was used for compound extraction at a temperature of 110°C and pressure of 1,500 psi. Three extraction sequences in total were performed. Extracts were cleaned up by the modification of an established method (Tran et al., 2015a). ASE extracts were evaporated gently under nitrogen at a temperature of 55°C and reconstituted in 2 mL of DCM. Extracts were then loaded onto HyperSep™ Florisil (1 g, 6 mL) solid phase extraction (SPE) cartridges (Thermo Fisher Scientific, Waltham, MA) and the eluates collected. The vials previously housing the ASE extracts were rinsed with 2 mL of DCM and the solvent was, again, loaded onto the SPE cartridges and the eluates collected. Compounds were eluted from the cartridges using 2 × 5 mL of hexane:diethyl ether (80:20 v/v). The combined eluates were evaporated under nitrogen at 55°C and reconstituted in 2 mL methanol (MeOH) for instrumental analysis.
Instrument analysis
Samples were analyzed for BBP, DEHP, DiNP, and DiDP using a Shimadzu Nexera X2 UHPLC system paired with a Shimadzu 8040 triple quadrupole mass spectrometer (MS/MS) (Shimadzu North America, Columbia, MD). A mobile phase of 5 mM of ammonium formate in MeOH and a Waters Acquity UPLC® HSS T3 column (1.8 μm, 2.1 × 100 mm) were utilized for compound separation. The mobile phase was run isocratically at a rate of 0.55 mL/min for 1.7 min. The MS was equipped with an electrospray ionization source in negative mode, and acquisition was achieved by multiple reaction monitoring. Further details regarding UHPLC-MS/MS settings are available in the Supplementary Data.
Quality assurance and quality control
Materials containing plastics were avoided during all sampling campaigns, and glass jars were used for sample storage. d4-DEHP and d4-BBP were used as surrogate standards, and, before extraction, all biosolids and sludge samples were spiked with 150 ng of each. All samples were extracted in duplicate. Extractions were performed in batches containing 12 samples or less, and each extraction batch included a blank consisting of laboratory-grade sand, a sample spiked with all four plasticizer compounds for the determination of recovery percentages. In instances where target analytes were detected in extraction blanks above the method detection limit (MDL), this value was subtracted from all samples within that extraction batch.
During instrumental analysis, a standard curve of six standards at concentrations of 50, 100, 250, 500, 1,000, and 2,500 ng/mL was run for each compound. Linearity correlations of the standard curve yielded r2 ≥ 0.99. Instrument stability was verified through injection of standards and MeOH blanks for every 10 samples. MDLs were determined using US EPA guidelines (US EPA, 1984). Average compound MDLs and recoveries ranged from 14.6–27.2 ng/L and 87.1–100.8%, respectively. Individual values are provided in Supplementary Table S2. GraphPad Prism 7 (GraphPad Software, Inc., San Diego, CA) was used for figure creation and statistical analysis of data.
Results and Discussion
Influence of TH-AD treatment
Analyses of plasticizer concentrations throughout the TH-AD process show concentrations of DEHP, DiNP, and DiDP increasing during anaerobic digestion (Fig. 2). Average DEHP concentrations were 29.2 ± 0.886 [standard error of the mean (SEM)] mg/kg post flash tank and 51.8 ± 2.17 mg/kg during anaerobic digestion. Similarly, DiNP concentrations post flash tank were 20.3 ± 0.114 mg/kg and 39.2 ± 4.30 mg/kg in anaerobic digestion. DiDP was detected post flash tank at 11.5 ± 0.405 mg/kg and 19.7 ± 1.93 mg/kg during anaerobic digestion. The increase in DEHP, DiNP, and DiDP between the post flash tank samples and anaerobic digestion samples was statistically significant for all three compounds [Tukey's multiple comparison test; p < 0.0001 (DEHP), p < 0.0001 (DiNP), p = 0.0355 (DiDP)].

Concentrations of DEHP, DiNP, DiDP, and BBP ( × 10) in Individual Stages of TH-AD Treatment. BBP concentrations were multiplied by 10 for ease of viewing. (*designated concentrations are statistically different than those in the previous treatment step; error bars are standard error of the mean, n = 2). BBP, benzyl butyl phthalate; DEHP, bis(2-ethylhexyl) phthalate; DiDP, diisodecyl phthalate; DiNP, diisononyl phthalate.
Results from this study indicate that concentrations of DEHP, DiNP, and DiDP were not reduced during treatment. This observation is consistent with studies focusing on the impact of anaerobic digestion on phthalate plasticizers. For instance, DEHP in landfill waste incubated under anaerobic conditions was shown to degrade only 15% after a 278-day period (Ejlertsson et al., 1996). In addition, microcosms run under anaerobic methanogenic conditions with BBP-degrading enrichment culture demonstrated only an 8% decrease in DEHP concentrations after ∼90 days. The authors concluded that phthalate plasticizers with low solubility were more recalcitrant and that it may be due to the three-dimensional structure of the hydrophobic moieties (Ejlertsson et al., 1997). Given that the retention time of the anaerobic digesters at the study facility is ∼22 days, it is likely that there was not a sufficient amount of time for DEHP degradation to occur. This is consistent with the observation in a previous study that DEHP is not removed during anaerobic digestion of wastewater sludge (Çifci et al., 2013). While little information exists on the degradation of DiNP and DiDP under anaerobic conditions, Lertsirisopon et al. (2006) observed that in natural sediment microcosms run under anaerobic condition, approximately only 10% of DiNP was degraded after 90 days—less than what was observed for DEHP (Lertsirisopon et al., 2006). DiDP has a lower solubility and higher log Kow than DEHP and DiNP, indicating that substantial degradation during anaerobic digestion is unlikely due to decreased bioavailability, based on observations regarding the fate of DEHP and DiNP (Tran et al., 2015b). In a previous study of antimicrobials in the TH-AD process, Armstrong et al. (2017) noted that triclosan and two of its transformation compounds were not degraded but rather, as observed in this study, concentrations increased during the AD stage of treatment. This was attributed to the solid reduction of the anaerobic digestion process, which essentially concentrated the compounds on the remaining solids (Armstrong et al., 2017).
Conversely, concentrations of BBP appeared to increase during the thermal hydrolysis treatment stage and decrease again during anaerobic digestion (Fig. 2). While the increase of BBP during TH and decrease during AD were not statistically significant [Tukey's multiple comparison test; p = 0.995 (TH increase), p = 0.999 (AD decrease)], it is still important to note. The increase in BBP during TH treatment could not be explained, but BBP has been shown to be degradable under anaerobic conditions, which may explain the decrease in concentrations during AD. Ejlertsson et al. (1997) found that BBP was fully degraded in anaerobic methanogenic microcosms after approximately 30 days (Ejlertsson et al., 1997). BBP in landfill waste was degraded by 70% over a 278-day period when incubated under anaerobic conditions (Ejlertsson et al., 1996).
Comparison of plasticizers in Class A and Class B biosolids
Overall, concentrations of DEHP, DiNP, DiDP, and BBP in Class A biosolids were higher than those in Class B biosolids. Concentrations of DEHP in Class A biosolids produced by the TH-AD ranged from 54.3 to 87.5 mg/kg with an overall average of 66.7 mg/kg (SEM = 2.47 mg/kg). Concentrations in the limed Class B biosolids ranged from 3.28 to 50.0 mg/kg with an overall average of 25.0 (SEM = 3.78) mg/kg. Differences in average concentrations of DEHP between the two biosolid classifications were statistically different (Kolmogorov–Smirnov test, p < 0.0001). DEHP values in Class A and Class B biosolids are provided in Fig. 3a. Concentrations of DEHP in Class A and Class B biosolids are within range of those from other studies focusing on sewage sludge (Beauchesne et al., 2008; Çifci et al., 2013; Net et al., 2015). While the US EPA has not issued maximum concentrations for organic pollutants in biosolids, concentrations in Class A and Class B biosolids from this study were below the 100 mg/kg proposed, and later withdrawn, by the European Commission. However, those associated with Class A biosolids were higher than the 50 mg/kg instituted by Denmark (Smith, 2009).
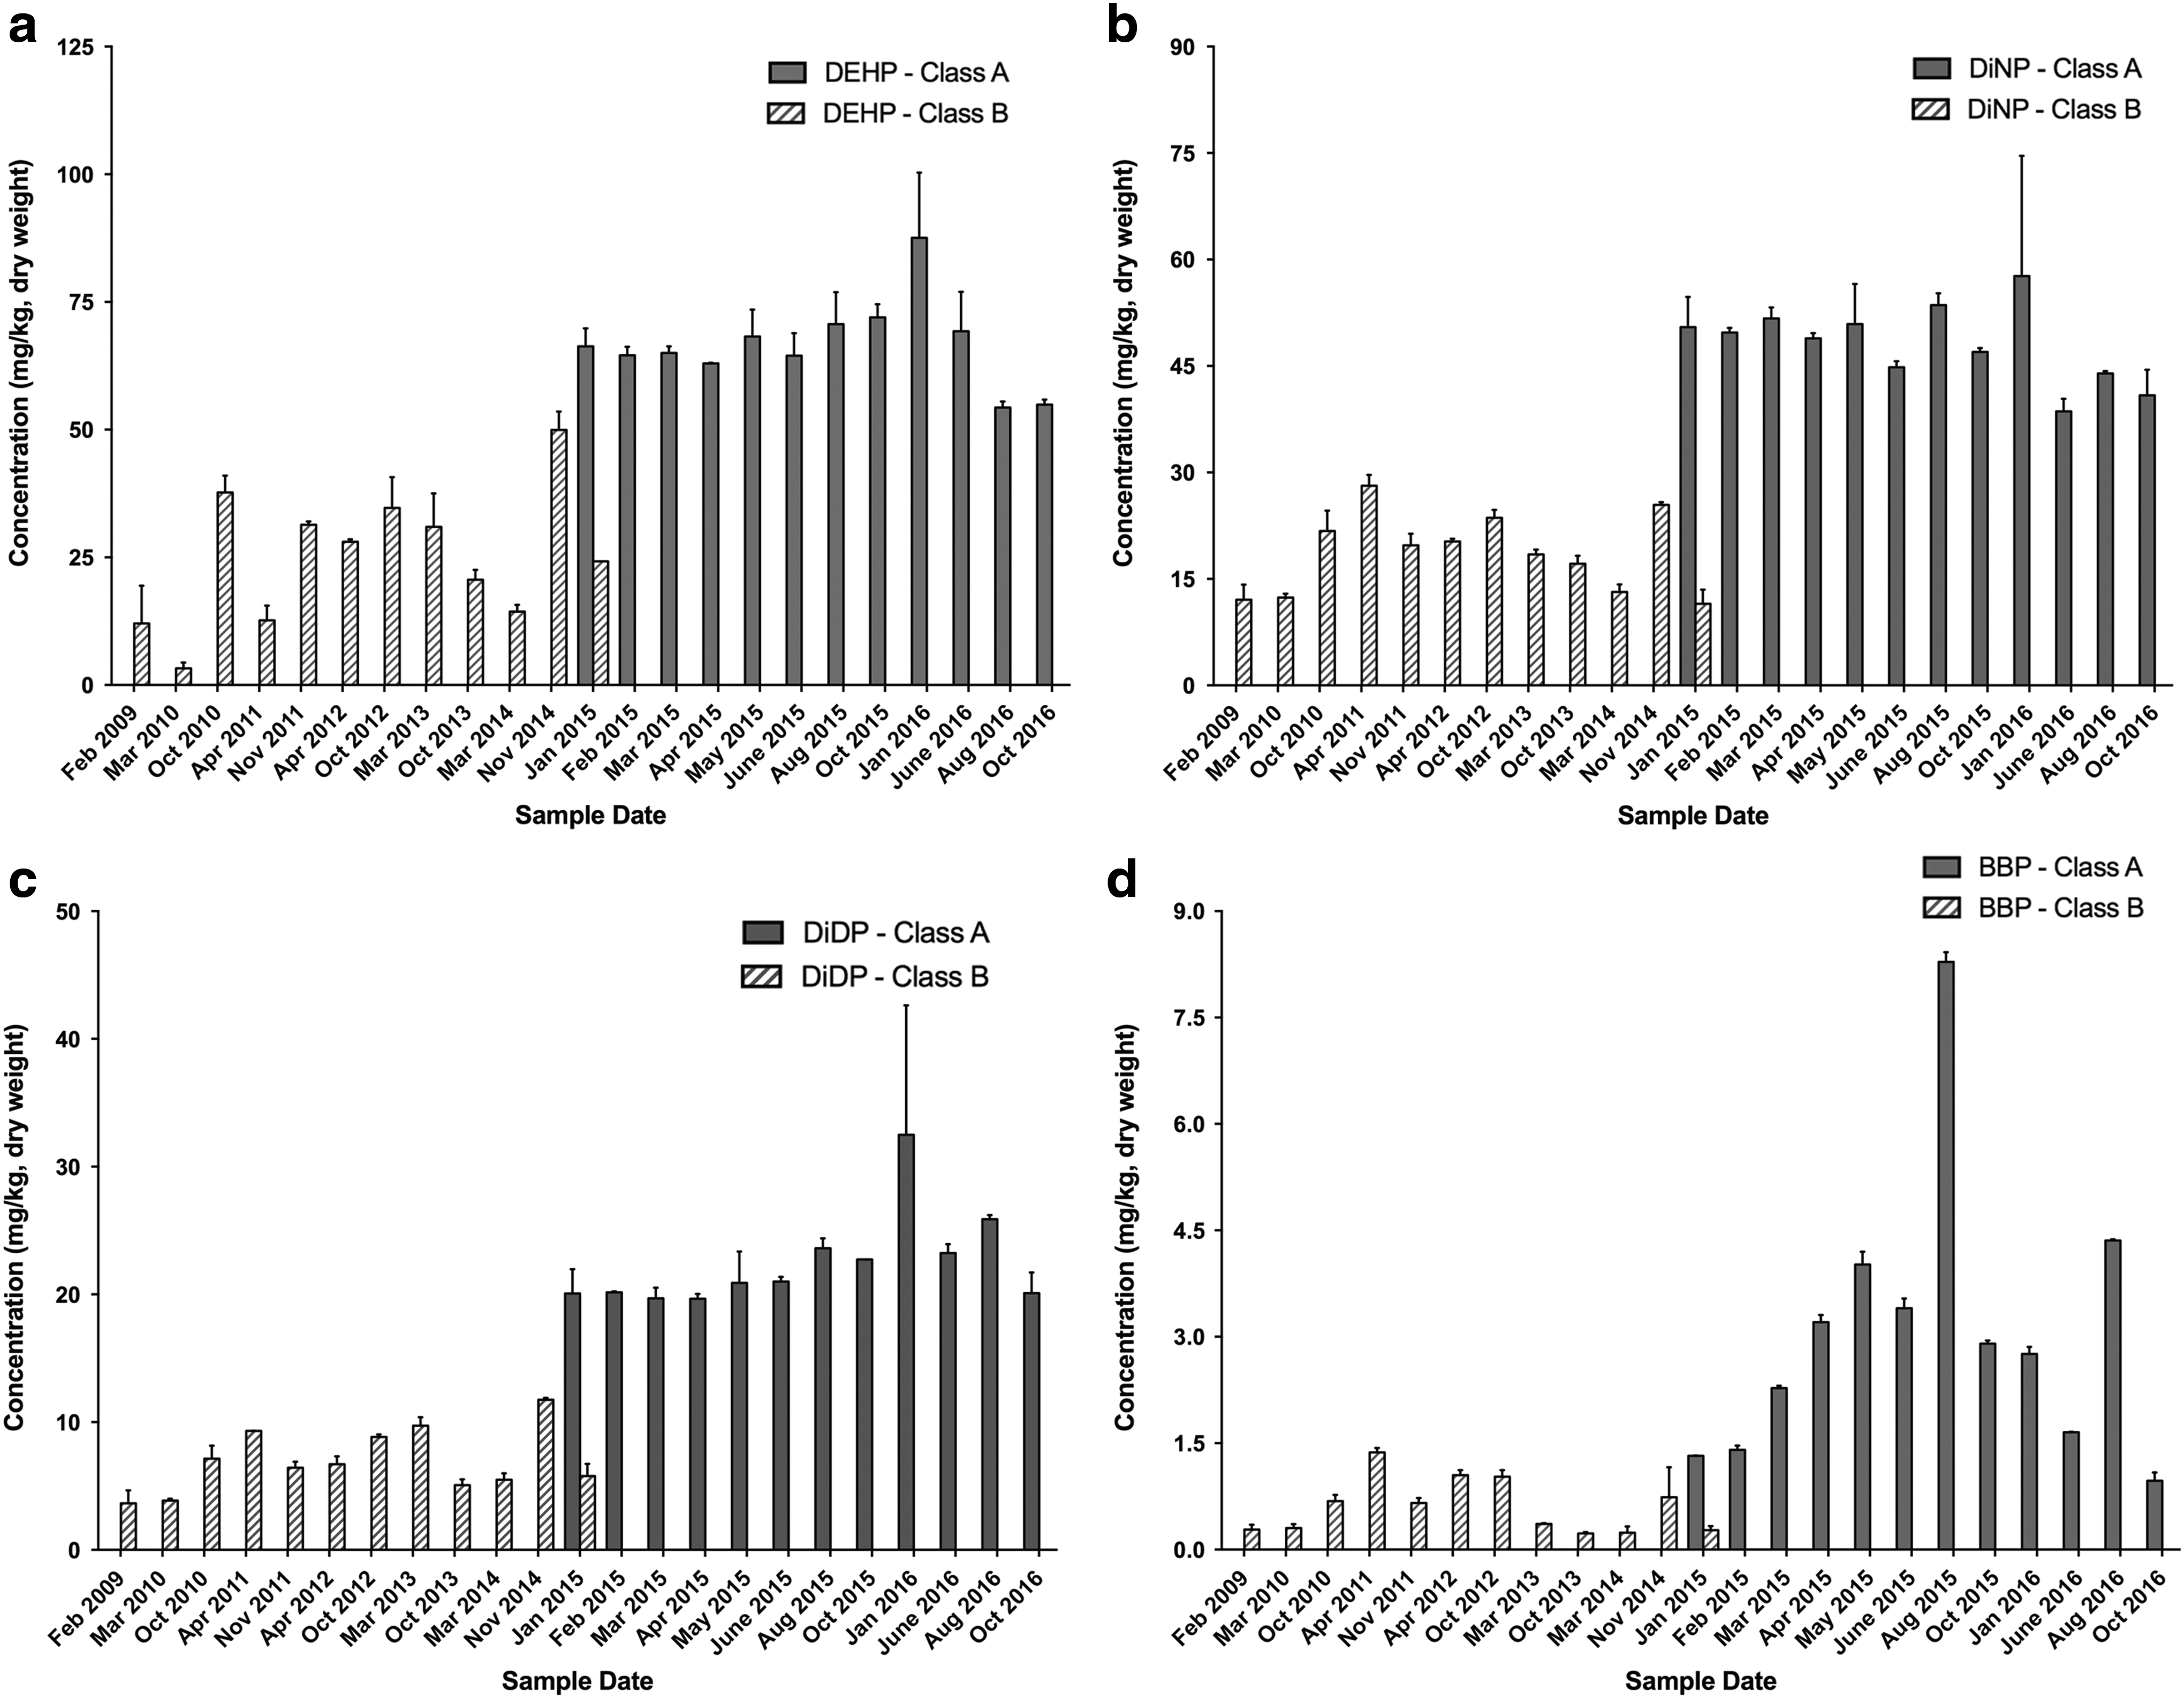
Concentrations of
The overall average DiNP concentration in Class A biosolids was 48.2 (SEM = 1.56) mg/kg (range of 38.6 to 57.7 mg/kg), while the overall average in Class B biosolids was 18.6 (SEM = 1.60) mg/kg (range of 11.5 to 28.1 mg/kg) (Fig. 3b). Concentrations of DiNP in Class A biosolids were statistically higher than those in Class B biosolids (Kolmogorov–Smirnov test, p < 0.0001). A previous study of DiNP in sludge from a WWTP with secondary treatment and a WWTP with tertiary treatment found concentrations to range from 2.60 to 31.3 mg/kg and below detection limit to 37.1 mg/kg, respectively (Reid et al., 2009). DiNP in sludge samples collected from seven Swedish WWTPs ranged from 21 to 78 mg/kg (Olofsson et al., 2013). Concentrations of DiNP biosolids from the present study are within these ranges.
DiDP concentrations (Fig. 3c) ranged from 19.7 to 32.5 mg/kg in Class A biosolids and 3.64 to 11.7 mg/kg in Class B biosolids. Overall averages in Class A and Class B biosolids were 22.5 (SEM = 1.07) mg/kg and 6.98 (SEM = 0.717) mg/kg, respectively. Again, concentrations were significantly higher in Class A biosolids compared to Class B biosolids (Kolmogorov–Smirnov test, p < 0.0001). However, as demonstrated with DEHP and DiNP, these concentrations are in accordance with those from other WWTPs (Olofsson et al., 2013).
Concentrations of BBP in Class A biosolids ranged from 0.969 to 8.28 mg/kg with an overall average of 3.05 mg/kg (SEM = 0.570 mg/kg). Concentrations in the limed Class B biosolids ranged from 0.229 to 1.37 mg/kg with an overall average of 0.601 (SEM = 0.111) mg/kg. Differences in average concentrations of BBP between the two biosolid classifications were statistically different (Kolmogorov–Smirnov test, p = 0.0005). BBP values in Class A and Class B biosolids are provided in Fig. 3d. Concentrations from Turkish WWTPs had sludges with BBP concentrations ranging from 2.8 to 6.2 mg/kg (Çifci et al., 2013). Class B biosolids from the present study possessed BBP concentrations that were lower than this range, while BBP concentrations in Class A biosolids were within or above this range.
These results indicate that utilization of the TH-AD resulted in higher concentrations of the four phthalate plasticizers in biosolids compared to the liming process. As indicated in Figure 2, an increase occurs during the anaerobic digestion process for DEHP, DiNP, and DiDP. In contrast, despite the difference in BBP concentrations within Class A and Class B biosolids, levels of BBP did not change significantly throughout the TH-AD process. Overall, this implies that the 4 phthalate plasticizers studied did not degrade during TH-AD treatment.
One explanation for this difference between the two biosolid types is the combination of solid reduction that occurs during anaerobic digestion of the TH-AD process and addition of lime to produce the Class B biosolids. To produce Class B biosolids, lime was applied to sludge at a rate of 15–20% on a dry weight basis. Based on processing loads, this percentage could vary between 10–25%. During the anaerobic digestion stage of TH-AD treatment, solids are reduced by 60–70%, a higher reduction than conventional AD due to the TH pretreatment (Foladori et al., 2010). The average concentrations of each target phthalate plasticizer in Class A biosolids were compared to concentrations in Class B biosolids adjusted for an 80% change in solids (15% for liming and 65% for loss of solids during AD treatment) and are provided in Fig. 4. For all compounds, concentrations in Class A biosolids were significantly higher than the adjusted Class B concentrations (multiple t-tests; Holm–Sidak method; p < 0.01). This demonstrates that differences in concentrations of DEHP, DiNP, DiDP, and BBP between Class A and Class B biosolids were not solely due to liming dilutions and/or solid reduction.
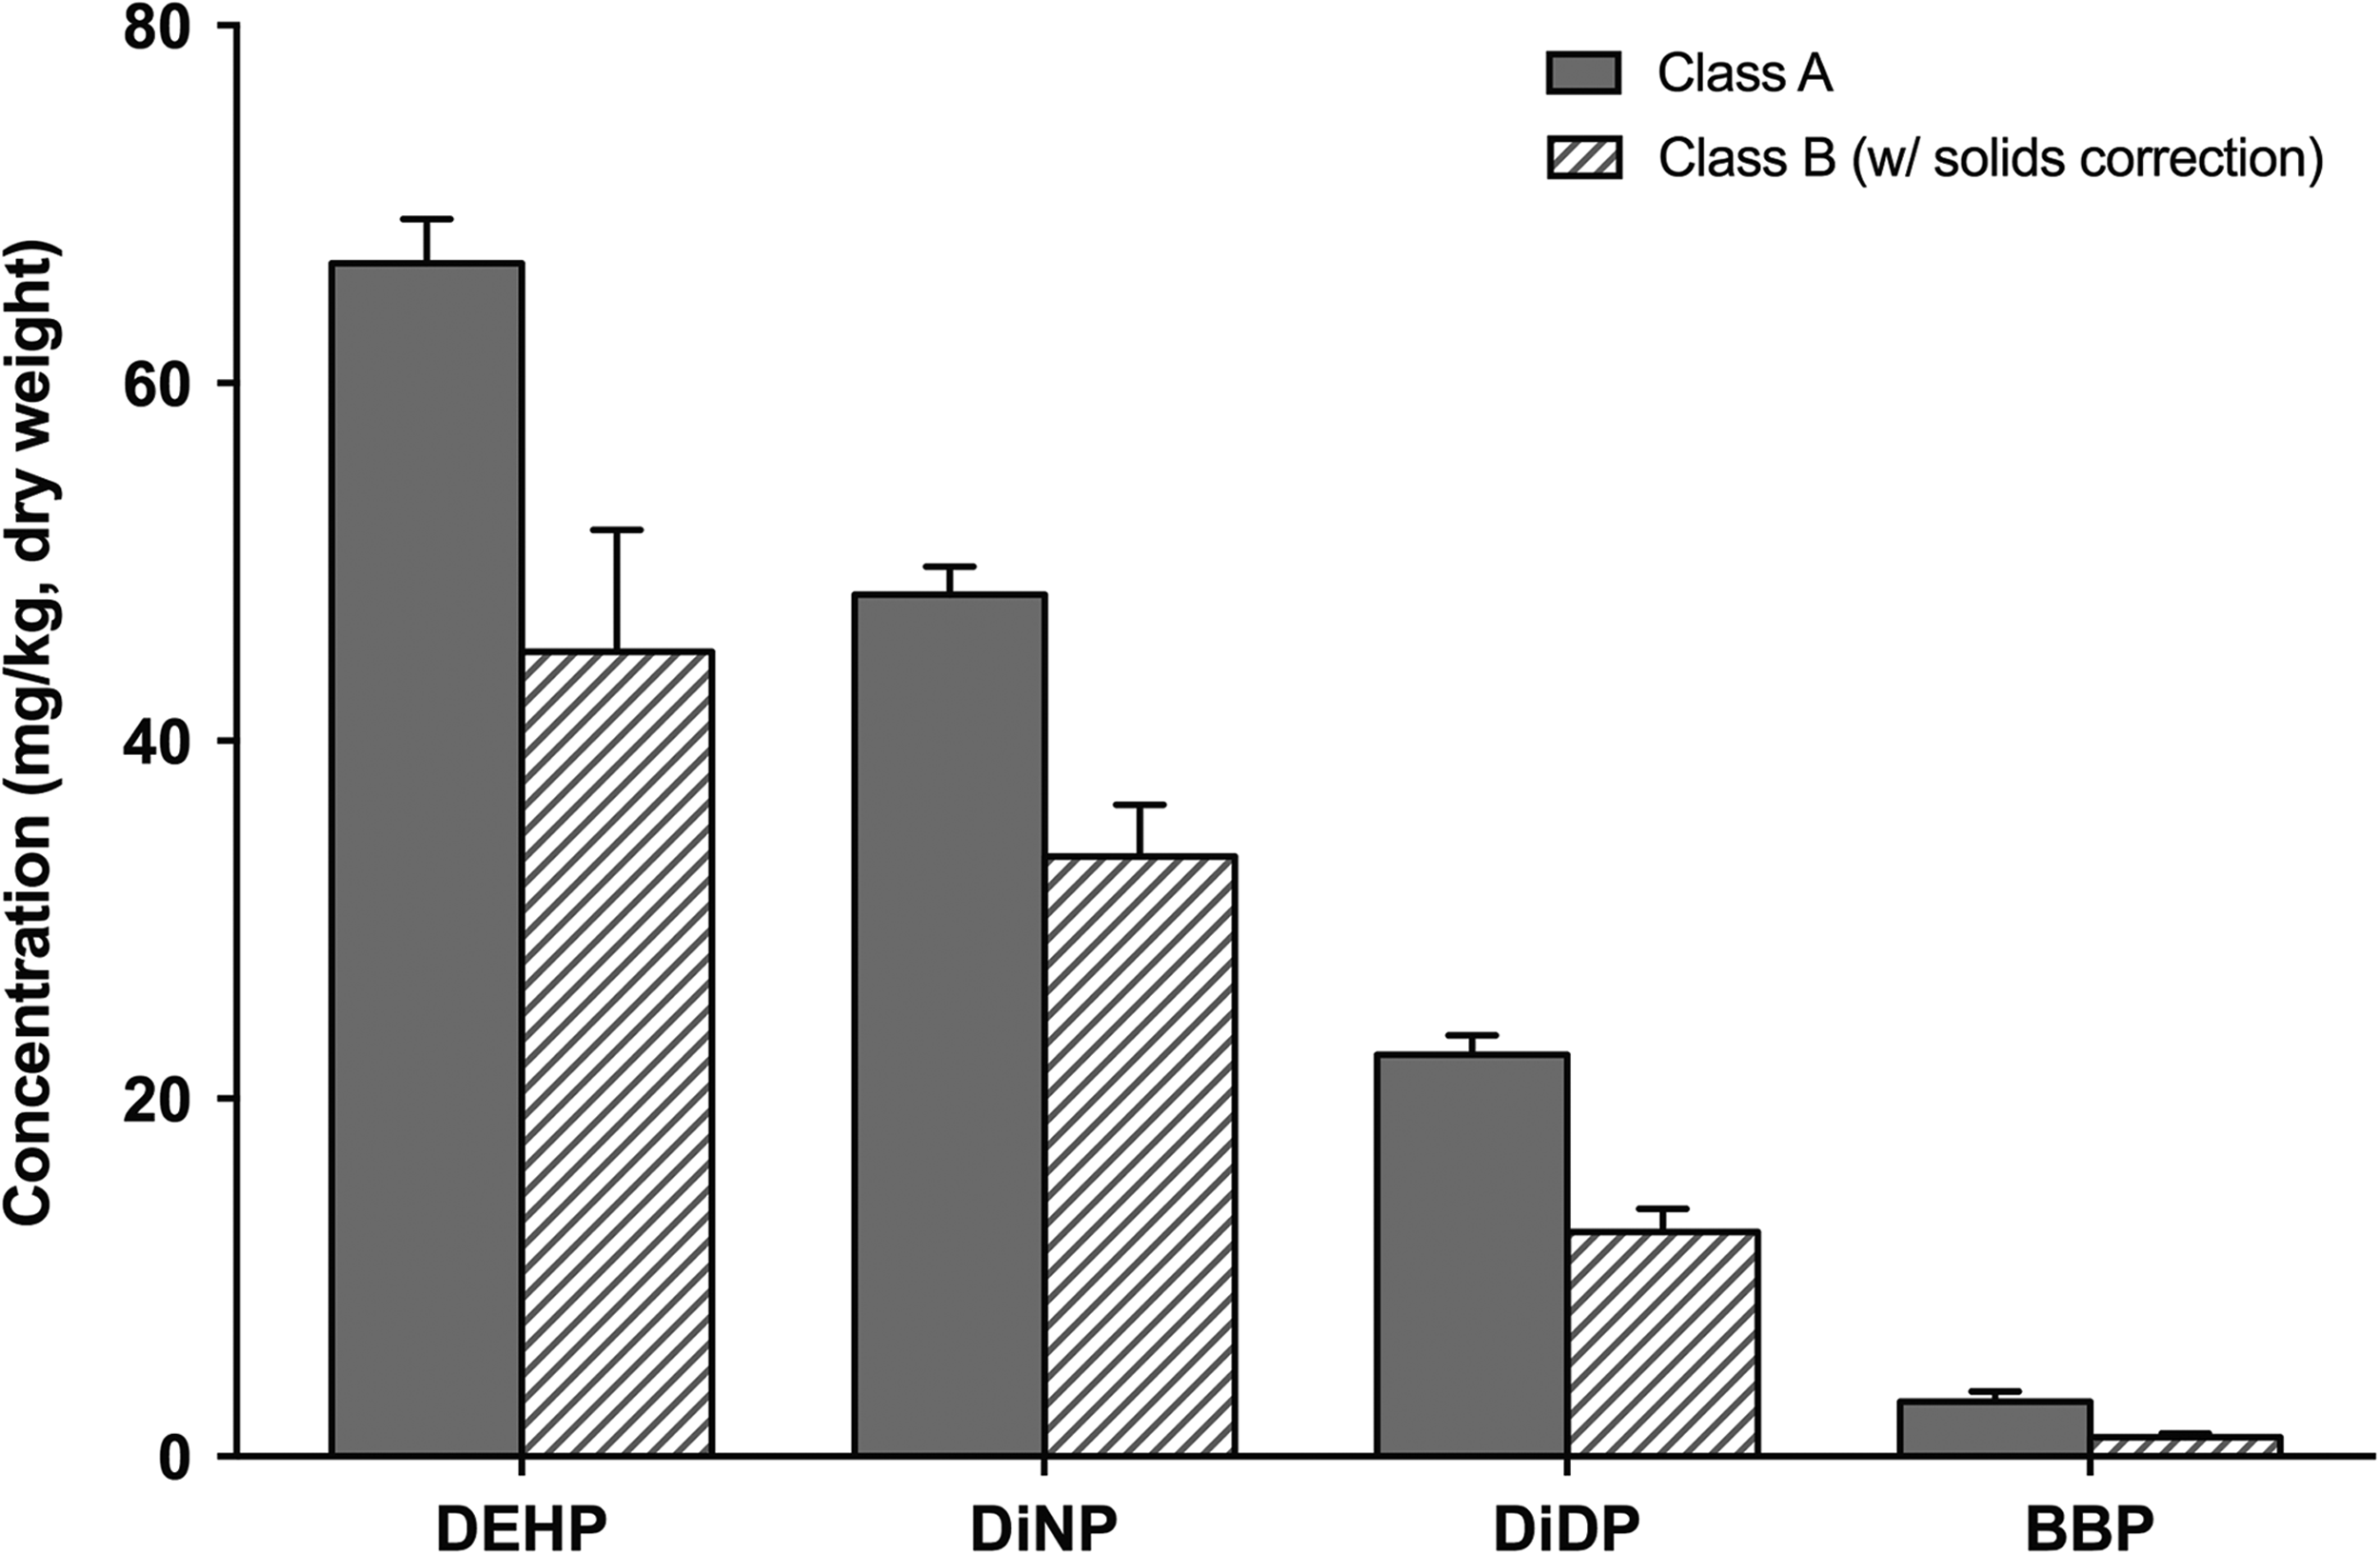
Concentrations of Phthalate Plasticizers in Class A Biosolids and Class B Biosolids (Corrected for Solids Concentration Losses) (error bars represent the standard error of the mean).
As discussed in the Influence of TH-AD treatment section, compounds such as DEHP and DiNP degrade very little during anaerobic digestion. However, unlike what was noted in this study, significant increases in concentrations of these compounds during anaerobic treatment were not observed in previous studies. BBP was shown to be degradable under anaerobic conditions but, again, no explanation or observations of increases in BBP were seen in the literature. One possible explanation for the difference in compound concentrations between treatment technologies is deconjugation of phthalate plasticizer metabolites. Research has indicated that when phthalate plasticizers are consumed and metabolized by the human body they can form conjugates, which can be excreted into the WWT system (Blount et al., 2000; Silva et al., 2006; Kurata et al., 2012; Kransler et al., 2013). The transformation of conjugated pharmaceuticals back to the original compound (deconjugation) has been demonstrated to occur during WWT (Badia-Fabregat et al., 2015; Tuc et al., 2017). Further research would have to be conducted to confirm whether deconjugation is a viable explanation for the observations of the current study.
Another reason for the difference in phthalate plasticizer concentrations between Class A and Class B biosolids may be due to the hydrolysis of these compounds due to the liming of sludge. Previous research has indicated that phthalate plasticizers may be hydrolyzed to monoester and diacid products in aqueous samples under alkaline conditions, with hydrolysis rates decreasing with an increase in chain length (Wolfe et al., 1980; Staples et al., 1997). Given that after the liming process sludge pH in Class B biosolids is ∼12, this may be an explanation for the variation in concentrations between the two biosolid types studied. However, estimated hydrolysis half-lives for phthalate plasticizers can be quite high (Staples et al., 1997), indicating that this process may only be a partial explanation for concentration differences—further research exploring hydrolysis in sludge through liming would need to be conducted.
Predicted concentrations of phthalate plasticizers in soil
Given that the land-application of biosolids to agricultural fields would constitute a major source of phthalate plasticizers to the soils, the predicted environmental concentration (PEC) was calculated for DEHP, DiNP, DiDP, and BBP for the application of the two different types of biosolids. The PEC for each compound and biosolid type was calculated using:
Initial soil concentrations (Csoil) were assumed to be zero, the concentration of the phthalate plasticizer in the biosolids (Cbiosolids) was assumed to be the average concentration outlined in Comparison of plasticizers in Class A and Class B biosolids section and provided in Table 1, the density (D) was assumed as 1.35 kg/cm3 (Andrade et al., 2010; Lozano et al., 2012), the soil depth (SD) was assumed as 7.6 cm to represent no till biosolids application (Andrade et al., 2010), and CF is a unit conversion factor. The application rate (AR) was based on the average rate used for application of biosolids from the study WWTP onto agricultural fields. The ARs used are provided in Table 1 and differ between Class A and Class B biosolids due to higher nutrient concentrations in Class A biosolids (Armstrong et al., 2017).
BBP, benzyl butyl phthalate; DEHP, bis(2-ethylhexyl) phthalate; DiDP, diisodecyl phthalate; DiNP, diisononyl phthalate; PEC, predicted environmental concentration.
Most toxicity studies regarding phthalate plasticizers in soil ecosystems revolve around DEHP (of those analyzed in the present study). Hulzebos et al. (1993) determined the DEHP EC50 for the lettuce Lactuca sativa to be >1,000 μg/g (Hulzebos et al., 1993). A study conducted on juvenile and adult collembolans (Folsomia fimetaria) found that juvenile mortality, growth, and development of the organisms were unaffected at DEHP concentrations up to 5,000 mg/kg (Jensen et al., 2001). In addition, Cartwright et al. (2000) observed that soil microbial populations were unaffected by DEHP at concentrations of 0.1 mg/g (representative on nonindustrial environmental) and 100 mg/g (representative of a spill environment) (Cartwright et al., 2000). However, Hu et al. (2005) noted that uptake of the compound by earthworms was rapid during the initial 10-day contact period and estimated the biota-to-soil accumulation factor to be 0.17 ± 0.03 in soils with a DEHP concentration of 5 mg/kg (Hu et al., 2005). Furthermore, an environmental risk limit emphasizing endocrine disrupting properties for DEHP was determined to be 1 mg/kg for fresh soil and sediments (van Wezel et al., 2000). These determined toxicity values, and the environmental risk limit of 1 mg/kg is all above the PEC for DEHP in soils applied with Class A or Class B biosolids. Further studies regarding the impact of DEHP on ecological risks, as well as the impact of other phthalate plasticizers, are needed.
Conclusions
Concentrations of DEHP, DiNP, and DiDP in wastewater sludge increased significantly during the anaerobic digestion stage of the TH-AD process. No change in concentration was observed during the thermal hydrolysis stage of treatment for these three compounds. An increase in BBP was observed during thermal hydrolysis with a decrease in concentrations occurring during anaerobic digestion. These changes in BBP concentrations during TH-AD, however, were not statistically significant. Implementation of the TH-AD process led to higher concentrations of DEHP, DiNP, DiDP, and BBP in biosolids, when comparing Class A and Class B biosolids from the same facility. Adjusting concentrations for solid reduction during anaerobic digestion and dilution through liming did not fully account for the differences in concentrations of phthalate plasticizers in Class A and Class B biosolids. Further research should be conducted to determine the reason for differences in plasticizer concentrations between Class A and Class B biosolids. Calculation of PECs for all 4 compounds indicate that concentrations in soils land-applied with biosolids may not be above toxic levels, but more information regarding the ecological impact of these compounds needs to be explored.
Footnotes
Acknowledgments
This research was partially funded by the District of Columbia Water and Sewer Authority (DC Water) and in kind contributions by the United States Department of Agriculture–Agricultural Research Service (USDA-ARS).
Author Disclosure Statement
The authors report no conflicts of interest.
References
Supplementary Material
Please find the following supplemental material available below.
For Open Access articles published under a Creative Commons License, all supplemental material carries the same license as the article it is associated with.
For non-Open Access articles published, all supplemental material carries a non-exclusive license, and permission requests for re-use of supplemental material or any part of supplemental material shall be sent directly to the copyright owner as specified in the copyright notice associated with the article.