
Abstract
Abstract
For safe land application, biosolids are stabilized and treated to reduce pathogen levels. Fecal indicator levels are usually measured with culture-based methods, which are time consuming and laborious. Thus, there is a need for alternative indicators that could expedite the classification of biosolids. This could be accomplished through the quantification of humic acids (HAs) as a surrogate, since the natural degradation of organic matter simultaneously breaks down and mineralizes, while also synthesizing humus, which includes the stable polyphenolics humic and fulvic acids and humin. Therefore, this study aimed to investigate whether HAs and fecal bacteria exhibit an inverse correlation, supporting the notion that the level of HAs could potentially serve as an indicator for stabilized biosolids. This entailed using laboratory-scale anaerobic digesters at two temperatures (25°C and 37°C), with levels of pathogenic (Salmonella spp.) and fecal indicator bacteria (Escherichia coli, Enterococci, and Fecal Coliforms) determined, along with extracted HAs being quantified by chemical luminescence (acidic Ce(IV) and rhodamine 6G) over a 34-day study period. Results suggest that an inverse correlation exists between levels of HA and the bacteria studied, with a Pearson correlation coefficient of at least −0.85 for all three fecal bacteria and the extracted HAs. The inverse correlation was stronger at greater temperatures as the 37°C digesters had reduced levels of microbes and increased levels of HA compared with the 25°C digesters. These findings support the idea that humic acids could potentially be used as a chemical indicator for biosolids stabilization.
Introduction
B
The U.S. Environmental Protection Agency (EPA) Part 503 Biosolids Rules (US EPA, 1999) provide procedures, stipulating the use of specific temperatures and times for treatment (i.e., aerobic or anaerobic), along with maximum allowable levels of indicator organisms or pathogens permissible in the stabilized product (US EPA, 1999). Although these guidelines often result in stabilized biosolids and significant microbial inactivation, the quantification of microbes is required to ensure the quality and determine the class of biosolids (i.e., degree of stabilization). This necessary step, particularly for Class A biosolids, can be expensive and time intensive demonstrated by the 5 days required for Salmonella spp., and the 28 days required for both enteroviruses and helminth ova (Carroll and Long, 2016). Thus, there is a need for an alternative indicator to determine the class of biosolids and potentially the degree of stabilization.
Biosolids stabilization involves degradation and dissimilation of labile biomacromolecules (proteins, lipids, carbohydrates, and nucleic acids), and formation of various products, including new microbial biomass, various gases (i.e., CH4, CO2, H2S), volatile fatty acids (VFAs), and humus (Metcalf and Eddy, 2003). In addition, this process often results in the formation of microbial aggregates, such as flocs, biofilms, and granules; these microbial aggregates generally consist of extracellular polymeric substances (EPS), inorganic particles, and multivalent cations (Sutherland, 2001; Avella et al., 2010). The EPS are of special interest, since they are formed from the degradation of organic matter and primarily consist of biomacromolecules, humic substances, and other polymeric compounds (Frølund et al., 1995; Sheng et al., 2010). EPS formation is generally considered to be the result of high-molecular-weight secretions from microbes, along with other processes that generate or result in the formation of polymeric and monomeric components, such as the degradation of organic compounds or products of cellular lysis.
Humic substances have been described as a fraction of organic matter in soils and compost that consist of organic materials of natural origin in advanced stages of decomposition, whether in soils, compost, digesters, or peat bogs, and whether plant or animal in nature (Waksman, 1952). Humic substances are typically divided into three fractions, humin, humic, and fulvic acids, and are often identified by their color and solubility (acidic or basic; Chiou et al., 1986). Their formation is thought to occur from condensation polymerization reactions, amino acid–sugar interactions, and animal/plant decay, which form a new complex substrate (Qu et al., 2012). Therefore, since this new complex substrate (i.e., humic substances) forms, to some degree, during the degradation of plant and animal matter, it is plausible that humic substances could act as an indicator for the degree of stabilization within biological residuals; particularly if they could be extracted and quantified in a rapid fashion.
The extraction of humic substances from the EPS of biosolids can be accomplished by various methods, and in relatively short periods of time (D'Abzac et al., 2010). Extraction methods are typically either physical (e.g., centrifugation, sonication, heating, cation exchange resin) or chemical (e.g., ethylenediaminetetraacetic acid, formaldehyde and heat, formaldehyde and NaOH, and ethanol) techniques, but there is no standard procedure for extraction (Dignac et al., 1998; Liu and Fang, 2002; Rättö et al., 2006; D'Abzac et al., 2010). As such, various methods must be selected, optimized, and compared for each specific substrate (i.e., biosolids), with the most appropriate method being chosen for future analyses.
Methods used for quantifying EPS fractions vary in the published literature. EPS polysaccharides are generally quantified with the anthrone or phenol–sulfuric acid methods, whereas protein content is measured with the Lowry or Bradford methods. However, humic substances are more complex and have an undefined composition and structure, making the measurement of their content more difficult (Shen et al., 2012). There are various methods, utilizing spectroscopic techniques and fluorescence, which attempt to quantify, characterize, and determine the complexity of humic substances. The most common methods utilize UV-Vis, which measures humic substance absorbance—thought to be the result of the substances' aromaticity—that occurs from 200 to 800 nm (Abbt-Braun et al., 2004). Another spectroscopic method uses absorbance ratios in the ranges of 200:300 nm (E2/E3), 200:400 nm (E2/E4), and 400:600 nm (E4/E6), and have been used to characterize natural organic matter and reflect content of polyphenolics in aquatic environments (Filella, 2010). These spectroscopic methods provide an estimate of the aromaticity percentage and molecular mass, and are thought to be useful for tracking variations in organic matter origins and type within a system (Filella, 2010). Fluorescence spectroscopy is also commonly used for the study of humic substances, and is thought to have greater sensitivity.
Development of a method to quantify humic substances in their entirety is challenging (Filella, 2010). However, the ability to quantify the core and backbone of humic substances, which consists of phenolic and aromatic moieties, could provide information on relative concentrations of humic substances in a sample and provide ample information on their levels within various organic matrices. Chemical luminescence (CL) has recently seen great use in the study of humic substances—specifically humic acids (HAs) within aquatic environments—and these methods have the potential to be applied to the quantification of extracted HAs from biosolids. This is the result of CL ability to measure various analytes, specifically those containing phenols, carbonyl, nitrogen, and sulfur-containing compounds, which humic substances contain as structural components. This was demonstrated by Cheng et al. (2007), who utilized CL and an acidic cerium (Ce(IV)) solution for the detection of HA in water. They found a linear relationship with HA (0.03–10.0 μg/mL), and tested the method in tap water, spring water, and river water, finding HA recoveries of 90.0–110.0% (Cheng et al., 2007). Cui et al. (2006) investigated 53 organic compounds, using acidic Ce(IV) and the fluorophore rhodamine 6G, and found that 32 of the 53 compounds investigated (all phenolic compounds) enhanced the CL signal. These methods were combined by Qu et al. (2012), who investigated a Ce(IV)–rhodamine 6G complex, for the determination of HA in environmental waters using CL, which illustrated the detection of HA in natural waters, with a detection limit of 0.1–35 mg/L (D'Abzac et al., 2010). These studies demonstrate the ability of a CL-based method, using an acidic Ce(IV)–rhodamine 6G complex, to measure HA with relatively high sensitivity and accuracy; illustrating the potential for its use in extracted biosolids samples.
Therefore, quantifying both fecal bacteria and humic substances during the stabilization of biosolids could provide insight on whether a potential correlation exists. This is based on the hypothesis that if a chemical indicator exists that increases over time, compared with the decreasing bacteria that chemical indicator (i.e., humic substances) could act as a potential predictor for biosolids stabilization. Furthermore, if the inverse relationship was to exist, these two indicators should be similar when anaerobically digested at two different temperatures supporting the notion that they are both linked to the degree of biosolids stabilization. Thus, the objectives of this study were to (1) compare different EPS extraction methods for HAs from anaerobically digested biosolids; (2) quantify both extracted HAs using CL (acidic Ce(IV)–rhodamine 6G complex) and fecal bacteria over time from the anaerobically digested biosolids; and (3) at two digestion temperatures (37°C and 25°C) compare the levels of humic substances and bacteria with statistical tests to determine if an inverse correlation exists.
Materials and Methods
Feedstock
Raw cattle manure was collected as substrate from Waterman Dairy Farm at The Ohio State University. The manure was collected fresh from the feeding lot pads, and diluted with water (1 water:2 manure). The inoculum was obtained from a completely mixed anaerobic digester in Columbus, Ohio that digested both agricultural and residential waste at mesophilic temperatures and was operated by Quasar Energy Group (Columbus, OH). Immediately after collection of both manure and inoculum, volatile solid levels (VS) were measured. During these analyses (lasting 24 h), the manure and inoculum were stored at 4°C. Upon VS determination, a 1:1 VS mixture of manure:inoculum was prepared and distributed into batch digesters; providing a diverse microbial community for anaerobic digestion (e.g., inoculum) and a complex organic waste stream with elevated target bacterium (e.g., manure).
Experimental set-up and procedure
Batch digesters were 150 mL Nalgene screw cap bottles with a working volume of 100 mL. The digesters had one port, to which a stop-cock valve was attached for the release of biogas. After being filled with the 1:1 mixture, the digesters were spiked with Salmonella (enterica) typhimurium (ATCC 14028; grown overnight on tryptic soy broth [TSB], rinsed 3 × with sterile phosphate-buffered saline (PBS), then concentrated and resuspended in PBS) and flushed with 99.9% N2 and then sealed. They were placed in thermally controlled water baths, half at 25°C ± 0.2°C and the other half at 37°C ± 0.2°C (Thermo Scientific, Water Bath), during the study period. Samples were taken at, 0, 0.5, 1, 3, 5, 8, 12, 16, 20, 26, and 34 days for both temperatures. All sampling was done in duplicate (n = 2) for each temperature, with two batch digesters being opened, sampled, and discarded at each time point, for a total of 40 batch digesters.
Chemical analysis
Reagents
HA (salt sodium, technique grade) was purchased from Sigma-Aldrich (St. Louis, MO), whereas Cerium (IV) sulfate tetrahydrate (Ce(IV)) and rhodamine 6G (99%) were both purchased from ACROS Organics (Geel, Belgium). Sulfuric acid, hydrochloric acid, and sodium hydroxide were purchased from Fisher Scientific (Waltham, MA) and were used to make dilute solutions for subsequent use during the extraction and quantification. The working Ce (IV) solution was prepared daily in sulfuric acid (0.5 N) before use (Cheng et al., 2007). The rhodamine 6G was prepared as a stock solution (DI water) and stored at room temperature (Qu et al., 2012). Standard solutions of HAs were prepared daily by further dilution of its stock solution (1 g/L in 0.1 N NaOH). The stock solution was stored at 4°C. The dilution series was done in 0.1 N NaOH solutions for use in determining the standard curve. Ethylenediaminetetraacetic acid ([EDTA] 0.5 M) and formaldehyde (37%) solutions were purchased from Fisher BioReagents.
Extraction of humic acids
HAs from the replicate batch-digested biosolids were extracted using four methods. Figure 1 details the procedure for each of the extraction processes. The control utilized PBS as a sole means of extraction. Four grams of homogenized biosolids were added to 10 mL of PBS, mixed with a tube rotator (Scientific Equipment Products, MD) for 1 min, and then centrifuged for 20 min at 5,000 RPM. The supernatant was filtered through a 0.2 μm pore-size nitrocellulose membrane, and then acidified to a pH of 2 with 1.0 N HCl. Precipitation was aided with a shaker (Orbit Shaker; Lab-Line, IL) for 30 min at 200 RPM. The samples were then centrifuged again for 20 min at 5,000 RPM (FisherSci, 225 Centrifuge, Waltham, MA). The supernatant was decanted off, with the pellet consisting of our extracted HA. The HA (i.e., pellet) was then resuspended in 10 mL of 0.1 N NaOH, which was used as our suspended HAs solution, for subsequent HAs quantification. The other three procedures utilized either a chemical or a physical extraction method, followed by the same protocol/procedures as the control. The chemical extractants utilized were 10 mL of EDTA (2% at 4°C for 1 h) along with formaldehyde (0.06 mL of 37% formaldehyde at 4°C for 1 h) followed by NaOH (10 mL of 0.1 N at 25°C for 1 h; Liu and Fang, 2002; D'Abzac et al., 2010). The physical extractant was elevated temperature. Four grams of biosolids diluted with 10 mL of PBS in centrifuge tubes were placed in a water bath at 80°C for 1 h (Frølund et al., 1995; Fang and Jia, 1996).
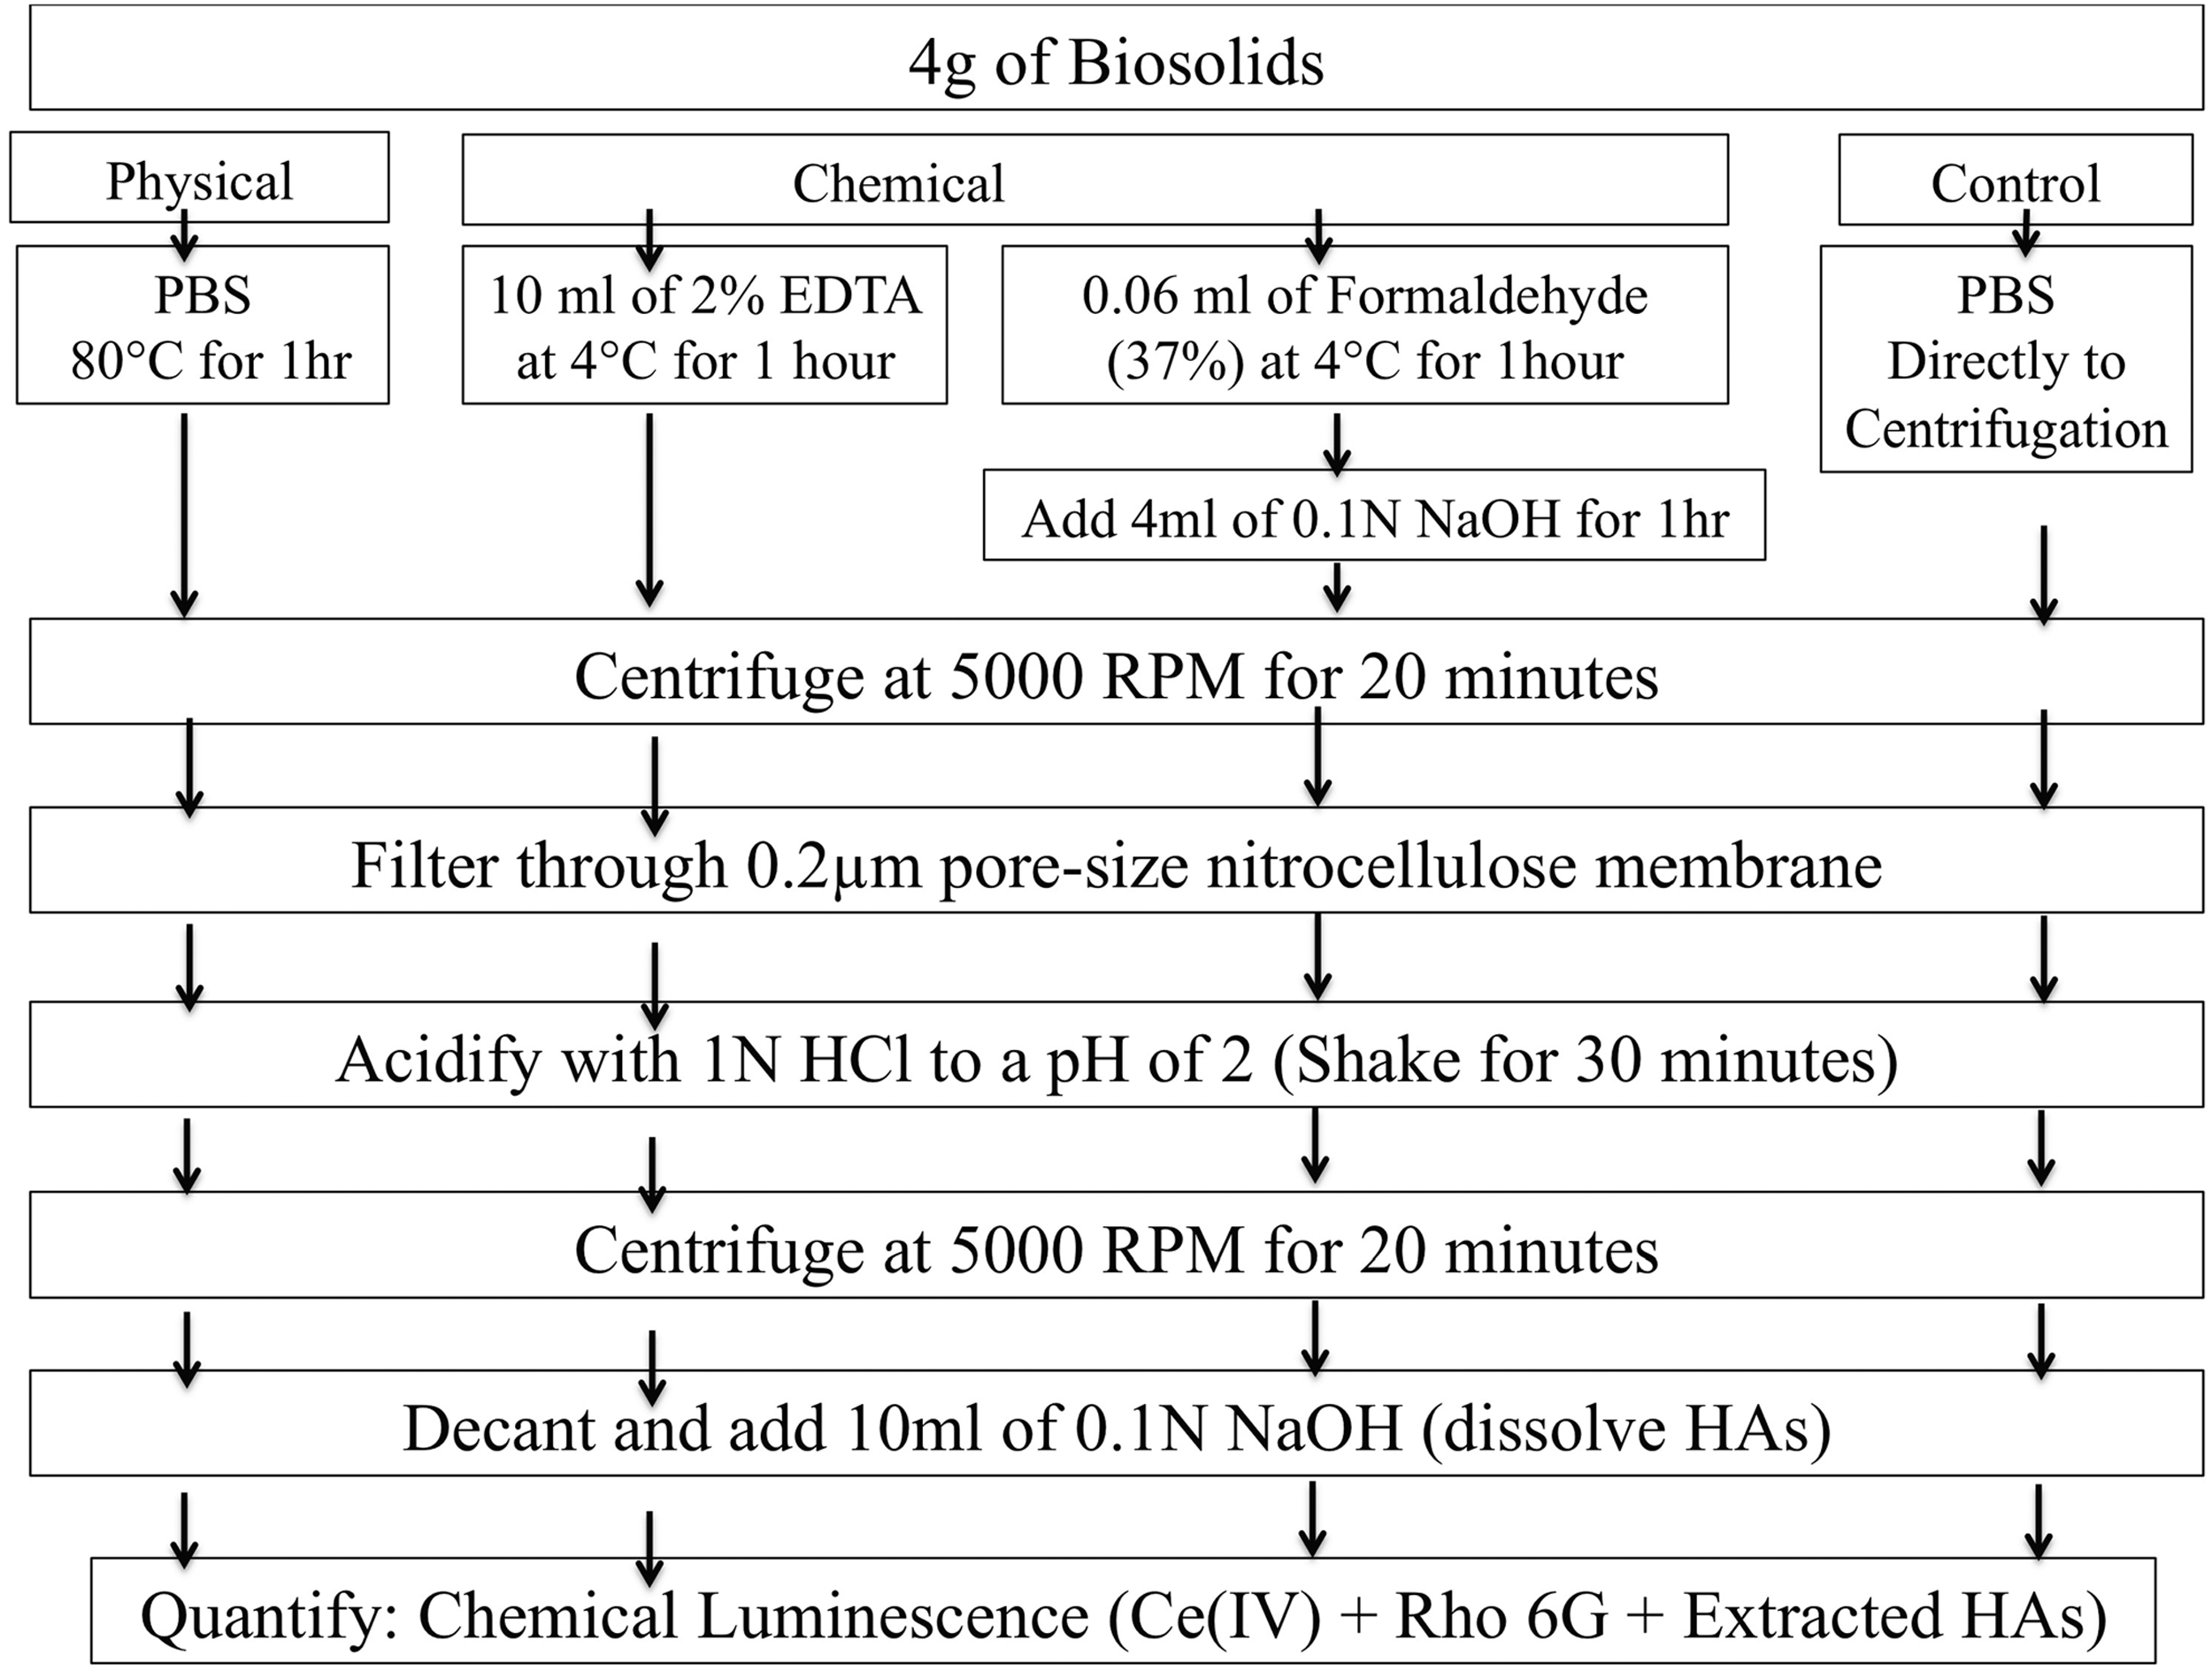
Detailed procedure for each method utilized in extraction of humic acids (HA).
CL and HAs determination
A Turner 20/20 single tube luminometer (2020-998, Sunnyvale, CA) was utilized in a batch configuration to measure the relative light units (RLUs) of our analytes. Autoclaved microcentrifuge tubes (1.5 mL) were utilized as the reagent vessels in the following sequence: 300 μL of commercial or extracted humic acids were added to the reaction vessel, followed by rhodamine 6G (0.0001 mol/L), and finally freshly prepared acidic Ce(IV) solution (0.05 mol/L). The extracted humic acids were diluted (10−1, 10−2, 10−3) before analysis, to achieve the appropriate range of detectable HAs. Of note, is that the prepared acidic Ce(IV) solution required 30 min of stabilization before use. After the 30-min stabilization period, the solution was used to generate a standard curve using our commercial extracted HAs. This was done each time to calibrate that solution, since pipetting the small volumes often resulted in fluctuations in that specific solution. Therefore, if the Ce(IV) solution was not within 5% of our standard curve it was adjusted (i.e., dilution with acid or addition of concentration Ce(IV) solution), to ensure repeatable analysis from one acidic Ce(IV) solution to the next. Following the introduction of these three reagents (in the specified order) into the reaction vessel, the vessel was immediately placed into the luminometer. This was replicated (n = 3) for each sample, with their RLUs being recorded each time. The same procedure was used for both stock solutions (HA), in the generation of standard curves, and for comparing the extracted samples over time.
Microbial analysis
Indicator bacteria measured in this study were Escherichia coli (US EPA, 2002a), Enterococcus spp. (US EPA, 2002b), and fecal coliforms (US EPA, 1999; APHA, 2005). Following mechanical mixing, the digesters were opened and fresh samples were dispensed into sterile 50-mL conical tubes (Fisher Conical Centrifuge Tubes) and placed on ice. Ten grams from each digester was then diluted with 90 mL of sterile PBS, and subsequently mixed. Dilution and mixing occurred within sterile Whirl-Pak bags (Whirl-Pak NASCO, WI). The mixed samples were then serially diluted for subsequent membrane filtration using a 0.45 μm pore-size nitrocellulose sterile membrane (Fisherbrand, Waltham, MA). The nitrocellulose membranes, after filtration, were then placed upon their specific media, modified m-TEC for E. coli, m-FC for fecal coliforms, and m-EI for Enterococci. After incubating at specific incubation time and temperature, according to the respective standard methods, the colonies were counted and then colony numbers were calculated. The results are expressed as log CFU/dry g.
Salmonella was a representative pathogenic bacteria investigated in this study. It was quantified using EPA method 1682 (US EPA, 2006). Briefly, enrichment was done through incubation in TSB. Following incubation in TSB, the samples were spotted from the TSB on selective modified semisolid Rappaport-Vassiliadis medium. Presumptively identified colonies were then isolated on xylose–lysine–deoxycholate agar. Isolated presumptive colonies were then taken for biochemical confirmation with slants of lysine–iron agar, triple sugar iron agar, and urea broth. The final step of confirmation uses serological typing with polyvalent-O-antisera. Calculation for most probable number (MPN) was then done based on the number of positive tubes and their dilution, as well as the dry weight of the original biosolid sample, and reported as MPN/4 g dry solids.
Statistical analysis
Statistical analysis was conducted using SAS 9.2 software. The replicate treatments were compared using a paired T-test and a Wilcoxon signed-rank test. Relationships between levels of bacteria and levels of HA were determined using a Spearman correlation test (proc corr) and a Pearson correlation coefficient (r).
Results and Discussion
CL of commercial HA
The linear standard curve for commercial HAs with CL demonstrated a R2 of 0.97. These results demonstrate the sensitivity of an acidic Ce(IV)–rhodamine 6G complex to quantify HAs. The order of reagents, along with their lack of CL signal by themselves is demonstrated in Fig. 2b. This details the CL of each reagent, along with the different combinations of an acidic Ce(IV), rhodamine 6G (Rho 6G), and HA alone. The inclusion of Ce(IV) with either HA or rhodamine 6G demonstrates it as the oxidizing agent within the reaction (Ce(IV)). As seen in Fig. 2a and b, the increase in HA concentration is followed by an increase in RLU. The theorized mechanism of the acidic Ce(IV)–rhodamine 6G complex has been described within recent literature. Qu et al. (2012) postulate that the mechanism of the CL reaction between acidic Ce(IV) and HA is the result of semiquinone radicals being formed during the oxidation of acidic Ce(IV) solution. These radicals generate a CL signal when excited state semiquinones are converted into quinine. Rhodamine 6G serves as a means to amplify this CL signal. The nature of this reaction is why the reagent order between the three compounds (acidic Ce(IV), rhodamine 6G, and HA) is important to not preliminarily quenching the reaction (Fig. 2b). Therefore, it is essential that the rhodamine 6G and HA be added to the reaction vessel before acidic Ce(IV), to prevent reaction quenching and ensure reproducible results (RLU).

Quantification of HA with an acidic Ce(IV) complex, and relative light units associated with the standard curve for HA and each reagent.
Comparing EPS extraction methods and their resulting HA levels
Figure 3 illustrates the changing HA levels extracted with various extraction methods for the 34 days. The replicated treatments for each extraction method was not statistically different (T-test and Wilcoxon sign-ranked), indicating that an average of them could be used for the presentation of data in Fig. 3. Levels of HAs within EPS from the biosolids samples were dependent upon the extraction method utilized (Fig. 3 and Table 1).
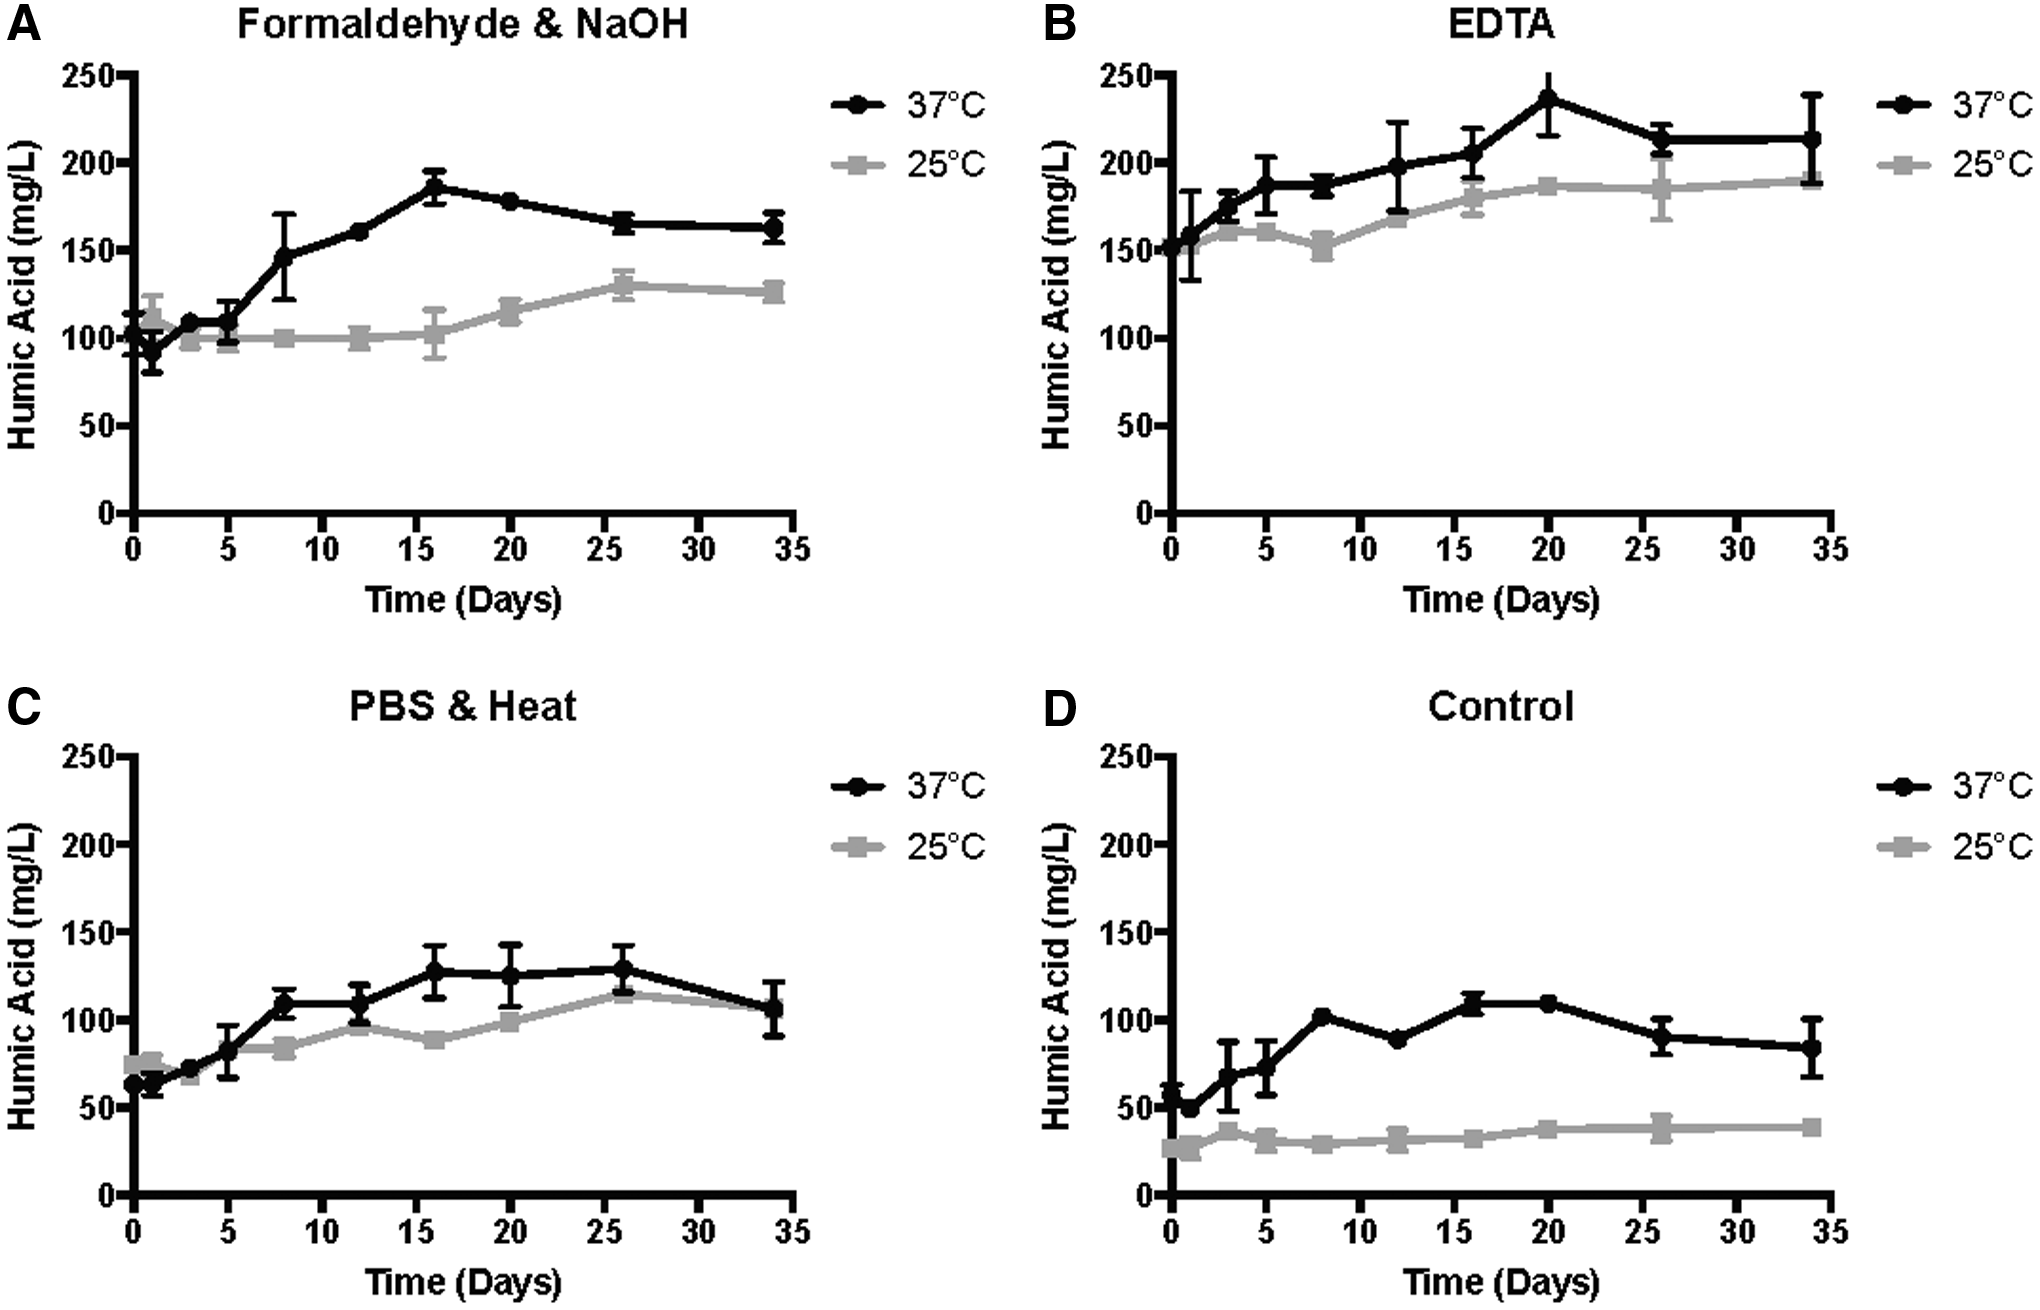
Extracted HAs over the course of the study for each extraction method, and at both temperatures (25°C and 37°C); Formaldehyde and NaOH
EDTA, ethylenediaminetetraacetic acid; PBS, phosphate-buffered saline.
The control yielded the lowest levels of extracted HAs, whereas PBS-heat yielded the second lowest (Table 1). This was anticipated due to the control not utilizing any mechanism to dissociate the EPS, whereas the heat from PBS-heat relies solely on cellular molecular movement to dissociate the EPS (Sheng et al., 2010). The chemical extractants produced higher levels of extracted HAs, with EDTA generating the highest levels compared with formaldehyde–NaOH (Table 1). This was likely due to the chemical extractants targeting the EPS matrix as well as the microbes present in the EPS matrix. EDTA, for example, functions by removing divalent cations, which are important in the crosslinking of charged compounds in the EPS matrix; the removal of these cations results in the dissociation of the matrix (Sheng et al., 2005; Bourven et al., 2012). Alternatively, formaldehyde prevents cell lysis by fixing the cells, through interaction with the cell membrane (Alcamo, 1997; Liu and Fang, 2002), whereas the NaOH increases the pH of the EPS matrix, causing the dissociation of the EPS between acidic groups and the repulsion of negatively charged particles (Wingender et al., 1999). These results suggest that chemical extractants would be desired for HA extraction from the EPS of biosolids, compared with physical techniques. These findings are supported by Liu and Fang (2002), who investigated various EPS fractions and their concentrations in assorted sludges, and found that EDTA and formaldehyde–NaOH yielded the highest levels of humic substances among the six extraction methods tested.
All of the extracted treatment samples showed increasing levels of HA over time, except for the control at 25°C. HA levels were higher for the samples digested at 37°C, although they showed a decrease for the last two time points; which was unexpected and could be the result of HA depletion, saturation, or the formation of other species with fewer phenolic moieties. However, this is speculative since the exact forms and fate of the HAs in our study remain unknown. With the exception of PBS-heat (which ended with identical HA levels), all 37°C samples ended with higher HA levels than their 25°C counterparts (Fig. 2). This was anticipated since the stabilization of biosolids should occur at a faster rate at 37°C than 25°C, resulting in the formation of humic substances at a greater rate than at 25°C. This faster rate of HA formation was based upon the notion by Qu et al. (2012) that humic substances form to some degree during animal and plant degradation, and increased temperature is known to improve stabilization (thermophilic > mesophilic > psychrophilic). Therefore, these findings that show levels of HA increase over time during digestion and to a higher degree at 37°C (compared with 25°C), suggests that HAs to some level are formed during the decomposition and stabilization of organic matter.
Fecal indicators and pathogenic organisms
The log inactivation of fecal bacteria studied is presented in Fig. 4. The treatments, performed in duplicate, were not statistically different indicating that average values could be used for the presentation of the data (T-test and Wilcoxon sign-ranked). The data were log normally distributed, and the microbial results are presented as such. Levels of E. coli and fecal coliforms followed similar trends, with both bacteria reaching a nondetectable limit by day 20 for the 37°C-treated biosolids (Fig. 4). However, levels of fecal coliforms at 37°C reached detectable limits on day 34, with a concentration of 0.98 log (CFU/g). The lower temperature (25°C) resulted in greater levels of both E. coli and fecal coliforms, with final concentrations of ∼1.5 log (CFU/g) for both organisms. Enterococci, on the other hand, did not decline similarly to that of E. coli and fecal coliforms, with levels less than 4.0 log (CFU/g) never obtained over the course of the study. Salmonella spp. results (Fig. 5) show the 37°C treatment attained an MPN/4 g of dry solids below 11 by day 8, and a value of less than 1 (MPN/4 g) on day 20. However, levels of Salmonella increased to 5.43 and 6.87 MPN/4 g, respectively, at the last two sampling points. The 25°C digested biosolids did not achieve these reductions, and never reached a level below 11 MPN/4 g until day 34 (2.6 MPN/4 g).
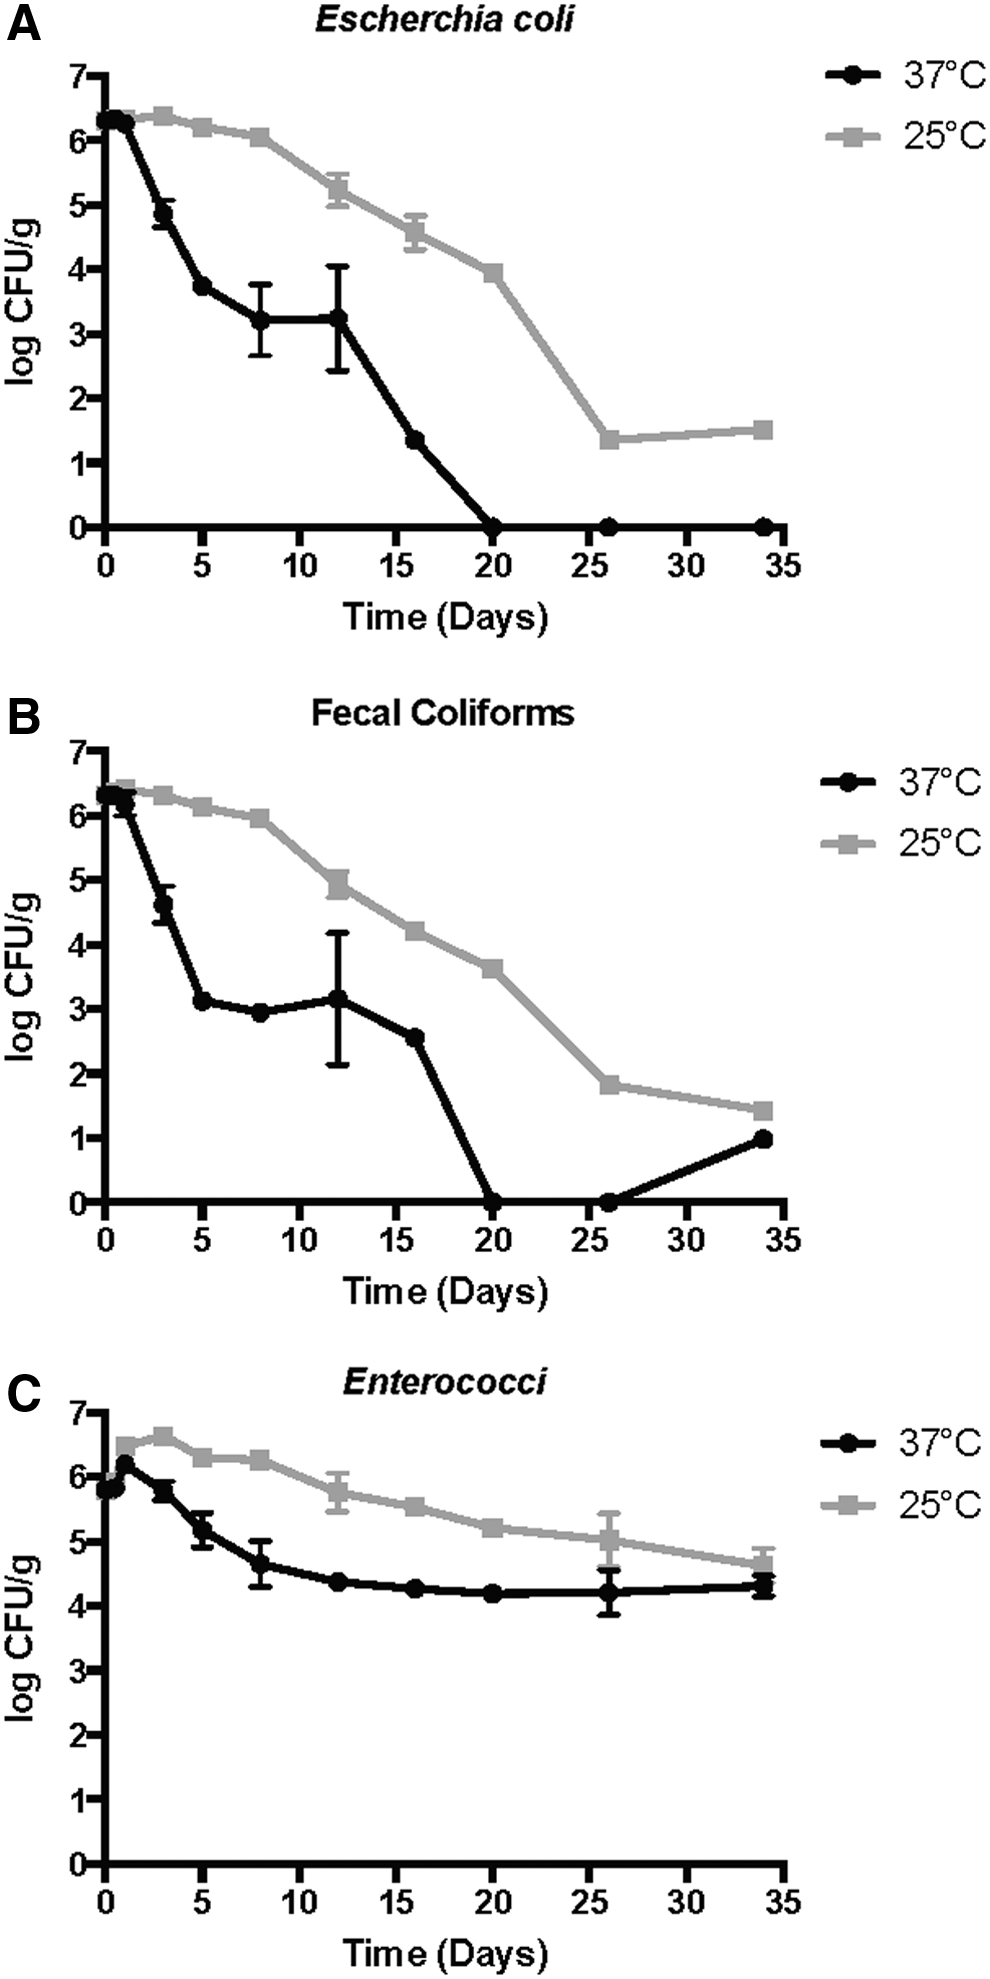
Levels of Escherichia coli
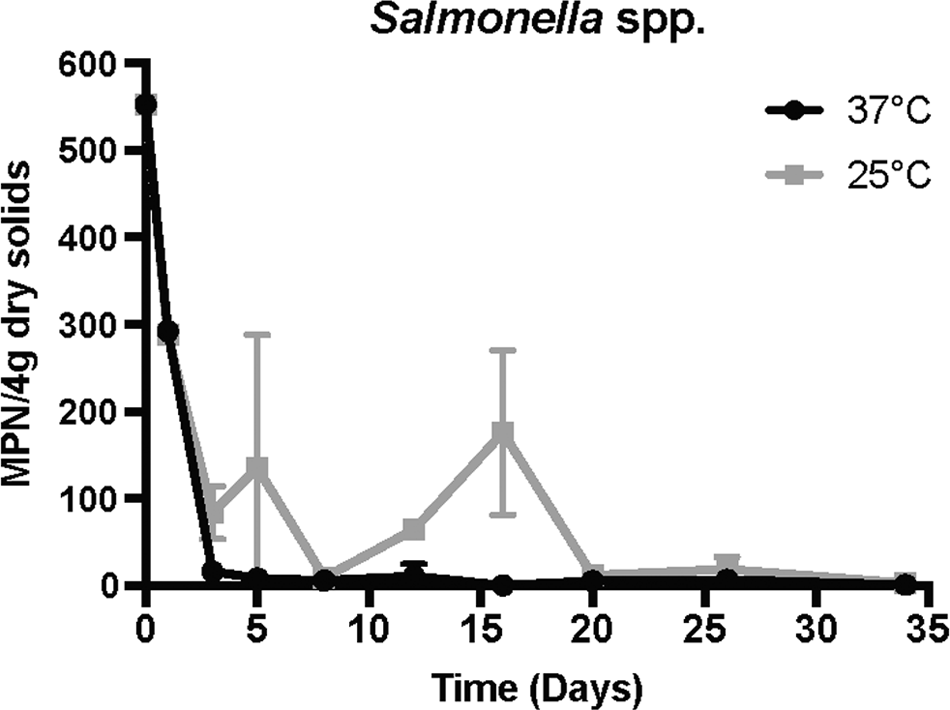
Average Salmonella spp. concentration over the course of the study at both 25°C and 37°C.
These results are similar to other researchers that have shown fecal coliforms and E. coli are readily inactivated during both psychrophilic and mesophilic anaerobic digestion. Côté et al. (2006) found total coliform removal ranging from 1.6 to 4.2 log CFU/mL when treating pig slurry for 20 days at 37°C, whereas our results showed 2.7 log CFU/g at 25°C for 20 days. Juris et al. (1996) reported levels of E. coli EC 5 strain below detectable levels after 18 days of mesophilic anaerobic digestion, which was similar to our findings that showed nondetectable levels of E. coli after 20 days. Salmonella demonstrated similar results to those of E. coli and fecal coliforms, with decreasing levels over time, and with the higher temperature achieving greater reductions. Similar results were also seen by Kumar et al. (1999) that compared anaerobic digestion of cattle dung at 25°C and 37°C, and found that E. coli and Salmonella typhi were both inactivated below detectable levels by the 15th day of treatment at 37°C, whereas it took 25 days to achieve levels below detection at 25°C. These results support our findings, along with the 37°C reactors resulting in greater inactivation of E. coli, fecal coliforms, and Salmonella spp. than the 25°C reactors. It should also be noted that levels of E. coli (25°C) and fecal coliforms (37°C) increased slightly from the 25th day to the 34th day, which was unexpected. However, these unexpected results were observed in only one of the two digesters sampled on the 34th day for both E. coli and fecal coliforms (one reactor had detectable levels while the other was below detection), which suggests that variability existed between these replicate reactors or other microbial mechanisms were observed (e.g., regrowth).
Enterococci remained at levels much greater than the other three bacteria studied. However, similar results exists in the literature which details the difference in survivability between Enterococci and E. coli (Cekmecelioglu et al., 2005; Bonjoch and Blanch, 2009). Niwagaba et al. (2009), who investigated E. coli and Enterococci inactivation over time in stored feces, found that E. coli was below detectable levels after 2 months, whereas Enterococci did not decrease below detectable limits over the course of the study (Niwagaba et al., 2009). Carrol and Long (2016) had similar findings that found Enterococci was only reduced by 50% compared with the feed, whereas E. coli was reduced by 150%.
The results presented in this study, along with numerous other articles support that higher temperatures result in a lower survival for microbes when anaerobically digested (Olsen and Karsen, 1987; US EPA, 1999; Sahlström, 2003; Côté et al., 2006; Sidhu and Toze, 2009; Popat et al., 2010; Pandey and Soupir, 2011). This is an important point for this research, since only four bacteria were measured, yet the majority of microbes studied in the literature decrease when anaerobically digested over time, particularly in batch reactors (Côté et al., 2006; Sidhu and Toze, 2009). Thus our results align with much of the literature, and support the notion that temperature is a key variable in both the stabilization of biosolids and inactivation levels when anaerobically digesting biosolids (Dumontet et al., 1999). This relationship with temperature could be the result of higher temperatures, particularly mesophilic, resulting in the optimal conversion of organic matter, while limiting undesired end products (e.g., elevated VFAs, ammonia, etc.) that can occur in thermophilically digested biosolids (De la Rubia et al., 2013). This explanation is supported by Rosenblum et al. (2015) who suggested that substrate levels and subsequent nutrient limitation play a substantial role in fecal indicator levels within an anaerobic reactor. It is further supported by Smith et al. (2005) who concluded similar ideas, stating that microbial competition and substrate limitation are likely to be primary factors responsible for reducing enteric bacteria levels during mesophilic digestion. These findings along with our results support that the conversion of organic matter (i.e., stabilization) plays a critical role, whereas numerous other variables could also play a role (e.g., total solids, retention time, type of reactor, and temperature; Bochmann and Montgomery, 2013; Chen et al., 2016). Thus, an indicator that could potentially predict the degree of stabilization in biosolids could prove to be a novel indicator for the determination of a biosolids class.
Correlation between HAs and bacteria studied
The inverse correlation of HA and E. coli are illustrated in Fig. 6, which shows increasing levels of EDTA-extracted HAs, while E. coli concentrations are decreasing over time. Their correlation is further supported by the anaerobic digestion results at the two temperatures. That is, anaerobic digestion performed at 37°C had HA levels increase faster and achieve higher levels compared with 25°C. The same relationship was seen for levels of E. coli, although inverse, with levels decreasing faster and achieving nondetectable levels, compared with 25°C. As mentioned above, temperature is an important variable that impacts microbial levels during anaerobic digestion (Olsen and Karsen, 1987; US EPA, 1999; Sahlström, 2003; Côté et al., 2006; Sidhu and Toze, 2009; Popat et al., 2010; Pandey and Soupir, 2011). Therefore, seeing the same inverse relationship with HA, which shows that the higher temperature generated greater levels of HA, provides further evidence that a correlation likely exists. This correlation between HA and the bacteria investigated is also supported by a Spearman correlation test, which demonstrated that HA levels and levels of the bacteria investigated (both pathogenic and indicator) were negatively related for all extraction combinations (negative r-value and p-value <0.05). This indicates that an increase in levels of HA is associated with reduced levels of the bacteria studied.
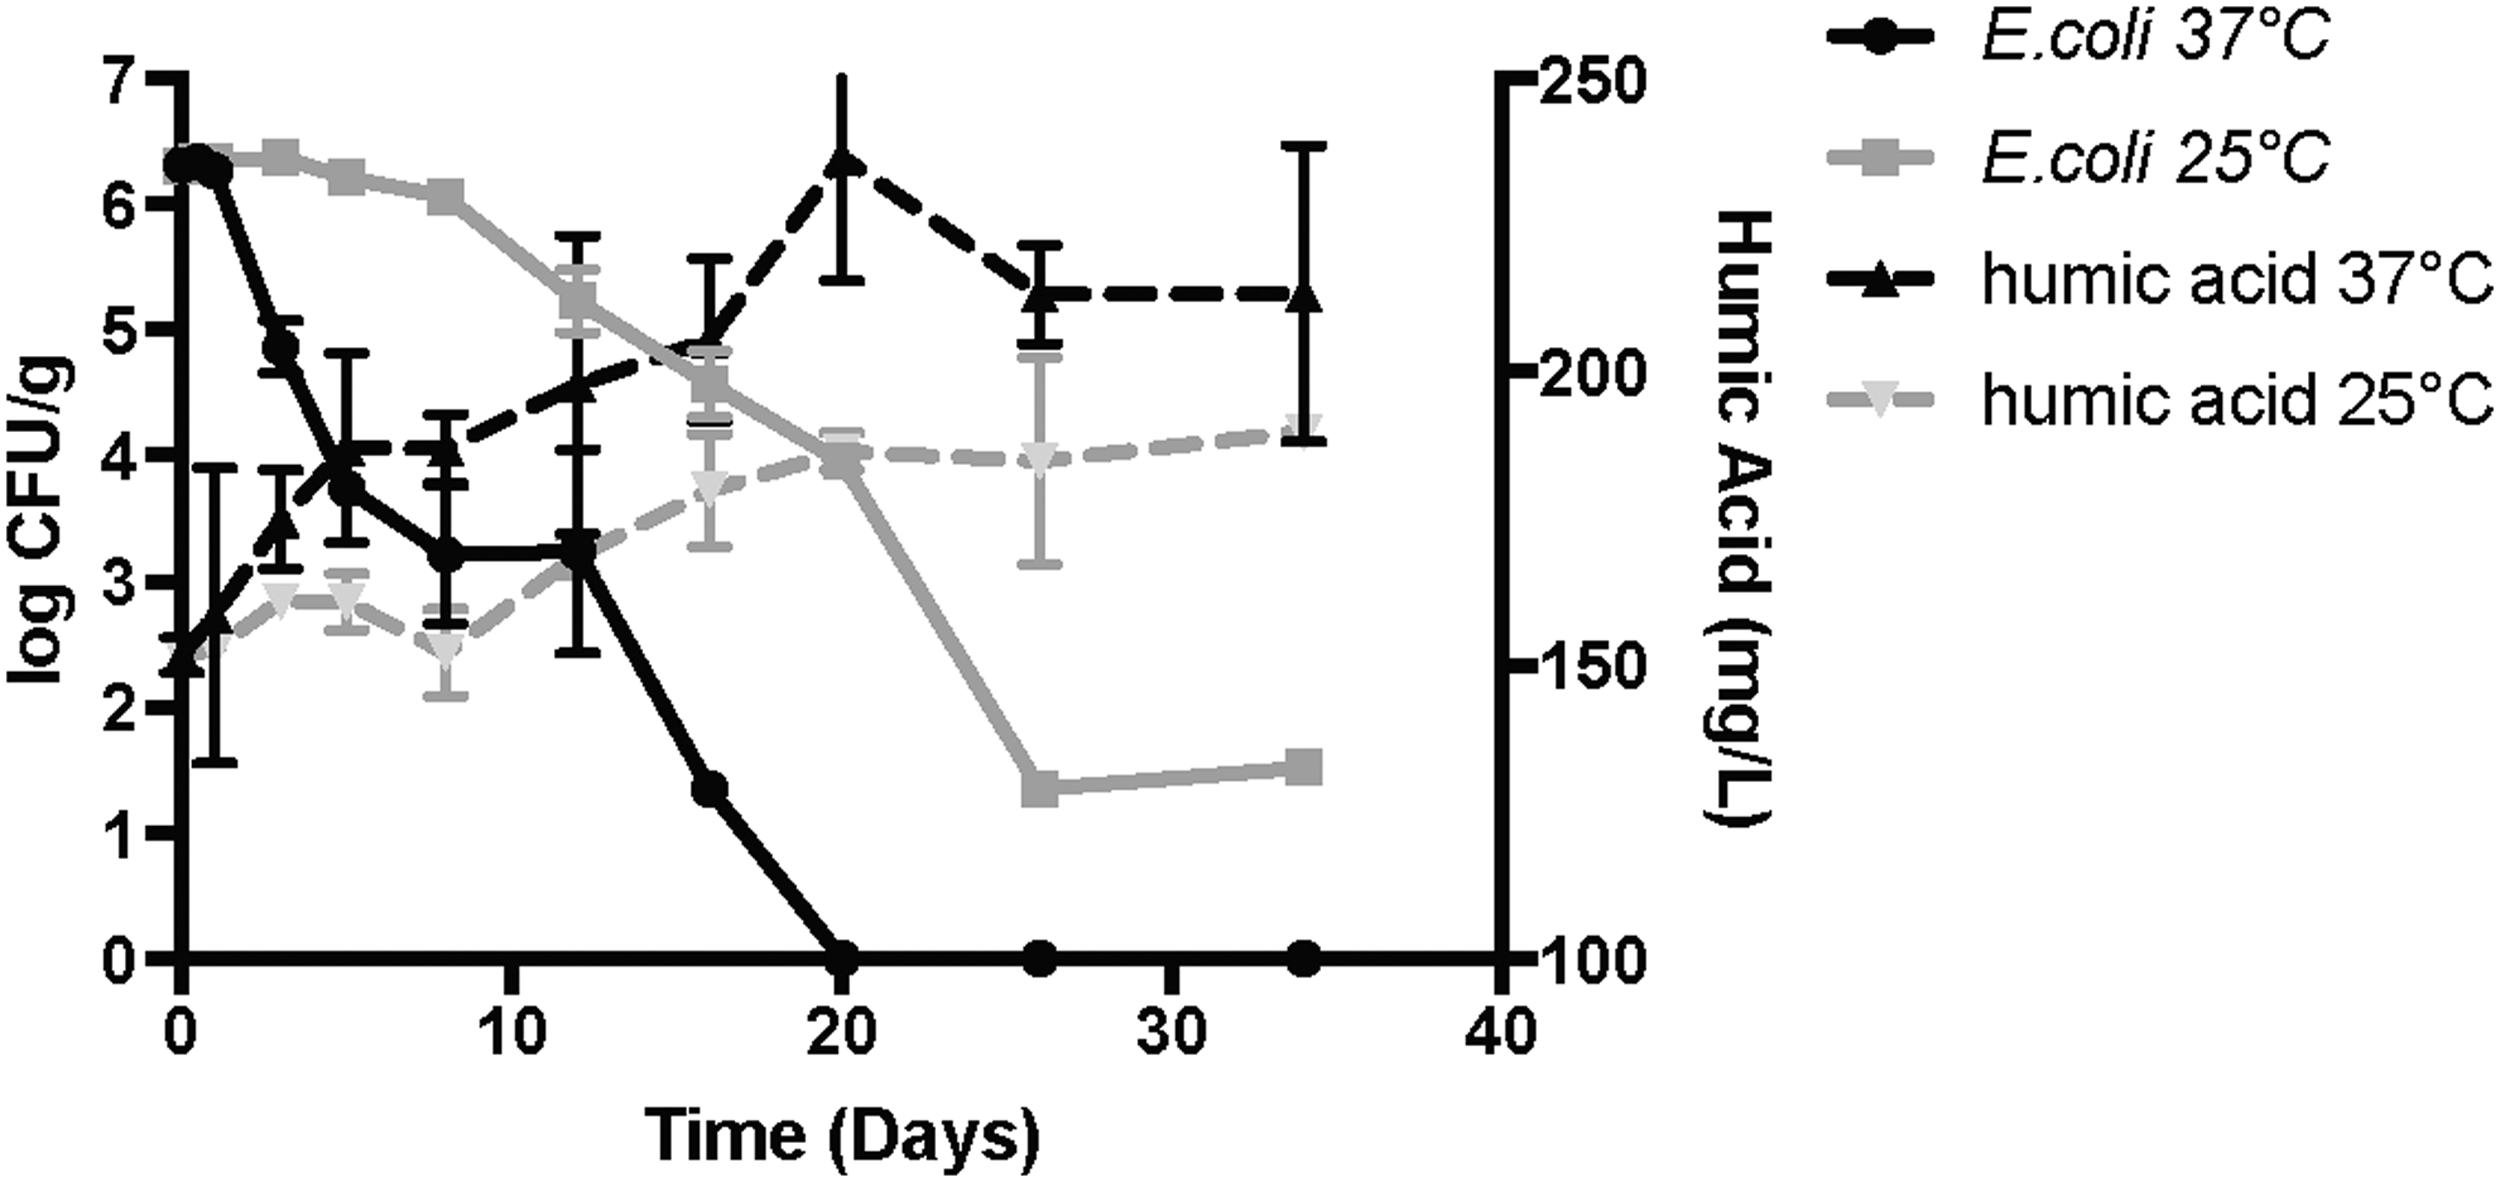
Concentrations of E. coli and HA over time at two different temperatures (25°C and 37°C).
The association between HA and bacteria investigated is further supported by a Pearson correlation coefficient, which demonstrated a strong negative correlation. E. coli and the three extraction methods demonstrated a correlation of −0.9 and greater (Control > −0.78) at both temperatures, whereas fecal coliforms and the three extraction methods demonstrated a correlation of −0.85 or greater at both temperatures (Control > −0.78). Salmonella and the three extractions demonstrated a correlation of −0.63 and greater at 37°C, whereas at 25°C all the extraction had correlations greater than −0.57, except for the formaldehyde and NaOH [−0.34]); which is likely explained by the relatively slow change in HA levels in the first 15 days for this extraction procedure (rapidly increased between day 15 and 34), compared with Salmonella's rapid and changing levels over the first 15 days of the study. Enterococci and the three extraction methods demonstrated a correlation of −0.9 and greater (Control > −0.89) at 37°C, whereas at 25°C all the extractions had correlations greater than −0.764 (Control > −0.64).
Overall, data presented here provide evidence to support an inverse correlation between levels of bacteria investigated and the extracted HAs from our anaerobically digested biosolids over time. This correlation would then support the notion that the level of HAs could be used as a potential indicator of the status of stabilized biosolids.
However, it is important to note the limitations of this study and future areas of research that are needed to better validate these findings. Some major limitations follow: (1) This study was from a single feedstock (i.e., cattle manure with municipal inoculum) performed under batch conditions and requires further research to investigate other digestion styles (e.g., continuous) and other feed stocks (e.g., municipal). (2) This study only measured bacteria (e.g., indicators and a pathogen), and not other microbial indicators or pathogens. Therefore, research is needed to test this theory versus other microorganisms, particularly viruses, helminthes, and spore forming bacteria; (3) The study only determined levels of HA and bacteria; not other chemical indicators frequently used to assess anaerobic digestion (i.e., VFAs, biogas, chemical oxygen demand, etc.), which could be incorporated in future research studies that investigated other microorganisms; (4) The duration of digestion also needs to be extended, since unexpected results were observed for levels of microbes and HA toward the last two time points, which longer-duration anaerobic digestion experiments could help to answer why and if this is a concern for future research; (5) Work is also needed to address the environmental health implications if such a method was used in place of microorganism quantification (i.e., high levels of pathogens in untreated biosolids); and (6) Research is needed to test field-based approaches that could see extraction and quantification occur in the field and in real time. Although there is substantial research needed to further support the relationship demonstrated herein, these results provide a starting point for a new approach to assessing the stabilization of biosolids.
Conclusion
Results suggest that HAs could be used as an indicator for biosolids stabilization. This research also further demonstrated the ability of EPS extraction methods to separate HAs from the EPS of biosolids, along with CL and an acidic Ce(IV)–rhodamine 6G complex in quantifying extracted HAs. The observed inverse relationship between HAs and bacteria investigated is further supported by comparison of the two temperatures, with 37°C having lower levels of bacteria and higher levels of HAs when compared with 25°C. These results also suggest the importance of organic matter stabilization as a key variable in bacterial inactivation.
Footnotes
Author Disclosure Statement
No competing financial interests exist.