
Abstract
Abstract
To fully comprehend the aggregation process of TiO2 nanoparticles in aqueous suspensions, one must quantitatively characterize the size distribution and the number of aggregates during the aggregation process. A Brownian dynamics approach was applied to simulate the aggregation of TiO2 nanoparticles in aqueous suspension. The well-known Derjaguin-Landau-Verwey-Overbeek (DLVO) theory was utilized to describe the particle–particle interaction. The effect of particle size (10, 20, and 30 nm), pH (5.5, 7.0, and 9.0), and ionic strength (0.001, 0.01, and 0.1 M) on aggregation process was characterized using the number of aggregates, single TiO2 nanoparticles, and size distribution of aggregates. Results indicated that aggregate size and degree of aggregation decreased with increase of pH, and increased with the increase of ionic strength. In comparison with pH and ionic strength, primary particle size probably played a critical role in the aggregation of the TiO2 nanoparticles in aqueous suspension. The proportion of large aggregates that included more than 30 single TiO2 nanoparticles in the 10 nm TiO2 nanoparticles model system was 30.6%. Brownian dynamic simulation of the aggregation process of TiO2 nanoparticle under different conditions is beneficial to adequately understand the fate of nanoparticles in environmental systems.
Introduction
T
Aggregation behaviors can significantly change the physicochemical properties (particle size, specific surface area, and surface activity) of nanoparticles, thus affecting their migration, transformation, and toxicity in aqueous environments (Farré et al., 2011; Garner and Keller, 2014; Lanphere et al., 2015). The aggregation behaviors of nanoparticles in aquatic environments have been extensively studied, including the effect of pH, ionic strength, and natural organic matter (Petosa et al., 2010; Huangfu et al., 2015a, 2015b). The results indicate that the aggregation process is impacted by the nanomaterial properties (e.g., size, chemical composition, and surface characteristics) and water chemical conditions (e.g., ionic strength, pH, and dissolved organic matter content) (Lin et al., 2010; Lanphere et al., 2014). Several analytical techniques (e.g., DLS, TEM, FCS, and SALS) have been applied to characterize aggregate size, morphology, and aggregation rate of nanoparticles in aqueous suspensions. Unfortunately, these experimental methods are not able to show the microscopic description during the aggregation process, for example, quantifying the number and the size distribution of nTiO2 aggregates. In addition, with new nanomaterial emergence, the case-by-case experimental studies of aggregation are expensive and time consuming (Li and Chen, 2012). Thus, it is imperative to develop a theoretical approach to quantify the aggregation behaviors of nanomaterials in aqueous suspensions.
Quantitative simulation methods have been introduced to describe the aggregation process of nanoparticles in aqueous suspensions. Molecular dynamics (MD) simulations are able to investigate the aggregation kinetics and aggregate morphology of nanomaterials (Salameh et al., 2012; Raju et al., 2014; Sedighi and Mohebbi, 2014; Lu et al., 2015). However, due to the difference between the sizes of the solvent molecules (typically 10−10–10−9 m) and nanoparticle aggregates (usually 10−8–10−7 m), it is infeasible to simulate the aggregation process with an actual number of nanoparticles. The Monte Carlo method can simulate the nanoparticle aggregation in aqueous suspensions with a moderate computational effort (Kim et al., 2008; Liu et al., 2011), but the nanoparticles in Monte Carlo simulations move in a huge phase space (the phase space usually consists of all possible values of position and momentum variables), rather than a real spatiotemporal system.
Brownian dynamics (BD) approach, which characterizes the dynamic process of nanoparticles in a real spatiotemporal system can circumvent the computational limitations, which are caused by the large number of solvent molecules in MD simulations (Markutsya et al., 2008b). The BD simulation approach is computationally efficient, as the solute–solvent interactions are incorporated into Langevin equations for solute particles. Markutsya et al. (2008a) used BD approach to simulate the nanoparticle aggregation for controlling the synthesis of nanoparticle in the chemical reactor. Jiang et al. (2010) modeled the nanoparticles' aggregation and sedimentation in nanofluid using BD simulation, which tracked the temporal changes in nanoparticle suspension concentration due to sedimentation. However, the nanoparticles' aggregation process under different ambient factors (e.g., pH and ionic strength) remains unexplored within the numerical simulations.
In this article, a BD modeling approach was used to simulate the aggregation process of TiO2 nanoparticle in aqueous suspensions. The particle–particle interaction was described by the Derjaguin-Landau-Verwey-Overbeek (DLVO) theory of colloidal stability. A series of simulations were conducted to investigate the effect of primary nanoparticle diameter and water chemical conditions (e.g., pH and ionic strength) on the dynamic aggregation process. The parameters used in these simulations were provided by experiments and the related references. The number of aggregates, single TiO2 nanoparticle, and size distribution of aggregates were calculated to quantitatively interpret the aggregation process.
Materials and Methods
Aggregation model system
Nanoparticle aggregation was simulated in a cubic box that contained 1000 spherical rutile TiO2 nanoparticles. The concentration of TiO2 nanoparticle in the model system was about 10 mg/L. The nine model systems with different diameters (10, 20, and 30 nm), pH (5.5, 7.0, and 9.0), and ionic strength (0.001, 0.01, and 0.1 M) were used to investigate the nanoparticle aggregation process under related environmental conditions. The detail information is provided in Supplementary Table S1. The typical box size used was 110 a (particle radius) in x, y, and z directions. The initial interval distance between nanoparticles was set as 10 a. The model system was shown in Fig. 1.
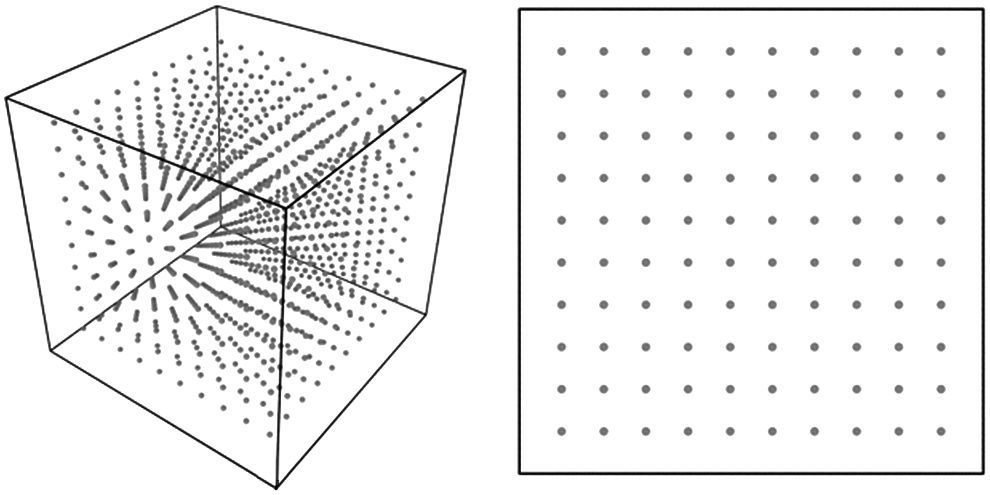
Initial configuration of TiO2 nanoparticles in model system.
Particle–particle interaction
Particle–particle interactions between two TiO2 nanoparticles were modeled by a DLVO potential. This interaction is the sum of a van der Waals attraction VVDW and an electrostatic repulsion VEDL. The expressions of VVDW and VEDL are (Everaers and Ejtehadi, 2003; Safran, 2003):
where
For the low surface potentials (less than about 25 mV), the prefactor A is determined by the relationship between surface charge and surface potential due to the presence of electrolyte.
where z is the electrolyte charge number (here z = 1 for sodium chloride solution), NA is the Avogadro's number (6.022 × 10²³), kB is the Boltzmann's constant (1.38 × 10⁻²³ J/K), T is the temperature (T = 298.15 K), and C is the ionic strength (in M). The
(Gao et al., 2003).
IS, ionic strength.
BD simulations
Aggregation kinetics of nanoparticles in aquatic environments are expected to be determined by the random Brownian diffusion and particle–particle interaction (Petosa et al., 2010). The BD method determines the trajectory of the particle movement under the colloidal effect and external forces, and the governing equation of particle transport is the stochastic Langevin equation, including the particle Brownian motion (Unni and Yang, 2005). The model systems were simulated by BD. The solvent is considered as a continuum medium, and its effect upon the solute is represented by a combination of frictional and random forces. The motion of nanoparticle i is described by the Langevin equation as follows:
where mi and
BD simulations were conducted using the LAMMPS program package at a constant temperature of 298.15 K with an integration time step of 1 ps in the NVE ensemble (NVE: number of particles N, volume V, and energy E are constant) using a Nose–Hoover thermostat. Periodic boundary conditions were used in the x, y, and z directions. All simulations were conducted for 2 ms. The treatment of the simulation results was carried out using a self-compiled code.
Experimental section
Surface potential of rutile TiO2 nanoparticle under related environmental conditions used in the simulations was provided by the laboratory experiments. The TiO2 nanoparticles used in this study were purchased from Kenaxin New Nano Material Co., Ltd (Anhui, China). The stock solutions (1.0 g/L) of TiO2 nanoparticles were prepared in ultrapure water (18.2 MΩ·cm; Millipore, Billerica, MA) with sonication for 30 min (50 W/L at 40 kHz, KQ-50DA; Kunshan Ultrasonic Instruments Co., Ltd, China). The working solutions of TiO2 nanoparticles were prepared immediately before diluting the stock solution with ultrapure water. Analytical grade NaOH and HCl were used to adjust the pH of the TiO2 nanoparticle suspensions. The ionic strength was varied by adding different amounts of 0.01 M NaCl stock solution. The Zeta potentials (ζ-potential) were studied in different media from the Zetasizer NS (Malvern instruments, United Kingdom).
Results and Discussion
Aggregation process of TiO2 with different particle sizes
To investigate the effect of particle size on the dynamic aggregation process of TiO2 nanoparticles in aqueous suspensions, BD simulation was conducted using different initial particle size (10, 20, and 30 nm) for 2 ms. The aggregation configurations of model systems at the end of the simulations were depicted in Fig. 2. At pH 7.0 and ionic strength (IS) 0.01 M, an increase in particle size resulted in a significant decrease of the extent of aggregation. The 10 nm TiO2 nanoparticles formed larger and more compact aggregates; and a few of single TiO2 nanoparticles existed in the simulation system. Conversely, the 30 nm TiO2 nanoparticles generated smaller aggregates, and a great number of single TiO2 nanoparticles still remained in the model system.

Aggregate configurations of TiO2 nanoparticles in suspension with different particle sizes (D = 10, 20, and 30 nm; pH 7.0; IS 0.01 M). IS, ionic strength.
To quantitatively characterize the aggregation process of TiO2 nanoparticles in aqueous suspensions, the variation of the numbers of aggregates and single TiO2 nanoparticles during the simulation was calculated. The results are displayed in Figs. 3 and 4. Both for 10 and 20 nm TiO2 nanoparticles, the number of aggregates first increased to reach a maximum and then decreased. It suggests that the single TiO2 nanoparticles initially formed small aggregates with nearby nanoparticles and then the small aggregates formed new larger aggregates. The peaks corresponding to the number of aggregates of 259, 258 were observed at 21.1 and 278 μs for 10 and 20 nm TiO2 nanoparticles, respectively. At the end of the simulation, the number of aggregates for 10 and 20 nm TiO2 nanoparticles reduced to 48 and 167. However, the number of aggregates for 30 nm nanoparticles increased during the whole simulation time, and there was no peak value. Keller et al. (2010) reported the 30 nm TiO2 nanoparticles aggregated at low ionic strength, and the size of aggregates remained stable at slightly above 300 nm. Thus it could be inferred that the inadequate aggregation of 30 nm TiO2 nanoparticle in our study resulted from the limited simulation time. According to the time of the peak occurrence for 10 and 20 nm TiO2 nanoparticles, it suggests that the time for adequate aggregation increased with the initial particle size. It was consistent with the Brønsted-based theory developed by Kallay and Zalac (2002), which indicated that the smaller particles led to rapid aggregation. In addition, for 10 nm nanoparticles, the number of single TiO2 nanoparticles quickly decreased to 9 at 284 μs and gradually approached 0. For 20 and 30 nm TiO2 nanoparticles, the number of single TiO2 nanoparticles decreased to 13 and 58 at the end of the simulation. The order of the decrease speed of the number of single TiO2 nanoparticles was as below: 10 > 20 > 30 nm.

Variations of number of aggregates with different particle sizes (D = 10, 20, and 30 nm; pH 7.0; IS 0.01 M).

Variations in number of single TiO2 nanoparticles with different particle sizes (D = 10, 20, and 30 nm; pH 7.0; IS 0.01 M).
Figure 5 shows the size distribution of TiO2 aggregates at the end of the simulation. The aggregates size is defined as the number of single TiO2 nanoparticles included in the aggregate. The aggregates were classified in seven groups. The 10 nm TiO2 nanoparticles formed three aggregates in group 1, seven aggregates in group 2, eight aggregates in group 3, seven aggregates in group 4, four aggregates in group 5, two aggregates in group 6, and five aggregates in group 7. For 20 nm TiO2 nanoparticles, group 1, group 2, group 3, and group 4 contained 77, 68, 21, and 1 aggregates, respectively. The model system with 30 nm TiO2 nanoparticles had a narrow particle size distribution, including 210 aggregates in group 1 and 21 aggregates in group 2. The size distribution indicated that the aggregates' proportion of 30.6% was very large in the 10 nm TiO2 nanoparticle model system (including more than 30 single TiO2 nanoparticles), whereas all the aggregates included less than 30 single TiO2 nanoparticles in the 20 and 30 nm TiO2 nanoparticle model system. The results indicated that the aggregate size and the degree of aggregation decreased with the increase of the initial particle size. Our results are consistent with the results of experiments, which confirmed that the average aggregate sizes decreased with the large particle size (Liu et al., 2012; Tan et al., 1999).

Size distribution of nTiO2 aggregates with different particle sizes (D = 10, 20, and 30 nm; pH 7.0; IS 0.01 M).
The aggregation processes could be divided into two subprocesses: (1) the TiO2 nanoparticles transported to the vicinity of another TiO2 nanoparticle or collided with another TiO2 nanoparticle by Brownian diffusion; and (2) two nanoparticles attracted each other and adhered together. The effect of particle size on aggregation could be described based on the above process. On the one hand, the Brownian diffusion increased with the decrease in particle size, thereby potentially increasing the probability of collisions between nanoparticles (Petosa et al., 2010). On the other hand, the particle aggregation was dependent on the height of the energy barrier (Elimelech, 1996). Particles that overcame the energy barrier would aggregate with another particle in a deep primary energy minimum. The height of the energy barrier for aggregation was directly associated with the size of the interacting particles. The smaller particles exhibited lower energy barrier (Elimelech and O'Melia, 1990). Thus, the 10 nm TiO2 nanoparticles in aqueous suspensions might quickly form large aggregates and sediment out, which have a potential risk to benthonic organisms. The small aggregates formed in the 20 and 30 nm TiO2 nanoparticle model system might transport extensively and expose to aquatic organisms in the water bodies for a longer time.
Aggregation process of TiO2 nanoparticles under different pH conditions
Aggregation configurations under different pH conditions at the end of the simulation were displayed in Fig. 6. It shows that the TiO2 nanoparticles aggregated under all pH conditions (pH 5.5, pH 7.0, and pH 9.0). However, compared with the particle size, the effect of pH on the aggregation of TiO2 nanoparticles was unremarkable. At IS 0.01 M, for 20 nm TiO2 nanoparticles, the degree of aggregation slightly changed with the increase of pH. Figure 7 shows the variations of the numbers of TiO2 aggregates under different pH conditions. The numbers of aggregates first increased to reach a peak and then gradually decreased. For pH 5.5, 7.0, and 9.0, the maximum of the number of aggregates was 273, 258, and 256 at 219, 278, and 401 μs. At the end of the simulation, the number of aggregates was 147, 167, and 161 for pH 5.5, 7.0, and 9.0, respectively. Figure 8 displays the variations of the numbers of single TiO2 nanoparticles under different pH conditions. For pH 5.5, 7.0, and 9.0, the number of single TiO2 nanoparticles continuously declined during the whole simulation. At end of the simulation, the number of single TiO2 nanoparticles was 13, 13, and 27 at pH 5.5, 7.0, and 9.0, respectively.

Aggregate configurations of TiO2 nanoparticles under different pH conditions (pH = 5.5, 7.0, and 9.0; D 20 nm; IS 0.01 M).
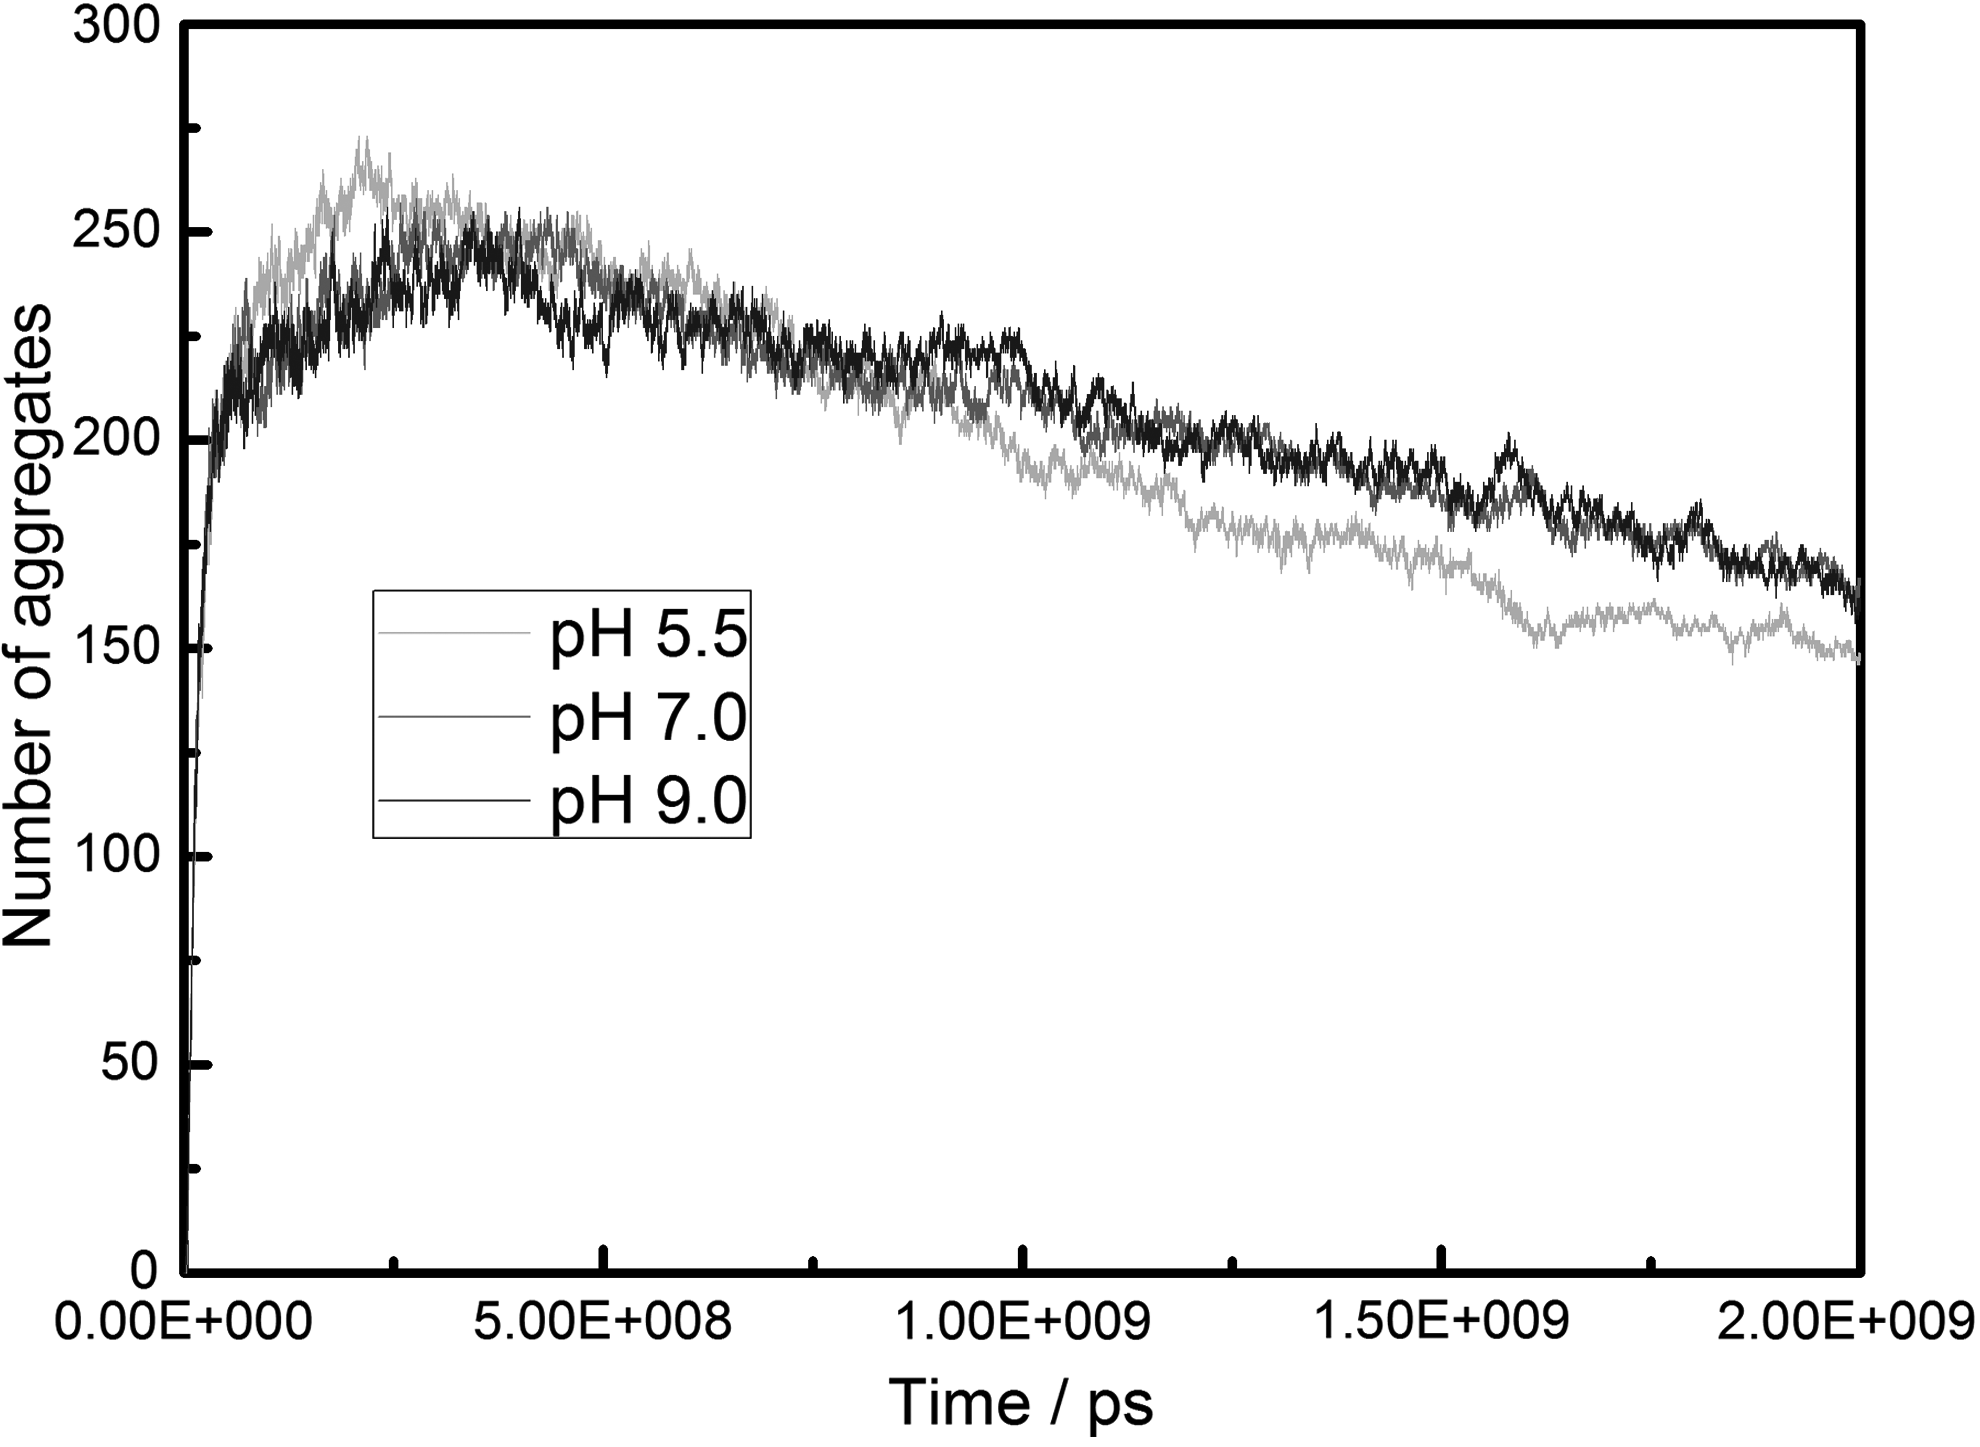
Variations of number of aggregates under different pH conditions (pH = 5.5, 7.0, and 9.0; D 20 nm; IS 0.01 M).
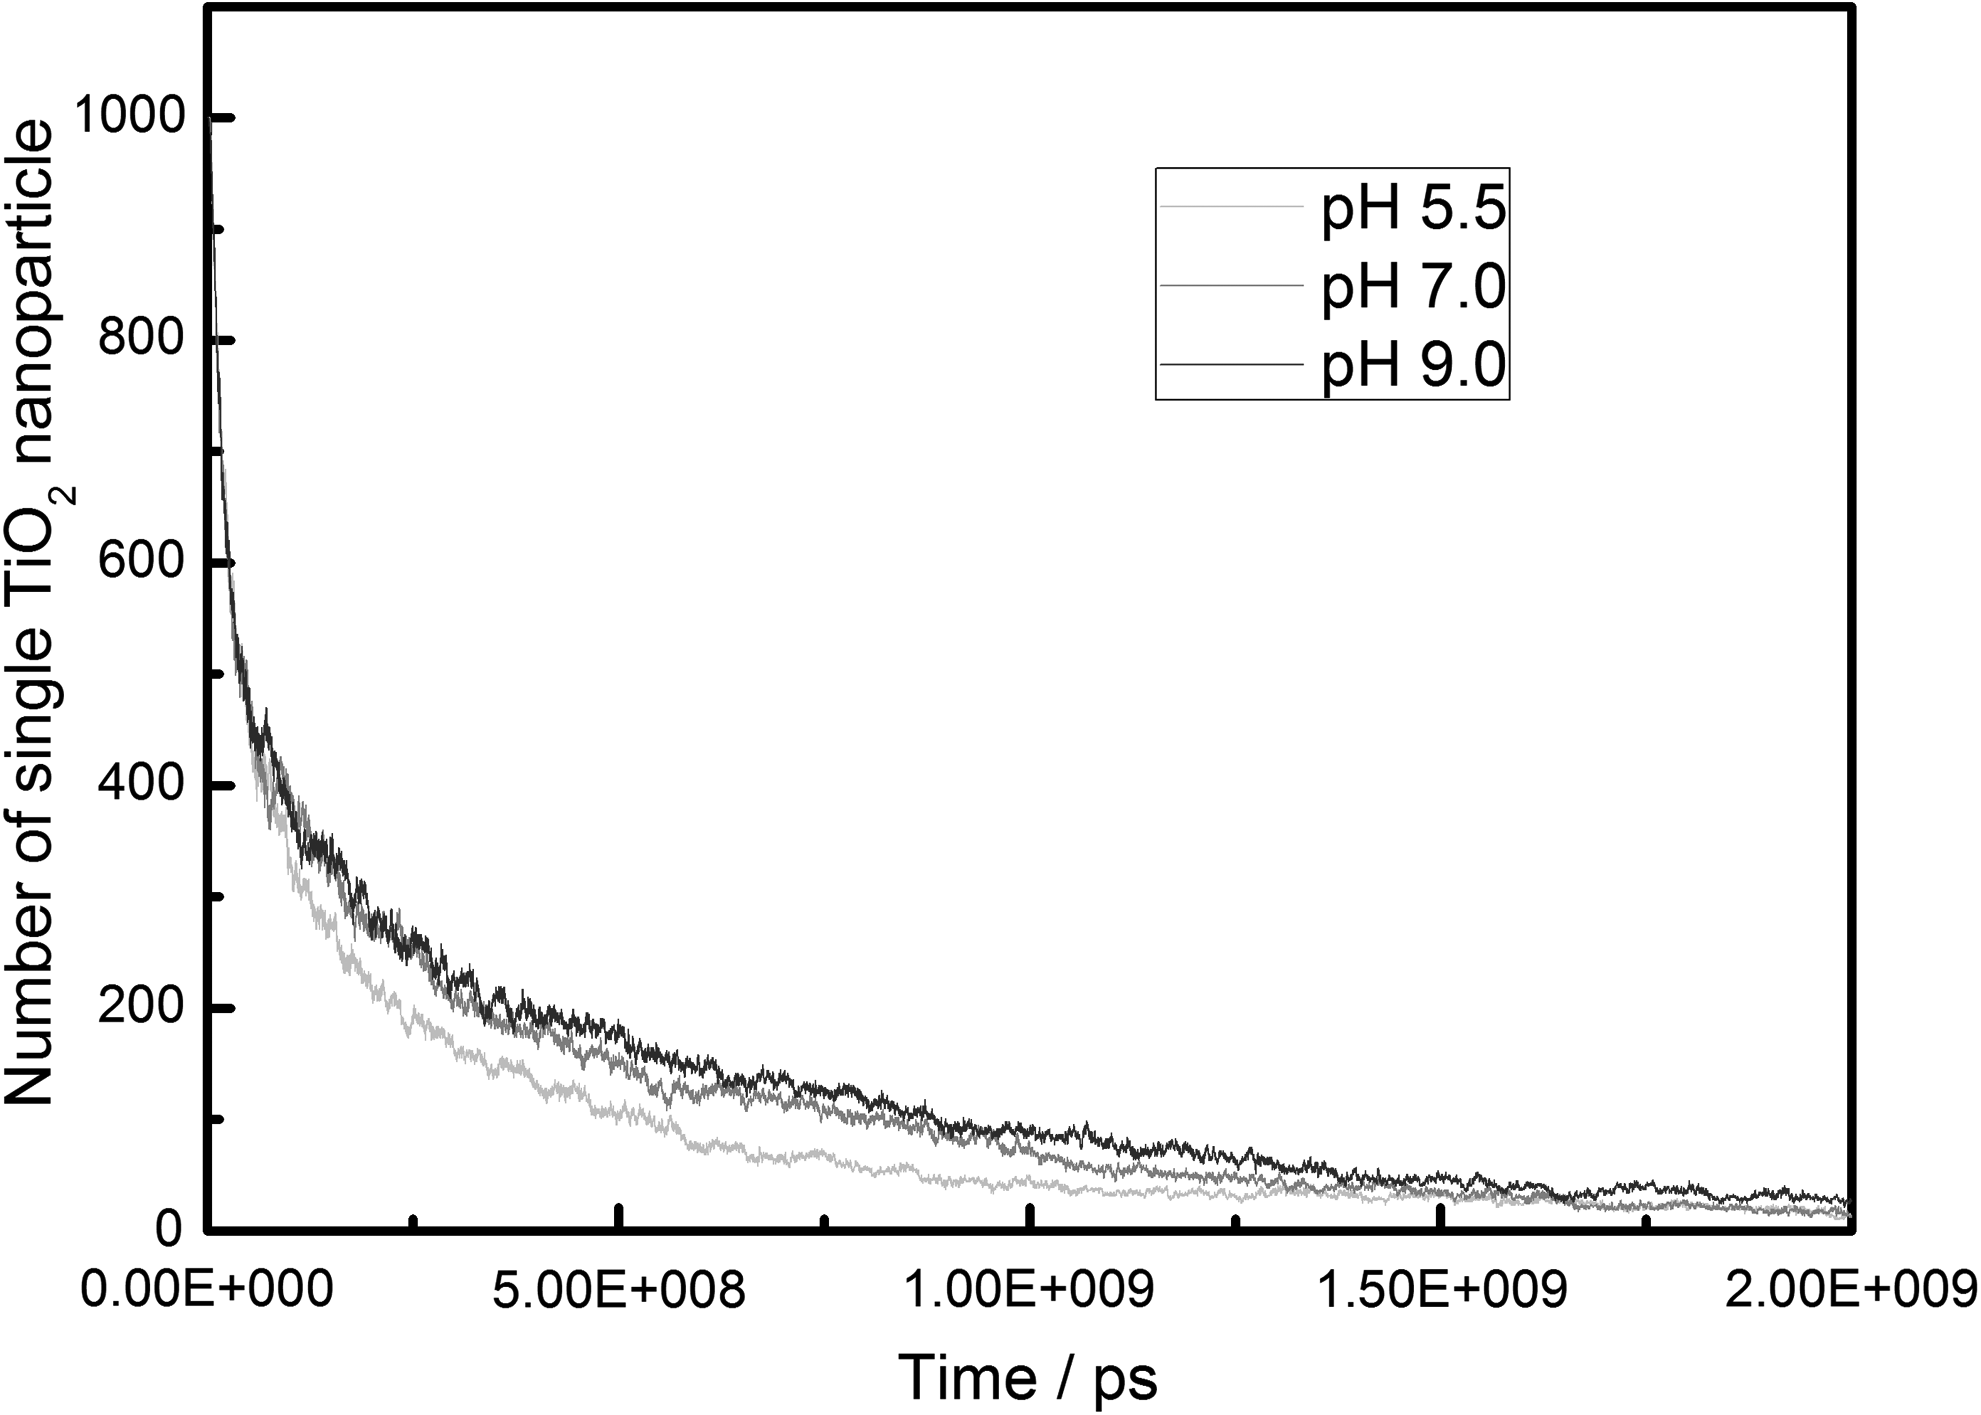
Variations of numbers of single TiO2 nanoparticles under different pH conditions (pH = 5.5, 7.0, and 9.0; D 20 nm; IS 0.01 M).
As shown in Fig. 9, all the aggregates were distributed in group 1, group 2, group 3, and group 4 under the given pH conditions. At pH 5.5, the model system contained 57, 55, 32, and 3 aggregates in group 1, group 2, group 3, and group 4. Similarly, at pH 7.0, the model system contained 77, 68, 21, and 1 aggregates in group 1, group 2, group 3, and group 4. For pH 9.0, 74, 58, and 29 aggregates existed in group 1, group 2, and group 3. The size distribution of aggregates showed that the aggregate size and degree of aggregation slightly decreased with increasing pH. The acid-base behavior of TiO2 nanoparticles is related with the pH of suspensions (Chen et al., 2012). At alkaline conditions, the surface of TiO2 nanoparticle develops a considerable negative charge density through the deprotonation of its surface hydroxyl, while a positive charge is provided by the protonation of its surface hydroxyl at acidity conditions (Svecova et al., 2008). The absolute values of surface potential enlarged as the pH far from the pH of the point zero charge (pHpzc). The surface potentials of the rutile TiO2 nanoparticle used in our simulation were −0.0076 V, −0.0172 V, and −0.0228 V at pH 5.5, pH 7.0, and pH 9.0, respectively. In addition, it was reasonable that the electrostatic repulsion between nanoparticles increased with the increase of pH. The aggregate sizes increased as the pH approached the pHpzc, whereas the degree of aggregation of TiO2 nanoparticles was reduced when the pH of suspensions was far from the pHpzc (Domingos et al., 2009). Thus, more small aggregates were formed under alkaline conditions, which might show a higher risk for environmental systems.
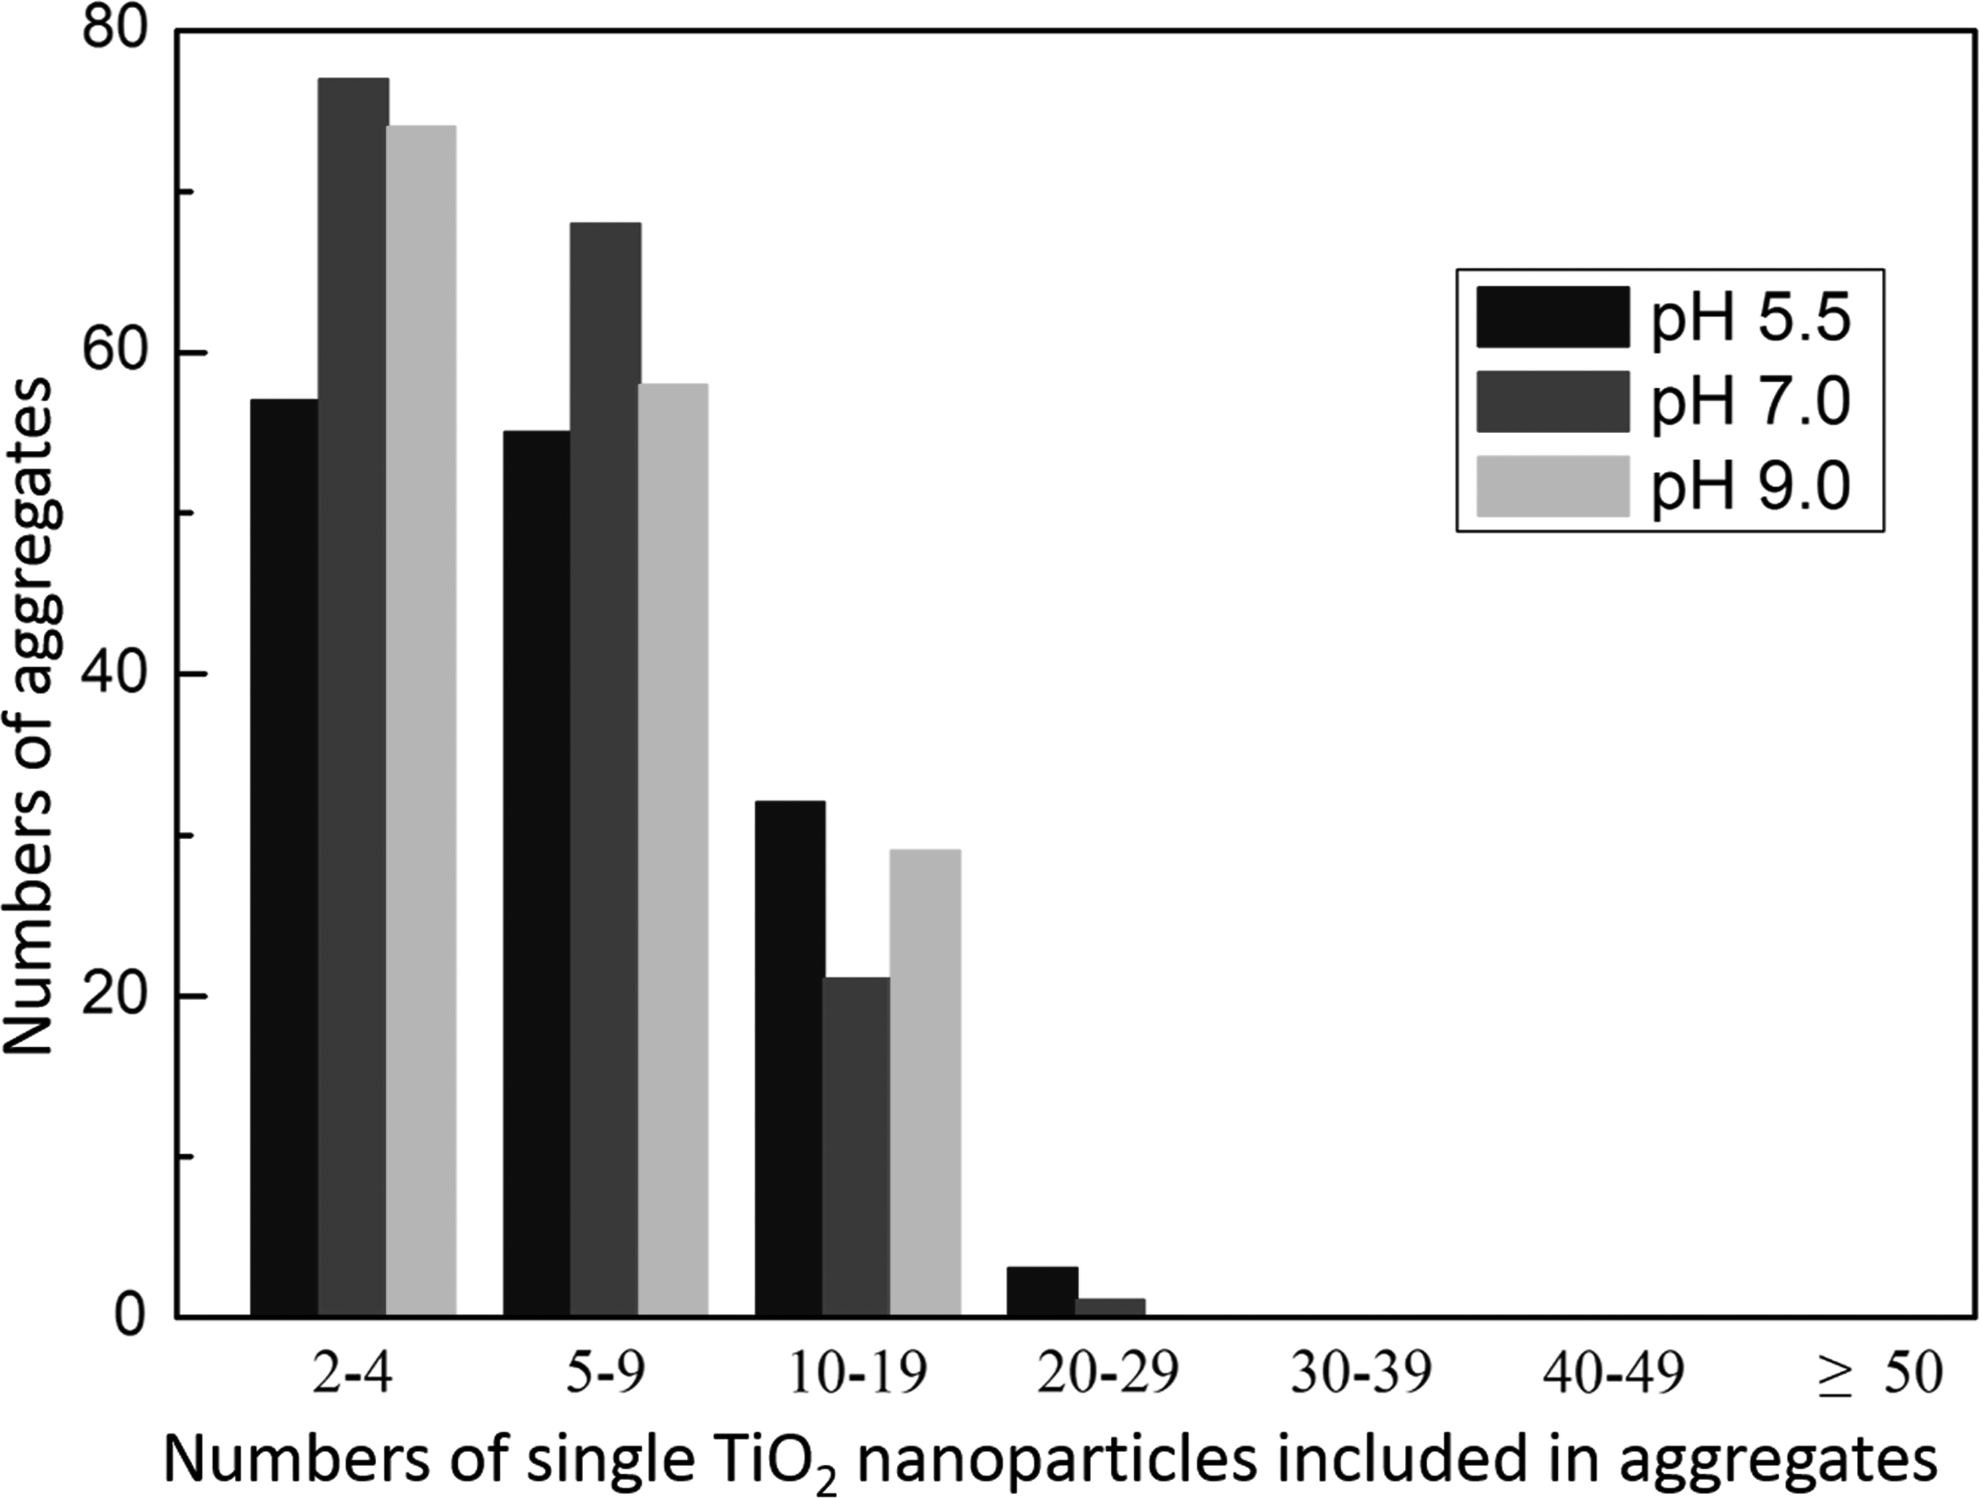
Size distribution of nTiO2 aggregates under different pH conditions (pH = 5.5, 7.0, and 9.0; D 20 nm; IS 0.01 M).
Aggregation process of TiO2 nanoparticles under different ionic strength conditions
At pH 7.0, for 20 nm nanoparticles, BD simulations were conducted to investigate the effect of ionic strength (0.001, 0.01, and 0.1 M) on the aggregation process. As shown in Fig. 10, at IS 0.001 M, no obvious aggregates existed in the model system. As shown in Figs. 11 and 12, the number of aggregates and single TiO2 nanoparticles changed little at 0.001 M during the whole simulation time, which further confirmed the inadequate aggregation of TiO2 nanoparticles in suspensions at 0.001 M. Our results are consistent with Romanello's research, which showed that an ionic strength of 0.0009 M is insufficient for the electrical double layer to be compressed (Romanello and Mm, 2013). Thus, the TiO2 nanoparticles dispersed extensively in aquatic environments at low ionic strength. The degree of aggregation increased significantly with the increase of ionic strength from 0.001 to 0.01 M. However, no clear change was observed with the increase of ionic strength from 0.01 to 0.1 M. At IS 0.01 and 0.1 M, both the number of aggregates first increased and then decreased. The maximums were 258 and 274 at 278 and 362 μs, respectively. At the end of the simulation, the number of aggregates was 167 and 155 for IS 0.01 and 0.1 M. Moreover, at IS 0.01 and 0.1 M, the number of single TiO2 nanoparticle gradually decreased to 12 and 15, respectively.
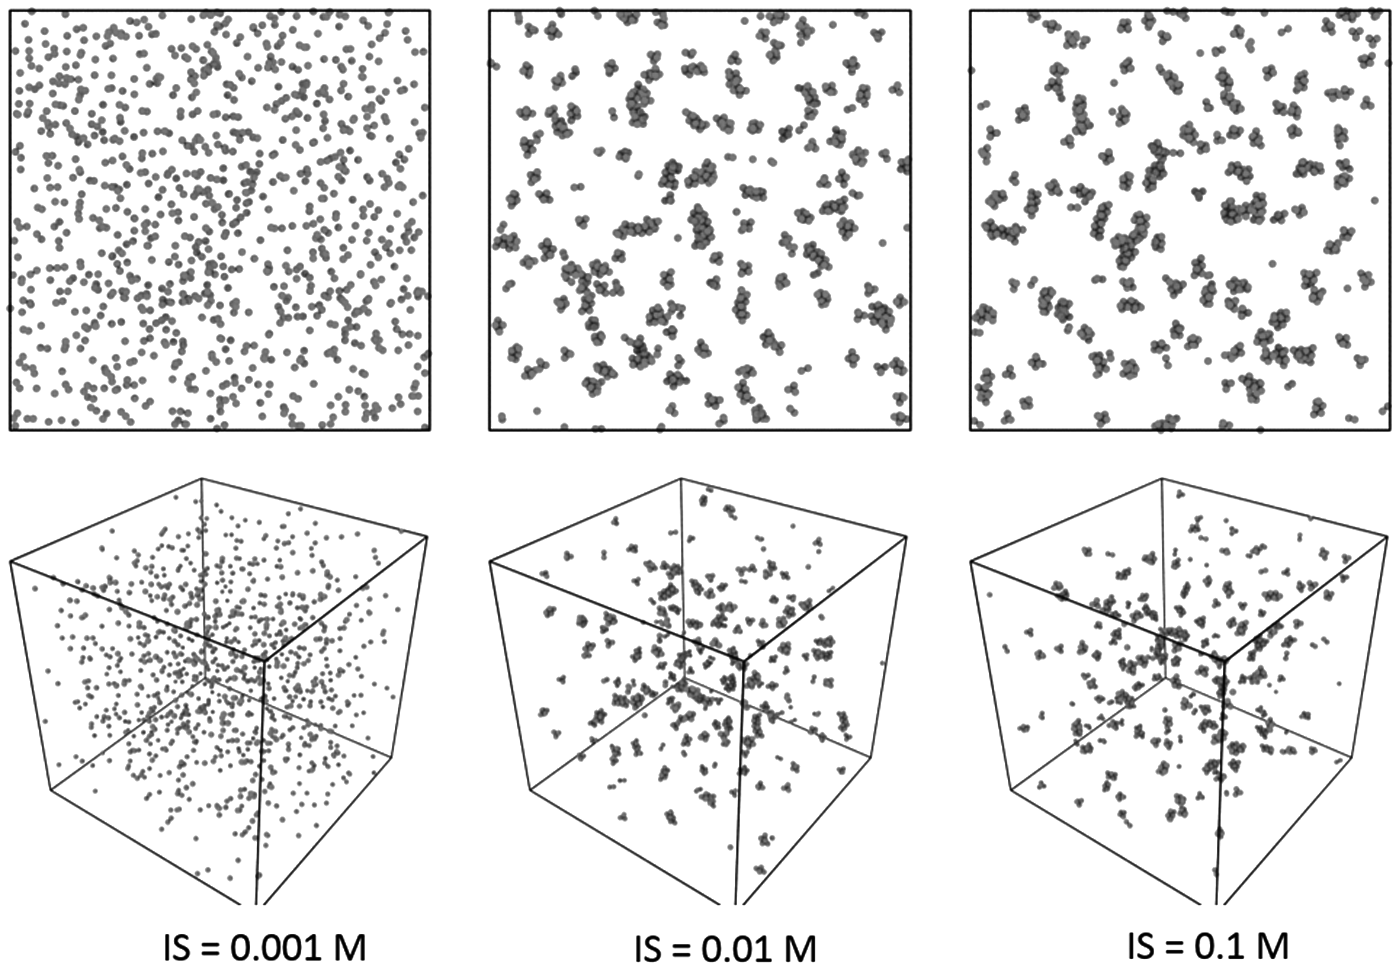
Aggregate configurations of TiO2 nanoparticles under different ionic strength conditions (IS = 0.001, 0.01, and 0.1 M; D 20 nm; pH 7.0).
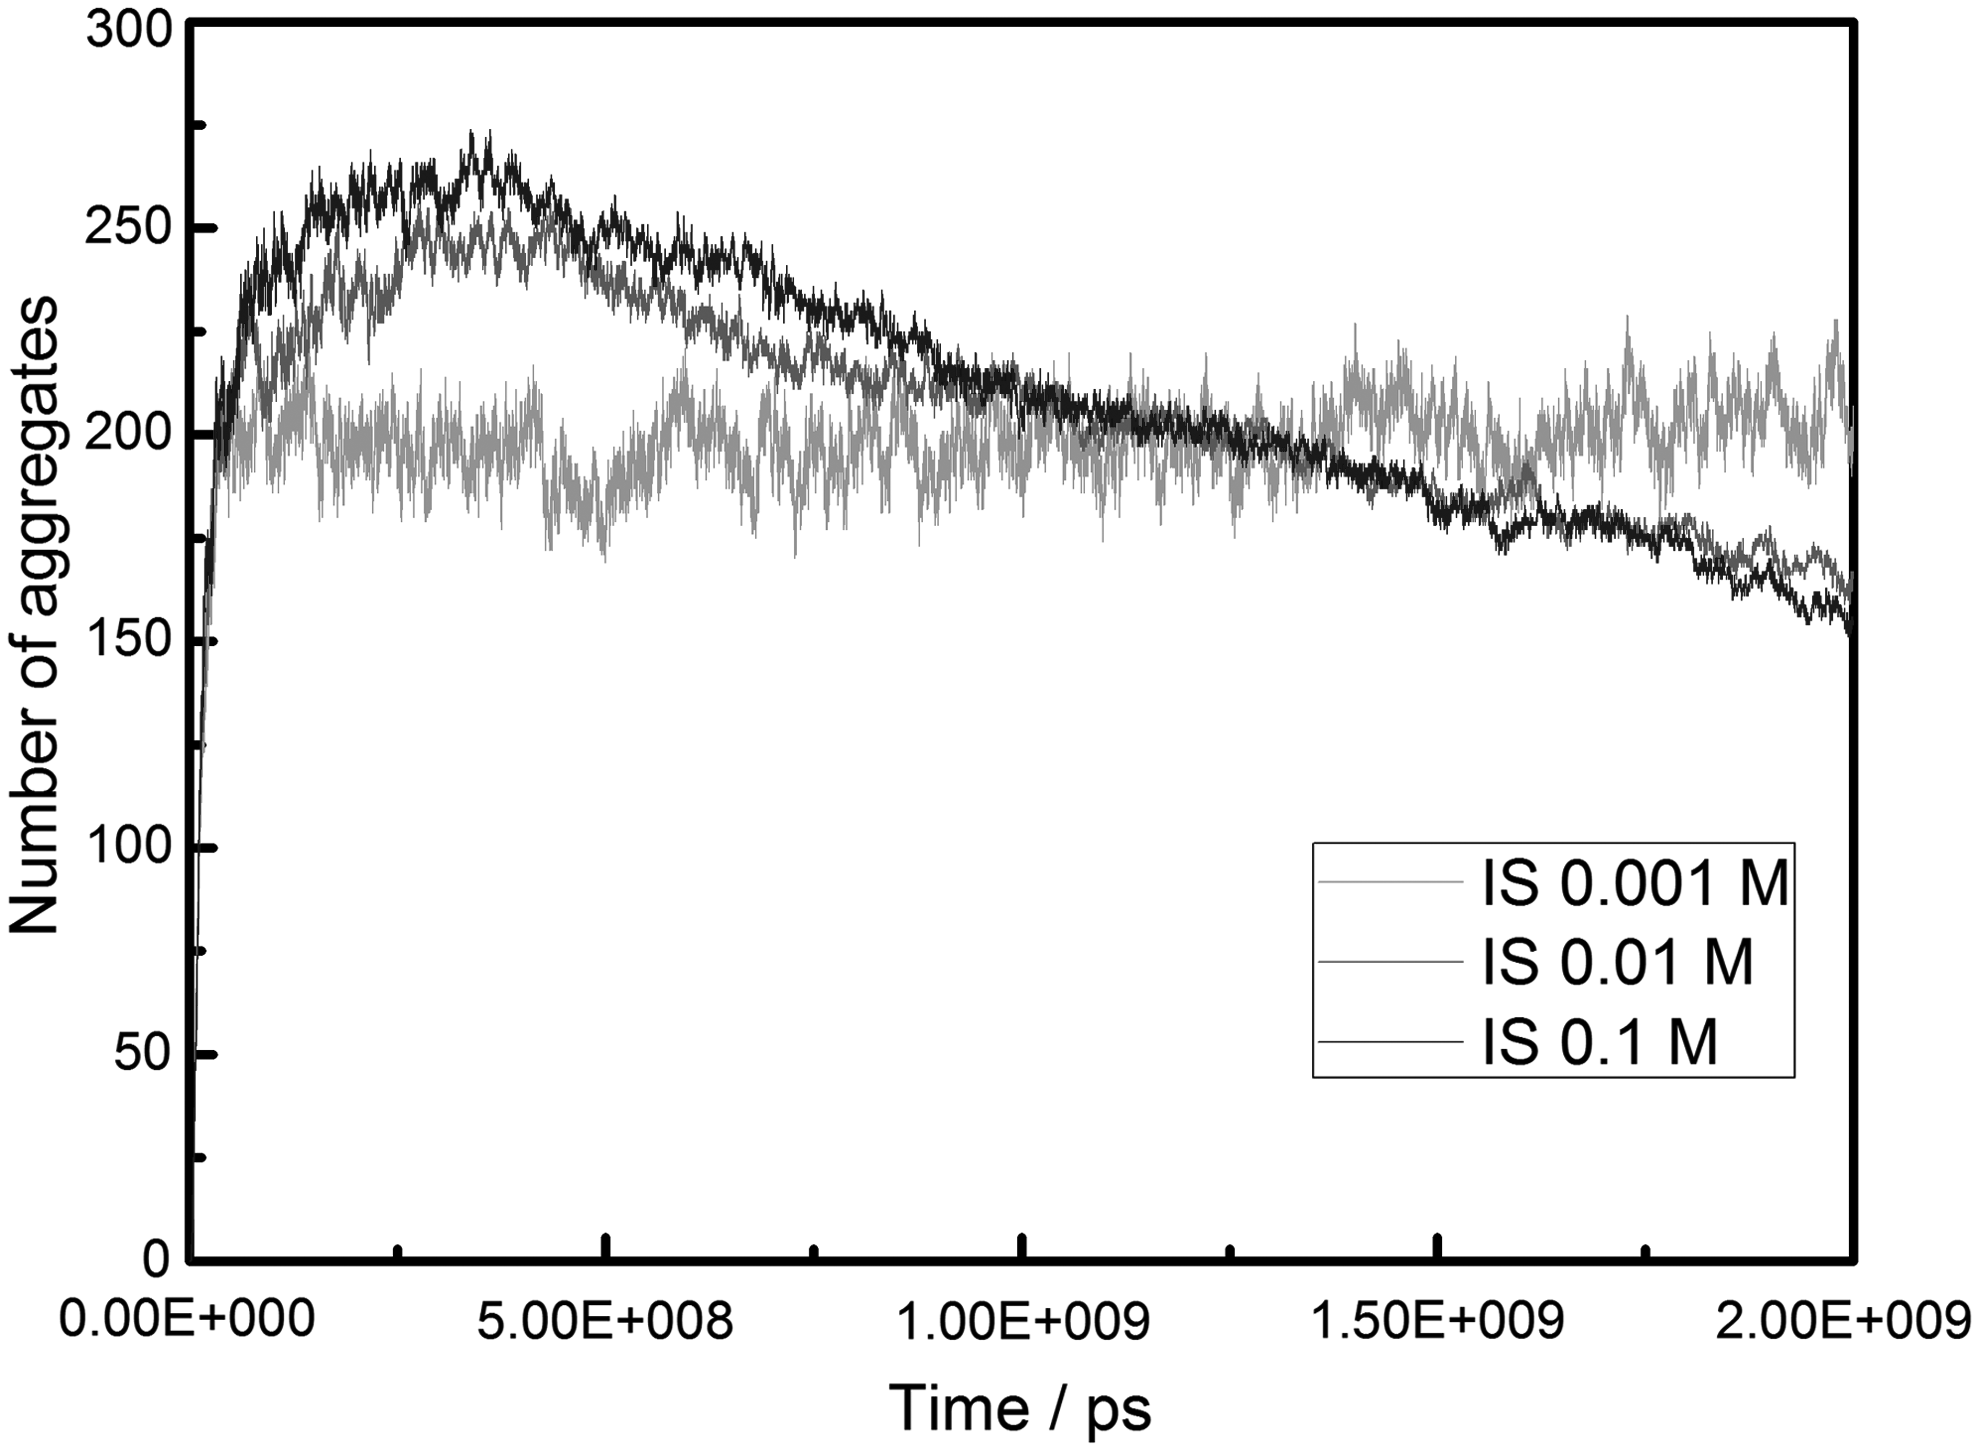
Variations of number of aggregates under different ionic strength conditions (IS = 0.001, 0.01, and 0.1 M; D 20 nm; pH 7.0).
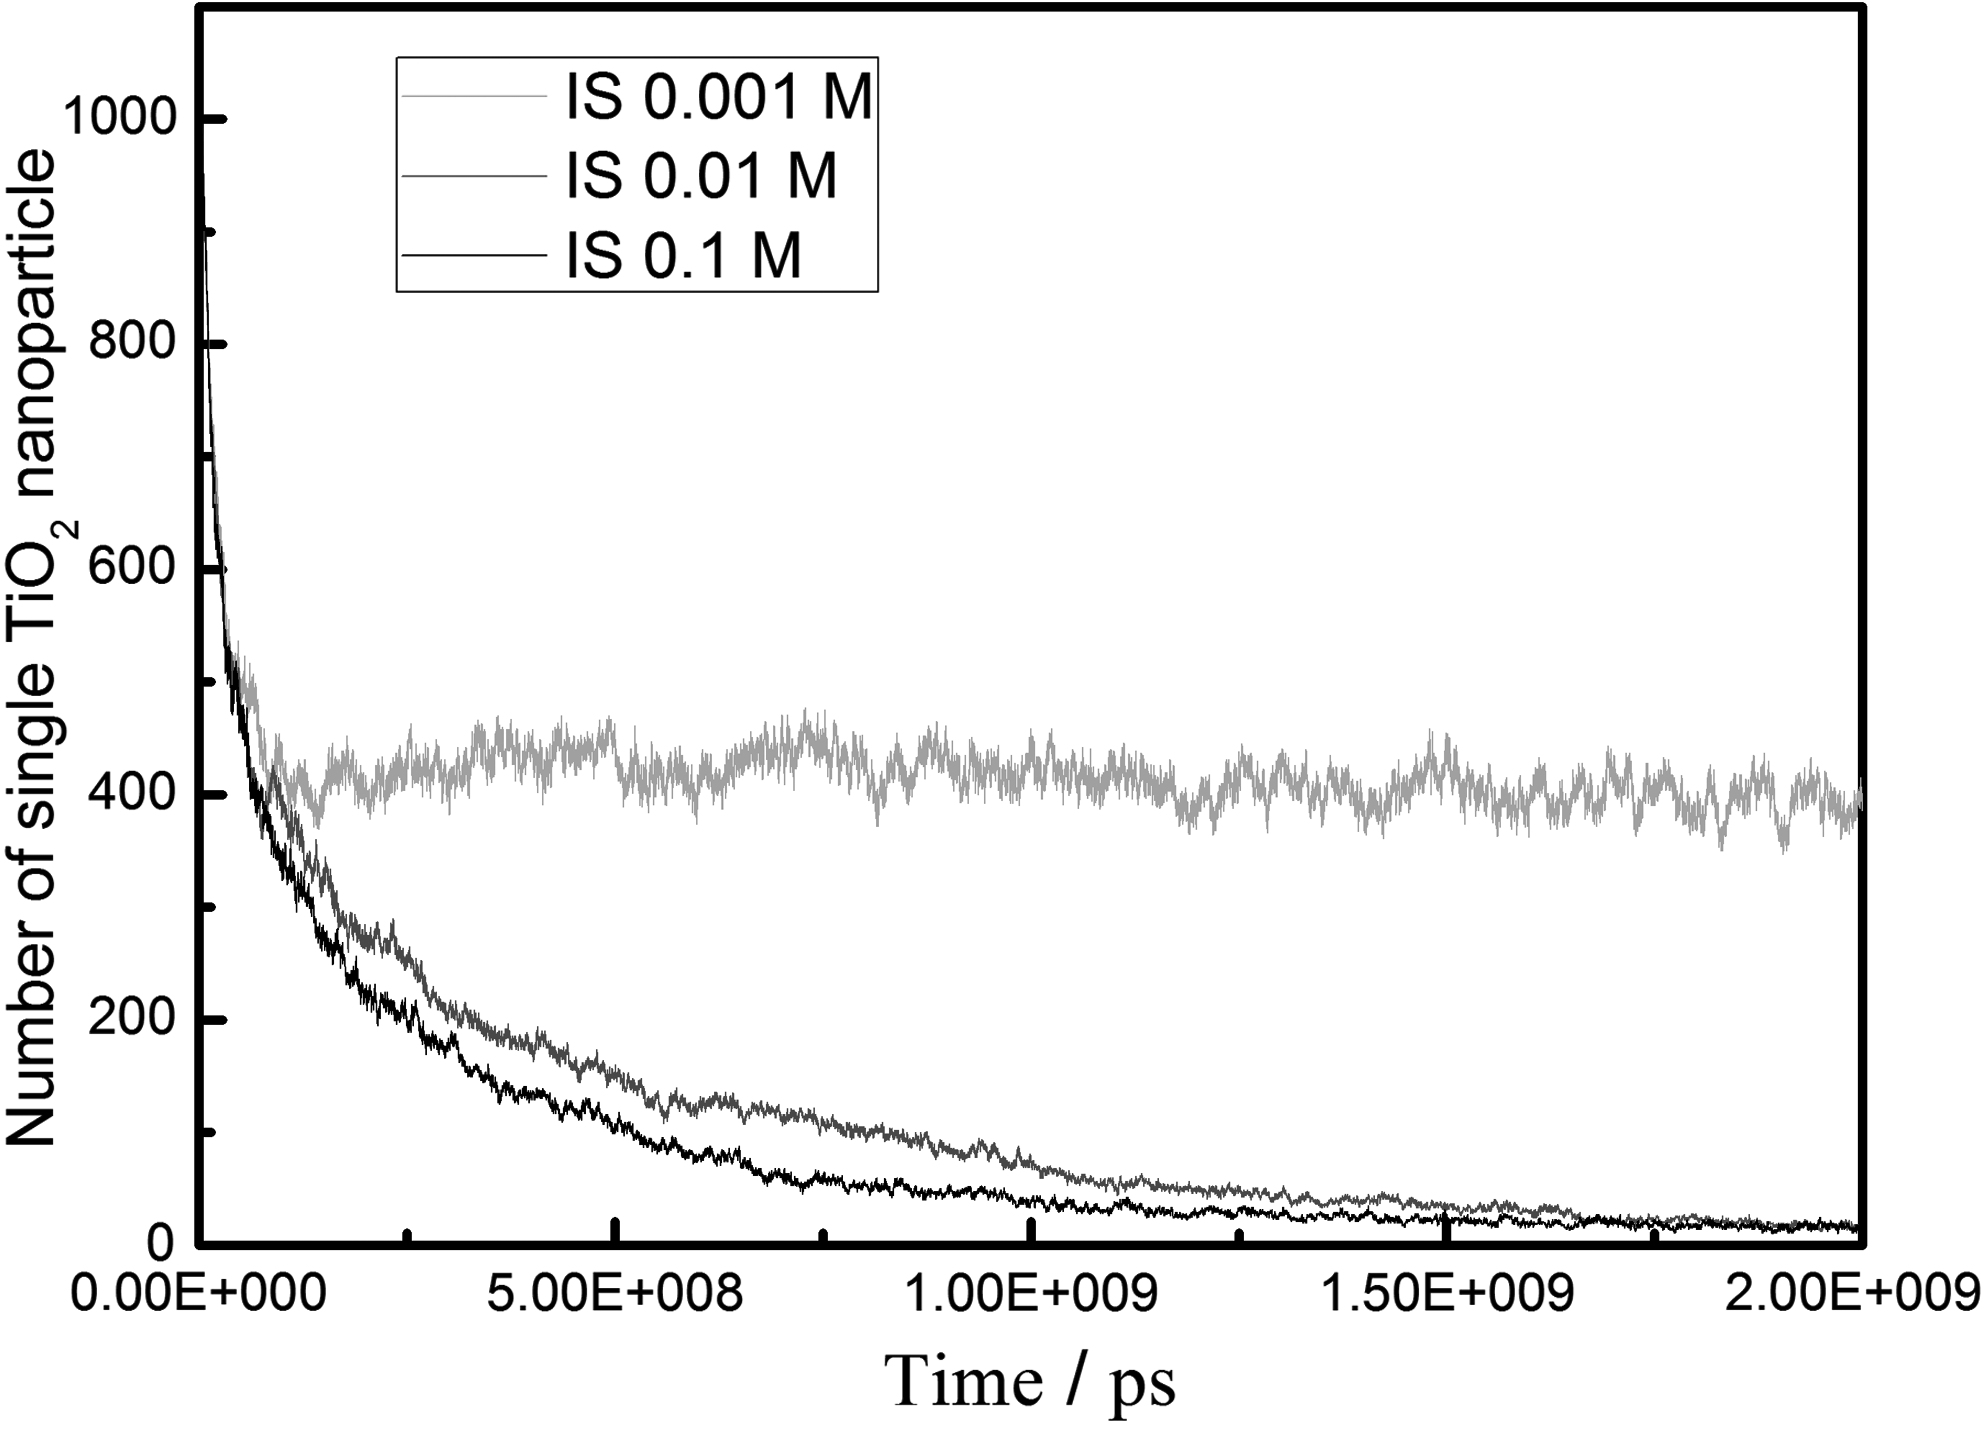
Variations of number of single TiO2 nanoparticles under different ionic strength conditions (IS = 0.001, 0.01, and 0.1 M; D 20 nm; pH 7.0).
Size distributions of TiO2 aggregates under different ionic strength conditions are displayed in Fig. 13. At 0.001 M, the aggregates were mainly distributed in group 1 (about 85.7%), with a few of aggregates in group 2 and group 3. The number of aggregates was 168, 26, and 2 in group 1, group 2, and group 3, respectively. At 0.01 M, 77, 68, 21, and 1 aggregates existed in group 1, group 2, group 3, and group 4. At 0.1 M, 61, 73, 17, and 4 aggregates were included in group 1, group 2, group 3, and group 4. The size distribution of TiO2 aggregates under different ionic strength conditions suggested that the aggregate size and degree of aggregation increased with the increase of ionic strength in suspensions. But there was no apparent difference between model systems at 0.01 and at 0.1 M. These results indicated that the ionic strength of 0.01 M was strong enough for the aggregation of TiO2 nanoparticles at a suspension concentration of 10 mg/L and pH 7. An increase in ionic strength caused an increase in screening of the charge and a compression of the double electric layers of TiO2 nanoparticles in suspensions, which would decrease the electrostatic repulsion between nanoparticles (Lu et al., 2016). Compared to the particle size, the effect of ionic strength was relatively weak. The primary particle size was likely to play a critical role on the aggregation of the TiO2 nanoparticles in suspension.

Size distribution of nTiO2 aggregates under different ionic strength conditions (IS = 0.001, 0.01, and 0.1 M; D 20 nm; pH 7.0).
Implications and limitations of approach
BD simulation approach will provide the quantitative insights into the aggregation process in a wide range of water chemical conditions. The results reported in the study will bridge the knowledge gaps regarding the physicochemical properties and the size distribution and numbers of aggregates in the aggregation process of nanoparticles. The smaller TiO2 nanoparticles can quickly form a great proportion of large aggregates, which may have a potential risk to benthonic organisms. Compared to the particle size, the effects of pH and ionic strength are relatively weak. At acidic matrices where pH is near to the pHpzc of TiO2 nanoparticle, such as the storm water (pH 5.6) and treated effluent (pH 6–9), more large aggregates were formed. And more small aggregates were formed under alkaline conditions (such as ground water, river, lagoon and seawater matrices, pH 8–9), which show a higher risk for environmental systems. The wide range of ionic strength examined in this study can be commonly found in surface water (river, seawater, and lagoon) and ground water. Once the nanoparticles enter into the high ionic strength matrices (lagoon or ocean), they quickly form a great number of aggregates. But at low ionic strength conditions (<0.001 M), the nanoparticles will be extensively transported. Certainly, the approach might be expanded to investigate the aggregation process of other metal oxide nanoparticles (e.g., ZnO, CeO, Al2O3, and SnO2 nanoparticles) in different aquatic matrices. However, it should be noted that the natural organic matter and divalent ion contents might be other factors that could strongly affect the aggregation of TiO2 nanoparticles in suspensions. The effect of natural organic matter and divalent ion on the size distribution of TiO2 nanoparticles in suspension should be quantitatively examined in future studies.
Conclusion
BD simulations with the DLVO theory were utilized to quantitatively characterize the aggregation process of TiO2 nanoparticles in aqueous suspensions. The effect of particle size, pH, and ionic strength of nTiO2 suspension on aggregation process was analyzed using the indicators, that is, number of aggregates, single TiO2 nanoparticles, and size distribution of aggregates. In comparison with the pH and ionic strength of suspensions, the particle size played a more crucial role on the aggregation of TiO2 nanoparticles. The size distribution indicated that more proportion of large aggregates was formed in the system containing small nanoparticles. In addition, the time for adequate aggregation increased with the initial particle size. The TiO2 nanoparticles aggregated under all pH conditions (pH 5.5, pH 7.0, and pH 9.0). The size distribution of aggregates showed that the aggregate size and degree of aggregation decreased slightly with the increase of the pH. And the ionic strength of 0.01 M was high enough for the aggregation of TiO2 nanoparticles at a suspension concentration of 10 mg/L and pH 7. These results are helpful to comprehensively understand the fate and transport of nanoparticles in environmental systems and its potential risk to aquatic organisms.
Footnotes
Acknowledgments
This work was financially supported by Youth Fund of National Natural Science Foundation of China (No. 51708086), the Funds for Key Laboratory for Ecological Environment in Coastal Areas (SOA), National Marine Environmental Monitoring Center (Dalian, China) (201805), China Postdoctoral Science Foundation (2016M601309, 2017M621280), State Key Laboratory of Urban Water Resource and Environment (Harbin Institute of Technology) (2017TS03), the Creative Research Groups of China (51121062), and the National Natural Science Foundation of China (51278147).
Author Disclosure Statement
No competing financial interests exist.
References
Supplementary Material
Please find the following supplemental material available below.
For Open Access articles published under a Creative Commons License, all supplemental material carries the same license as the article it is associated with.
For non-Open Access articles published, all supplemental material carries a non-exclusive license, and permission requests for re-use of supplemental material or any part of supplemental material shall be sent directly to the copyright owner as specified in the copyright notice associated with the article.