
Abstract
Abstract
Numerous models have been developed for calculating the fate of crude oil and natural gas plumes after deep-sea oil spills. One of the most important input parameters for these models is the rise velocity of fluid particles under the extreme environmental conditions in the deep sea (high pressure, low temperature). Consideration of these conditions in combination with the respective fluid properties, especially gas solubility in released crude oil under high pressure, is crucial for both droplet formation at the wellhead and drop rise through the water column. A model for calculation of oil-droplet rise velocities under consideration of the pressure-dependent gas-in-oil solubility is presented and validated. For this purpose, the concept of “internal degassing” that leads to a higher buoyancy of crude-oil droplets and thus an accelerated drop rise is introduced. Calculation of three different drop-rise scenarios showed high impact of this effect. For the first time high-pressure experiments using gas-saturated crude oil and artificial seawater in a counter-current flow channel were conducted. Optical recording and analysis of droplet volume during pressure release confirm the significance of predicted effect of degassing. The interplay of degassing, nucleation, and mass transfer is discussed.
Introduction
I
State of knowledge
To get a deeper understanding of the occurring multiphase flow phenomena within the water column, extensive experimental work as well as numerical investigations have been carried out in various research groups (Masutani and Adams, 2002; Socolofsky et al., 2011; Paris et al., 2012; Johansen et al., 2013; Zhao et al., 2014; Fraga et al., 2016; Murphy et al., 2016). The comprehension of these phenomena is crucial for answering the question of oil distribution across the ocean and necessary cleaning measures as well as for modeling the impact on the ecosystem. This knowledge is essential for the development of response tools for future blowouts as legacy of the DWH disaster.
One of the most crucial points for modeling the distribution and biodegradation of the released oil is the rise velocity of droplets that is directly related to the initial droplet size distribution. Zhao et al. (2014) introduced the numerical model VDROP-J. This model allows the prediction of the droplet size distribution in jets and plumes using a physical approach based on population balance equations. A more empirical approach for modeling the initial droplet size distribution in subsea oil releases, as used in SINTEF's model OSCAR, is based on a modified Weber number to predict the median droplet diameter over a wide range of nozzle sizes (Johansen et al., 2013). Most of the models predict droplet diameters of 0.3–6 mm without and 0.01–0.8 mm with dispersant (Socolofsky et al., 2015). However, during the field observations of Li et al. (2015), including nine remotely operated vehicle dives near the DWH spill site in May and June 2010 and the evaluation of droplet sizes at different depth using a holographic camera the largest oil droplets that were found had a diameter of 0.5 mm at mean values between 50 and 370 μm. For this reason, other mechanisms than droplet sizes of multiple mm and group rise effects could have contributed to the observed rapid surfacing of parts of the oil within hours. Whereas the bubbles and droplets are dominated by a strong influence of jet momentum in the region directly above the wellhead, they are usually assumed to be more dominated by buoyancy and gravity forces in the so-called near field. At this point, stratification of hydrocarbon plumes in so-called intrusion layers occurs. This and the superposition of currents is considered in the TAMOC modeling tool (Socolofsky et al., 2011). After leaving the near field, the bubbles and droplets enter into the far field that covers the subsurface transport of the oil throughout the ocean outside the plume and that is modeled numerically using a three-dimensional Lagrangian approach. This enables tracking of oil masses in the water (Paris et al., 2012).
Some of the most important oil spill prediction models have been compared concerning the initial droplet sizes as well as the near-field and far-field transport for different blowout scenarios with and without the addition of chemical dispersants (Socolofsky et al., 2015). In the recent past, high-pressure conditions and the specific physical properties of “live oil” that contains dissolved natural gas have been taken into consideration for modeling and the design of experiments by some groups. Moreover, the combined release of oil droplets and gas bubbles at varying flowrates and nozzle sizes as well as the impact of dispersant addition and its effectiveness were investigated (Zhao et al., 2015, 2017; Brandvik et al., 2017). However, each of the models assumes a homogeneous oil phase whereas the occurrence of phase changes due to the pressure release remains unconsidered.
Rise velocity of oil droplets under deep-sea conditions
The longer the oil droplets' residence time in the water column is, the longer multiple effects can impact the oil. Some of these effects are the horizontal transport of the oil in intrusion layers due to ocean currents, sedimentation of parts of the oil, dissolution of several oil components, and microbial degradation of the hydrocarbons. Hence, the droplet rise velocity is a crucial quantity for the accurate characterization and modeling of the oil distribution as a result of subsea blowouts and the consequent environmental impacts. Often the actual deep-sea conditions, especially the elevated pressure and the difference between live-oil and dead-oil properties and behavior, are neglected in the models. This causes major uncertainties concerning both the droplet size distribution and the rise velocities and consequently the residence time of oil droplets, which leads to inaccurate distribution and ecosystem modeling results. Recent investigations show an influence of gas saturation and pressure on the drop formation, which is also known from technical applications (Antonyuk, 2014). But the above-mentioned factors are supposed to not only influence the drop formation but to promote droplet rise through the water column, too. For this reason, in the following a new approach for modeling the rise velocities of single live-oil droplets through the water column that incorporates the aforementioned effects will be introduced and validated experimentally.
Modeling Procedure
Approach and assumptions
Stationary rise velocity of an oil droplet on its rise path from the seafloor to the surface can be calculated using numerous correlations. The droplets shall be assumed as ellipsoidal fluid particles with a contaminated interface between the multicomponent crude oil phase and the continuous seawater phase. For this purpose, a procedure from Clift et al. (2005) is applied. In this approach the Eötvös number
and the Morton number
are calculated with the gravitational acceleration g, density difference between the two phases
is introduced. Depending on its magnitude, another dimensionless quantity
is determined. The stationary particle rise velocity
is then calculated using the Morton number and J. These equations are valid for
greater than 0.1. The applied correlation is therefore not valid for highly irregularly shaped droplets but for oscillating and nonoscillating ellipsoids. Mutual influencing of droplets, like coalescence, bouncing, breakup, and any swarm effects, or any mass transfer across the phase boundary remain unconsidered.
Crude oil that contains large quantities of natural gas is called “live oil” unlike the so-called “dead oil” that contains only very small quantities of gas, related to ambient conditions (Gros et al., 2016). The high gas-to-oil ratio of about 285 m3/m3 in case of the DWH blowout prompts the assumption that the oil that exits the wellhead is saturated with gas (Reddy et al., 2012). Due to the pressure decrease during the droplet's ascent through the water column from about 15 MPa at a depth of 1,500 m to ambient pressure at the sea surface, the gas solubility in the live oil decreases along the rise path of the oil droplet. Consequently, the oil is assumed to be most likely always saturated with gas and its ascent leads to oversaturation and hence degassing. Since the gas components, like especially methane, are nonpolar, the majority of the gas tends to not dissolve in the surrounding water but to stay inside the oil droplets. When oversaturation occurs due to the pressure release, nucleation and growth of tiny gas bubbles inside the oil droplet are to be expected. The level of supersaturation that is required for bubble formation depends on the presence of nucleation sites that lower the energy barrier for nucleation (Liger-Belair et al., 2002). When exiting the wellhead, in case of DWH the oil was highly supersaturated and depressurized rapidly (pressure drop was ∼8.6 MPa only over the BOP in case of the DWH spill; Aliseda et al., 2010). A certain amount of gas will undoubtedly leave the droplet because of dissolution of gas into the surrounding seawater. But due to the nonpolar nature of methane its diffusion into present bubble nuclei within the droplet is more energy-efficient. Hence, most of the released gas tends to stay inside the droplet, giving rise to the term “internal degassing.”
In case of the DWH blowout, with 82.5 mol-% methane was by far the most abundant component among the C1–C5 hydrocarbons (Reddy et al., 2012). Thus, for the simplified modeling the gas shall be assumed to behave like pure methane concerning its physical properties and its influence on the droplet. Diffusion or any kind of “external degassing” is disregarded, which is a basic assumption. The formation of gas bubbles at the outside of supersaturated droplets is not likely to occur, since the interfacial tension between methane and water is much higher than that between methane and oil. The appearance and growth of gas bubbles inside the droplets lead to three complementary major effects. The first one is the increasing droplet diameter with decreasing pressure according to
with the droplet volume
consisting of the volume of the oil fraction
with the densities of crude oil and methane,
Input data and mathematical modeling
Jaggi et al. (2017) investigated the saturation concentration of methane in Source B crude oil, which is the oil that was released during the DWH blowout and was collected from the Macondo exploratory well (MC252) on May 23, 2010. To that end, the crude oil was pressurized in a methane atmosphere until equilibrium was reached. After depressurization to ambient, the amount of released methane was detected and taken as a measure for the dissolved methane at the respective elevated pressure. The saturation concentrations were measured as triplicates and the standard deviation was less than 0.32 mg mLoil−1 for all pressure conditions (Jaggi, 2017). A linear correlation according to Henry's law is assumed, hence the function is a line of best fit through the origin. The slope of the curve is 2.8 mg (mLoil MPa)−1.
Densities of both Louisiana Sweet Crude (LSC) oil, which is used as surrogate for experimental investigations related to the DWH accident and whose physical properties and chemical composition are relatively similar to those of Source B oil, and the artificial seawater at different relevant pressures are investigated by Laqua (2017a, 2017b). The artificial seawater is prepared following the recipe of Kester et al. (1967). The density of methane is calculated using the Peng-Robinson equation of state (PREOS) that expresses the gas properties as a function of its critical properties and its acentric factor
For the quasi-stationary calculation of the droplet's volume, density and velocity evolution, first the amount of released methane per mL of oil is identified using the solubility data. With this value, the ratio of the current droplet volume to its initial value
and the gas void fraction
are calculated. The overall droplet density is then computed according to Equation (10). The ratio of the current droplet diameter to the initial droplet diameter is the result of Equation (11) raised to the 1/3 power. The droplet rise velocity is calculated using Equations (1)–(6), with the current values for the densities and the droplet diameter, respectively, using MATLAB (Symbolic Math Toolbox).
Flowsheet simulation
A flowsheet modeling and simulation of the degassing of methane from crude oil is carried out using the software Aspen Plus to validate the above-mentioned experimental physical data and the modeled evolution of the oil droplet's volume and gas void fraction. First, the involved substances and systems are to be defined and an appropriate so-called “property method,” consisting of several thermodynamic models and empirical equations, has to be chosen. These are the most crucial and also the most error-prone steps in the whole modeling and simulation procedure, especially when dealing with complex systems like crude oil. The most common calculation methods for the modeling of crude oils are equation-of-state (EOS) models like the Peng-Robinson EOS (Gros et al., 2016). For the present work, the property method “PENG-ROB” is applied. It uses the Peng-Robinson EOS for all thermodynamic properties except the liquid molar volume, the API method for calculating the molar volume and the Rackett model for real components (Aspen Technology, 2011).
A gas-chromatography amenable portion of the oil released from the Macondo well in 2010 has been analyzed by Reddy et al. (2012) chromatographically. Almost 150 oil components were identified. The C1–C5 hydrocarbons are composed predominately of methane (∼80%), which is hence the most abundant component of the gaseous phase and shall be assumed as representative for the gas phase in the flowsheet simulation according to the presented experimental and modeling approaches. In practice, for the modeling of multicomponent mixtures like crude oil, the components are usually divided into several groups, the so-called “pseudo-components,” since modeling considering every single species is very complicated. The fractionation of the components is commonly based on boiling point ranges. For each pseudo-component fractional physical properties, such as density, molecular weight, and critical properties, have to be estimated (Chang et al., 2012).
For the modeling procedure, the process type “OIL-GAS” is selected. Oseberg Norway crude oil is chosen from the Aspen Assay Library, since this light crude oil has similar properties to LSC oil, which is used for the experimental investigations. The second relevant component is methane, which is registered as a pure component. To simulate the degassing behavior of the oil, it first has to be fully saturated with methane. For this purpose, a mixer is applied as apparatus in the model at an operational pressure of 300 bar to ensure methane saturation of the oil. Then, for modeling the release conditions at the wellhead, the liquid phase is transferred to a type “Flash2” separator, where a gas-liquid separation takes place at an absolute pressure of 151 bar and a temperature of 4°C. The liquid stream exiting this flash apparatus is used as the initial gas-saturated oil stream. Further 24 “Flash2” separators are implemented to simulate the condition changes during a drop rise through the water column stepwise, using the appropriate pressure and temperature profiles until the final conditions of 1 bar and 23°C at the sea surface. The first 1,400 meters are divided into 100-m steps, accounting for 14 separators. As the changes in volume and gas void fraction become much bigger within the upper 100 m the spatial resolution is enhanced by a factor of ten in this area, making for another 10 separators.
Volume ratio according to Equation (11) is again calculated to investigate the (virtual) droplet's growth. In the case of the flowsheet simulation, the volume ratio
is calculated for each step using the flow rates of the liquid and gaseous phase, respectively. The gas holdup of the virtual droplet is calculated as
for each individual step n.
Experimental Setup and Procedure
Expansion of methane-saturated crude oil droplets under artificial deep-sea conditions is investigated in a high-pressure screening cell. The experimental setup consists of three major units, see Fig. 1. In the filling/circulation unit the observation unit is filled with artificial seawater. Pressures up to 160 bar can be adjusted using a pressure piston. A gear pump is used to generate a circular flow (downward direction inside the screening cell). The centerpiece of the observation unit is the high-pressure screening cell. Two observation windows on either side of the cell enable optical capturing of the droplets inside the apparatus. The oil droplets are formed via a 1/16-inch capillary with an inner diameter of 125 μm at the bottom of the cell. An hourglass-shaped glass tube is located between the observation windows. The rising droplets can be fixed in the counter-current flow below the tapering of the glass tube. This facilitates the capturing of the droplet's shape and volume over any period of time. To provide reproducible conditions a Julabo FP40-ME cooling circulator and an insulating jacket are applied to keep the temperature at a constant level.

Flow diagram of droplet rise observation experiments, showing three main units of experimental setup–filling/circulation unit, observation unit, and oil presaturation unit. All experiments are carried out at 20°C. V, valve; P, pressure sensor; T, temperature sensor, M: manometer.
While the temperature profile starts at about 4°C in the deep sea, temperature can increase to up to 20°C or more above the thermocline, depending on location and season (Yapa et al., 2010). For the experiments, a constant temperature of 20°C was chosen, corresponding to the upper layers of the water column where most of the internal degassing is supposed to occur. The methane concentration profile in the aftermath of the DWH spill had a maximum in the deep plume and much lower concentrations in the upper layers, but still above background concentration (Camilli et al., 2010; Yvon-Lewis et al., 2011). In the experiments, the continuous seawater phase was initially unsaturated with methane, corresponding to the upper limit of possible dissolution in the surrounding water and therefore the lower limit of potential degassing. The hydrodynamic conditions change from a highly turbulent multiphase jet exiting the broken BOP with a substantial pressure drop that promotes bubble nucleation and droplet/bubble breakup via a rising bubble and droplet swarm in the plume through to the rise of single droplets above the intrusion layer. The single droplets in the experiments are held in a laminar flow. Thus, the reproducible experimental conditions mainly correspond to the rise of single droplets above the intrusion height concerning the hydrodynamic conditions as well as the temperature and methane concentration levels.
In the oil presaturation unit LSC oil is saturated with methane at 150 bar. For this purpose the crude oil is pressurized with methane inside a pressure tank. The pressure is maintained with the aid of an ISCO 500D syringe pump until equilibrium is reached. After presaturation, the pressure inside the screening cell is set to 160 bar. The valve V-6 is opened and the pressure inside the cell is reduced below 150 bar until a droplet forms at the tip of the capillary. When the droplet detaches, the valve is closed and the gear pump is switched on. The pressure is released to ambient pressure at different decompression rates (“live oil” cases: 10 bar/min, 5 bar/min, 1 bar/min; unsaturated “dead oil” comparison test: 10 bar/min). All experiments are carried out as triplicates. The droplet's shape and size is captured with background illumination using a pco.Dimax HS2 high-speed camera and an LED panel.
Contours of the droplets are evaluated automatically with the aid of the image processing software ImageJ. After scaling the images to match the dimensions in px to the known dimensions of the apparatus in mm, a background picture is subtracted from the series and the gray-value images are binarized. Then, the outline of the approximately ellipsoidal droplets can be recognized and the position of the droplet as well as its minor a and major b axis is stored for each frame. The volume of the droplets is calculated according to
and the equivalent diameter of a sphere with the same volume is determined using Equation (8). For the last images of each experiment the evaluation is done manually due to large deviations from the ellipsoidal shape. To get dimensionless and thus comparable results for droplets of different sizes, the volume and equivalent diameter are divided by their initial values, like in the Equations (11) and (13).
Results
Prediction of droplet rise behavior
In Fig. 2, both the change in the overall droplet volume Vp, depicted in a dimensionless form by dividing it by its initial value
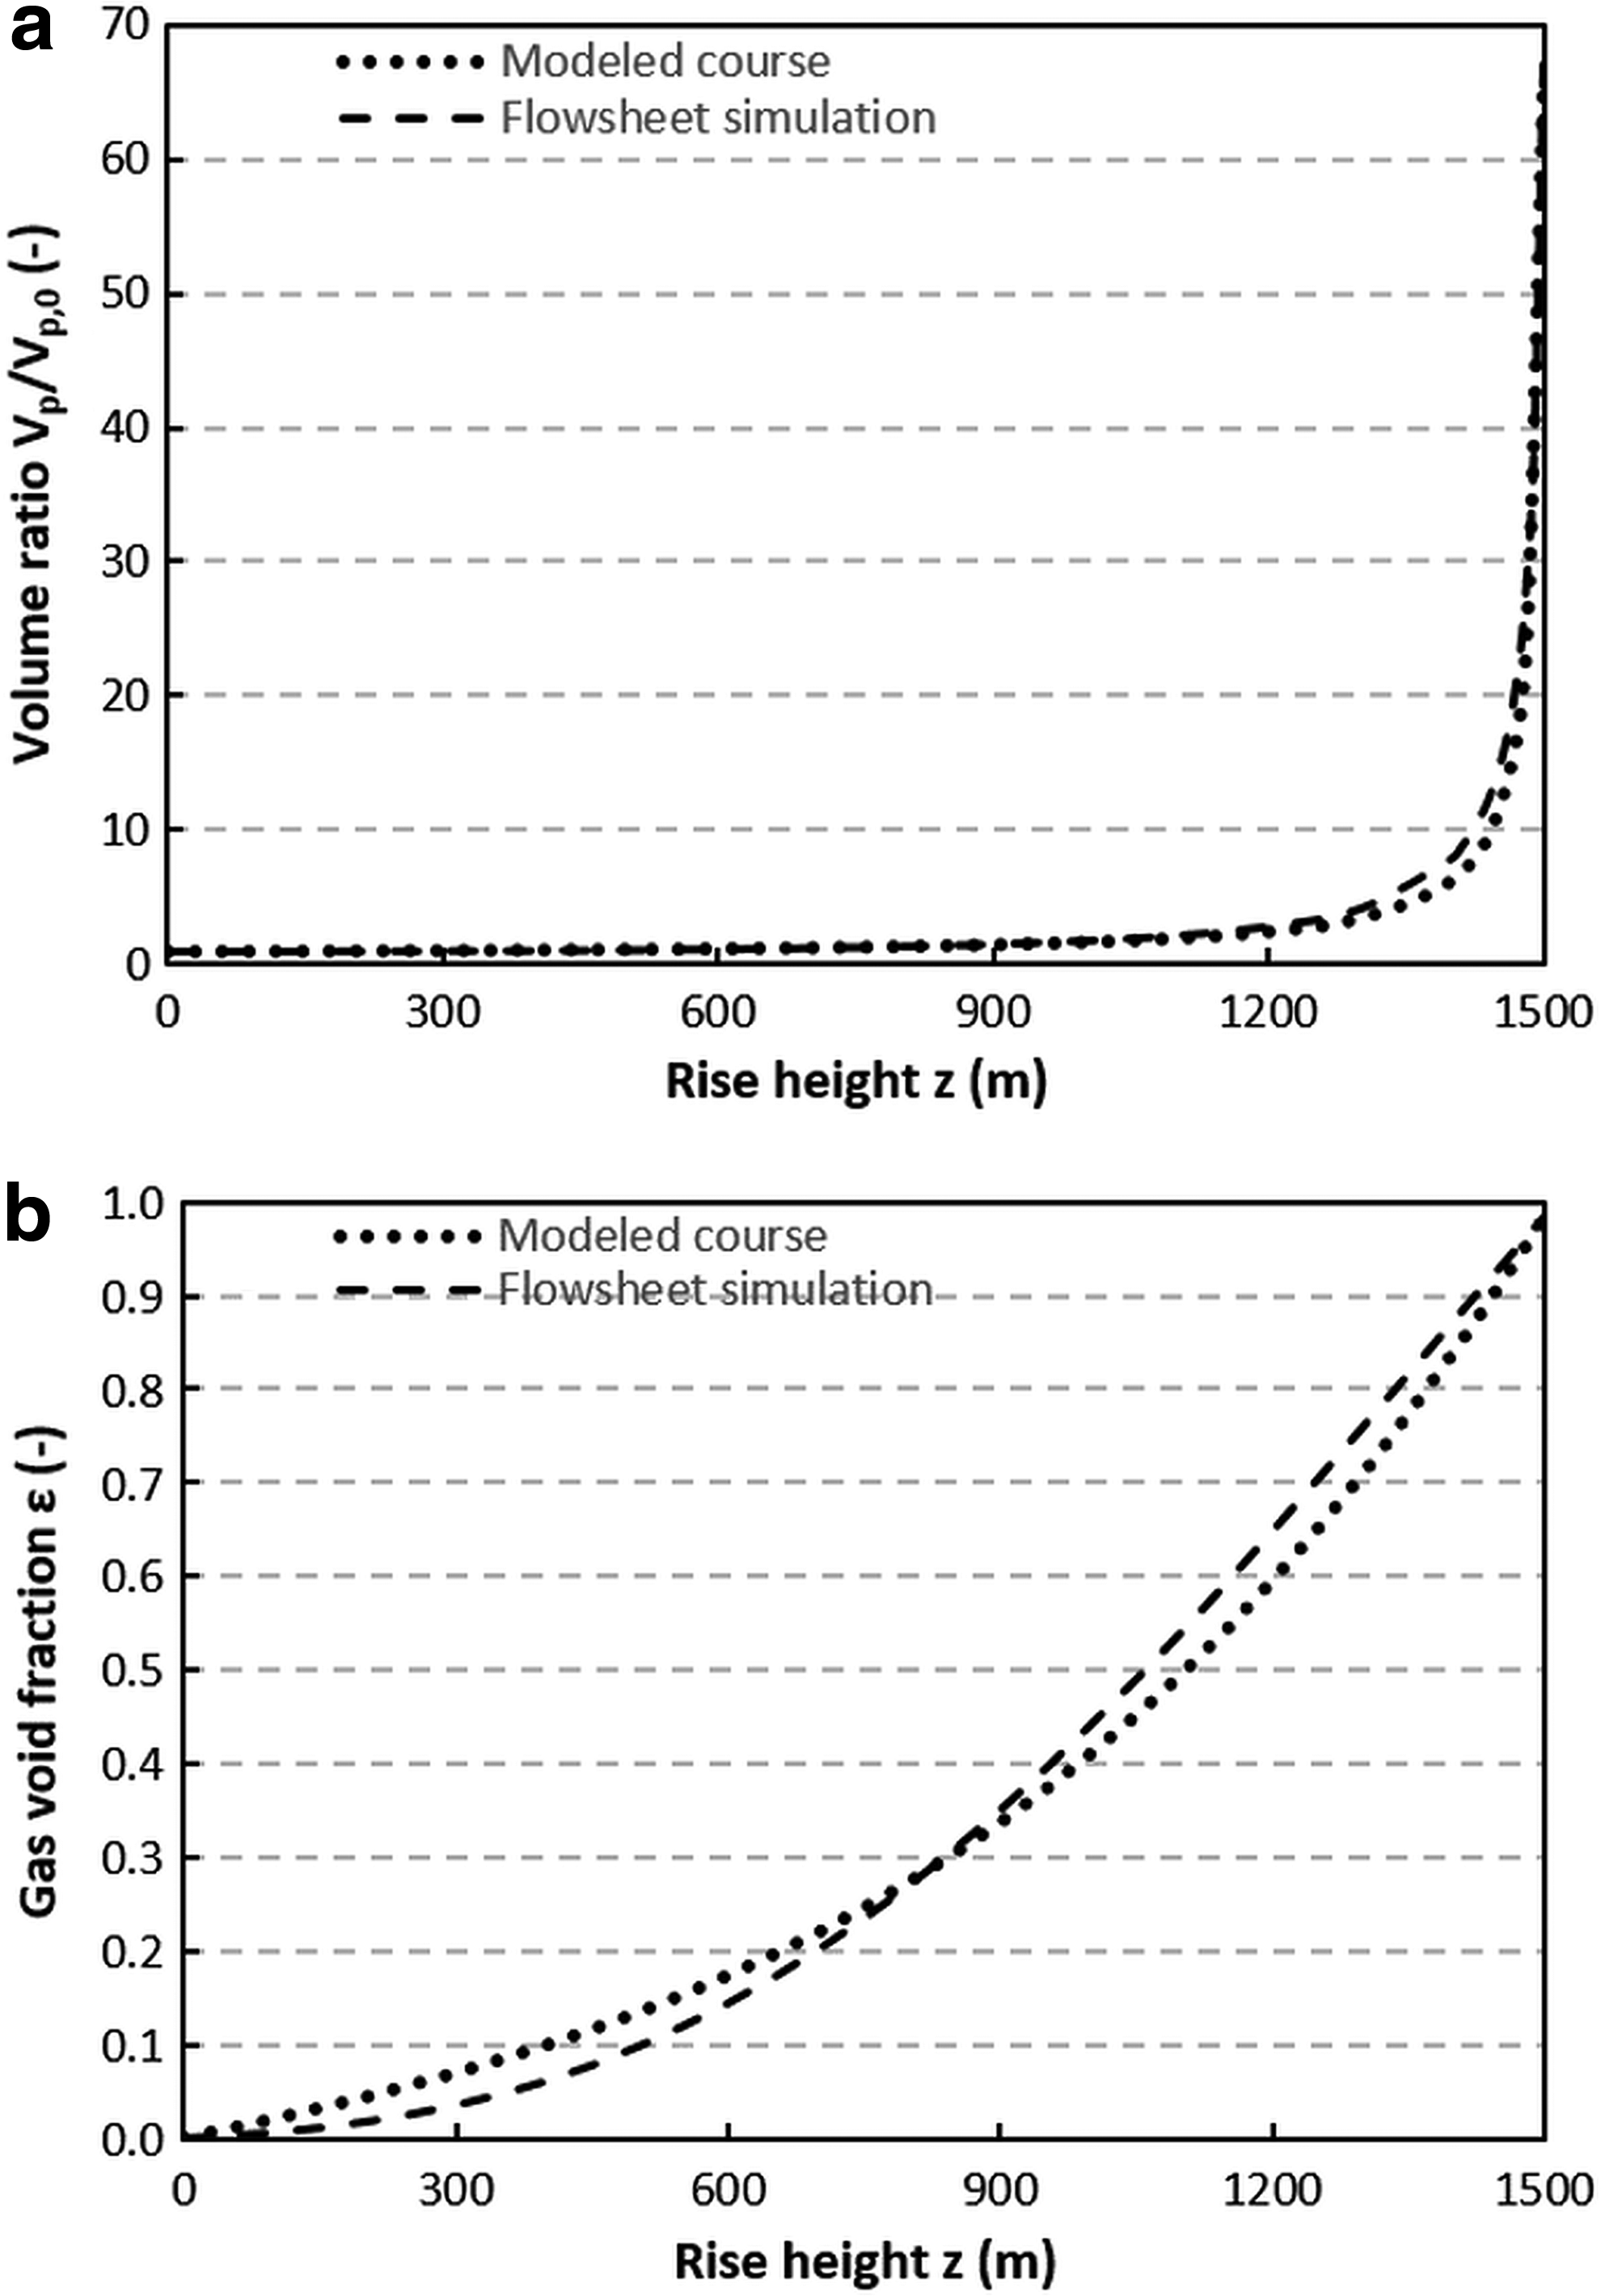
Increasing volume
For both the volume ratio and the gas holdup the obtained curves are almost identical for the two applied methods. Thus, the results of the modeled degassing along with the used input data that have been obtained experimentally and those of the flowsheet simulation match extremely well. Therefore, the results of the flowsheet simulation confirm the validity of the modeling procedure and the underlying solubility data.
According to Equation (8), the curve of the increasing volume (Fig. 2a) is transformed to the curve of the ratio of the equivalent droplet diameter to its initial value plotted against the droplet's rise distance through the water column, see Fig. 3a. After a period of relatively weak growth, the diameter ratio grows distinctly within the upper 300 m and reaches a final value of ∼4. The decrease in the overall droplet density over the rise height, shown in Fig. 3b, pursuant to Equation (10) stems from the increase of gas void fraction, shown in Fig. 2b, and the decrease of gas density. As explained previously, the increasing diameter of the droplet and its decreasing density add up to an accelerated droplet ascent. Using Equation (6), the curve of rise velocity over rise height (Fig. 4) is obtained. The velocity is steadily increasing from 0.03 to 0.19 m/s.
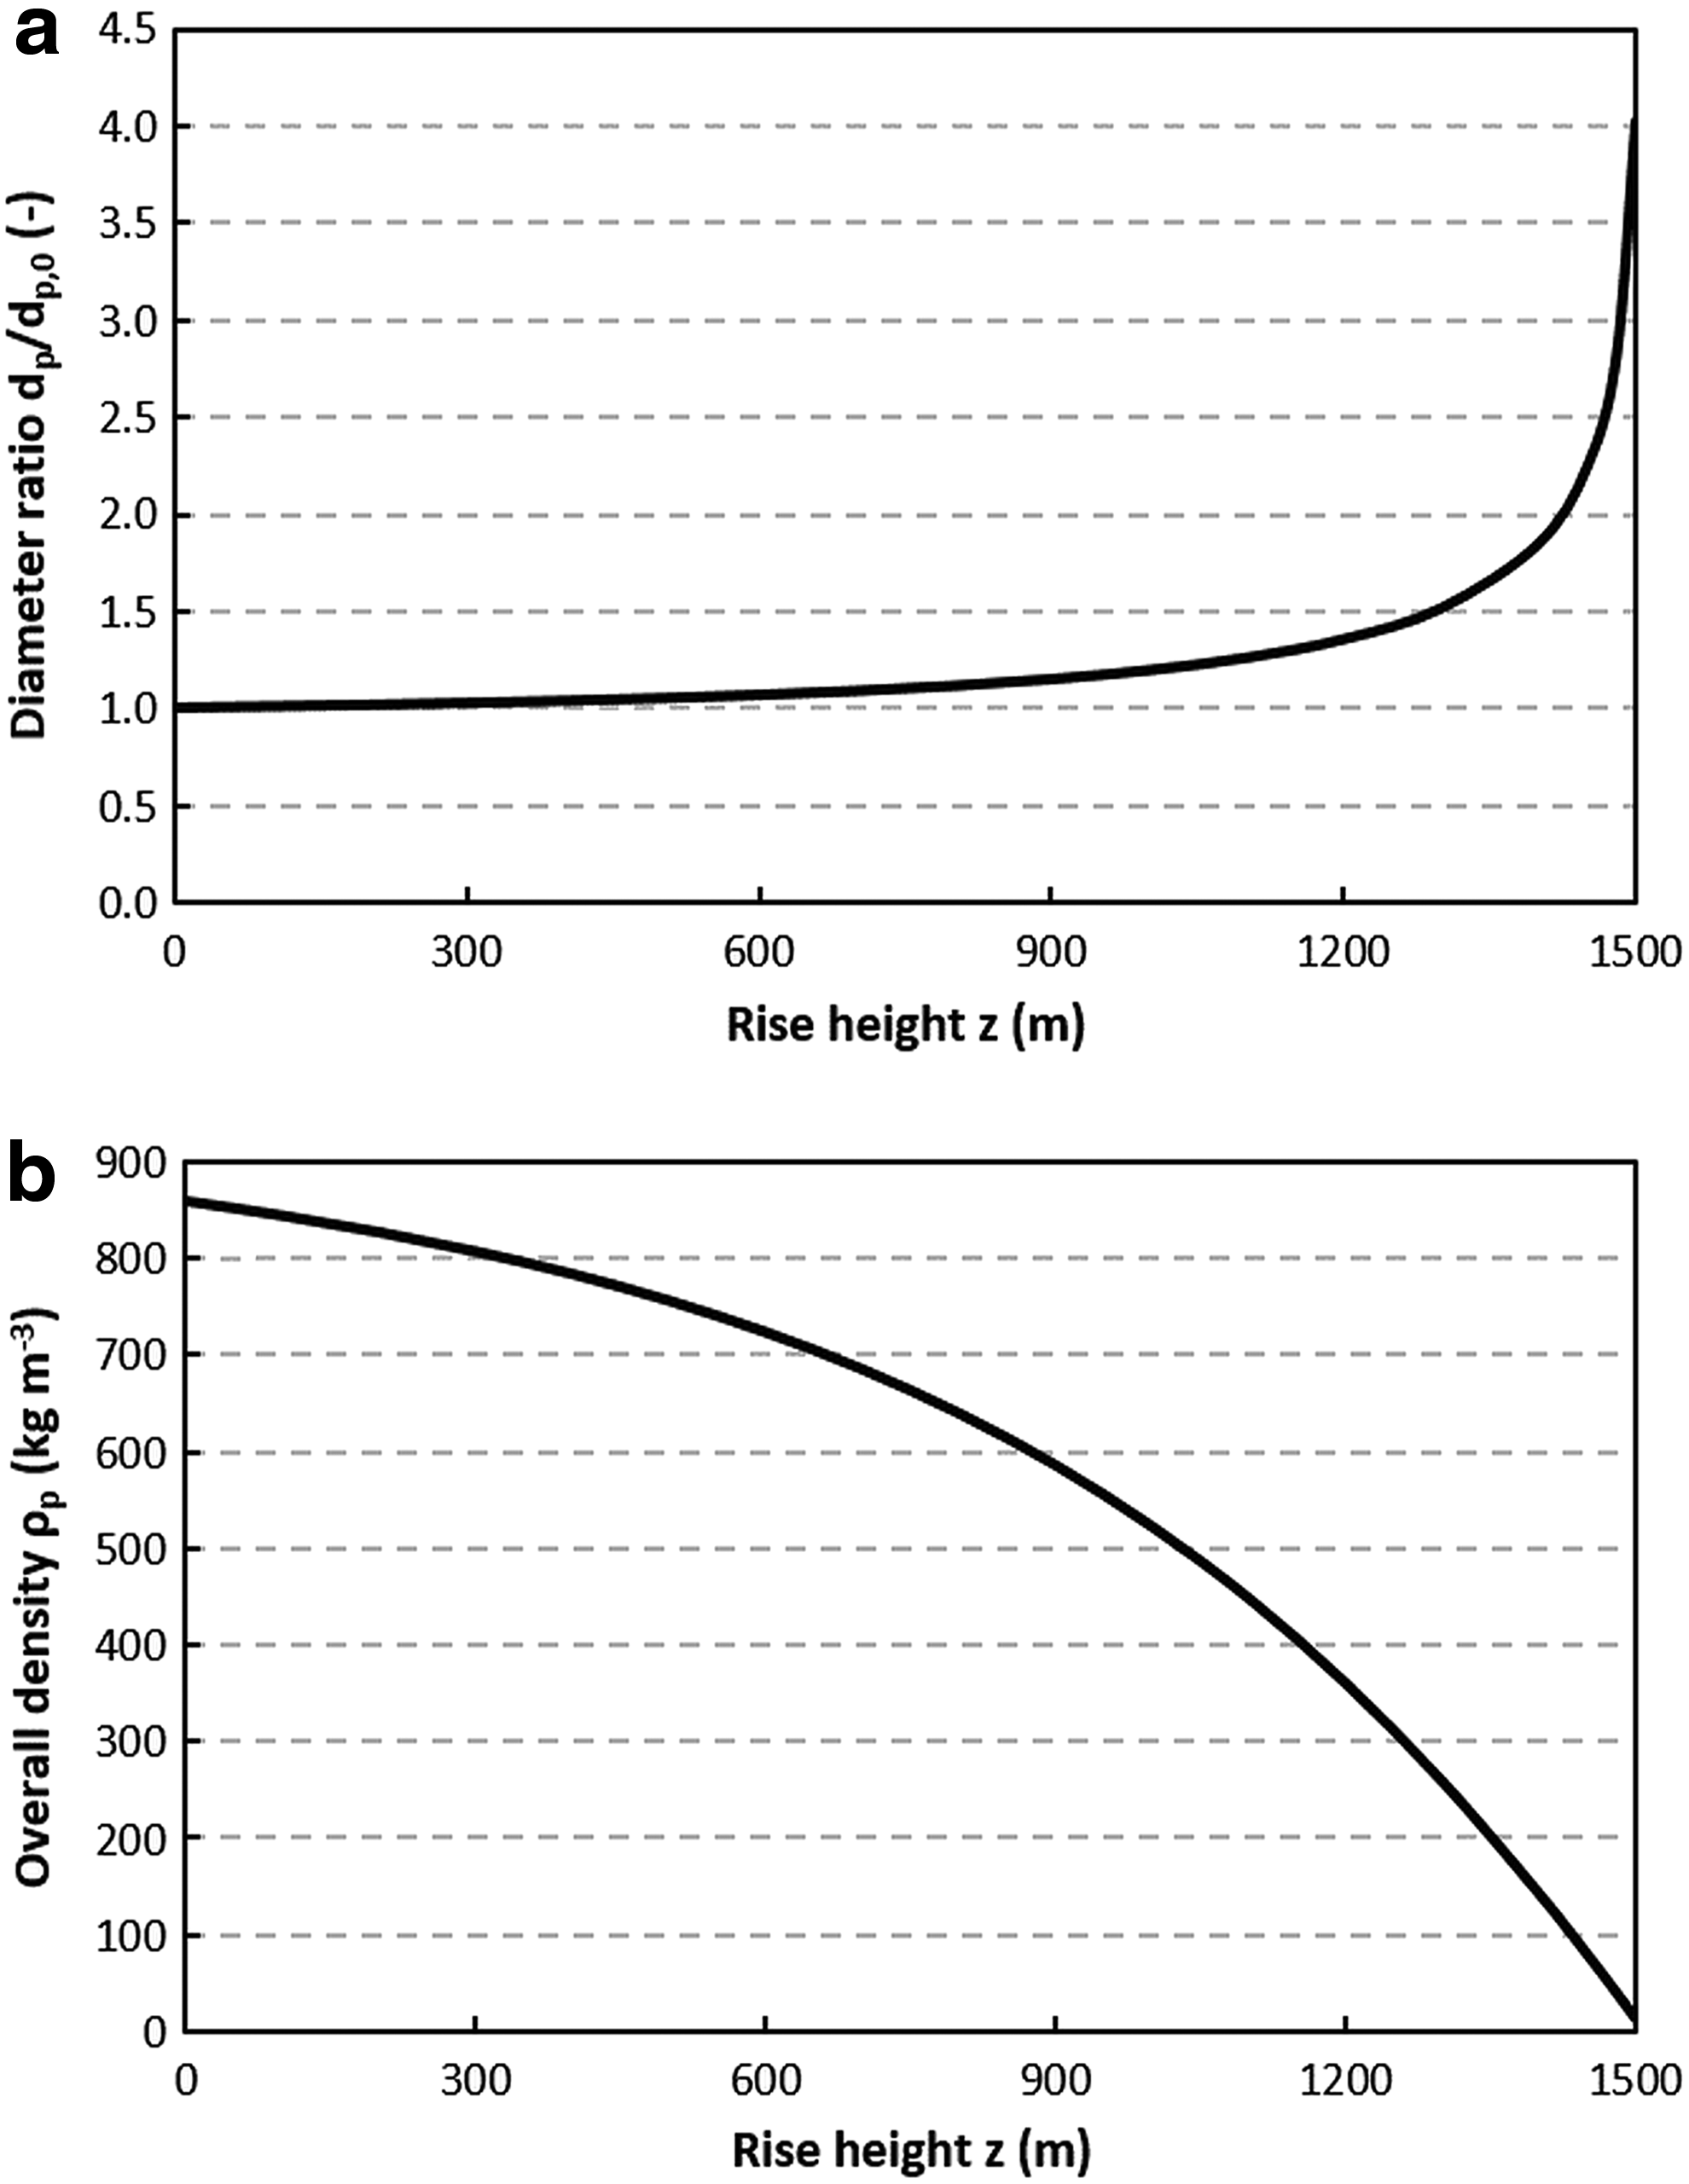
Increasing diameter ratio
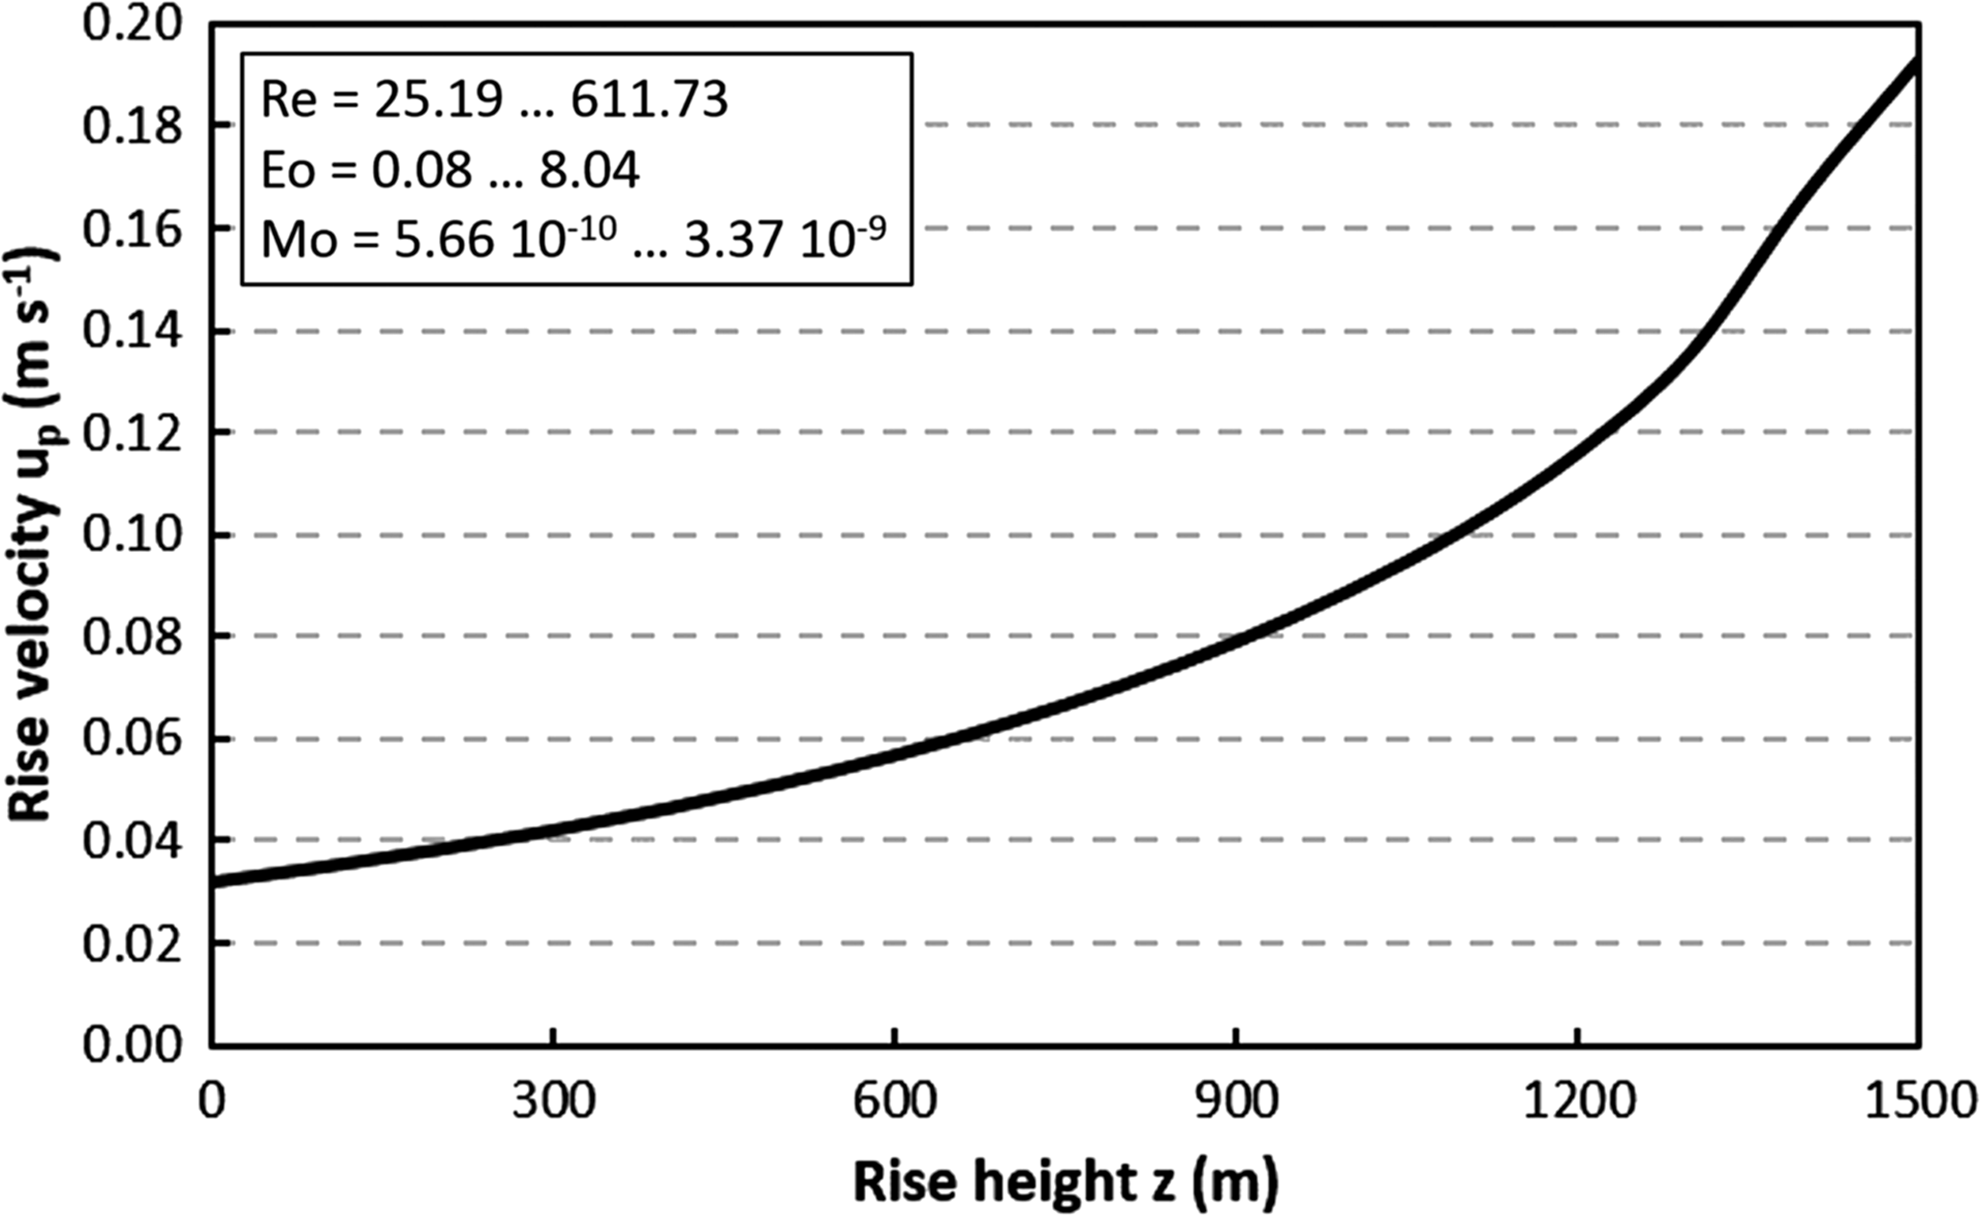
Calculated curve of the rise velocity evolution of a methane-saturated LSC oil droplet with an initial diameter of 1 mm through 1,500 m of water column dependent on the rise height.
Case study
To get an idea of the impact that internal degassing, as modeled in the previous sections, has on the drop rise compared to droplets rising without degassing, a case study is carried out. The initial droplet diameter is set to 1 mm, which lies in a realistic range of droplets formed at the DWH wellhead. The degassing-accelerated rise of a 1-mm droplet through 1,500 m of water column, lasts almost 7 h, if one follows the above-mentioned approach and assumptions. While the droplet's diameter is quadrupling its velocity is steadily increasing up to a final value of 0.19 m/s at a mean velocity of 0.06 m/s (Case 1). This case corresponds to Fig. 4. At the other extreme, a stationary ascent of a 1-mm droplet without any degassing effect lasts more than twice as long at a rise velocity of 0.03 m/s (Case 2). If we assumed a stationary ascent that lasts as long as the accelerated case (6.7 h at a velocity of 0.06 m/s), the droplet diameter would be ∼1.8 mm (Case 3). This case study shows that quite small droplets can reach much higher velocities than droplets of the same initial size, when internal degassing is taken into account. In case of degassing, they can reach the mean velocities of dead-oil droplets that are much bigger. All three cases are listed in Table 1.
Case 1: Accelerated rise of a gas-saturated droplet with an initial diameter of 1 mm due to degassing. Case 2: Stationary rise of a 1-mm droplet without gas saturation. Case 3: Stationary rise of a droplet without gas saturation with the same rise time like case 1.
Experimental results
In all experiments except for those using “dead oil” that are slightly shrinking, a significant volume increase occurs at the end of the experiment. This expansion can be unequivocally explained by internal degassing, as can be seen in Fig. 5 showing images of experiment 2, where the droplet volume is dramatically increasing while gas bubbles can be identified. As the droplet size increases, wall effects become dominant. The mutual influencing of droplet deformation and alteration of the seawater velocity profile is obvious but cannot be avoided due to the given geometry of the glass tube. However, a possible influence of the shape alteration and enhanced shear forces on the extent of degassing only gets important in the end of the experiments, when the droplets get large. The resulting growth factors are listed in Table 2 along with the initial droplet diameters for all 12 experiments. Figure 6 shows exemplarily the evolution of the diameter ratio
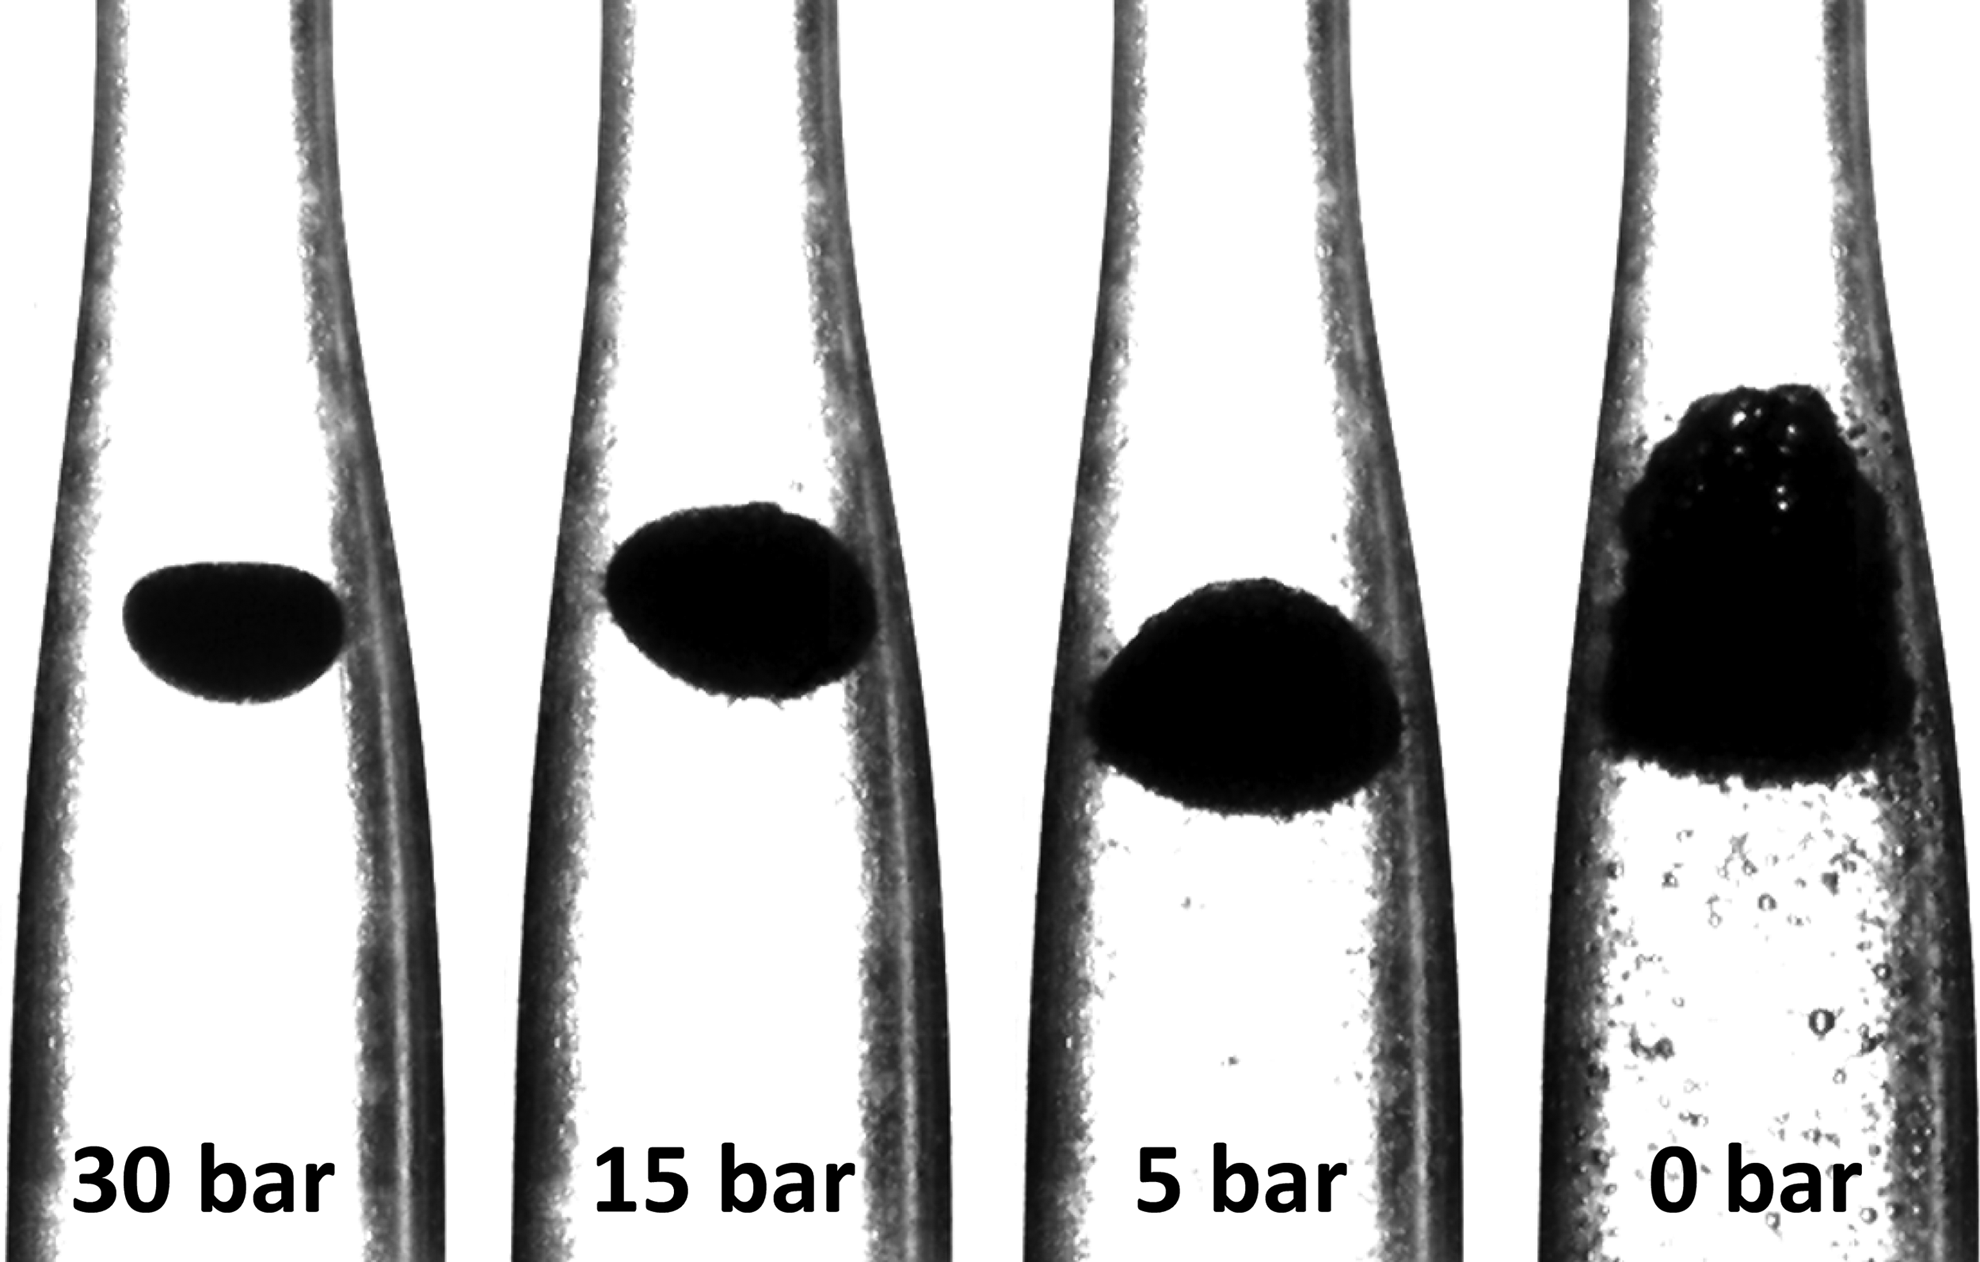
Growth of a methane-saturated LSC oil droplet in artificial seawater, held in a countercurrent flow channel during depressurization from 15 MPa to ambient pressure with 10 bar/min at 20°C (experiment no. 2).
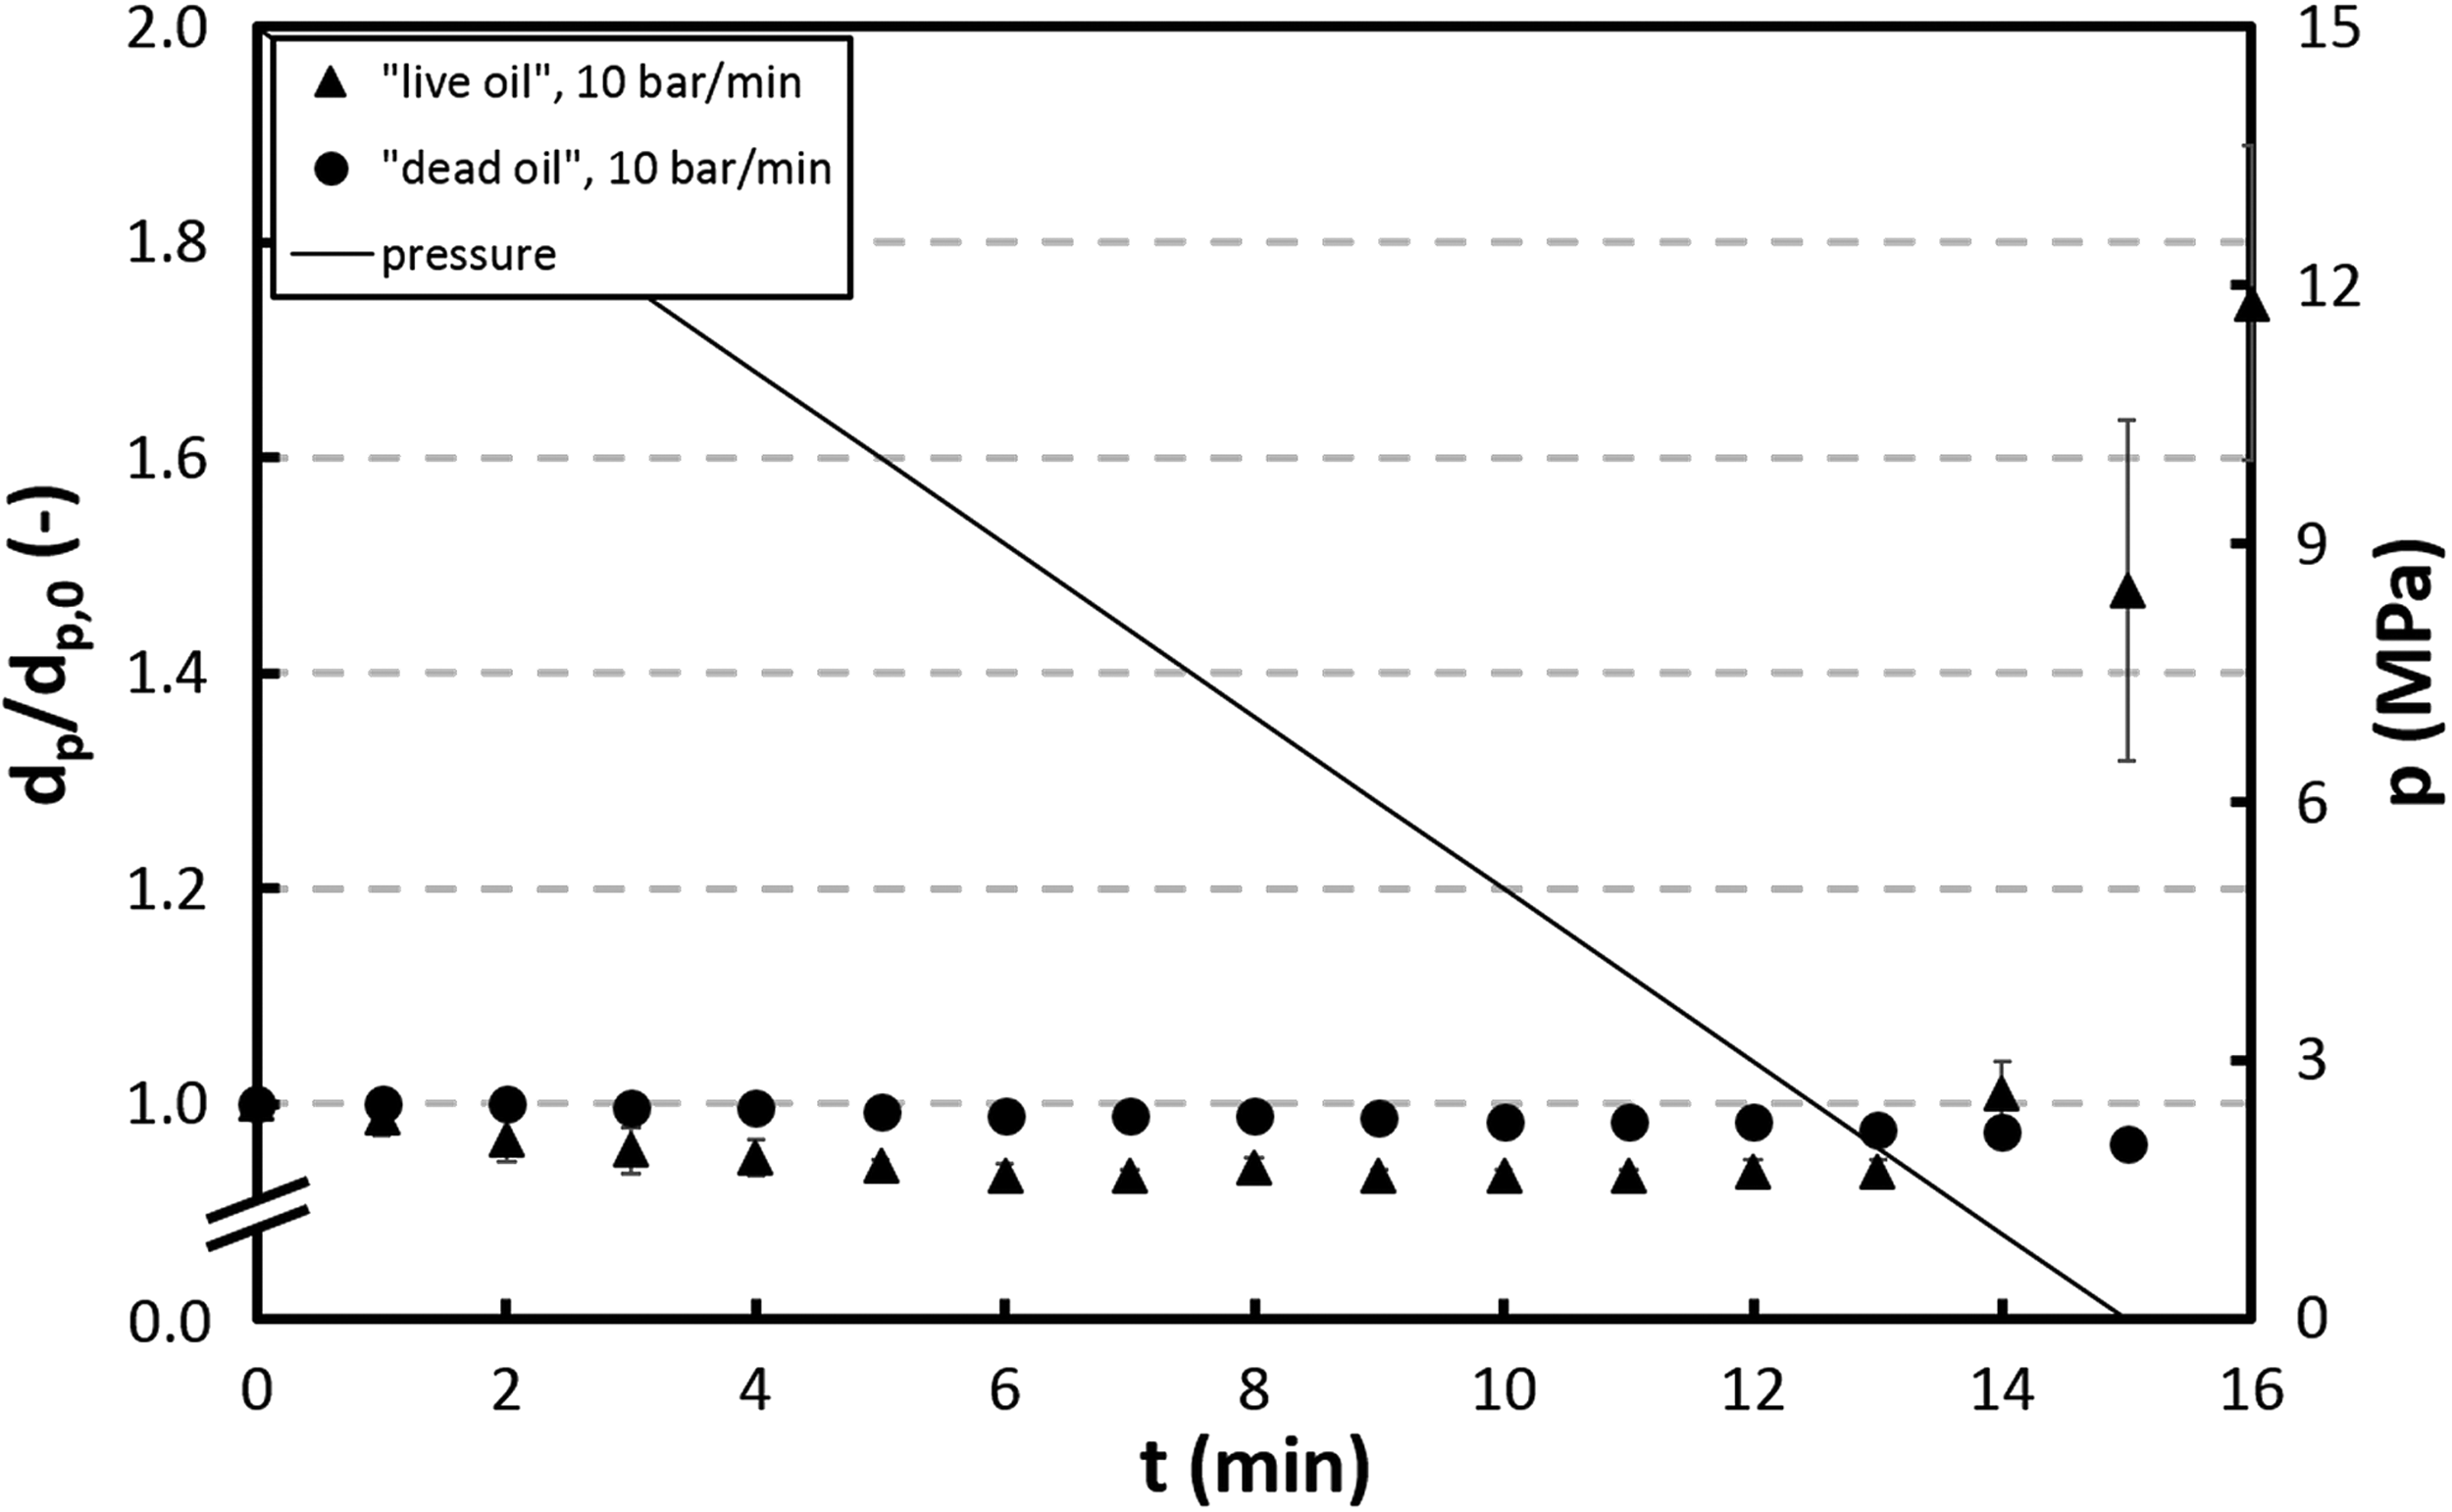
Evolution of the LSC oil droplet diameter ratio over time at gauge pressure decrease from 15 to 0 MPa. With gas saturation: triangles–experiments 1–3, decompression rate 10 bar/min; without gas saturation: circles–experiments 10–12, decompression rate 10 bar/min. Temperature: 20°C. Error bars indicate the standard deviation from the arithmetic mean.
Experiments 1–9 are carried out with methane-saturated LSC oil, experiments 10–12 with unsaturated LSC oil. The temperature is 20°C for all experiments. LSC, Louisiana Sweet Crude.
Discussion
Modeled influence of internal degassing on the rise behavior of crude oil droplets through the water column during deep-sea oil spills shows a significant acceleration of the droplets. The modeled rise velocity taking into account the degassing effects agrees well with the result of the flowsheet simulation. The droplet volume evolution and the increasing gas holdup confirm the results of the saturation-concentration measurements and the accuracy of the modeling procedure.
Among others, one possible explanation for the very short oil rise times starting from about 3 h that have been observed during the DWH oil spill is the high amount of natural gas that is dissolved in the crude oil at reservoir conditions. Due to the pressure decrease along the oil's rise path the gas cannot stay dissolved. This can lead to an enhanced mass transfer into the surrounding seawater and/or to the formation of gas bubbles inside the droplets as proposed in the presented modeling procedure. Atmospheric measurements and water sampling did not show a significant increase in the occurrence of light (C1–C5) hydrocarbons at the sea surface as a consequence of the spill while large amounts of it are assumed to accumulate and be degraded in subsea intrusion layers (Kessler et al., 2011; Bahreini et al., 2012; Ryerson et al., 2012). However, this does not necessarily mean that no methane reached the upper layers of the water column. Camilli et al. (2010) measured vertical concentration profiles of methane and other light volatile hydrocarbon fractions near the spill site, detecting relatively high concentrations throughout the water column except for the upper 30 m where a sharp decrease of these components occurs. Besides, the buoyancy of dead crude oil droplets of realistic sizes and ocean currents cannot account for the observed short rise times alone. Another effect that can accelerate the rise of the oil droplets is the enhanced buoyancy of a droplet swarm due to the presence of gas bubbles. However, most of the gas bubbles that are not coated by oil (or gas hydrate) dissolve in the lower parts of the water column. Hence, above the intrusion layer additional buoyancy due to gas bubbles is presumptively negligible.
Nevertheless, the predicted droplet rise accelerated by degassing (Case 1) is not supposed to occur to its full extent in the real deep-sea environment, since some of the assumptions made will probably not hold completely. The most crucial point is that a certain amount of the gas is supposed to leave the droplet due to dissolution into the surrounding seawater. However, under the high-pressure, low-temperature conditions in the deep-sea hydrate shells may form around gas bubbles and gas-saturated droplets in the hydrate stability region. The shells hinder mass transfer of gas molecules into the seawater and extend the rise distance of the bubbles as long as they are coated (Rehder et al., 2002, 2009). Under the experimental conditions (temperature of 20°C) according to a drop rise in the upper part of the water column, hydrate formation is impossible. Another open question is if the degassing arises with or without time delay (kinetics of degassing). Thus, the velocity evolution predicted by the model is the upper boundary of what can happen to the droplet concerning its rise velocity. The contrary extreme (Case 2) that disregards any effects of the dissolved gas on the oil's rise behavior is not expected to hold either, which is supported by the experiments. It is the lower boundary of the possible droplet rise velocities. The actual course is supposed to lie between the two boundaries and can be only derived from experimental results.
As the size of the bubble-containing droplets increases, induced internal flow might enhance bubble growth but also disintegration of the droplets, even though the phase boundary is supposed to be contaminated and therefore inhibits internal flow to a certain degree. Shape oscillations of the grown composite bubble-droplets can trigger detachment of parts of the particle too.
Presence of chemical dispersants is beyond the scope of this work. In case of sub-surface dispersant injection the droplet sizes might be markedly smaller due to the reduced oil-water interfacial tension. The resulting drop rise velocities would be different due to deviations in diameter as well as Eo and Mo numbers. Potentially the bubble nucleation is also facilitated by dispersants due to reduction of oil-gas interfacial tension.
The results of the droplet growth experiments represent the predicted effects of internal degassing qualitatively. The droplets grow during the pressure release and this is undoubtedly due to gas bubbles that form and grow inside the droplet, which can be directly seen in the pictures taken, see for example Fig. 5.
Initial diameters are bigger for the dead-oil experiments than for those with gas-saturated oil droplets at the same experimental conditions. This can be explained by the lower oil density, lower oil viscosity, and lower oil-seawater interfacial tension in the case of methane-saturated crude oil, which facilitate the detachment of smaller droplets. The shrinking of the unsaturated oil droplets is undoubtedly accounted for by dissolution of fairly water-soluble components in the surrounding seawater phase. This dissolution is expected for the live-oil experiments, too. In fact, an even bigger shrinking rate is observed for the beginning of experiments 1–9 since the solubility of methane in water is relatively high compared to most of the other hydrocarbon components. According to theoretical considerations, the droplet growth factor as listed in Table 2 is affected by the decompression rate and the initial droplet diameter. The shorter the time for dissolution and the bigger the volume-to-surface ratio are, the more methane can contribute to internal degassing and thus droplet growth. This is in good accordance to the experimental results.
Shrinking due to dissolution is evident in the beginning, whereas in the end of the experiments the predicted degassing effect dominates. When comparing the course of the diameter ratio from the experiments (Fig. 6) to that of the theoretical model, the main difference is a delay in the droplet growth. Consequently, the strong upsurge in the diameter is only observed within the lower ∼10 bar and even after completed pressure release. The reason for this behavior might be the poor homogeneous nucleation of gas bubbles during the relatively slow depressurization. In contrast, at a real deep-sea blowout the nucleation is supposed to be much more vigorous due to two strong effects. First is the lower interfacial tension at lower temperatures that leads to a rate of nucleation orders of magnitude higher for 4°C than for 20°C according to the classical homogeneous nucleation theory (Blander and Katz, 1975; Taki, 2008). Second and even more important is the sudden pressure drop at the wellhead. The resulting fast decompression of the gas-saturated oil in conjunction with the strong shear forces in the oil and gas jet favors (heterogeneous) nucleation and therefore the formation of a large number of small bubbles within the oil droplets. This is apparent in Fig. 7, where a microscopic photograph resulting from a live-oil jet experiment shows a huge number of methane microbubbles.
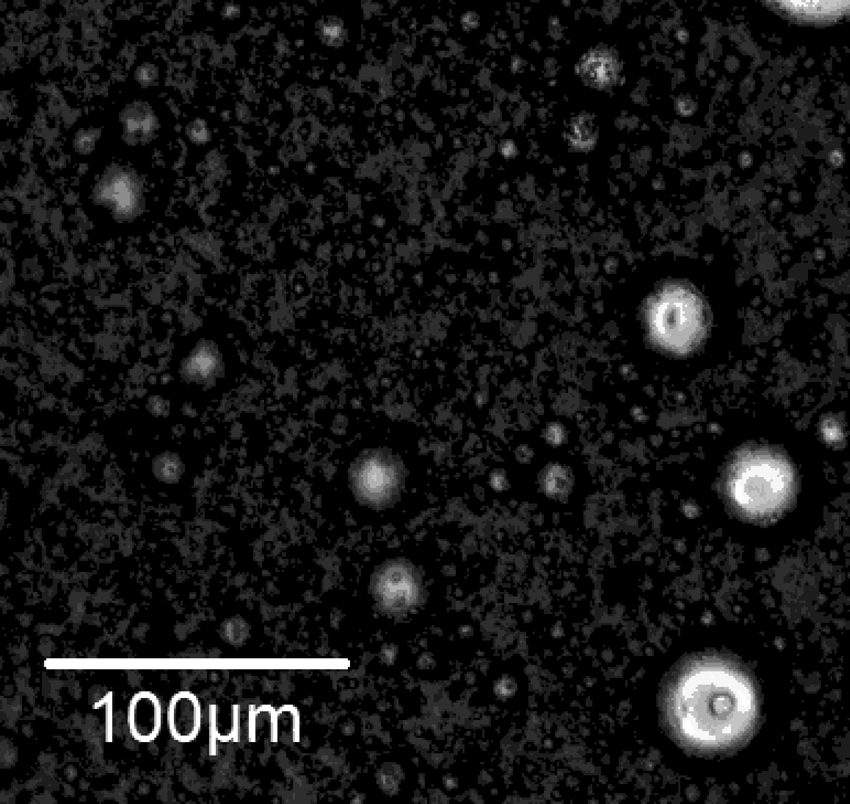
Methane gas bubbles in gas-saturated LSC oil after fast decompression through a jet nozzle (inner diameter: 1.5 mm) with a pressure drop of 2.0 MPa and at a temperature of 20°C. The image is taken using a light microscope with 10× magnification.
The model assumes instantaneous nucleation at the wellhead corresponding to an actual blowout. This also reduces the extent of dissolution, since bubble formation and growth on the one hand and mass transfer into the ambient seawater on the other hand are competing effects.
Conclusions
A modeling procedure for calculating the rise velocity of gas-saturated crude oil droplets in the ocean during deep-sea oil spills is presented. Since the gas solubility in the oil is strongly pressure-dependent, oversaturation and thus degassing is supposed to occur during the droplet's rise from the wellhead to the sea surface. The occurrence of tiny gas bubbles within the oil droplet (“internal degassing”) influences its rise behavior significantly. Three major effects have to be considered for the internal degassing: First, the gas holdup within the oil droplets increases as gas solubility decreases. This leads to a lower overall density of the droplet. Second, the density of the arising gaseous phase decreases, which strengthens the first effect. Third, the droplet size increases due to the presence and growth of the gas bubbles. All three effects add up to an increase in the droplet's buoyancy and thus to an acceleration of the droplet along its rise path, which can help to explain the rapid surfacing of parts of the released oil during deep-sea oil spills like the DWH accident.
The model is used to predict the increase of the droplet's volume and the internal gas void fraction as well as the decrease of its overall density. Further on, the rise-velocity evolution of a droplet is calculated using the presented approach. A case study is carried out to compare the rise behavior with and without the consideration of internal degassing. For the validation of the model and its underlying data, a flowsheet simulation is performed, using a similar physical approach, also based on the Peng-Robinson EOS. The main difference is the more complex thermodynamic representation of the oil by the simulation software based on pseudo-components while the oil is characterized based on its (overall) physical properties in the presented model. The resulting curves of both methods match qualitatively and quantitatively well.
High-pressure experiments are conducted to show the modeled effect. Gas-saturated crude oil droplets are fixed in a countercurrent flow and the pressure is decreased with different decompression rates, emulating the rise from the deep-sea to the sea surface. The experiments show the predicted effect of internal bubble formation and droplet growth.
While much of the complex physics of an actual deep-sea blowout (swarm effects, currents, hydrates) is disregarded, the results of this study will be useful benchmarks for the development of mathematic components of more realistic plume models and can serve to stimulate discussion and the design of future experiments.
Footnotes
Acknowledgments
This research was made possible by a grant from The Gulf of Mexico Research Initiative (GoMRI)/C-IMAGE II. Data are publicly available through the Gulf of Mexico Research Initiative Information & Data Cooperative (GRIIDC) at ![]() (doi: 10.7266/N7F18X57, doi: 10.7266/N79885GB). The funders had no role in study design, data collection, and analysis; they neither had any role in the decision to submit this article for publication nor in the preparation of the article.
(doi: 10.7266/N7F18X57, doi: 10.7266/N79885GB). The funders had no role in study design, data collection, and analysis; they neither had any role in the decision to submit this article for publication nor in the preparation of the article.
Author Disclosure Statement
No competing financial interests exist.