
Abstract
Abstract
Membrane distillation is reported for the first time in the literature being used to desalinate geothermal brackish groundwater for industrial greenhouse applications. Asymmetric hollow fiber membranes were fabricated and characterized for their direct contact membrane distillation (DCMD) application to provide irrigation water at Masson Greenhouse, New Mexico. Membranes exhibited an asymmetric configuration with an external sponge layer and an internal macrovoid layer. The intention was to prevent pore wetting from the hot saline fluid with the sponge layer, while using the macrovoid layer to increase the water flux and thermal efficiency of the membrane. A water flux of 55 liters/m2-h (LMH) with a salt rejection greater than 99.99% was observed for the fabricated polyvinylidene fluoride (PVDF) hollow fiber membranes at a water vapor pressure gradient of 3.2 MPa/cm (shell-side inlet temperature of 80°C). Further investigation, however, revealed that pore wetting existed in the macrovoid layer at the onset of the DCMD operation even though the measured liquid entry pressure (LEP) was substantially greater than the transmembrane pressure observed in the DCMD module during operations. This result suggests that LEP is not an effective indicator for pore wetting, which can adversely impact the water flux. Short-term performance of the hollow fiber membranes was evaluated over 80 h of continuous operation. Minimal reduction of the water flux and stable salt rejection over 99.99% were observed over the period.
Introduction
G
Geothermal fluids range in salt content, which may affect their direct usage for crop irrigation in a greenhouse. Masson Greenhouse is a large-scale indoor greenhouse that uses geothermal brackish water for space heating as well as freshwater from on-site wells and the Rio Grande River for irrigation. To satisfy the water quality requirements for irrigation, reverse osmosis (RO) is used for desalination of the irrigation source water. Addition of antiscalant is needed for the RO process due to elevated concentrations of Ca2+ and Mg2+ in source water. The chemical treatment process increases the energy footprint and operating cost of the greenhouse. With the existing energy of the brackish geothermal fluid, membrane distillation (MD) offers a unique opportunity to meet the demand for irrigation with the geothermal fluid at a lower cost.
Membrane distillation is a separation process that relies on vapor pressure gradients to drive the production of purified water across a hydrophobic membrane. The simplest form of MD is direct contact membrane distillation (DCMD) in which both the hot water and cold permeate are in direct contact with the membrane. The temperature difference across the hydrophobic membrane induces the gradient of water vapor pressure resulting in desalination and water permeation through vapor diffusion.
The goal of this research is to design a pilot-scale DCMD system with fabricated hollow fiber membranes for long-term performance testing at Masson Greenhouse. The primary focus of the research presented in this article is the fabrication and characterization of asymmetric hollow fiber DCMD membranes for desalination of the brackish geothermal fluid at the greenhouse.
Masson Greenhouse is located in an arid, high desert region at the northern end of the Mesilla Valley of the Rio Grande. Masson is the second largest geothermally heated greenhouse in the United States. Two wells on the property descend 244 m (800 ft) to extract geothermal water from a highly fractured rhyolite dike that acts as a conduit for the deep Precambrian–Paleozoic reservoir. One of the wells provides the majority of heat for the greenhouse at a flow rate of about 0.076 m3/s (1,200 gpm). The temperature and the concentration of total dissolved solids (TDS) of the geothermal water are 92°C and 3800 mg/L, respectively (Witcher and Lund, 2002). The geothermal water is circulated through plate and frame heat exchangers that transfer heat from the geothermal stream to a recirculating freshwater stream for space heating. The geothermal water has a temperature of about 70°C after the heat exchangers and is then pumped back into the rhyolite dike reservoir downstream. The heated freshwater is stored in a large insulated tank, and the greenhouse temperature is regulated by the flow rate of the recirculation loop. This process loop is shown in Fig. 1. The freshwater circulates through pipes that are embedded in the concrete foundation and the headspace of the greenhouse to provide radiant heat (Sanchez, 2017). Many of the plant species grown at the greenhouse are extremely sensitive to the salt concentration of the water, which is often measured by the TDS of the stream. Therefore, water from permitted freshwater wells and the Rio Grande River must be treated from 1,800 mg/L of TDS down to 300–400 mg/L of TDS before it can be used for irrigation. Currently, the greenhouse relies on spiral wound RO membranes to remove the dissolved solids. The RO system produces 160 gpm of permeate, and liquid antiscalant is applied to the feed water for inorganic fouling control (Sanchez, 2017).

Process loop for geothermal space heating at Masson.
MD is a separation process that relies on vapor pressure difference to drive the production of distilled water across a hydrophobic membrane. The MD process consists of three steps: evaporation of water from the feed side, migration of water vapor through membrane pores, and condensation of water vapor on the permeate side of the membrane (Susanto, 2011). There are four basic MD configurations; DCMD, air gap membrane distillation (AGMD), sweeping gas membrane distillation (SWMD), and vacuum membrane distillation (VMD) (Simone et al., 2010; Wang and Chung, 2015). The simplest configuration is DCMD in which the condensed permeate is in direct contact with the membrane, and the temperature difference across the membrane induces the vapor pressure difference. Heat loss by conduction, however, is highest in this configuration. In AGMD, a thin air gap is introduced between the membrane and a condensation surface. The downside of this configuration is that the vapor transport through the air layer is one magnitude less than that of the membrane. SWMD and VMD are generally used for separation processes in chemical and food industries, and are not cost-effective for water treatment (El-Bourawi et al., 2006). MD membranes are typically made from dope solutions that consist of hydrophobic polymers and organic solvents. Hydrophobicity is an important characteristic of MD membranes; hydrophobicity aids in the prevention of pore wetting and can be measured by contact angles. To overcome pore wetting, it has been suggested that increasing membrane hydrophobicity is more effective than decreasing the membrane pore diameter (Lawson and Lloyd, 1997).
The three most prevalent polymers used for MD are polyvinylidene fluoride (PVDF), polypropylene (PP), and polytetrafluoroethylene (PTFE). Their properties and fabrication methods are shown in Table 1 (Tomaszewska, 1996; Lawson and Lloyd, 1997; Wang and Chung, 2015). Unlike PP and PTFE, PVDF can be dissolved easily in common solvents such as n-methyl-2-pyrrolidone (NMP) and dimethyl acetamide (DMAC) to make dope solutions. Hollow fiber MD membranes can then be fabricated using nonsolvent-induced phase separation (NIPS) through the dry-jet wet-spinning process. Water, isopropanol (IPA), ethanol, or a mixture of them has been used in NIPS as nonsolvents. By controlling the composition of the nonsolvent and the fiber spinning conditions, membranes with different pore structures, such as symmetric sponge or asymmetric sponge/finger-like macrovoid, can be fabricated (Sukitpaneenit and Chung, 2009; Teoh et al., 2011).
NIPS, nonsolvent-induced phase separation; PP, polypropylene; PTFE, polytetrafluoroethylene; PVDF, polyvinylidene fluoride; TIPS, thermally induced phase separation.
Membranes with a combination of sponge and macrovoid layers are of particular interest to this research due to their high water flux potential resulting from reduced tortuosity and low thermal conductivity (Li et al., 2002, 2004). Wang proposed a dual-layer hollow fiber with an inner finger-like macrovoid coupled with an outer sponge layer (Wang et al., 2011). The intention was to prevent pore wetting from the hot saline fluid with the sponge layer, while using the macrovoid layer to increase the water flux and thermal efficiency of the membrane via the reduction of tortuosity and thermal conductivity. Water flux and thermal efficiency as high as 98.6 (liters/m2-hour, LMH) and 94%, respectively, were observed at an inlet temperature difference of 63°C. Long-term DCMD performance of the dual-layer hollow fiber membranes showed a decline in water flux of less than 10% over 200 h, which was attributed to inorganic salt scaling on the membrane surfaces (Wang et al., 2011). Other researchers also investigated the long-term performance of PVDF hollow fibers with the opposite membrane configuration (i.e., an outer macrovoid layer coupled with an inner sponge layer) (Gryta and Barancewicz, 2010). An initial water flux of about 32 LMH was observed at a temperature difference of 60°C. Rapid decline of water flux, however, was observed with a 20% decline after 200 h of operation and a 60% decline after 1,100 h. Reduction of the water flux was attributed to progressive wetting of the membrane pores since only a dilute NaCl solution was used as the feed. Addition of PTFE particles increased the hydrophobicity of the membrane and retarded the initial decline of water flux; however, over 80% reduction of the water flux was still observed after 1,000 h of operation (Gryta and Barancewicz, 2010). It is worth noting that the PVDF/PTFE hollow fiber membrane is composed entirely of sponge structure that is conceivably more difficult to wet than macrovoid structure.
Pore wetting can compromise the water flux and thermal efficiency of a DCMD system. To minimize pore wetting, Equation (1) has been used to estimate the liquid entry pressure (LEP) for DCMD systems so that the operating pressure limit can be determined (Alkhydari et al., 2012). LEP (in Pascal) is defined as the minimal pressure differential required for the liquid to penetrate the membrane pores and greatly depends on the maximum pore size and membrane hydrophobicity.
where
Materials and Methods
Synthetic geothermal water
Table 2 shows the compositions of the geothermal water at Masson Greenhouse and the synthetic water used to simulate the geothermal water for laboratory testing. ACS-grade chemicals and ultrapure water (18.2 MOhm-cm, Milli-Q system) were used to prepare the synthetic geothermal fluid.
Units are in mg/L unless otherwise noted.
na, not available; TDS, total dissolved solids.
Membrane materials
PVDF with an average molecular weight of 534,000, and a density of 1.74 g/cm3 at 25°C, was obtained from Sigma-Aldrich and used as the membrane material. n-methyl-2-pyrrolidone (NMP) and isopropanol (IPA, Histoprep grade, 100% purity) purchased from Fisher Scientific were used as solvent and nonsolvent, respectively. Ethylene glycol (EG, semigrade, 99+%) was obtained from VWR International and used as the pore-forming agent.
Dope preparation and hollow fiber fabrication
To prepare the polymer dope solution, dehydrated PVDF powder was mixed with NMP and EG. The mixture was kept in a 70°C oven for 5 h to ensure complete dissolution of PVDF in NMP. The homogeneous PVDF/EG/NMP solution was then placed in vacuum to degas for 2 h before usage.
The hollow fibers were fabricated using a dry-jet wet-spinning process. The polymer dope solution was delivered using a syringe pump (Model 230; kd Scientific) and extruded through a spinneret (AEI, Inc.) with polymer bore (for dope solution) of 1,520 μm, needle outer diameter (OD) (for bore solution) of 510 μm, and needle inner diameter (ID) of 410 μm. Bore solutions consisting of IPA/H2O mixtures were also delivered using a syringe pump (74900 series; Cole Parmer). After extrusion from the spinneret, the nascent polymer fibers travelled through an air gap before entering the coagulation bath that contained an IPA/H2O mixture at 20°C. Table 3 lists the conditions of the fiber spinning process. The newly spun hollow fibers were immersed in deionized water for 24 h to remove any residual NMP and EG. Thereafter, the wet fibers were freeze-dried before characterization and potting.
EG, ethylene glycol; IPA, isopropanol; NMP, n-methyl-2-pyrrolidone.
Characterization
Rheology of the polymer dope solutions
Rheological behavior of the dope solutions was characterized using a cone-and-plate viscometer (Brookfield DV2T-RV) equipped with a cone spindle (CPA-51Z). The setup had a viscosity range from 25 to 512,000 mPa-s at shear rates between 0.384 and 768 s−1. Sample volumes of 0.5 mL were loaded into the sample cup of the viscometer and water was circulated through the cup from an external water bath, which helped to maintain the temperature at the desired set point for measurement. The power law model shown in Equation (2) was applied to fit the rheological data.
where
Cloud point of the dope solutions
In this study, the cloud point of a dope solution is defined as the concentration of the nonsolvent at which the dope solution starts to phase separate instantly when it is mixed with the nonsolvent in equal proportions at a fixed temperature. Based on the rheological study, two dope solution compositions, as shown in Table 3, were chosen for the cloud point study. Mixtures of IPA/H2O, instead of NMP/H2O, were used as the nonsolvents in the coagulation bath and as the bore solutions due to health considerations. The IPA/H2O mixtures with IPA ranging from 10% to 90% by weight were prepared. The IPA mixture was then slowly introduced into a 15-mL vial containing the dope solution and the final volume ratio of the IPA mixture to the dope solution was one. The contents of the vial were then mixed via sonication (model 8890; Cole-Parmer ultrasonic bath) for 60 min before visual examination. The cloud point was indicated by the presence of a white solid interface between the remaining IPA mixture and the dope solution.
Determination of the cloud point for a specific dope solution can facilitate the selection of proper IPA/H2O mixtures for membrane fabrication. The difference in solubility parameters between PVDF and water is much greater than that between PVDF and IPA suggesting that water has a much higher tendency to induce instantaneous demixing of PVDF (Sukitpaneenit and Chung, 2009). Consequently, a higher IPA proportion than that of the cloud point would intensify delayed demixing and promote sponge-like membrane structures, whereas a smaller IPA proportion would enhance instantaneous demixing leading to finger-like macrovoid structures.
Morphology of hollow fiber membranes
Cross section and surface morphologies of the hollow fiber membranes were observed using scanning electron microscopy (SEM, Hitachi S3200N). The fiber samples were frozen and fractured in liquid N2 followed by platinum sputter coating. The elemental analysis of salts was conducted using energy dispersive X-ray spectroscopy (EDX, NORAN System SIX X-ray microanalysis system).
Membrane pore size and porosity
Mean pore size and pore size distribution of the hollow fiber membranes were determined using capillary flow porometry (Quantachrome 3G zh), with a through pore size range from 0.013 to 500 μm. Samples of hollow fibers were prepared following Quantachrome's instruction before being wetted with Porofil® (Quantachrome Instruments, 2016). Porofil is a wetting fluid with very low volatility and a contact angle close to zero. The wetted fibers were then installed onto the hollow fiber sample holder for porometry analysis.
Membrane porosity was estimated using a digital microbalance (Sartorius M3P) with a weighing range from 0.001 to 500 mg. The hollow fiber sample was wrapped in an antistatic sheet to eliminate the static charge before weighing. The overall porosity (ɛ) of the membrane is defined as the void volume divided by the total volume of the fiber and was calculated using Equation (3):
where Mf is the mass of the fiber (g),
Liquid entry pressure
For membrane distillation, LEP is often used to determine the operating pressure limits of a DCMD system, below which liquid penetration through a membrane would not occur. In this study, LEP for the hollow fiber membranes was measured using capillary flow porometry (Quantachrome 3Gzh) and represents the pressure differential needed to push water across the membrane. A dry membrane sample was installed onto the hollow fiber sample holder used for the porometry analysis. The lumen of the fiber sample was connected to a small reservoir (0.3–0.5 mL) of 20°C deionized water, which was used as a filling agent. Air pressure was then applied to the lumen and the pressure, at which blow-through occurred, was deemed the LEP for the hollow fiber.
Thermal properties
Fabricated PVDF membranes would be subjected to water temperature as high as 92°C, and therefore, it was important to examine the thermal stability of the membranes under these potential operating temperatures. A modulating differential scanning calorimeter (Model: Q2000; TA Instruments) was used to analyze samples of the membrane material for structural changes. The membrane sample was sectioned and placed in a Tzero hermetically sealed aluminum test pan before a heat–cool–heat test was performed. The heating and cooling rate was 10°C per minute and an isotherm was held at 130°C after the first heating, 5°C after the cooling cycle and again at 130°C after the last heating cycle.
Membrane mechanical properties
Mechanical properties of the hollow fiber membranes were measured at 20°C using a Mark-10 ESM303 tensile tester equipped with a 100N digital force gauge (Model M5-20). A strain rate of 1.27 cm/min (0.5 inches/min) was applied to the fibers until breakage occurred. The stress–strain behaviors of the fibers were recorded to assess the mechanical properties.
Bursting pressure of hollow fiber membranes was measured by wetting the exterior of the fibers with glycerin to blind the pores followed by pressurizing the glycerin-wetted fibers using the setup for capillary flow porometry (Quantachrome 3G zh) until fiber bursting occurred.
Membrane module fabrication
Freeze-dried hollow fibers were placed inside acrylic tubes (modules) with an inner diameter of 0.635 cm to achieve fiber packing densities up to about 42%. The packing density of the hollow fiber membranes was calculated using Equation (4):
where Af is the total cross-sectional area (cm2) of the fibers in a module and Am is the maximum packable cross-sectional area (cm2) of the module. Epoxy resin (Henkel Corporation) was then used to seal both ends of the modules before being placed at 70°C for an hour to accelerate curing of the epoxy. Afterward, a section of the cured epoxy was removed from each end of the modules using a no-melt saw blade designed for plastic cutting to expose the lumen side of the hollow fiber membranes. The effective length of each fiber in a module was about 6.2 cm. Every fiber in a module was tested for structural integrity using deionized water before the module was used for DCMD experiments.
DCMD experiments
Experimental setup
The process flow diagram of the DCMD experimental setup is shown in Fig. 2. Synthetic geothermal brackish water with the composition shown in Table 2 was pumped through the shell side of the module using a peristaltic pump (model: 07551-20; Cole-Parmer). The water was drawn from a heated brackish water reservoir and pumped through a stainless steel heat exchanger submerged in a hot water bath (model: 2335; Fisher Scientific) to achieve the desired hot-side inlet temperature for the module. The concentrated stream leaving the module was returned to the brackish water reservoir for recirculation. To maintain the TDS concentration of the brackish influent to the module as the water recirculated, a supplementing reservoir filled with deionized water was connected to the brackish water reservoir. As water vapor permeated through the hollow fiber membranes in the module, a slight vacuum would be developed in the hot-water loop and deionized water from the supplementing reservoir that was open to the atmosphere would then be drawn into the brackish water reservoir to equilibrate the pressure.

Experimental DCMD setup. DCMD, direct contact membrane distillation.
Condensate (permeate) generated on the lumen side of the module was circulated to a permeate reservoir followed by a heat exchanger placed in a chilled-water bath (model: Polystat; Cole-Parmer) before being delivered to the lumen side of the module inlet. A 20-μm filter was placed upstream of the module inlet to prevent particulate matter from entering the hollow fibers. The flow through the lumen (cold) side of the module was counter-current to that of the shell (hot) side.
The permeate reservoir was placed on a balance (model: Entris 6202-1S; Sartorius) to record the cumulative mass over time. Flow rates on the shell and lumen sides of the module were monitored using rotameters (model T-03219-31; Cole-Parmer). Temperature sensors (RTD: Pt 100) and digital pressure gauges (model: EW-68349-02; Cole Parmer) were placed at the inlets and outlets of the module on both the shell and lumen sides to monitor the temperature and pressure readings. An in-line conductivity cell (K = 10, 10 kΩ ATC; Cole-Parmer) was placed at the module inlet on the shell side and the other (K = 0.1, 10 kΩ ATC; Cole-Parmer) at the module outlet on the lumen side to monitor the TDS concentrations of the brackish feed water and the desalinized permeate water. Both conductivity probes were logged using conductivity controllers (model: CON500; Cole-Parmer).
Experimental methods
For each DCMD test, a baseline study was conducted to check for fiber and module defects as well as issues with the DCMD system. The synthetic brackish water and deionized water were allowed to flow through the shell and lumen sides of the module, respectively, at room temperature for 2 h. With no temperature gradient across the hollow fiber membranes, the water mass accumulation in the permeate reservoir over time should be negligible. Generally, a baseline fluctuation of less than 0.006 kg per hour was deemed acceptable to proceed with the DCMD experiments.
Once an acceptable baseline was achieved, the hot-water and chilled-water baths were set to their designated temperatures. Generally, it took about 10–15 min for the temperature of the synthetic brackish water on the shell side and the deionized water on the lumen side to stabilize. After the desirable temperature gradient was achieved, the readings for temperature, conductivity, and the mass accumulation in the permeate reservoir were logged every 5 min for at least 2 h. For this research, the performance of the DCMD system was evaluated at the shell-side inlet temperature from 50°C to 80°C with a fluid velocity up to 0.161 m/s and the cold-side inlet temperature of about 20°C with a maximum fluid velocity of 0.342 m/s.
Permeate water flux, salt rejection, and thermal efficiency of the membrane modules were calculated using the recorded data. The slope of the cumulative mass versus time curve represented the permeate production rate and was used to estimate the water flux (liters/m2-hour, LMH) of the module at a specific temperature gradient in Equation (5):
where
where Cd is the TDS concentration (mg/L) of the permeate out of the module and CF is the TDS concentration of the brackish feed into the module. Thermal efficiency of the module at a specific shell-side inlet temperature was estimated using Equation (7):
where ΔHv is the heat of vaporization (J/kg) for water at the average water temperature on the shell side. The average water temperature is the arithmetic mean of the inlet and outlet bulk temperature of the module. Jw is the water flux (LMH) observed for the module and Ai is the internal surface area (m2) of the hollow fibers in the module. Cp is the specific heat (J/kg-K) of water and Q is the volumetric flow rate (L/hour) on the lumen side for the module. TL,out and TL,in are the lumen-side bulk temperature (°C) at the outlet and inlet of the module, respectively (Teoh and Chung, 2009).
Salt intrusion tests
Salt intrusion tests were designed to evaluate post-experiment membrane modules for water intrusion into the membrane structures during experiments. Immediately after the conclusion of an experiment, the membrane module was evaluated with either the lumen or shell side being exposed to concentrated brine using the setup shown in Fig. 2. The rationale was that salt ions would quickly diffuse into the membrane under such a high-salinity gradient if water had invaded into the membrane thus providing water connectivity. Two types of tests, pore wetting and condensation, were conducted. The pore wetting tests involved running NaCl brine of about 23 wt% on the lumen side and deionized water on the shell side at experimental flow rates and 20°C with no temperature gradient across the membrane. The modules were removed from the test setup after 45 min and dried at 50°C for 12 h. Afterward, the fibers were carefully removed from the modules for SEM-EDX examinations. It was theorized that NaCl crystals would be observed inside the membranes if the NaCl brine had intruded into the lumen side of the membranes. Experiments were also repeated to examine the water intrusion on the shell side of the membranes with the concentrated brine running on the shell side and deionized water on the lumen side.
Condensation tests were designed specifically for hollow fiber membranes that presented no water intrusion during the pore wetting tests. The purpose was to assess whether water vapor condensed in the macrovoid regions of the membranes under experimental conditions. The tests involved running the concentrated brine on the lumen side at a module inlet temperature of 20°C and running deionized water on the shell side at an inlet temperature of 50°C. Water condensate observed in the macrovoid region suggests that resistance occurring at the lumen wall hinders the mass transfer of water vapor into the lumen. It was anticipated that an accumulation of NaCl crystals would be observed in the macrovoids if water vapor condensation were to occur. Once the macrovoids were wetted by the condensate, salt ion diffusion from the lumen side into the macrovoids should ensue due to the high-concentration gradient.
Results and Discussion
Rheology of dope solutions
It has been suggested that polymer will exhibit significant chain entanglement at or above the critical concentration in the dope solution. This increase of chain interaction is reflected by a rapid increase of the apparent viscosity at a specific shear rate and can increase the mechanical strength as well as reduce the defects of the hollow fiber membranes produced (Tang et al., 2012). Figure 3 shows the apparent viscosity of the PVDF/EG/NMP dope solution as a function of the PVDF wt% at a shear rate of 30.72 s−1 and 25°C. For each dope solution, the EG concentration was maintained at 12 wt%.

Critical concentration of the PVDF/EG/NMP dope solution. EG, ethylene glycol; NMP, n-methyl-2-pyrrolidone.
The intersection point of the two lines tangent to the viscosity curve in Fig. 3 is defined as the critical polymer concentration beyond which the viscosity of the dope solution increases significantly. Based on Fig. 3, the critical PVDF concentration of the PVDF/EG/NMP dope solution is about 13.8 wt%, similar to the reported value of 13 wt% in the literature for the PVDF/NMP solution (Sukitpaneenit and Chung, 2009). For this study, two compositions were selected for the dope solution as shown in Table 3. Although the PVDF concentration of the P-12 dope solution was below the critical level, it was chosen because the lower viscosity facilitated a smoother fiber spinning process. Alternatively, the P-15 dope solution was selected because the polymer concentration was higher than the critical concentration, and presumably, membrane defects would be reduced. The increased EG concentration of 13 wt% was to compensate for the potential decrease of membrane pore sizes due to heightened viscosity. About 10% defective fibers were observed during the initial sorting of the P-15 fibers before module making compared with 20–25% for the P-12 fibers. Both dope solutions exhibited a shear-thinning or pseudoplastic fluid behavior and the observed power law equations at 25°C for P-12 and P-15 were
Demixing of dope solutions
The cloud point signifies the composition of the external coagulant (nonsolvent) at which the dope solution would exhibit instantaneous demixing. For the P-12 dope solution, the cloud point occurred at an IPA/H2O composition of 50/50 wt%. Therefore, an external coagulant of IPA/H2O at 60/40 wt% would induce delayed demixing and promote sponge-like membrane structures. The P-15 dope solution had a higher concentration of PVDF, a higher concentration of EG, and less NMP to stabilize the polymer in solution. It was expected that the cloud point would have an IPA concentration higher than 50 wt%. However, the significant increase of viscosity of P-15 compared with P-12 imposed considerable diffusion resistance for the demixing process leading to a cloud point of much lower IPA wt%, between 20 and 40. An IPA/H2O composition of 50/50 wt% was chosen to be the composition of the external coagulant for the P-15 dope solution.
Membrane characterization
A typical membrane morphology of the P-12 and P-15 hollow fiber membranes is shown in Figs. 4 and 5, respectively. Both types of hollow fiber membranes exhibited an asymmetric configuration with an external sponge layer and an internal macrovoid layer. The composition of the external coagulant induced delayed demixing leading to a sponge-like porous structure. The same external coagulant was used as the bore solution; however, rapid refreshing of the nonsolvent at the internal interface of the fibers enhanced the diffusive gradients leading to instantaneous demixing and a macrovoid structure. The air gap in the fiber spinning process provided a head start for the macrovoid advancement and can be used to manipulate the relative thickness of sponge and macrovoid in a fiber wall. The asymmetric membrane configuration of P-12 and P-15 was desirable because the sponge layer provided a higher LEP on the shell side, preventing brackish water from breaching through the membrane. However, this sponge-like structure also encouraged heat loss through conduction and hampered water vapor diffusion with higher tortuosity. The accompanying macrovoid layer would shorten the vapor transfer distance to increase water flux and offer higher thermal insulation through the air pockets. Positioning the macrovoid layer on the permeate side of the membrane could also reduce the risk of brackish water penetration. Overall, the asymmetric design, in principle, could facilitate performance optimization such as water flux, thermal leakage, and mechanical strength.
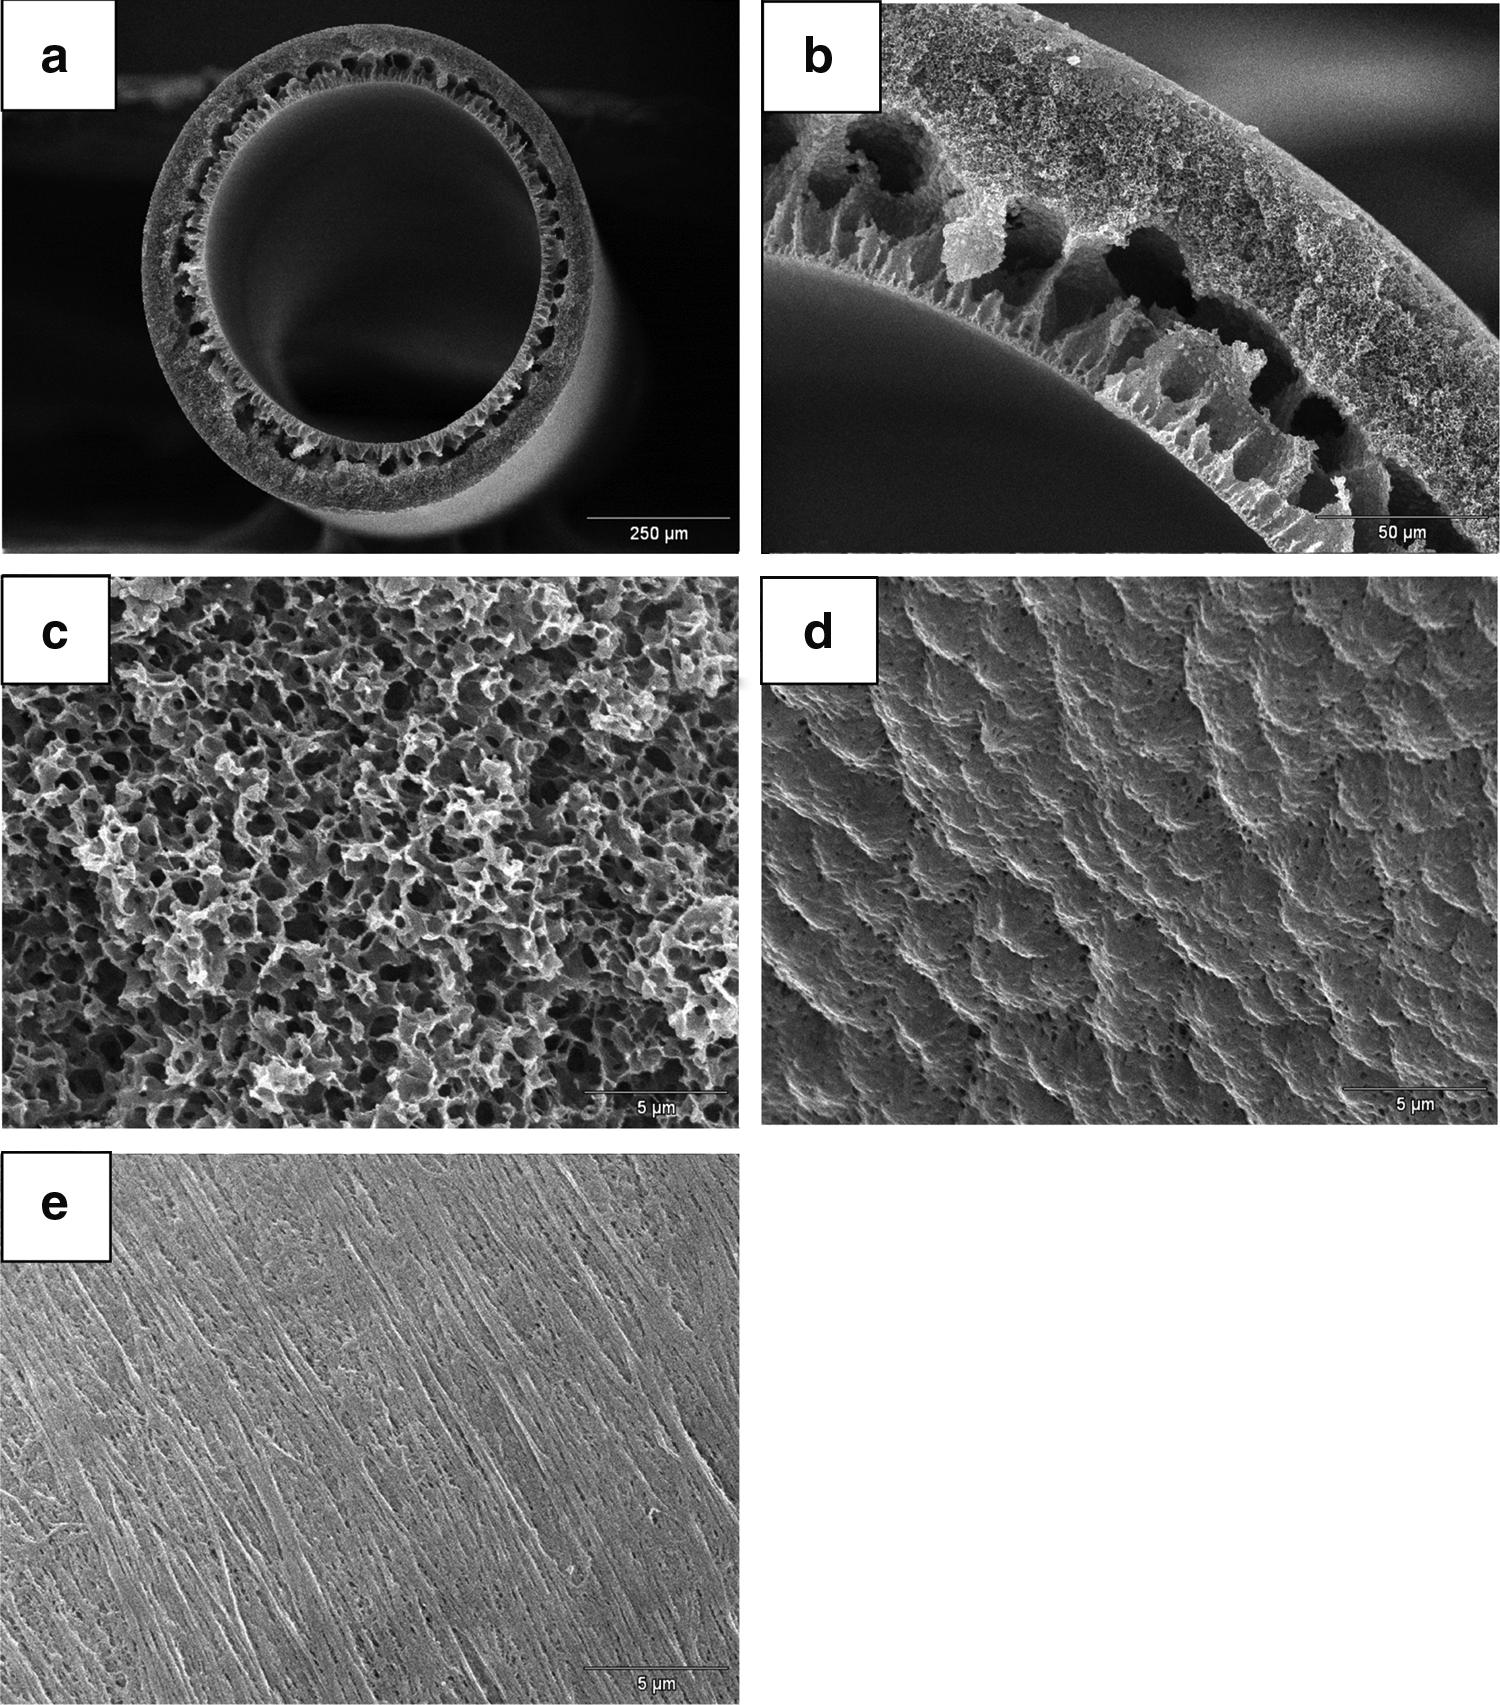
Morphology of P-12 membrane

Morphology of P-15 membrane
Table 4 provides a comparison of membrane characteristics for the P-12 and P-15 hollow fiber membranes. The P-15 fibers, as expected, were larger than the P-12 fibers in the internal and external diameters partly due to the higher spinning pressure in the fiber bore from the higher flow rate of the bore solution. The nominal wall thickness of the P-15 fibers was also about 48% larger than that of the P-12 fibers possibly caused by the higher PVDF dope concentration. When analyzing the thickness of the sponge and macrovoid layers, the P-15 and P-12 fibers had a comparable sponge layer thickness at about 50 μm, while the macrovoid layer of the P-15 fibers was more than two times thicker than that of the P-12 fibers.
Nominal size based on scanning electron microscopy image postprocessing.
Minimum pore size/mean pore size/maximum pore size.
Mean pore size for the P-12 and P-15 fibers was 0.333 and 0.387 μm, respectively, with the P-15 fibers having a slightly wider distribution of the pore sizes than the P-12 fibers. The P-12 and P-15 fibers had a similar porosity of between 0.8 and 0.84, which was comparable to the reported values in the literature for hollow fiber membranes spun with dope solutions of 12 wt% PVDF (Hou et al., 2009; Yang et al., 2011).
For both types of hollow fibers, the mechanical strength came primarily from the sponge layer where most of the connecting structure resided. The P-15 fibers had a failure stress of 9.25 MPa and Young's modulus of 81 MPa, while the failure stress and Young's modulus of the P-12 fibers were lower at 6 and 35 MPa, respectively. The higher mechanical strength of the P-15 fibers probably resulted from the significant increase of polymer chain entanglement as the PVDF dope concentration was increased to 15 wt%. The higher PVDF concentration and the accompanying greater viscoelasticity also intensified the delayed demixing in the sponge layer. Consequently, a greater extent of crystallinity was realized and the fiber became more brittle as evidenced by the higher Young's modulus.
Based on the heating curve generated from differential scanning calorimetry, the heat capacity of the PVDF membrane showed a matching trend with that reported in the literature, ranging from 1.2 J/g-°C at 20°C to ∼1.5 J/g-°C at 100°C (Quadrant Plastics, 2017). The lack of significant features to the heat capacity vs. temperature plot implies that there is no substantial phase or crystallinity change over the operating temperature of the membranes. The curve begins to trend upward as the temperature increases toward 130°C because PVDF begins to crystallize near that temperature (Mago et al., 2008).
Membrane bursting pressure
Bursting pressure (Pc) of the hollow fibers is an important membrane property used to gauge the mechanical strength of the fibers in operation. Equation (8) was developed to predict Pc using the stress–strain behavior of the hollow fibers and it is based on the Barlow's formula for pipe bursting (Makhlouf and Aliofkhazraei, 2016).
where Pc is the bursting pressure (Pa), UTS is ultimate tensile strength (failure stress) of the fiber (Pa),
Membrane performance
Water flux values were recorded for the P-12 and P-15 hollow fiber membranes under different water vapor pressure gradients (Gvp) across the membranes as shown in Fig. 6. For both membranes, the water flux increased linearly with the vapor pressure gradient. P-15 fibers exhibited a much lower water flux relative to P-12 fibers. With comparable porosity, pore size, and sponge layer thickness, the additional mass transfer resistance observed for P-15 fibers probably resulted from the much thicker macrovoid layers. The corresponding salt rejection for all the testing conditions was greater than 99.99%. Although water temperature was commonly used in the literature to correlate with the water flux data, vapor pressure gradient remains a better design parameter than temperature for DCMD and allows for proper interpretation of laboratory-scale water flux data for scale-up purposes (Bonyadi et al., 2007; Wang et al., 2008, 2011; Teoh and Chung, 2009; Xiao et al., 2015; Li and Sirkar, 2016). The driving force for DCMD is the gradient of water vapor pressure across the membrane, which increases exponentially with temperature (Reid et al., 1988). Therefore, correlations based on inlet temperature or temperature gradient have limited design applicability. Equation (9) shows the definition of the average vapor pressure gradient (Gvp).

Water flux at different average vapor pressure gradients for P-12 and P-15 hollow fiber membranes. Shell-side fluid velocity = 0.091 m/s and lumen-side fluid velocity = 0.342 m/s.
where
At low recirculation flow rates, the rate-limiting step for mass transfer of water in DCMD is mainly heat transfer through the thermal boundary layers, whereas the rate-limiting step at high recirculation flow rates is membrane mass transfer resistance (Lawson and Lloyd, 1997). For the P-12 hollow fiber membranes, increasing the shell-side fluid velocity raised the temperature of the bulk fluid and reduced the temperature polarization effect on the membrane surface leading to a higher water flux as shown in Fig. 7. Although increasing the fluid velocity on the shell side would lead to a higher water flux, the benefit is negated by the higher energy expenditure from pumping. For a full-scale DCMD system, a holistic evaluation should be performed to determine the optimal fluid velocities where the ratio of purified water produced to the overall net energy input can be maximized.

Water flux as a function of shell-side fluid velocity for the P-12 hollow fiber membranes. Lumen-side fluid velocity = 0.342 m/s, Gvp = 1.7 MPa/cm.
Other research groups have also fabricated asymmetric PVDF membranes with a combination of sponge and macrovoid layers for desalination (Gryta and Barancewicz, 2010; Su et al., 2010; Wang et al., 2011). Table 5 shows a comparison of membrane properties and performance for the P-12 membrane presented in this study and other asymmetric hollow fiber membranes reported in the literature. For hollow fibers extruded using the single-layer spinneret, the P-12 membrane outperformed the PVDF-3 membrane significantly both in water flux and short-term stability. The PVDF-3 membrane had an opposite membrane configuration (i.e., an outer macrovoid layer coupled with an inner sponge layer) to that of P-12 and is susceptible to progressive pore wetting when the hot, brackish water is fed through the shell side. When compared with the membranes fabricated using the dual-layer spinneret, the P-12 membrane fares reasonably well, outperforming the M1 membrane in water flux, and the D3 membrane in LEP and mechanical strength. These results are significant with regard to full-scale manufacturing of the hollow fiber membranes as well as in system operation. From a production point of view, dual-layer spinnerets are generally more difficult to operate and maintain. The P-12 membrane was fabricated with a simple dope formulation through a single-layer spinneret. The membrane properties were manipulated simply through the bore-fluid composition, the flow rate, and the air gap to achieve the desired performance. In addition, the higher mechanical strength and LEP can also facilitate material handling and system operation.
Su et al. (2010).
Gryta and Barancewicz (2010).
Wang et al. (2011).
This study.
Outer layer/inner layer.
Shell-side inlet temperature of 80°C and lumen-side inlet temperature of 15–20°C.
Estimated using the isostrain model.
LEP, liquid entry pressure.
Thermal efficiency of the membrane modules listed in Table 5 was estimated based on the water flux and temperature data. Higher efficiency is desirable because it represents a lower level of energy loss through membrane conduction during DCMD. For an average vapor pressure gradient of about 3.2 MPa/cm (shell-side inlet temperature ∼80°C), the water flux was about 55 LMH for a DCMD module with the P-12 hollow fiber membrane. This water flux and the corresponding thermal efficiency are significantly lower than those reported by Wang et al. (2011) for the D3 hollow fiber membranes as shown in Table 5. It was hypothesized that the lower water flux and thermal efficiency of the P-12 membrane were resulted from water invading into the macrovoid layer as discussed in the following section. The D3 membrane with the inclusion of clay particles (Closite 20A) on the lumen wall would have a lower risk of water invading due to elevated hydrophobicity. Thermal conductivities (km) of the D3 and P-12 membranes were estimated using the isostrain model listed in Equation (10).
where ɛ is membrane porosity. kPVDF and kg are the thermal conductivity of the membrane material (0.19 W/m-K for PVDF) and air (0.02 W/m-K), respectively (Bui et al., 2010; Li et al., 2014).
Pore wetting and condensation tests
Salt intrusion tests were performed on both P-12 and P-15 hollow fiber membranes to examine whether pore wetting and/or condensation had occurred during DCMD experiments to adversely impact the water flux. Table 6 shows a summary of pore wetting and condensation potentials observed from the salt intrusion tests and the measured LEPs for P-12 and P-15 hollow fiber membranes. The pressure differentials (ΔPinterface) needed to maintain the air/water interface in membrane pores, were also estimated using Equation (1) and listed in Table 6. The results suggest that water on the lumen side might have invaded the macrovoid layers of the P-12 hollow fiber membranes at the onset of the DCMD operation. Figure 8 shows the NaCl crystals observed in the macrovoid layer of the P-12 fiber during the pore wetting test. Attempts were made to measure the pore openings at the lumen walls of the P-12 and P-15 fibers. Latex beads (Sigma-Aldrich) with a nominal diameter of 0.46 μm were suspended in ethanol. The lumen of the fibers was then filled with the suspension. Due to its low surface tension with PVDF, ethanol permeated through the membranes without forced advection. The membranes were oven-dried after the procedure and examined using SEM. Latex beads were observed inside the P-12 membrane but not in the P-15 membrane, suggesting that the pore openings at the lumen wall of the P-12 membrane were likely greater than those of the P-15 membrane. Although the pores at the lumen wall of the P-15 fiber were small enough to prevent pore wetting, the pore size probably imposed additional resistance to vapor transport into the lumen based on the condensation test.
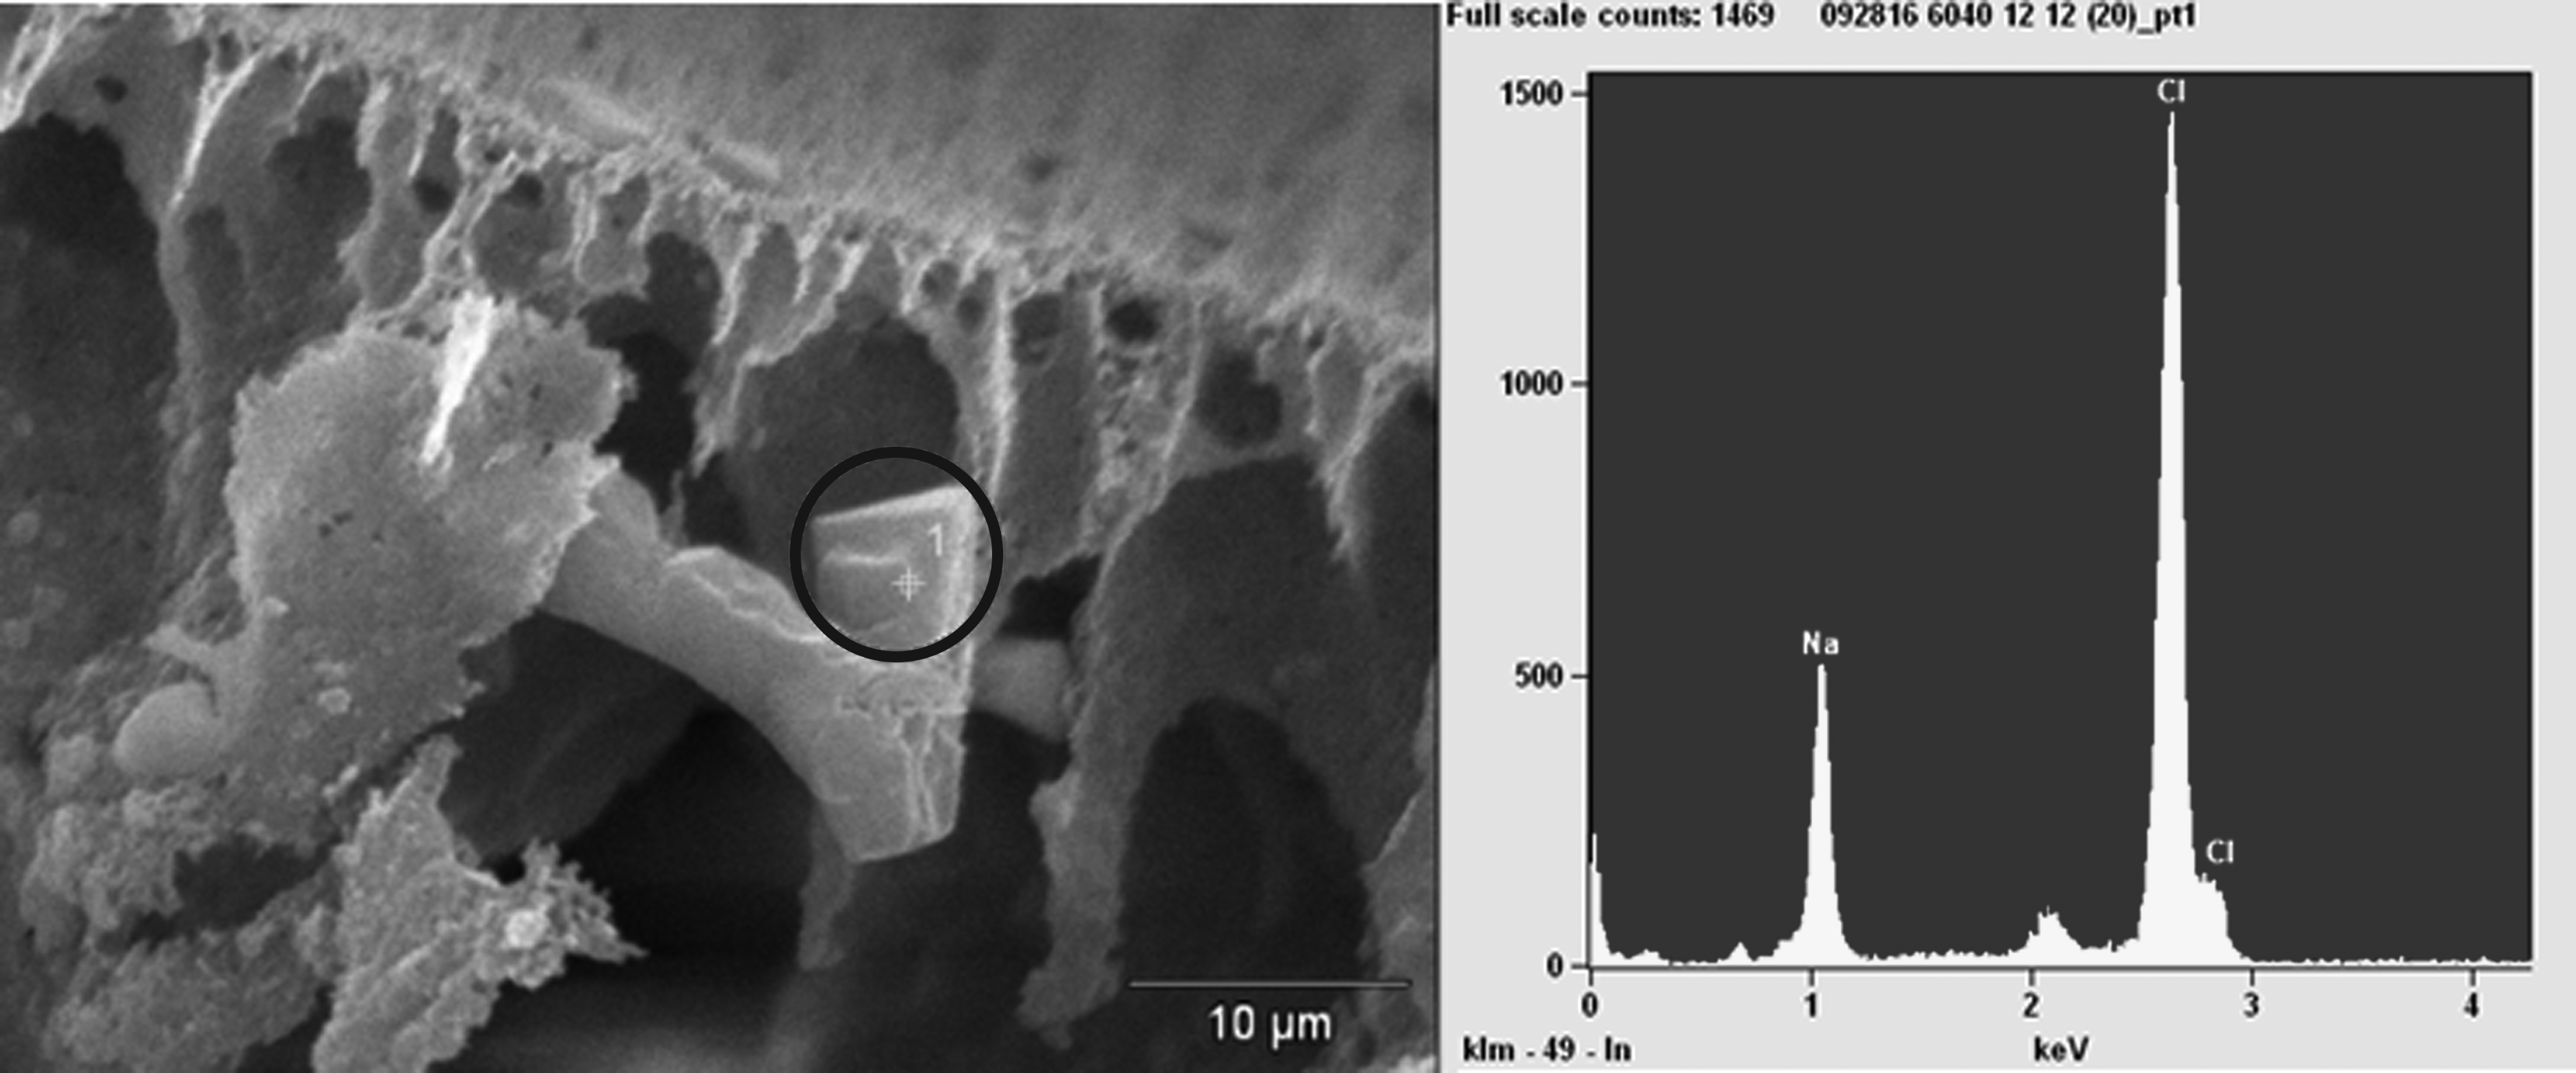
NaCl crystal observed during pore wetting test for P-12 fibers. EDX on the right shows composition of salt crystal in the black circle. EDX, energy dispersive X-ray spectroscopy.
Not applicable.
Based on Equation (1) with β = 1 and dmax in Table 4.
For membrane distillation, LEP is often used to determine whether pore wetting of the membrane would occur under the DCMD operating conditions. The values of LEP measured in this study for the P-12 and P-15 fibers were greater than 1 bar and are comparable to the values reported in the literature for similar membrane structures (Wang et al., 2011). These values represent the pressure differential needed to push water across the membrane from the lumen to the shell side. Although the pressure differentials (<0.05 bar) observed across the membranes during the DCMD experiments were smaller than the measured LEP or the calculated ΔPinterface, pore wetting still occurred for the P-12 fibers. This result suggests that neither LEP nor ΔPinterface is a good indicator for pore wetting, which is a function of local hydrophobicity and pore size at the interfaces. Pooling of water in the macrovoid layer due to pore wetting or condensation decreases the thermal efficiency and water flux of the membrane module. A potential remedy would be to increase the hydrophobicity of the lumen wall so that the associated pore size can be enlarged without pore wetting and condensation.
Short-term performance
Performance of membrane modules with P-12 hollow fibers was evaluated over 80 h of continuous operation using the synthetic geothermal water. Figure 9 shows the water flux and permeate conductivity of a module with a Gvp of about 0.79 MPa/cm (a shell-side inlet temperature of 50°C). Minimal reduction of water flux and stable salt rejection (>99.99%) were observed over the period without progressive pore wetting.
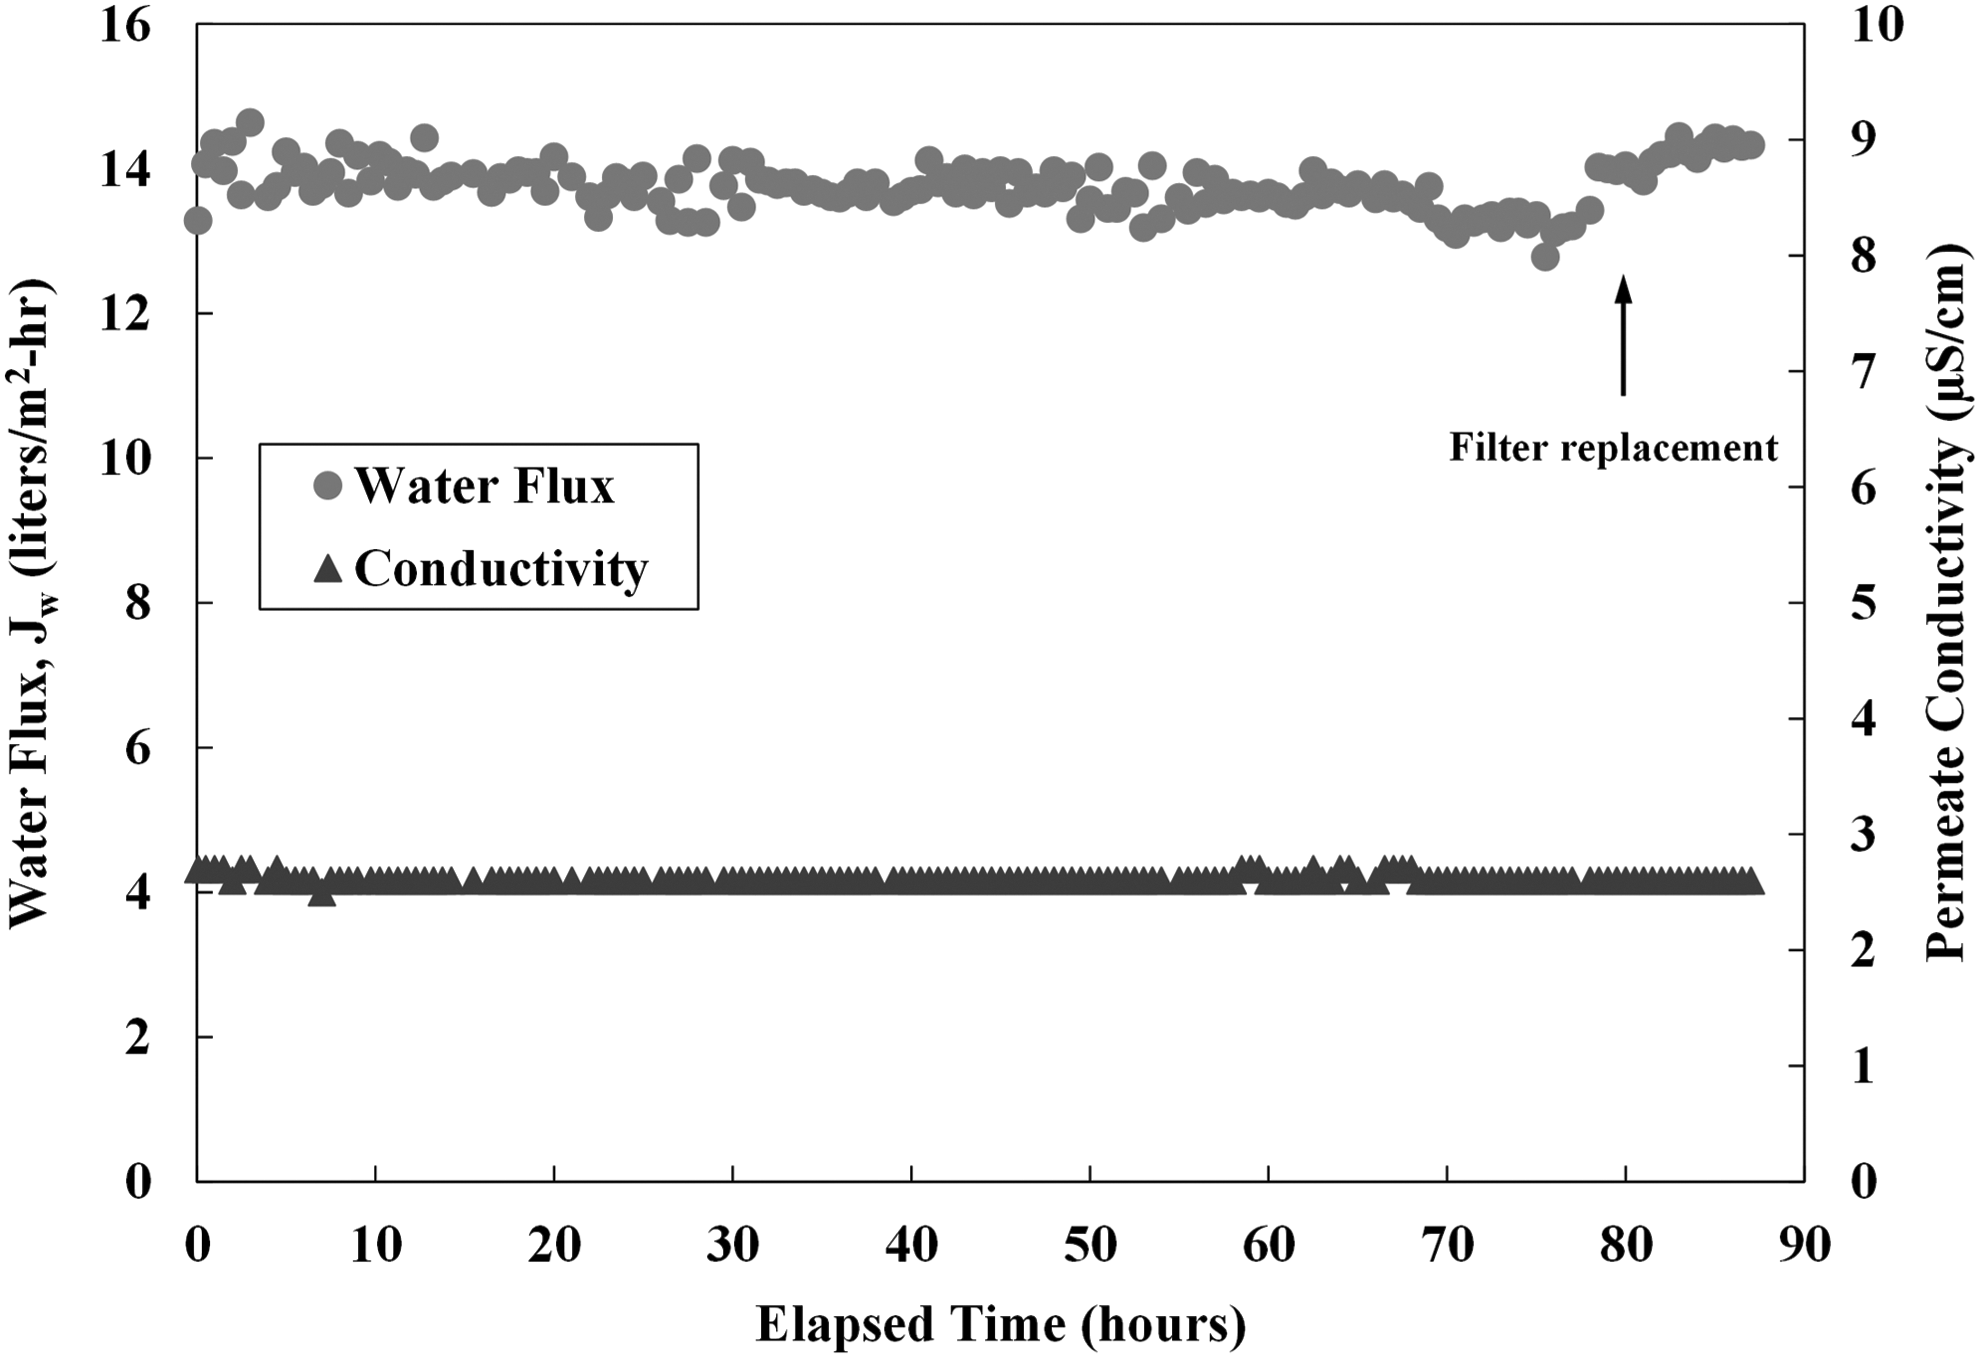
Short-term performance of membrane modules with P-12 hollow fibers. Gvp = 0.79 MPa/cm (shell-side and lumen-side inlet temperature of 50°C and 20°C, respectively). Shell-side fluid velocity = 0.091 m/s and lumen-side fluid velocity = 0.342 m/s.
Gryta and Barancewicz (2010) reported rapid decline of water flux accompanied by gradual increase of salt permeation over several hundred hours of operation for dual-layer PVDF membranes, where the macrovoids were placed at the outer layers of the hollow fibers. Their water flux reduction was attributed mainly to progressive pore wetting resulted from the membrane characteristics. Inorganic membrane fouling has also been shown to cause progressive pore wetting (Ge et al., 2014; Fard et al., 2016). Based on the ionic composition of the geothermal water shown in Table 2, an inorganic mineral, sepiolite [Mg4Si6O15(OH)2], could potentially precipitate on the membrane surfaces. However, for the membrane modules with P-12 hollow fibers, minimal water flux decline as a result of membrane fouling was observed during the short-term test.
Conclusions
Membrane distillation is reported for the first time in the literature being used to desalinate geothermal brackish groundwater for industrial greenhouse applications. Asymmetric hollow fiber membranes with a PVDF composition of 12 (P-12) and 15 wt% (P-15), respectively, were fabricated for DCMD. The P-15 fibers, which have a PVDF concentration above the critical level of 13.8 wt%, showed a lower percent of fiber defects relative to the P-12 fibers. However, the P-15 fibers were noticeably more difficult to fabricate using the dry-jet wet-spinning process due to a much higher viscosity at room temperature. For the P-12 fibers, a water flux of 55 LMH with a salt rejection greater than 99.99% was observed for an average water vapor pressure gradient (Gvp) of 3.2 MPa/cm (a shell-side inlet temperature of 80°C).
Even though the measured LEP (1.17 bars) was substantially greater than the transmembrane pressure (<0.05 bar) noted in the DCMD module during operations, pore wetting of the P-12 fibers was still observed at the onset of the DCMD operation. This result suggests that LEP is not an effective indicator for pore wetting, which can adversely impact the water flux. Reducing the pore size at the lumen interface could minimize pore wetting as evident for the P-15 fibers; however, the smaller pores may inadvertently impose additional mass transfer resistance at the lumen interface leading to water condensation in the macrovoid layer. A potential improvement for the asymmetric hollow fiber membranes (P-12 and P-15) would be to increase the hydrophobicity at the lumen interface and simultaneously enlarge the interfacial pores to facilitate mass transfer of water vapor.
Short-term performance of the P-12 hollow fiber membranes was evaluated using the synthetic geothermal fluid. Minimal reduction of the water flux at about 14 LMH and stable salt rejection over 99.99% were observed at an average water vapor pressure gradient of about 0.79 MPa/cm over 80 h of continuous operation.
Nomenclature
Ai internal surface area (m2)
Cd TDS concentration of permeate (mg/L)
Cf TDS concentration of feed (mg/L)
Do outer diameter of fiber (m)
Kg thermal conductivity of air (W/m-K)
L open channel length (m)
m flow consistency index (dimensionless)
n flow behavior index (dimensionless)
Pc bursting pressure (Pa)
Q volumetric flow rate (L/h)
Greek Letters
Footnotes
Acknowledgments
The authors express their gratitude to Jim Witcher and the staff at Masson for their help. This work was supported by the National Science Foundation Award No. IIA-1301346 to NM EPSCoR and its Osmotic Power Research Group.
Author Disclosure Statement
No competing financial interests exist.