
Abstract
Abstract
To successfully prevent diarrheal pathogen transmission, a variety of causal pathways should be considered. This study utilized a suite of tools to identify primary factors associated with diarrheal occurrences in a set of communities in Para, Brazil that had received a biosand filter (BSF). First, existing Demographic and Health Survey data sets from the departments of Para and Amazonas, Brazil were analyzed using three statistical techniques, namely: Mahalanobis-Taguchi Strategy, canonical correlation analysis, and latent factor regression. Second, results of statistical analyses were combined with a literature review and field observations to locally adapt a previously validated structural equation model (SEM) originally developed for Quiche, Guatemala. Third, a randomized household survey was used to collect data—including water sources, sanitation facilities, hygiene practices, socioeconomic statuses, education levels, BSF maintenance, and diarrheal occurrences—in Para, Brazil and analyzed with the hypothesized SEM. Household education level had the largest significant negative effect size on diarrheal occurrence, while improved water source had the largest positive significant effect size. Maintenance of the BSF in the home had a negligible effect size on diarrheal occurrence. Complex associations observed in the SEM between diarrheal occurrence and a variety of causal pathways support the view that a multibarrier intervention is warranted.
Introduction
G
The pathways of diarrheal disease transmission among humans are well established and primarily include fluids, floors, flies, fingers, and foods (Fewtrell and Colford, 2004; Eisenberg et al., 2007; Center for Disease Control and Prevention, 2013; The World Bank, 2014). Impaired water quality, the lack of proper sanitation facilities, and insufficient hygiene practices are estimated to contribute 88% of the global deaths related to diarrhea (Black et al., 2003). The biosand filter (BSF) is promoted as one technology to prevent diarrheal transmission via fluids. Recent estimates suggest a BSF has been provided to more than 450,000 households throughout 65 countries (Centre for Affordable Water and Sanitation Technology, 2013).
Two-log removal of harmful pathogens from drinking water using the BSF was demonstrated in previous studies (Palmateer et al., 1999; Stauber et al., 2006, 2009). This removal efficiency is dependent on the ability of the user to operate and maintain their filter properly (Centre for Affordable Water and Sanitation Technology, 2009). To assess the impact of the operation and maintenance of the BSF on diarrheal occurrences under the complex realities of field conditions, structural equation (SE) modeling was coupled with a randomized household survey to assess diarrheal occurrences in the municipality of Ixcan, in the department (state) of Quiche, Guatemala (Divelbiss et al., 2013).
Confirmatory SE modeling is a statistical technique that can assess multiple hypotheses, simultaneously. However, within the confirmatory framework, a limitation in SE modeling is that it cannot identify additional variables to include in the model. Therefore, due to the complexity of factors associated with diarrheal occurrences, several additional unique model identification steps were integrated into the methodology. The aim of the method integration was to improve the accuracy of the adaptation of the Guatemalan SE model to the complex field conditions in the municipality of Santarem, in the state of Para, Brazil.
The current study significantly expands upon the prior methodology and results reported for Guatemala (Divelbiss et al., 2013). To identify the important variables to be included in the formulation of the new SE model: first, three statistical tools were utilized to examine existing Demographic and Health Survey (DHS) data for the state of Para and Amazonas, Brazil. Second, the results from these statistical analyses were then investigated with a literature review and subsequent field observations and used to modify the SEM previously validated for Guatemala for Brazil. Third, the survey instrument previously utilized to collect household data in Guatemala was also modified and used as part of a randomized survey in Brazil. Finally, the collected data were analyzed with the modified SEM to identify primary factors statistically associated with diarrheal occurrences.
Experimental Protocols
Location
The current field study was conducted among fishing villages in the food plain of the Amazon River in the municipality of Santarem, in the state of Para, Brazil (2.4506 S, 54.7009 W). All houses examined in Brazil were constructed on stilts due to 5 months of seasonal flooding. For comparison, the prior study by Divelbiss et al. (2013) was conducted among farming villages in the municipality of Ixcan, in the department of Quiche, Guatemala (15.9863 N, 90.7675 W). All houses examined in Guatemala were of conventional construction.
In Brazil, the only language spoken was Portuguese; whereas, in Guatemala, the primary languages within the home included a variety of Mayan dialects, with Spanish being the secondary language. According to the Central Intelligence Agency factbook, Brazil has a Gross Domestic Product (GDP) per capita of $11,208.08 (Central Intelligence Agency, 2015b); whereas, Guatemala has a GDP per capita of only $3,477.89 (Central Intelligence Agency, 2015a). These differences were incorporated into the construction of the SEM as well as in the design of the instrument for the randomized household survey.
DHS data selection and statistical analysis
First, the most recent existing, secondary data sets from the DHS program were acquired for Guatemala and Brazil (1999 and 1996, respectively) (United States Agency International Development, n.d.). Household clustering was used in the DHS data collection. The surveys were administered at a regional level, which included a total of 1,038 surveys for the department (state) of Quiche, Guatemala, and a total of 807 surveys from a combined geographical territory, which included the states of Para and Amazonas, Brazil.
Households that did not report the presence of a child younger than 5 years of age were excluded. Households labeled as “city” or “capital” were excluded to focus on the rural population. The variables utilized in the previously validated SE model for Guatemala (Divelbiss et al., 2013) were used to identify a suitable subpopulation of variables from the DHS dataset for Guatemala. The subpopulation of DHS variables identified for Guatemala were used to select the subpopulation of DHS variables for Brazil.
For each country, the subpopulation of DHS variables was divided into two groups for analysis. To divide a dataset, variables were identified based on literature as either (1) outcome indicators of child health (e.g., diarrheal prevalence or child mortality) or (2) variables hypothesized to affect child health (e.g., water source or hygiene practices). The specific outcome indicators of child health included the variables; household experienced death of child, number of health facility visits with child, number of diarrheal occurrences had by child in past 2 weeks, response to a diarrheal occurrence, child or mother had a sexually transmitted disease, and the number of occurrences of fever or cough had by the child in the past 2 weeks. The presence of these indicators has been associated with the presence of diarrheal occurrences (UNICEF, 2009).
The group of variables hypothesized to affect those indicators included the categories of water supply, sanitation, hygiene practices, socioeconomic status, education, living arrangements, and family history, among others (see Appendix Table A1 for full list). The statistical techniques were then used to analyze the relationships between the two groups of variables.
The Mahalanobis-Taguchi Strategy (MTS) uses the Mahalanobis distance (MD) to identify variables from one group (G1) in a data set that have the highest magnitude of association with the second group (G2) in the same data set. The methodology presented in Taguchi and Jugulum (2002) was used for this study.
In the DHS datasets, G1 was variables hypothesized to affect the indicators of child health and G2 was the identified outcome indicators of child health. The software package, SPSS Version 23, was used to calculate individual MDs. The results were given in units of signal-to-noise (S-N) ratios and variables from G1 were ranked starting with the largest contribution to an improved S-N ratio in the equally weighted G2 data set. Canonical correlation analysis (CCorA) was performed as reported in Sherry and Henson (2005), using the XLSTAT routine available in Excel version 2014 (Excel, 2015). Latent factor regression (LFR) was performed as reported in Kline (2011), using Mplus Version 7.2 (Muthén and Muthén, 2012).
Constructing a modified SEM
Second, the results of the statistical analyses of DHS data, a literature review, community leader interviews, and field observations were used to create a modified SE model for Para, Brazil utilizing the approach described by Divelbiss et al. (2013) for Quiche, Guatemala. Grace (2006) presents an in-depth discussion of the SE modeling methodology.
In brief, an SE model is a regression-based technique that utilizes both latent variables and path analysis to analyze multiple hypotheses simultaneously. Latent, also known as “hidden,” variables are difficult to measure constructs, such as wealth or education, often represented by a set of observable indicator variables. In this study, indicator variables are used in a reflective style, namely: they are hypothesized outcomes of the latent variable. Selecting a reflective style also allows for the variance in the latent variable to only be attributed to the sampling distribution; thereby, improving the precision of the latent variable. Path analysis utilizes the data generated covariance matrix of all latent and observable variables and compares this with the researcher-specified hypotheses represented in matrix form.
SEM data collection
Third, a randomized household survey was used to collect data associated with the hypotheses in the Brazil SE model—including water source, sanitation facilities, hygiene practices, socioeconomic status, education level, BSF maintenance, and diarrheal occurrences—in Para, Brazil utilizing the approach described by Divelbiss et al. (2013) for Quiche, Guatemala.
In brief, the prior survey instrument [from Divelbiss et al. (2013) associated with the Guatemala SEM] was modified based upon home construction, primary language, primary vocation, and other indicators of household wealth. The survey was administered with the aid of local translators to collect data necessary to test the hypotheses depicted in the Brazil SE model. In Santarem, Para, Brazil, villages were selected out of accessibility; however, households within the villages were selected randomly and therefore clustered. Two iterations of data collection were performed, including surveys of 24 individual homes (March 2013), to pilot the modified survey tool and SE model and 41 individual homes (September 2013) to test the SE model. Once collected, data were coded and subsequently tested for multicollinearity issues, using the variance inflation factor.
SEM analysis
Finally, the data collected with the randomized household survey were analyzed with the modified SE model, as previously described (Divelbiss et al., 2013; Voth-Gaeddert et al., 2015). In brief, the SE modeling method utilized in this study was an iterative exploratory—confirmatory process. For this method, a researcher proposes a SE model (related set of hypotheses), collects field data, and tests if the data and hypotheses depicted in the SE model are not significantly different. The measurement model (i.e., only the latent variables and associated indicator variables) is tested first, if confirmed, all hypothesized relationships are then tested.
Confirmation is attained through tests of model fit, which include the chi-square test (p > 0.05), root mean square error of approximation (RMSEA <0.08), comparative fit index (CFI >0.90), and Tucker–Lewis index (TLI >0.90) (Muthén and Muthén, 2012). It is recommended that the chi-square and two other tests demonstrate good fit. If the model and data are significantly different, the researcher may modify the hypotheses, hence, becoming exploratory, and needing to reconfirm these changes based on data, literature, or field observations. If strong theoretical or observational justification cannot be given for the model modification, a new field campaign is needed to reconfirm all hypotheses.
In well-fitting models, the parameter estimates (generated from the covariance matrix) related to the hypotheses can be analyzed. These bivariate estimates are to be read as a one unit, increase in the exogenous variable (e.g., education) is associated with an increase (or decreases if negative) in the endogenous variable (e.g., diarrheal occurrences) based on the parameter estimate. The software package, Mplus 7.2, was used for this analysis (Muthén and Muthén, 2012).
Results
DHS data analysis
The DHS data were analyzed to identify variables from group 1 (G1), statistically associated with the identified outcome indicators of child health, and group 2 (G2; refers to the methods section for the list of variables). For Guatemala (n = 1,038), the top-ranked variables identified by the MTS methodology included maternal education level (2.51), paternal education level (2.15), source of drinking water (1.39), ownership of car (1.36), and the number of family members (1.17). For Brazil (n = 807), the top-ranked variables included the number of women aged 15–49 in the household (1.75), the population of the village or town (1.63), literacy (1.45), reads once per week (1.45), and if the parents are living together in the same house (1.19).
A detailed presentation of results from the CCorA and the LFR analysis is given in Voth-Gaeddert and Oerther (2015). Table 1 reports the combined results from the CCorA, LFR, and MTS according to topic. For Guatemala, the factors included education level, ethnicity, the sex of the head of the household, and water source. For Brazil, the factors included education level, sanitation, socioeconomic status, and family structure (both parents present, age at first birth, number of women in the household).
Factors found to be consistent over the different statistical techniques. Rankings are given; full list for CCorA and LFR in Voth-Gaeddert and Oerther. (2015). Set of outcome (or health indicators) variables are highly associated with households having high diarrheal occurrences.
F1 for Guatemala and Brazil was primarily related to deaths of children.
F2 for Guatemala and Brazil was primarily related to number of children younger than the age of 6 years.
The latent variable for Guatemala was created from deaths of children.
The latent variable for Brazil was created from children having either a fever, cough, or diarrhea in the past 2 weeks.
CCorA, Canonical correlation analysis; LFR, latent factor regression; MTS, Mahalanobis–Taguchi Strategy; S-N, signal-to-noise.
Constructing a modified SE model
Based on Divelbiss’ validated SE model from Guatemala, the DHS analysis (MTS, CCorA, and LFR) from the Brazil data, a literature review, and field observations, a SE model for villages in Santarem, Para, Brazil was hypothesized. Table 2 lists the variables in the hypothesized SE model and provides information for each. Further discussion on the causal associations hypothesized in the original model can be found with Divelbiss et al. (2013).
BSF, biosand filter; WHO, World Health Organization.
Figure 1 depicts the hypothesized full SE model for Brazil. Household education level and socioeconomic status were both hypothesized as latent variables (ovals), each having specific observable indicator variables (rectangles) influenced by the latent variable. There were four covariates (rectangles) and two latent variables hypothesized to affect diarrheal occurrences (defined as separate diarrheal occurrences within the past 2 weeks; arrows denote hypotheses). In addition, three covariates and both latent variables were also hypothesized to be mediated by the covariate, filter operation, and maintenance (FOM). Based on SE modeling identification rules, the hypothesized SE model was overidentified denoting a unique solution could be computed (Kline, 2011).
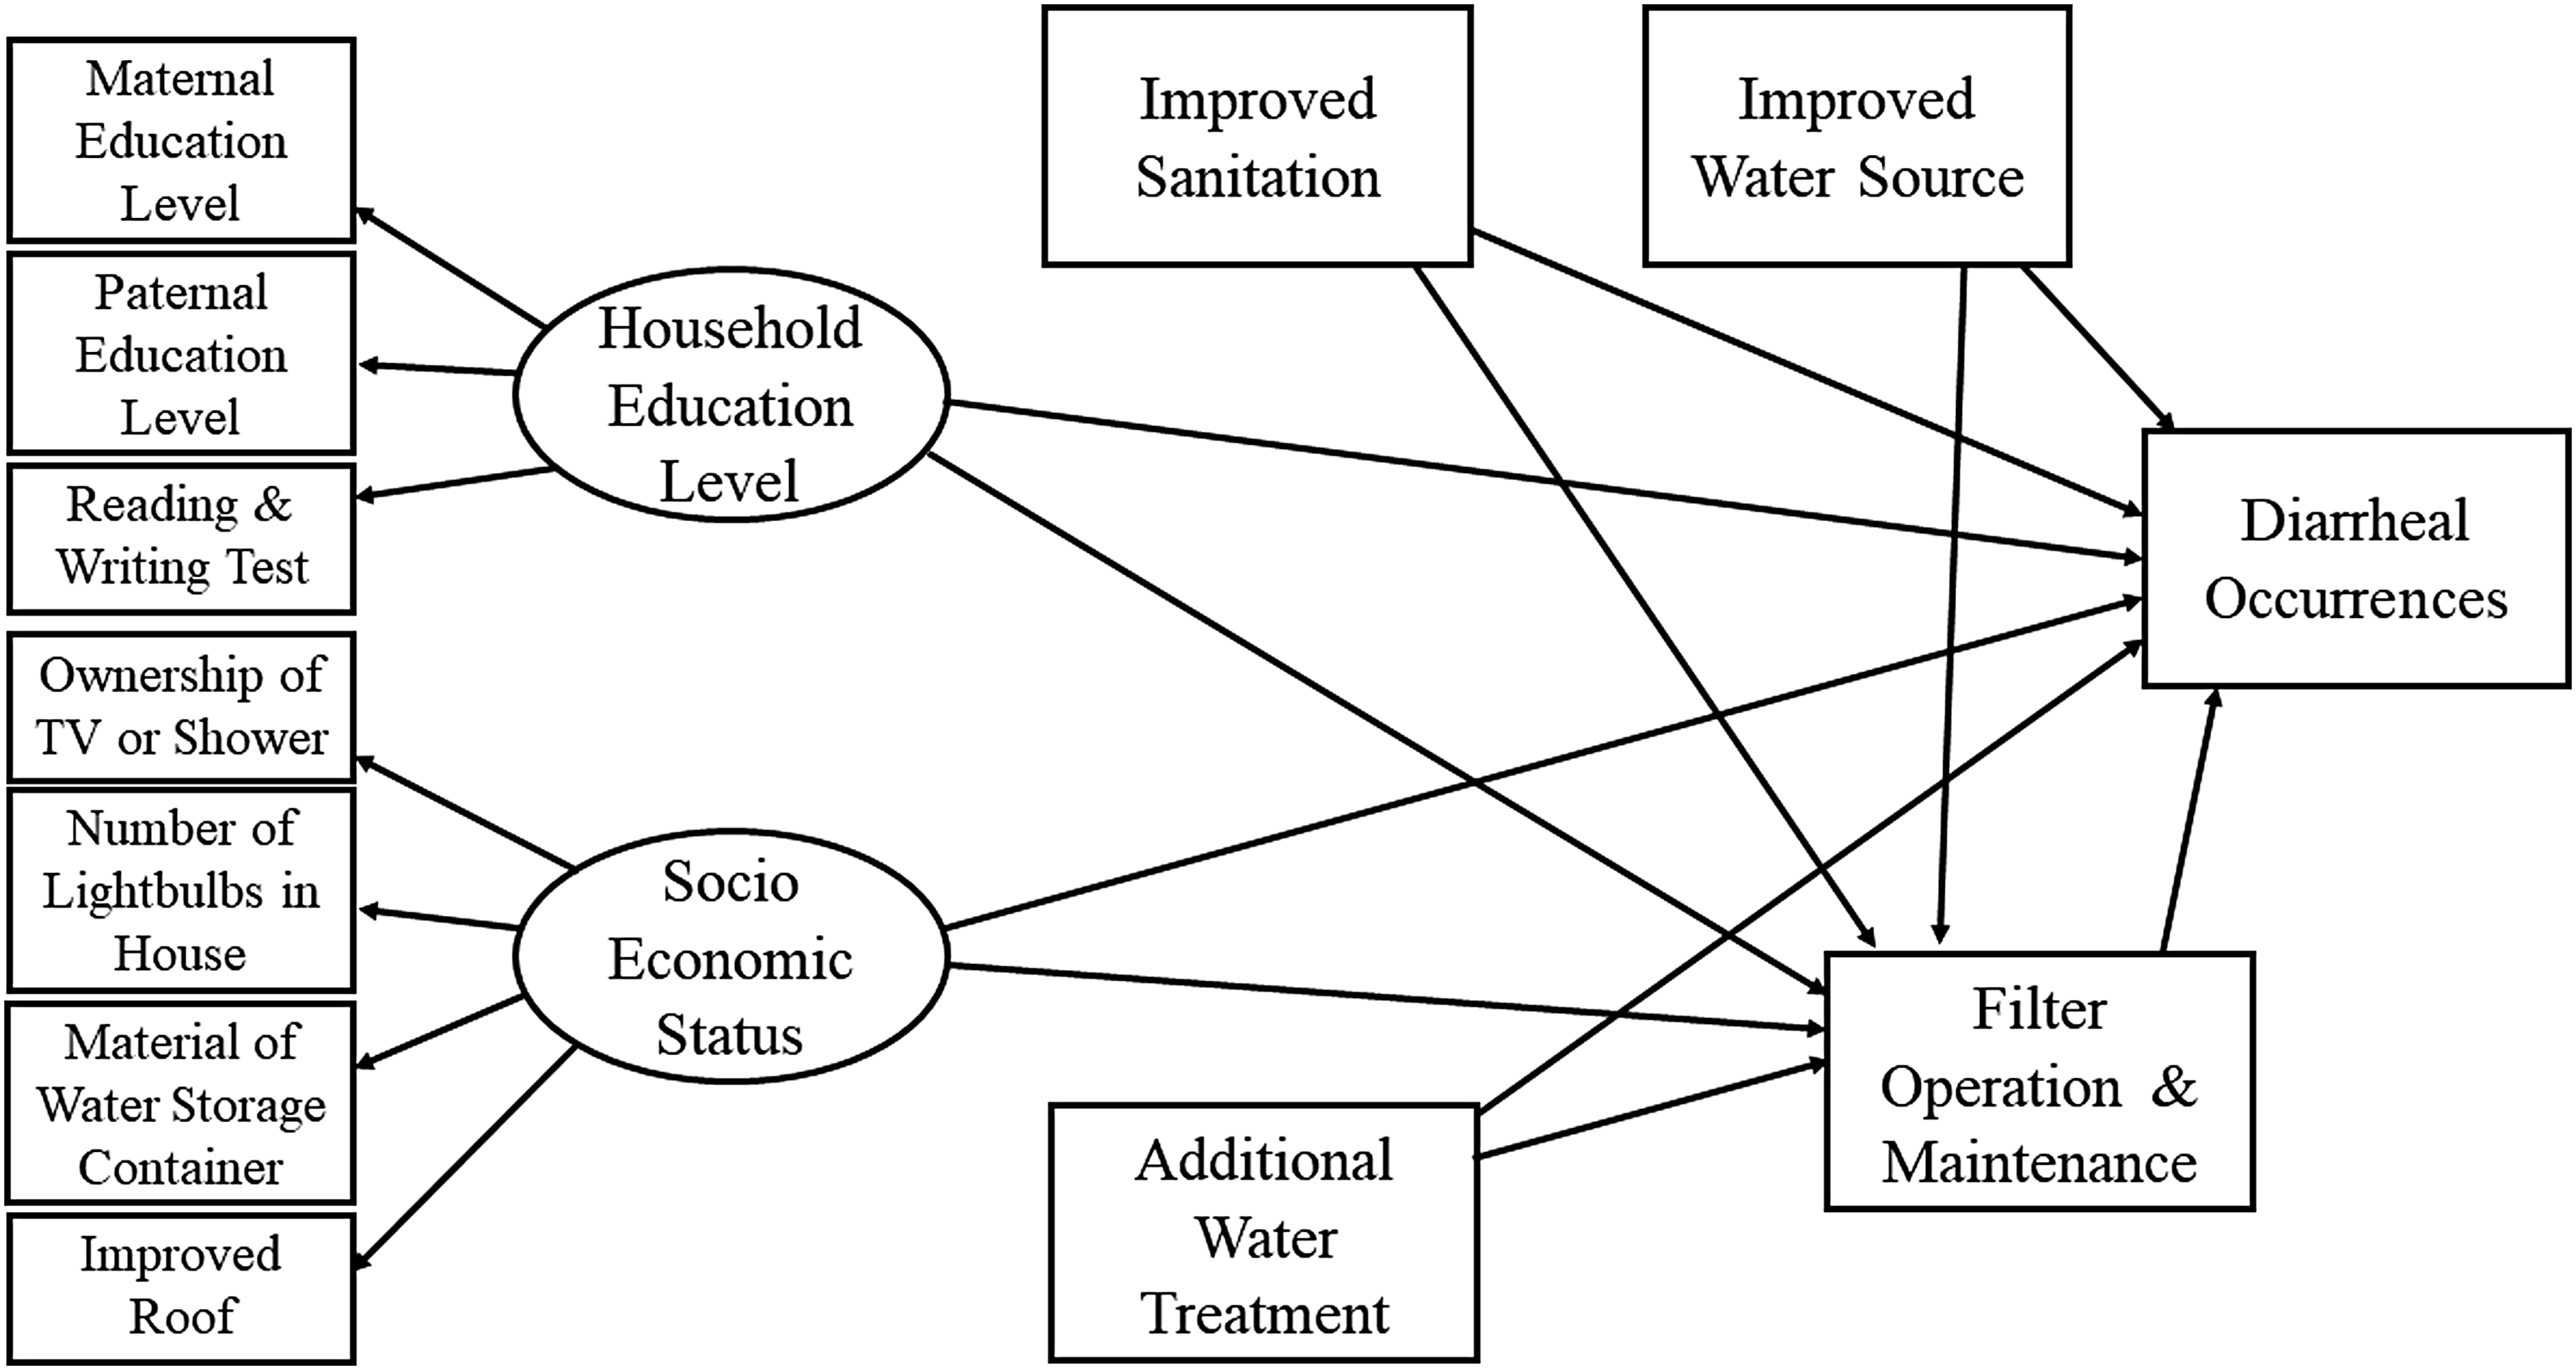
Full hypothesized SE model for analysis in Brazil. Ovals are latent variables, circles with “e” are error terms, rectangles are observed variables, and arrows depict hypothesized relationships. Adapted from Voth-Gaeddert et al. (2015). SEM, structural equation model.
SE modeling data collection results
After the field data were collected, multicollinearity among the variables was tested using the variance inflation factors; no variables were above four, indicating that multicollinearity was not an issue. The XLSTAT routine available in Excel version 2014 was used for the initial analysis. Table 3 displays the descriptive statistics for the randomized household survey data collection from Brazil.
SD, standard deviation.
SE modeling analysis
To test if the data and hypotheses depicted in the SE model for Brazil were not significantly different, first, the measurement model was analyzed. The set of tests (chi-square, etc.) showed inadequate fit of the data to the measurement model (χ2 p > 0.002; RMSEA = 0.340; CFI = 0.72; TLI = 0.75). Reviewing the Mplus output (high p-values, large residual correlations, and high modification indices), the improved roof indicator in the socioeconomic status latent variable was identified as the cause of poor fit.
From field observations, roofing material did not change as the household's socioeconomic status increased. With this confirmatory field observation, the improved roof variable was therefore eliminated and the measurement model reevaluated. The analysis of the modified measurement model showed adequate fit (χ2 p > 0.284; RMSEA = 0.073; CFI = 0.98; TLI = 0.97), which permitted the evaluation of the full hypothesized model.
The fit of the data to the hypothesized full SEM for Brazil, including the latent variables and the covariates, showed initial poor fit. Analyzing the Mplus output, two hypothesized relationships were identified as the cause of poor fit; the association between (1) socioeconomic status and FOM; and (2) additional water treatment and diarrheal occurrences. From field observations, the indicator variables associated with the socioeconomic latent variable (i.e., ownership of material items) did not vary widely between households (i.e., households tended to own the same things). The raw data showed that both multiple-working light bulbs and ownership of a shower or television had limited alternative responses of 32% and 29%, respectively. This limited variation increased the difficulty in identifying statistically significant relationships with the other variables.
The second association—diarrheal occurrences on additional water treatment—was investigated via a reevaluation of the literature. Sobsey et al. (2008) reported the efficacy of water treatment in poor households was reduced as more steps were required in the process to attain potable water. As there was either observational data or literature support for eliminating these two hypotheses, the full model could be modified and reanalyzed without conducting another field campaign. The modified full model showed good fit (χ2 p > 0.617; RMSEA = 0.000; CFI = 1.00; TLI = 1.08) allowing for the interpretation of the parameter estimates.
Figure 2 graphically depicts the final full model with parameter estimates. Arrows are colored and enlarged to represent direction of hypothesized influence and effect size, respectively. Dashed arrows are parameter estimates with a p-value greater than 0.20. As shown in Fig. 3, the variable with the largest positively associated effect size on FOM was improved water source with a standardized parameter estimate of 0.353 (p = 0.038). In SE modeling terminology this meant that as improved water source was increased by one standard deviation (SD) unit, the FOM was increased by 0.353 SD units. Other factors positively associated with the FOM were improved sanitation (0.277; p = 0.100) and household education level (0.256; p = 0.016). Additional water treatment had a negative association with the FOM (−0.344; p = 0.005).
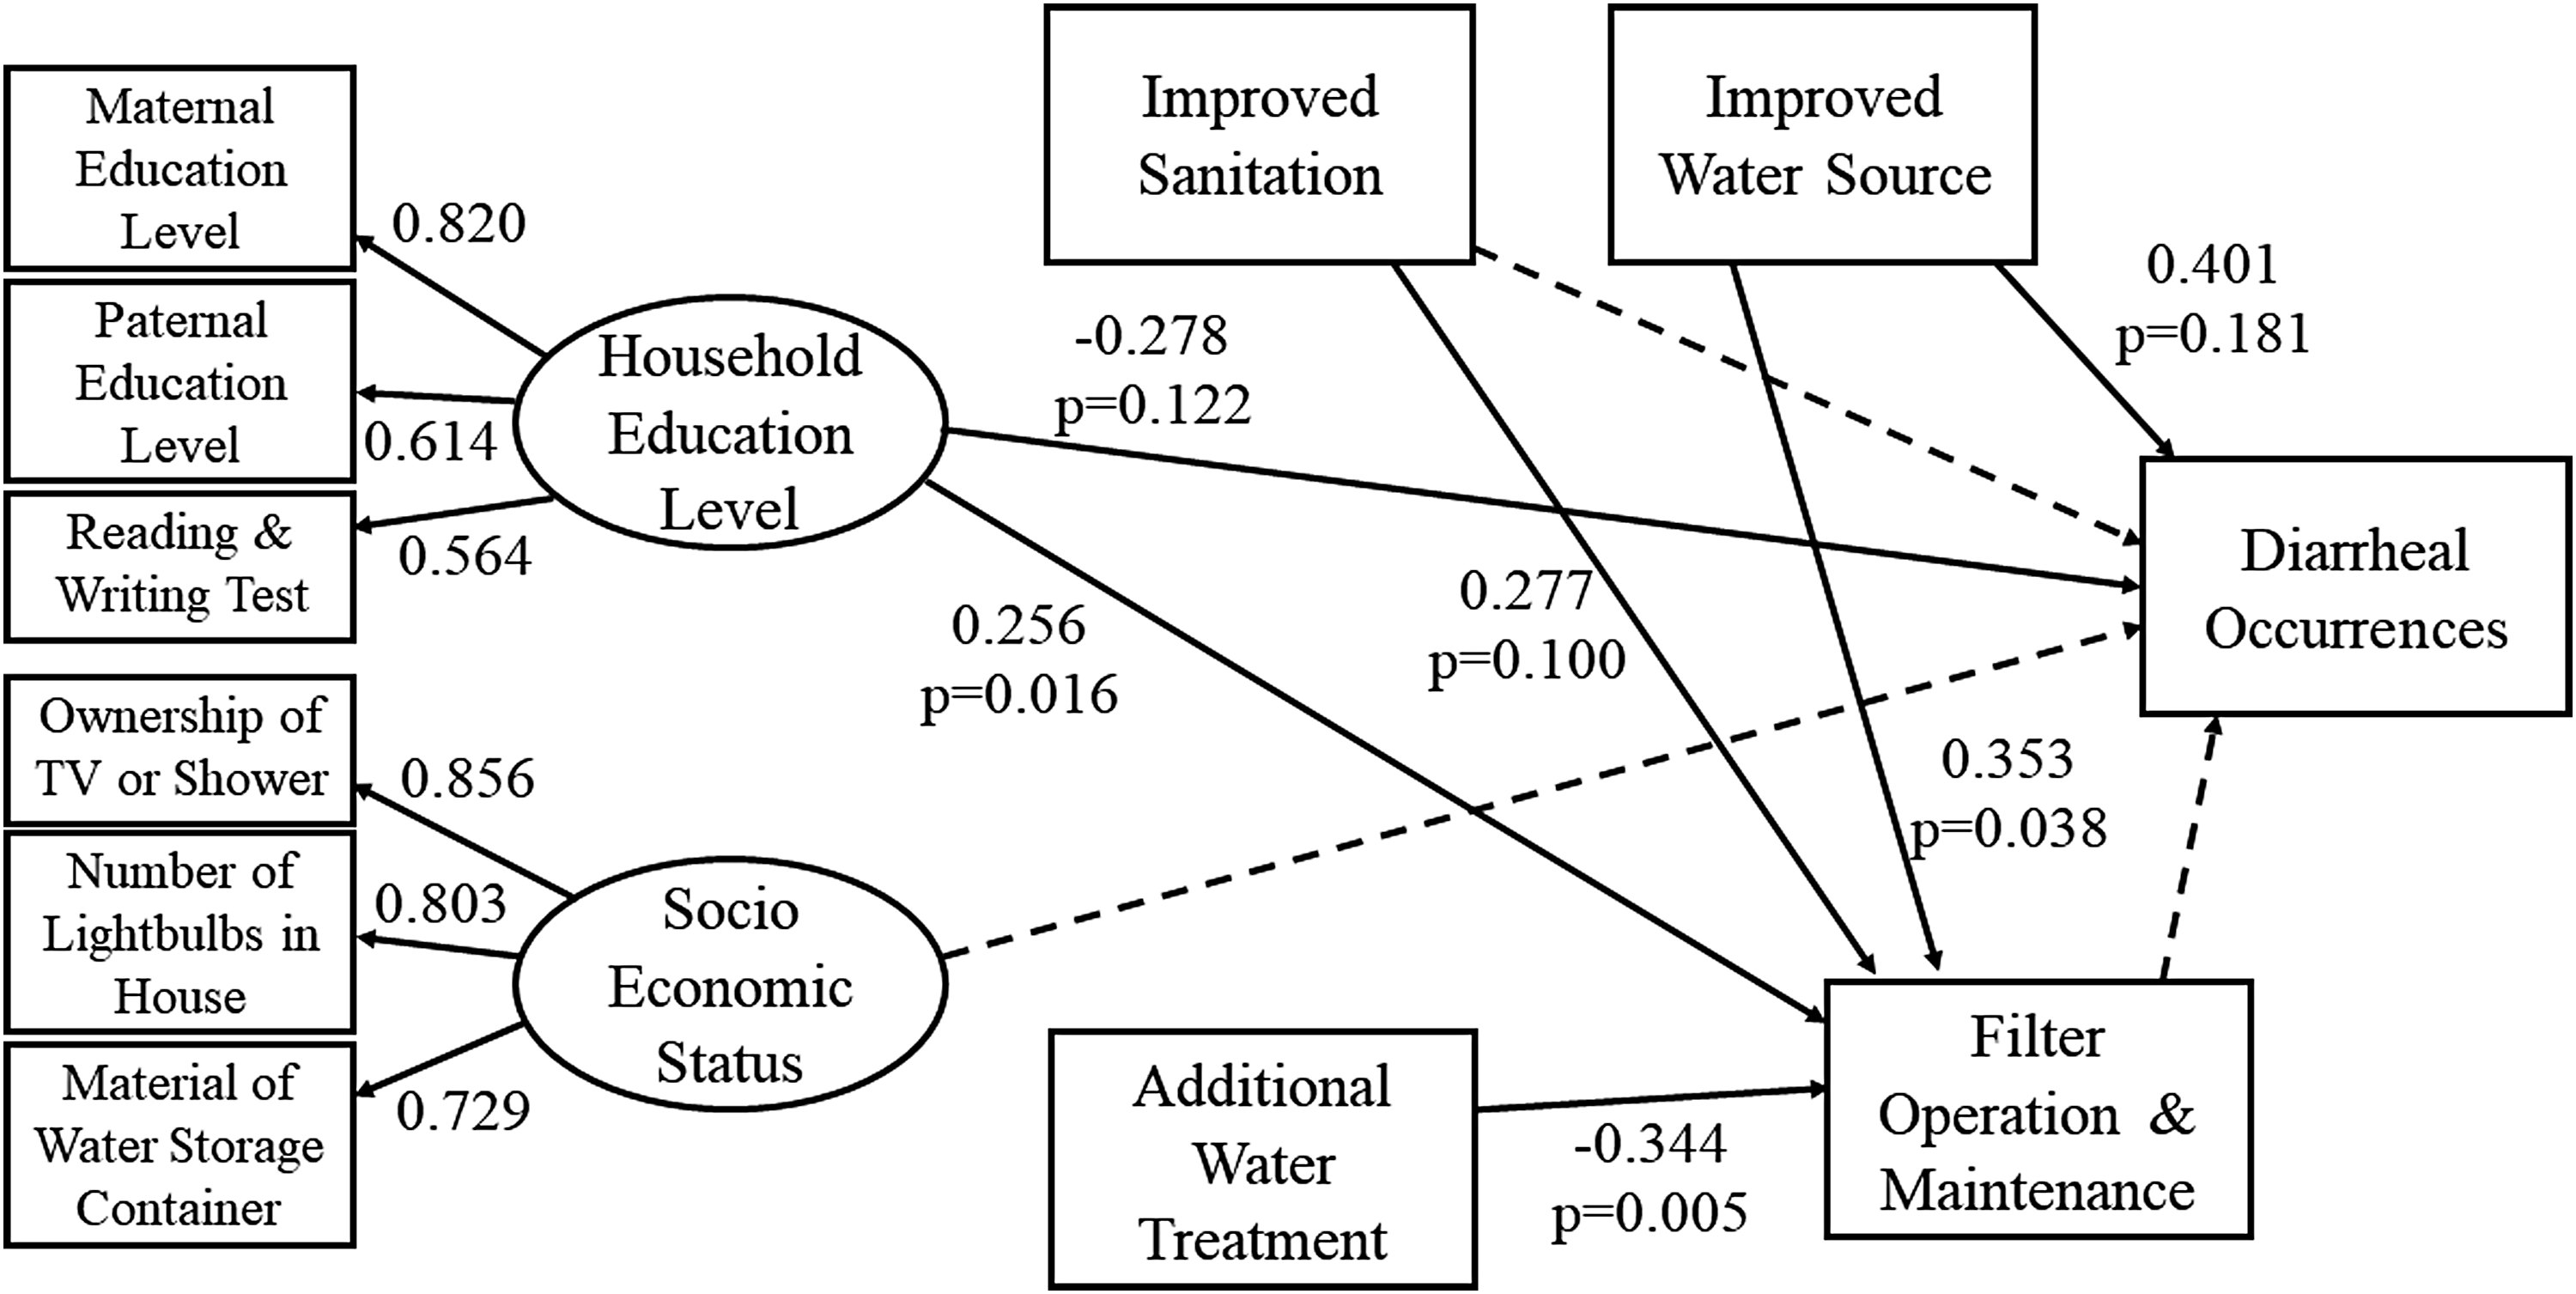
Full SE model with final parameter estimates of hypotheses. dashed arrows identify insignificant relationships at a 20% level. Standardized estimates given and given with p-values. Overall model fit was good (χ2 p > 0.617; RMSEA = 0.000 [CI: 0.000–0.093]; CFI = 1.00; TLI = 1.108). CI, confidence interval; CFI, comparative fit index; RMSEA, root mean square error of approximation; TLI, Tucker–Lewis index.

Study methodology. CCorA, canonical correlation analysis; DHS, Demographic and Health Survey; LFR, latent factor regression; MTS, Mahalanobis–Taguchi Strategy.
For the diarrheal occurrence variable, household education level had a negative effect (−0.278; p = 0.122; decreased diarrheal occurrences) while improved water source had a positive effect (0.401; p = 0.181). Overall, 41% of the variance in FOM was explained by variables in the model, while 28% of the variance in diarrheal occurrences was explained.
Discussion
Study design
From the series of steps presented in Fig. 3, several specific pieces greatly contributed to improving the validation of the hypotheses. First, as this method utilized multiple datasets and multiple analysis techniques to create and test hypotheses, confidence in the results increased. Second, utilizing multiple statistical techniques also reduced the potential for statistical bias from the limitations of individual techniques. However, several specific pieces of Fig. 3 need improvement. First, there are no validated approaches for identifying important factors based on the magnitude and quantity of significant variables from a suite of statistical techniques. Second, it is difficult to give weight to the importance of each of the contributing resources in hypothesizing the SEM (i.e., previous models, literature reviews, field observations, and DHS results).
Limitations of the study
Potential limitations within the DHS analysis included the geographic region represented by the data and the type of variables available within the datasets. This may have limited the applicability of DHS results to the subregion targeted for the SE modeling analysis in Brazil (i.e., states of Amazonas and Para to municipality of Santerem, Para). For the MTS analysis, the direction of the impact could not be differentiated from the magnitude of the interaction. As this was the first study to use these three statistical techniques in combination with SE modeling, the method for identifying important factors was yet to be validated.
Potential limitations in the SE modeling data collection and analysis were the sample size and model modifications. First, the recommended minimum number of observations for a SE model is n = 50 (Iacobucci, 2010), therefore inflated chi-square values and larger standard errors were expected due to the small sample sizes from the two separate field campaigns. However, with the prior work (Guatemalan SE model, DHS analysis, and field observations), parameter confidence intervals, and multiple iterations of data collection (i.e., the pilot and the testing), there was confidence that sufficient power was reached for the assessment.
Second, if a model fails to pass the model fit tests, the researcher has the ability to modify the model (i.e., the hypotheses). However, caution is needed that this model modification is driven by theory (i.e., reviewing the literature, conducting field observations, etc.) and not by the SE modeling data. The model modifications made in this study were supported by field observations and the literature. Finally, SE modeling provides a way to reject a set of hypotheses, however, this means that better models are possible and need to be tested in separate field campaigns.
DHS analysis
Table 2 displays the results from the three statistical techniques applied to the subpopulation of DHS data. For Guatemala, this provided validation for the relationships hypothesized in the Guatemalan SE model by Divelbiss et al. (2013). The DHS dataset did not include ownership or operation of a BSF. The data support the notion that the education level of parents may contribute to a variety of measures of child health. The data supported the finding by Divelbiss et al. (2013); that education level, followed by water source, had the highest significant parameter estimates in relationship with diarrheal burden. These findings provide further support to (1) the validity of the Guatemalan SE model and (2) the association between education and health (Baker et al., 2011) as well as water sources and health in Guatemala (Hunter et al., 2010).
Four factors were also identified from the subpopulation of variables in the Brazil DHS data. Education level was again identified as important, along with sanitation (number of toilets and has vacuum cleaner) and socioeconomic status (ownership of specific items). In addition, the factor titled “family structure” was created to categorize variables identified as contributing to the internal family or household dynamic.
The next step was to combine the results of the DHS analysis for Brazil with a literature review of articles from Brazil and finally with field observations. All four factors were supported by the literature as having a relationship with child health, however, there was not sufficient literature support or project resource to warrant the inclusion of family structure in the Brazilian SE model. After completion of the literature review, field observations were conducted to (1) confirm findings from the DHS analysis and literature review and (2) identify potential confounding relationships between covariates. From the DHS analysis, literature review, and field observations, the SE model from Guatemala was rehypothesized for the realities of Brazil along with the coupled survey instrument.
SEM analysis
In the Brazil SE model, five variables were hypothesized to influence the FOM. Four of the hypotheses were supported by the data collected in the field campaign. Improved water source had the largest positive association with the FOM. This meant that as households acquired improved water sources as identified by the WHO, they were more likely to better maintain and operate their filter, confirming the original hypothesis. Similarly, improved sanitation had a positive association with the FOM, confirming the original hypothesis. For households with improved water sources or improved sanitation facilities, the data suggested that the factor(s) which influenced households to utilize these improved resources may have also contributed to the factor(s) associated with improved FOM.
The data also showed that an increase in household education level was associated with an increase in the FOM confirming the original hypothesis. The Centre for Affordable Water and Sanitation Technology (CAWST) strongly recommends and provides assistance for FOM training (Centre for Affordable Water and Sanitation Technology, 2009), however, the results showed that higher general education levels within households were also associated with better FOM. Finally, additional water treatment had a negative association with the FOM. This result was counter to the original hypothesis. As speculated previously, Sobsey et al. (2008) suggests that a decrease in the number of water treatment steps results in an increase in the proper adherence to correct practices.
In the Brazil SE model, seven variables were hypothesized to influence diarrheal occurrences. Two of the hypotheses were supported by the data, three were nonsignificant individually, yet, contributed to overall model fit, and two hypotheses were nonsignificant and did not contribute to the model fit. Household education level had a negative association with diarrheal occurrences. This suggested that as the household education level increased, diarrheal occurrences within the household decreased. This finding supports a growing body of literature on the association between education and health (Baker et al., 2011). Within this subregion of Brazil, household education level may have aided in the understanding of the different potential transmission pathways for diarrheal diseases.
Improved water source had a positive association with diarrheal occurrences, which was counter to the hypothesis. An investigation of the raw data showed that the majority of households who were classified as having an improved source of water, utilized the community distribution system (62%). From field observations, the community tank received its water from the same river as households with unimproved sources of water. Further research is needed to investigate the water quality of the community water distribution system. Improved sanitation had a negative, but nonsignificant association with diarrheal occurrences. This hypothesis was based on the DHS analysis, the literature, and field observations.
In the villages, latrines were used, which were elevated and emptied directly into the river. The potentially high pathogen loads from these latrines could be distributed downstream to other households. Fuller et al. (2016) showed that the presence of improved sanitation facilities in neighboring households was associated with an improvement of child health in target households, as measured by child height-for-age. Andres et al. (2014) demonstrated the association between household and community latrine coverage with diarrheal occurrences in India. Finally, both the FOM and socioeconomic status had a negligible association with diarrheal occurrences. The lack of a significant relationship for both variables to diarrheal occurrences did not support the original hypotheses.
Brown and Clasen (2012) highlighted the overall importance of water treatment using a risk model; however, they concluded that even a small deviation in sustained operation and maintenance is related to a sharp decline in health benefits. Furthermore, in a systemic review by Clasen et al. (2007), the authors note that various unique field conditions give rise to, yet-to-be-explained, mechanisms, which reduce effectiveness of WASH interventions.
Based on these results, several recommendations are offered; first, immediate further investigation of the water source for the communities is needed to ensure potable water is being distributed. Second, as sustainable operation and maintenance of water treatment has been associated with health benefits, targeted training and community health announcements should be provided to support both the use of the BSF as well as the effective use of additional water treatment options. Finally, among field practitioners and applied researchers working on diarrheal issues, investigatory approaches that can account for multiple factors do provide key insight to complex scenarios and should be considered.
Summary
This is the first study to demonstrate the use of a set of statistical techniques (MTS, CCorA, LFR) to aid in the development and testing of a set of hypotheses in a SE model. Utilizing this methodology for complex problems offers several benefits; (1) improved development and testing of the hypotheses, (2) multiple statistical perspectives of the same data, and (3) a reduction in systematic bias from any one statistical technique. This study should reinforce to policy makers, practitioners, and researchers that diarrheal disease transmission is complex and consideration for use of multibarrier interventions should be taken.
Footnotes
Acknowledgments
Supportive persons in this research included Gil Serique, Andrew Schranck, and Tommy Goodwin.
Author Disclosure Statement
No competing financial interests exist.
| v012 | Current age—respondent |
| v104 | Years lived in place of res |
| v105 | Type of place of previous res |
| v106 | Highest educational level |
| v107 | Highest year of education |
| v108 | Literacy |
| v109 | Reads newspaper once a week |
| v110 | Watches TV every week |
| v111 | Listens to radio every day |
| v113 | Source of drinking water |
| v114 | Source of nondrinking water |
| v116 | Type of toilet facility |
| v119 | Has electricity |
| v120 | Has radio |
| v121 | Has television |
| v122 | Has refrigerator |
| v125 | Has car |
| v127 | Main floor material |
| v128 | Main wall material |
| v129 | Main roof material |
| v130 | Religion |
| v131 | Ethnicity |
| v133 | Education in single years |
| v136 | Number of household members |
| v137 | Number of children 5 and under |
| v138 | Number of eligible women in HH |
| v142 | Same source of water |
| v148 | Respondent still in school |
| v149 | Educational attainment |
| v150 | Relationship to household head |
| v151 | Sex of household head |
| v152 | Age of household head |
| v154 | Reason stop attending school |
| v201 | Total children ever born |
| v202 | Sons at home |
| v203 | Daughters at home |
| v204 | Sons elsewhere |
| v205 | Daughters elsewhere |
| v206 | Sons who have died |
| v207 | Daughters who have died |
| v208 | Births in last 5 years |
| v209 | Births in past year |
| v212 | Age of respondent at 1st birth |
| v213 | Currently pregnant |
| v218 | Number of living children |
| v228 | Ever had a terminated preg. |
| v409 | Gave child plain water |
| v409a | Gave child sugar water |
| v410 | Gave child juice |
| v410a | Gave child herbal tea |
| v411 | Gave child powder/tinned milk |
| v411a | Gave child baby formula |
| v412 | Gave child fresh milk |
| v413 | Gave child other liquid |
| v414a | Gave papilla process industr. |
| v414b | Gave papilla mixed w/vitamins |
| v414c | Gave yogurt |
| v414e | Food mingau w/fuba, rice |
| v414f | Food mingau w/vegetab. fruits |
| v414g | Gave child eggs, fish, poultry |
| v414h | Gave child meat |
| v415 | Drank from bottle with nipple |
| v448 | Drinking pattern with diarrhea |
| v449 | Eating pattern with diarrhea |
| v450a | Diarrhea: repeat watery stools |
| v450b | Diarrhea: Any watery stools |
| v450c | Diarrhea: Repeated vomiting |
| v450d | Diarrhea: Any vomiting |
| v450e | Diarrhea: Blood in stools |
| v450f | Diarrhea: Fever |
| v450h | Diarrhea: Not eating/drinking |
| v450i | Diarrhea: Getting sicker |
| v450j | Diarrhea: Not getting better |
| v450k | Diarrhea: difficult to drink |
| v450l | Diarrhea: stomach pain |
| v450x | Diarrhea: Other responses |
| v450z | Diarrhea: Does not know |
| v451a | Cough: Fast breathing |
| v451b | Cough: Difficult breathing |
| v451c | Cough: Noisy breathing |
| v451d | Cough: Fever |
| v451f | Cough: Not eating/drinking |
| v451g | Cough: Getting sicker |
| v451h | Cough: Not getting better |
| v451i | Cough: difficult to swallow |
| v451x | Cough: Other responses |
| v451z | Knows no sign of illness |
| v452 | Number of health facility visits |
| h11$1 | Had diarrhea recently |
| h11b$1 | Blood in the stools |
| h11c$1 | Bowel movements in worst day |
| h22$1 | Had fever in last 2 weeks |
| h31$1 | Had cough in last 2 weeks |
| h31b$1 | Short, rapid breaths |
| v701 | Partner's education level |
| v702 | Highest year of education |
| v704 | Partner's occupation |
| v705 | Partner's occupation |
| v714 | Respondent currently working |
| v715 | Husbands education-single yrs |
| v716 | Respondent's occupation |
| v717 | Respondent's occupation |
| v718 | Current type of employment |
| v720 | Earns cash for work |
| v721 | Works at home or away |
| v729 | Partner's educational attainm. |
| v730 | Partners age |
| v731 | Worked in last 12 months |
| v732 | Employment all year/seasonal |
| v739 | Who decides how to spend money |
| mm1$01 | Sex of sibling |
| mm2$01 | Sibling's survival status |
| mm1$02 | Sex of sibling |
| mm2$02 | Sibling's survival status |
| mm1$03 | Sex of sibling |
| mm2$03 | Sibling's survival status |
| s22b | Number of color televisions |
| s22c | Number of radios |
| s22d | Number of toilets |
| s22e | Number of cars |
| s22f | Number of household maids |
| s22g | Has vacuum cleaner |
| s22h | Has washing machine |
| s22j | Has VCR/Betamax |
| s23 | Total rooms in household |
| s107 | Ever attended school |
| s108 | Highest serie attained |
| s109 | Highest educational level |
| Seduc | Resp. education level/published |
| s120 | Freq. attend religious service |
| s121 | Ethnicity self-classification |
| s239 | Ever been to gynecology exam |
| s241 | Gynecology exam last 12 months |
| s242 | Last exam include mammogram |
| s243 | Last exam include pap smear |
| s244 | Last exam showed any problem |
| s317a | Does the respondent smoke |
| s703 | Husband ever attended school |
| s704 | Husband highest serie attained |
| s705 | Husband highest educat. Level |
| seduch | Husb. education level/publishd |
| s707 | Husband's employment type |
| s708 | Husband has work certificate |
| s713 | Respondent ever worked |
| s715 | Why respondent stopped working |
| s717 | Respondent's employment type |
| s717a | Respon. has work certificate |
| s444v$1 | Received vitamin A |
| s448a$1 | Child has fever today |
| s449a$1 | Child has cough today |
| s453a$1 | Has diarrhea today |