
Abstract
Abstract
Evaporation and degradation of the nerve agent, VX [O-ethyl S-2-(N,N-diisopropylamino)ethyl methylphosphonothioate] was explored on common urban or industrial surfaces, including sand, soil, and concrete. Concentration profiles of VX vapor were obtained using a laboratory-sized wind tunnel and thermal desorber in conjunction with gas chromatography. Results show that released VX vapors amounted to <20% of the applied mass and evaporation rates were found to be 0.12 μg/min in sand, 0.088 μg/min in soil, 0.16 μg/min in concrete (water–cement ratio, w/c = 0.50), which are ∼5–10 times slower than in the glass surface. At elevated temperature of 35°C, rates remarkably increased at 0.44 μg/min in sand, 0.12 μg/min in soil, and 0.67 μg/min in concrete. Rates also increased with lower w/c in concrete (0.48 μg/min in concrete [w/c = 0.42] and 0.76 μg/min in concrete [w/c = 0.31]). On the other hand, a drop of neat VX sorbed into the matrices remained for days and degraded following a pseudo first-order rate reaction. Estimated half-lives of VX in these matrices were ∼6 days in sand, 8 days in soil, and 3 days in concrete (w/c = 0.50) at room temperature. Degradation products were the following: ethyl methylphosphonic acid (EMPA), ethyl methylphosphonothioic acid (EMPT), methylphosphonic acid (MPA), 2-(diisopropylamino)ethanethiol (DESH), and bis(2-diisopropylaminoethyl) sulfide [(DES)2]. Parameters, which were quantified and evaluated in this study, will be useful for database establishment in risk assessment of exposure of the general population to highly lethal VX.
Introduction
N
O-Ethyl S-2-(N,N-diisopropylamino)ethyl methylphosphonothioate, better known under the moniker VX, is relatively persistent on a wide range of surfaces, including material, equipment, and terrain when it is dispersed because of its low volatility and high stability (Gura, 2006). Accordingly, VX raises the issue of long-term hazards caused by the contaminated matrix, and the fate of VX in preservative environmental surfaces is a topic of acute interest. Moreover, the military requirements for the estimation of volatilization rates, degradation products, and decontamination procedures have led to substantial research in this area.
Since Verweij and Boters' first report on the degradation of VX in soil (Verweij and Boter, 1976), numerous reports have been published on its terrestrial fate, focusing on degradation products from a variety of environmental matrices (Hook et al., 2003; Jang et al., 2015; Hernon-Kenny et al., 2016). Wagner et al. (2001) used 31P solid-state magic-angle spinning nuclear magnetic resonance spectroscopy to show that concrete rapidly sorbs VX drops with a half-life of 2 min and the sorbed VX slowly hydrolyzes with a half-life of 28 days–3 months. During this time, VX degrades to ethyl methylphosphonic acid (EMPA), 2-(diisopropylamino)ethanethiol (DESH), and bis(2-diisopropylaminoethyl) sulfide [(DES)2].
Brevett et al. (2009) reported that the VX degradation rate was five to nine times slower on moist sand than on air-dried sand, indicating that the VX degradation mechanism differs on the moist and dry surfaces. Mizrahi and Columbus (2005) showed that VX degrades with a 4-day half-life, following the first-order reaction on desert sand, whereas the degradation on beach sand has a lag time of 10 days followed by the first-order rate. However, the available fate data are quite limited and even if available, extremely variable, especially in urban surfaces, including sand and concrete matrices. Information on the rate of evaporation and degradation from urban surfaces of the most toxic VX is still insufficient as well (Waysbort et al., 2004; Columbus et al., 2012).
This article highlights the characteristic evaporation and degradation behavior of VX applied to sand, soil, and concrete. These urban land surfaces would be expected to be easily targeted by terrorists or rogue organizations. The concentration profiles of VX vapors were obtained using a laboratory-sized wind tunnel, thermal desorber, and gas chromatography (GC) system. The wind tunnel can provide reliable estimates of vapor concentrations of compounds volatilizing from various surfaces under controlled weather conditions (Brevett et al., 2008). For degradation, VX that was left on contaminated matrices and its degradation products were assayed through periodical analysis by GC/mass spectrometry (MS). Evaporation and degradation of the agent, in particular, rates, are of importance for determining its persistency in the environment which is relevant for understanding the threat posed by its use as a function of the environmental surroundings.
Experimental
Materials
VX was taken from stocks of Agency for Defense Development with a purity of ≥95% as determined by GC/MS analysis and NMR (caution: VX is an extremely toxic chemical and should be handled only by trained personnel using applicable safety procedures).
Soil, clay loam with sand 21%, silt 48%, and clay 31% (Daejeon, South Korea), was sieved (∼2 mm) from twigs and stones. The soil sample contains various minerals: F (17.0 mg/kg), Zn (57.8 mg/kg), Ni (33.3 mg/kg), Cu (19.7 mg/kg), Pb (58.0 mg/kg), and As (8.2 mg/kg) with 12.73% of organic matter. It also contained 3.0 wt% water as determined by weight loss at 100°C. The properties of soil are the following: BET (Brunauer, Emmett, and Teller) surface area of 15.9 m2/g and pH of 4.8.
Sand (96.5% silicon dioxide, 0.25–0.4 mm) was provided by Korea Conformity Laboratories (South Korea) with the following properties: BET surface area of 0.38 m2/g and pH of 7.4. Sand contains SiO2 (96.5%), Al2O3 (1.66%), K2O (1.05%), and other minerals.
Fresh standard concrete was obtained from the Advanced Construction Material Testing Center: 42.6% cement, 49.2% coarse limestone aggregates, and pH of 12.0. Concrete contains various metal oxides, including SiO2 (>60%), Al2O3, CaO, K2O, etc. Concrete with various water–cement ratios (w/c), the weight of water to the weight of cement used in a concrete mix was explored: 0.50 for building, 0.42 for tower, and 0.31 for runway material, indicating that a lower ratio leads to higher strength. Soil, sand, and concrete materials were stored in closed containers at room temperature.
Laboratory-sized wind tunnel
A laboratory-sized wind tunnel has been specially designed to produce full-scale vertical velocity profiles on the basis of defined wind-induced boundary layers and operate with live chemical agents in a chemical fume hood (Weber et al., 2006). Figure 1 contains schematic of the wind tunnel denoting its major components: a transition cone, turning vane section, fetch, test section, mixing section, static mixer, vapor sampling section, and support frame. The tunnel has an overall width of 88 cm, overall height of 82 cm, and an overall depth of 32 cm. A Miller–Nelson Environmental Control Unit (ECU) provides the tunnel air flow at a prescribed temperature and relative humidity (RH). The turning vane section contains radius vanes that direct the air flow through a 90° bend into the entrance to the fetch. The floor of the fetch entrance contains turbulence generators that alter the air flow to create the desired velocity profiles in the test section. The test section ceiling contains a total of seven instrument ports, including an array of five ports for the hot wire anemometer probe for the velocity characterization surveys. The test section temperature is monitored through the port located most downstream from the center port position. A monitor type borescope (AU559 M, Taiwan) is placed through the port located at a central position from the port position to photograph the fading of the VX drop from the sample in the wind tunnel. A 4.85 cm flat side window is located on the side of the test section. The height of the air above the sample is about 5 cm. Before a test, the tunnel should be preoperated at the desirable test conditions sufficiently long enough to achieve constant temperature and air flow throughout.
General scheme of wind tunnel.
A drop of VX (6 mg, neat) was deposited on the surface of glass, sand, soil, and concrete (glass a 38-mm diameter circle, sand and soil [6 g] in a Teflon cup, concrete coupon a 35-mm diameter and a 15-mm thickness). While sand and concrete were used as received, soil was oven dried at 70°C for 1 day and the glass slides were washed in a laboratory detergent, rinsed extensively with deionized water and isopropyl alcohol, and dried with a dry air before experiments. The sample was inserted into the tunnel and placed on the floor of the test section where the temperature within the tunnel was 25°C and the airflow was 165 standard liters per minute (SLPM), corresponding to the measured velocity value at a 2-cm height of 1.7 m/s with 10–20% of RH, which was arbitrarily chosen. It should be noted that the drops to be tested in the tunnel used are very small of the order of 9 mL or smaller. Also, the mass loss from a single drop of neat VX was measured as a function time as a first step before considering the more complicate situation of the interaction of multiple drops. The vapors of the drop of neat VX from the sample were carried away by the air stream with flow of 100–200 mL/min and automatically collected by sorbent tubes (Porapak Q; CAMSCO) at the vapor sampling inlet.
Analysis of VX vapors: thermal desorption and GC
For the analysis of VX vapors, a silver fluoride pad (CAMSCO) was inserted onto the end of the vapor sampling inlet to convert any VX in the stream to its G-analog, ethyl methylphosphonofluoridate (EMPF), which is more volatile and, therefore, easier to analyze by thermal desorption with GC (Brevett et al., 2009). The EMPF vapor, which was timely collected in sorbent tubes, was then desorbed from tubes using a Markes UNITY/ULTRA thermal desorber with a flow of N2 for 10 min at 250°C. A split ratio of 20:1 was used for injection into the GC analytical system and the transfer line to the GC was heated to 120°C. The desorbed vapor was quantitatively analyzed by a GC equipped with an HP5 capillary column (30 m length, 0.5 mm i.d.) and a flame photometric detector operated in the phosphorus mode. The GC oven parameters were the following: 60°C for 1.5 min then a ramp to 250°C at a rate of 50°C/min. N2 was used as the carrier gas at a flow rate of 1.2 mL/min at a constant pressure of 10.3 psi.
The amount of EMPF vapor was quantified on the basis upon a linear external calibration plot with standards (26, 78, 236, 592 ng/μL). Each sample (1 μL), which was converted to EMPF, was transferred to the sorbent tube and analyzed in the same condition. A blank sample was used as a control run. Figure 2a shows a chromatogram of EMPF vapor, which was eluted at 1.8 min. Calibration curve was constructed with the integrated peak areas on the X axis (Fig. 2b). The sample volume and tunnel airflow were known; therefore, the VX vapor concentration (mg/m3) and the volatilization rate (μg/min) were calculated accordingly.

Degradation
A drop of neat VX (3.0 mg) was introduced to the surface of the sand, soil, and crushed concrete (2.5 g per vial) placed in a series of screw-top vials. After deposition, the drop spiked over the surface spread to several times their initial area, and the drop spiked became invisible slowly. After spiking, the samples were sealed until extraction. All VX depositions were carried out in a chemical fume hood.
Extraction of VX from samples were carried out by adding 5 mL of ethyl acetate followed by vortexing after various aging periods up to 6 weeks. The method of ethyl acetate extraction was modified from the previously reported work (Brevett et al., 2009). Ethyl acetate was used at sample–solvent ratio of 1:1 (w/v). The extraction efficiency was evaluated. The extract was filtered, placed into a GC vial, and analyzed by GC/MS. Spectra were obtained on a GC/MS (Agilent 7890 GC coupled to an Agilent 5973 MSD in electron impact mode). The GC oven was programmed from 45°C for 2 min to 280°C at 10°C/min. A 1 μL aliquot of sample was injected with a split ratio of 100:1. The mass range was scanned from 35 to 300 amu in 5.19 s. Spectral assignments were obtained by comparison to reference spectra in an existing in-house library and on the basis of characteristic fragmentation patterns. Compounds of interest detected were VX, DESH, and (DES)2. The amount of VX was quantified based upon a standard calibration curve. The extract was also derivatized with bis(trimethylsilyl)trifluoroacetamide (Supelco) by heating at 70°C for 1 h as described in the literature (Yokota et al., 1975). Compounds of interest detected were trimethylsilyl (TMS)-derivatized ethyl methylphosphonic acid (EMPA-TMS), ethyl methylphosphonothioic acid (EMPT-TMS) and methylphosphonic acid (MPA-bis-TMS). The amount of VX was quantified based upon a standard calibration curve; the amounts of EMPA, EMPT, MPA, DESH, and (DES)2 were estimated based upon an external standard. The limit of detection of VX was determined by considering a signal to noise ratio of 3 with reference to the background noise obtained from blank sample. Mass balance for the extraction of VX and its products averaged 60%, indicating that some VX products may be incorporated into the matrix itself (Wagner and Fry, 2009).
Results and Discussion
Evaporation of VX deposited on matrices
When a drop of chemical agent is deposited to the surface, it is lost primarily by volatilization or evaporation, which is considered as the dominant fate for all of the agents in the environment. However, the volatility of VX is relatively low (vapor pressure 0.0007 mm Hg), and remains at significant concentrations for varying time periods, which can depend on concentration, temperature, wind speed, surface area, and matrix type, etc. (Johnsen et al., 1988; Wagner et al., 2004). In this study, the evaporation of surface-deposited VX was characterized under varying matrices: sand, soil, and concrete.
As shown in Fig. 3, upon application of the drop of neat VX to the surface of matrices, it soaked immediately into the matrix and faded visibly over a long period of time, indicating a loss of agent at the surface. The 6 μL of VX drop initially occupied ∼6 mm on sand, 4 mm on soil, 14 mm on concrete (w/c = 0.50), 17 mm on concrete (w/c = 0.42), and 20 mm on concrete (w/c = 0.31) in diameter. The initial size of VX drop on concrete was larger, which also increased from higher w/c to lower one. Interestingly, the clump of VX and sand formed upon VX deposition remained throughout the evaporation process, which agrees well with the previous study (Brevett et al., 2009). Overall, the contact area of VX drop when situated at the surfaces increased slightly with time and the drop bulge slowly disappeared into the material.

Photographs of a drop of VX [O-ethyl S-2-(N,N-diisopropylamino)ethyl methylphosphonothioate] (6 μL) in
Data on the time course of VX evaporation on sand, soil, and concrete samples at different temperatures are presented in Fig. 4. The evaporation of the VX was measured until no further decrease in the concentration of vapor was detected, at which time the experiment was terminated. Loss of VX from a glass surface was used as standard in these experiments for reference. As shown in Fig. 4a and c, vapor concentration of VX measured from sand, soil, and concrete was much less than from the surface of glass. However, the evaporation times of VX were relatively longer for sand, soil, and concrete than for glass, causing a very long-term slow release of VX. This may be attributed to the efficient sorption of VX into the layer of the sand, soil, and concrete. The average percent of released VX vapors amounted to concrete 16.5%, sand 11.2%, and soil 6.5% of the applied mass at 25°C, which are relatively low in comparison with glass 40.2%. We attempted to verify the mass balance of the recovered VX mass through extraction. Through this method, about 50–60% of VX was additionally recovered. It may be attributed to VX penetrating and strongly adsorbing the irregular porous matrices and/or various components (Groenewold et al., 2002; Wagner and Fry, 2009; Columbus et al., 2012).
Concentration profiles of VX vapor:
In fact, the evaporation of a liquid drop applied to an environmental matrix is mostly governed by the physically balanced processes, such as absorption and desorption, between liquid and the surface to which it is applied. Such process or rates are mediated by the diffusion rate of the liquid through the surrounding air environment (Kingery and Allen, 1993; Willis et al., 2012), indicating that rates of evaporation may vary depending on the matrices and temperatures. The linear slope of the agent mass loss in Fig. 4b and d represent a constant evaporation rate for the agent, providing an operationally meaningful term to assess the fate of VX. Therefore, the initially steep region of the curve was used to determine the evaporation rates of VX from the matrices: 0.12 μg/min in sand, 0.088 μg/min in soil, and 0.16 μg/min in concrete (w/c = 0.50), which are ∼5–10 times slower than on the glass surface (0.90 μg/min). This may be attributed to the fact that sand, soil, and concrete are porous, where many amounts of VX sorbed to matrices. The drop of VX (neat) that was deposited on concrete presented its exposed area approximately three times larger than on sand or soil. Accordingly, the evaporation of VX on concrete more actively occurred in an initially short period of time than on sand and soil. The results also showed that the rates at 35°C remarkably increased: 0.44 μg/min in sand, 0.12 μg/min in soil, and 0.67 μg/min in concrete (w/c = 0.50), indicating the temperature is a critical parameter in the agent's evaporation in the environmental matrices. It is also noted that the evaporating testing was performed for a single drop of 6 mg, corresponding to ∼6.24 g/m2 concentration. If a similar concentration is made up of three or six drops, the evaporation rate would be expected to be faster. It is because the amount of agent deposited over a given surface the surface region is more heavily contaminated by larger drops. Conversely, the smaller drops afford lighter surface contamination and, thus, evaporate relatively faster (Jung et al., 2017).
Soil used in this study is rather acidic (pH = 4.8), which may account for a rather low volatilization of VX. Under acidic conditions, the amino groups in VX are favored to be protonated, which strongly sorb to soil (Verweij and Boter, 1976; Kingery and Allen, 1993; Bandyopadhyay et al., 2006). Interestingly, Wagner et al. (2001) described the formation of protonated VX species in concrete that is VX · H2CO3, which is stable and thus may contribute to VX persistence. We suggest that VX is more protonated in soil and concrete. Overall, VX's more persistence or the extremely low evaporation rate in soil would be accounted for based on the surface roughness and chemistry as described.
We also examined the evaporation rates of concrete with different w/c: 0.50, 0.42, and 0.31, indicating that a lower ratio leads to higher strength. The value of w/c is an important characteristic for urban complex. Concrete (w/c = 0.50) is used as materials in constructing general building, such as houses and apartments. Concrete (w/c = 0.42) is used in high-rise buildings, including skyscrapers and towers. Concrete (w/c = 0.30) is used in the construction of large infrastructures, such as airport runways. Profiles shown in Fig. 4e and f show that the VX vapor is large in quantity with decreasing w/c. The results obviously show that there was significant increase in the rates depending on w/c: 0.16 μg/min in concrete (w/c = 0.50), 0.48 μg/min in concrete (w/c = 0.42), and 0.76 μg/min in concrete (w/c = 0.31) at 25°C. Indeed, the VX desorption rate was approximately five times faster in concrete (w/c = 0.31) than in concrete (w/c = 0.50). These data may be rationalized based on the surface area of the drop upon deposition. A drop with a larger surface will evaporate faster as there are more surface molecules per unit of volume that are potentially able to escape. Therefore, we attempted to simply compare the spreading factor, which is the ratio between the diameter of the wetted area in concrete and the diameter of the drop. Accordingly, the area wetted on the image shown in Fig. 3c–e is assumed to be a circle and the diameter of the 6 μL of VX drop is assumed as 2.25 mm by calculation. The results show that the neat VX drop on concrete approximately corresponds to spreading factors of 6.2 for concrete (w/c = 0.50), 7.5 for concrete (w/c = 0.42), and 8.9 for concrete (w/c = 0.31), respectively. These data suggest that spreading or larger surface area of the neat VX drop on concrete may have an important effect on the VX drops vaporizing from surfaces.
It should be noted that the amount of vaporized VX from sand, soil, and concrete is <60%, which is a warning for those that think it is reasonable to rely on natural decontamination of VX through evaporation.
Degradation rates and products of VX from matrices
VX may remain on the ground for several weeks because of its greater stability with respect to water and its much lower volatility (Trapp, 1985). Therefore, on naturally occurring or industrial surface, VX remains dangerous because dermal contact can result in lethal effects. The estimated half-life for the spontaneous hydrolysis of VX in water solution is known to be ∼5 days (Grenshaw et al., 2001). However, surface degradation rates can be substantially different from solution degradation rates (Kingery and Allen, 1995). Relative rates of VX degradation occurring on surface, therefore, are of particular interest to the evaluation of environmental fate. In this experiment, the rates and products of VX degradation in sand, soil, and concrete were studied under laboratory conditions.
Figure 5 depicts the GC/MS results from the VX agent's degradation process after being absorbed into sand, soil, and concrete (w/c = 0.50) samples. The peak for VX was observed at Rt = 18.5 min in the GC spectrum and later, new peaks appeared, corresponding to known degradation products, namely, DESH at Rt = 10.2 min and (DES)2 at Rt = 22.4 min, indicating that VX degraded through hydrolysis. Extraction and derivatization with bis(trimethylsilyl)trifluoroacetamide (BSTFA) followed by GC/MS also confirmed the presence of EMPA, a primary degradation product of VX hydrolysis (Kingery and Allen, 1995; Brevett et al., 2009). EMPT and MPA were also observed (Fig. 6). It must be noted that no evidence was observed for the formation of the toxic S-2-diisopropylamioethyl methylphosphonothioic acid. The mass balance of VX and these products averaged 60% because some VX products, including EMPA, PMPA, and MPA can be strongly bound into the matrix itself (Wagner and Fry, 2009).
GC spectra of VX applied to
In fact, VX degraded in a matter of days in these matrices by decreasing the amount of VX with time. Particularly, on soil particles, VX was degrading at a rate that was slower than that observed on sand and concrete. The time course of VX disappearance from the matrices was plotted to calculate the rates of degradation, which is shown in Fig. 7. These data points reasonably fit a monoexponential decay curve, suggesting that the slow decomposition occurred after absorbing or binding of VX to the matrix components. The rates of disappearance of VX, accompanied by degradation products formation, could be fitted to a pseudo first-order kinetic process with slow reactions with half-lives of ∼6 days in sand, 8 days in soil, and 3 days in concrete (w/c = 0.50). The half-life of VX in concrete was approximately two times faster than that of VX in sand and soil. This may be attributed to the alkaline nature of the concrete used in the study (pH = 12.0). A substantial population of basic surface sites of concrete is considered to increase the degradation of VX through hydrolysis (MacNaughton and Brewer, 1994; Groenewold et al., 2002). It should be also noted that the loss of VX due to volatilization in the closed container is negligible on the basis of the volatility of ∼10 μg/L at room temperature (Waysbort et al., 2004).
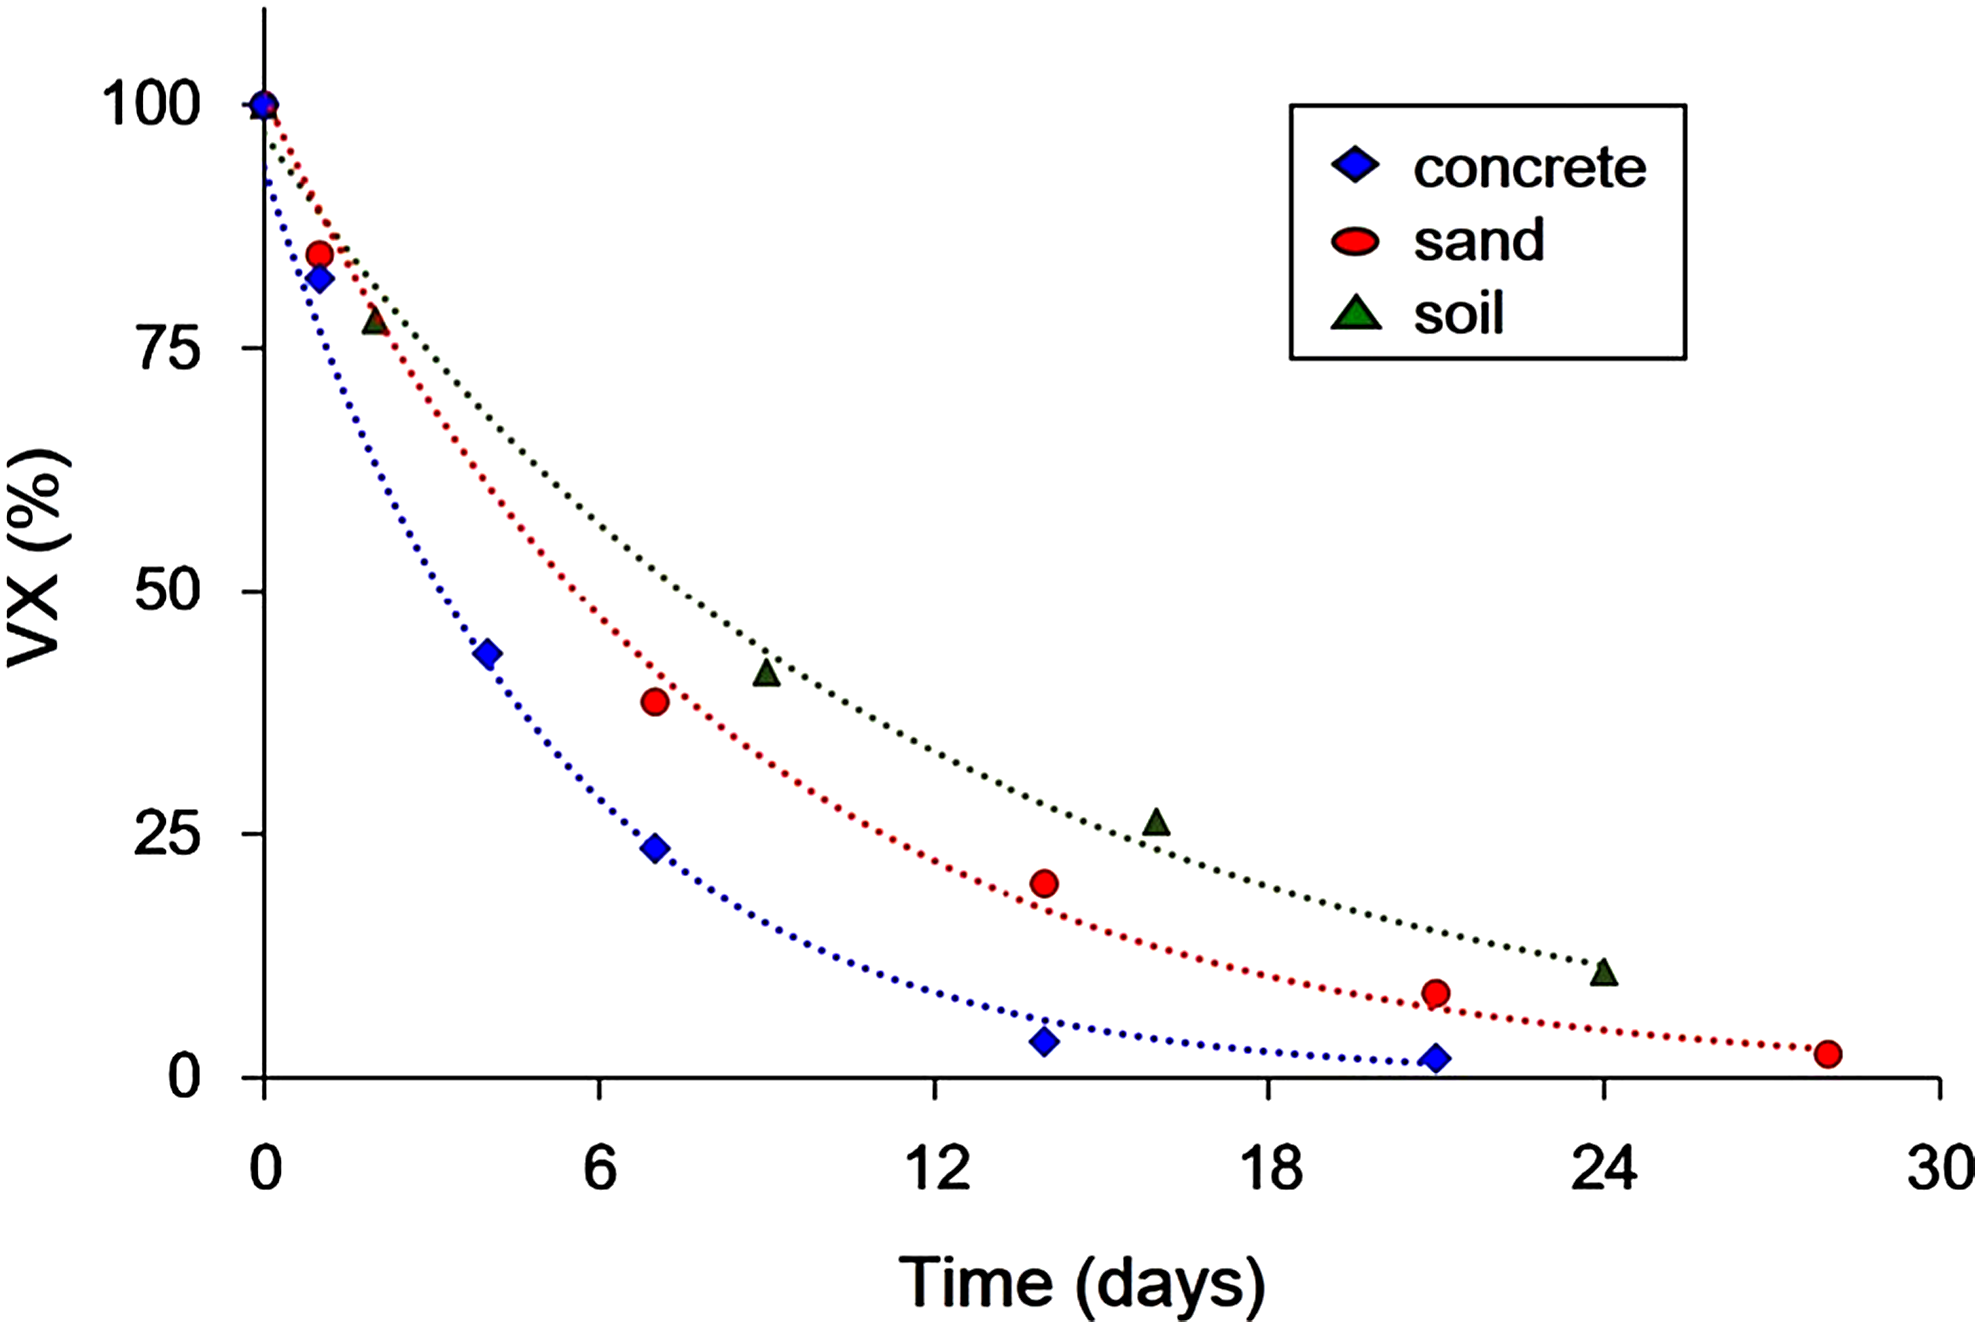
Disappearance of VX with increasing time. Three milligrams of VX was applied to each sand, soil, and concrete (w/c = 0.50) sample. Data points were fitted to an exponential decay curve.
Noticeably, the results suggest that VX seems to be more likely persistent in soil than in sand or concrete. In fact, surface roughness and chemistry of sand, soil, and concrete is truly different, which plays a vital role in the substance sorbing to matrix surface and vaporizing into air (Flytzani-Stephanopoulos and Schmidt, 1979; Bordo and Rubahn, 2012; Borisova et al., 2016). In this context, we first attempted to measure the surface roughness because a lower evaporation rate is expected from an irregular or rough surface than from a uniformly smooth one (Flytzani-Stephanopoulos and Schmidt, 1979). The values of Ra (arithmetic average roughness) of sand and soil were obtained as 0.76 and 5.8 μm, each on a measuring area of 800 × 800 μm measured (Non-contact Confocal Optical Profiler, m-Surf; Nanofocus AG). Ra of concrete was 1.1 μm (w/c = 0.50), 0.18 μm (w/c = 0.42), and 0.19 μm (w/c = 0.31), respectively (Surface Profiler, Dektak-8; VEECO). The relatively high roughness value of soil surfaces, which is complexly caused by soil texture, aggregate size, rock fragments, etc., would partly affect the persistence of VX in soil.
Additionally, soil contains some organic matters such as hydrocarbon residue (the soil sample used contains 12.73% organic matters), which can cause hydrophobic soil. On the other hand, sand and concrete used are composed of SiO2 or silica (>95% in sand and >60% in concrete), which greatly consists of the hydroxyl functional groups in surfaces (Feng et al., 1996). Therefore, silica surfaces, like those of other oxides, are normally hydrophilic. Therefore, a relatively hydrophobic VX (about 100-fold more partitioning into octanol over water) may favorably persist in soil than in any other matrices.
Conclusions
The rates of VX evaporation and degradation were slower in soil than in sand or concrete under the same condition. In particular, the half-life of VX degradation was lengthened in soil by comparison with degradation occurring in concrete or sand. It may be attributed to the roughness and acidity of the soil surface. The slower rate of evaporation and degradation of VX in soil indicates that VX is likely to persist in the soil environment for longer periods than sand or concrete. In addition, it was found that the VX evaporation rates were significantly enhanced at elevated temperature and from concrete with lower w/c. We hope parameters quantified and evaluated in this study will be used to establish database for use in risk assessment of exposure of the general population to highly lethal VX. Moreover, we wish that an understanding of the chemical factors and kinetics controlling VX fate could lead to improved treatment technologies for chemical warfare agents.
Footnotes
Acknowledgments
The authors are indebted to the Chemical Analysis Test and Research Laboratory for supplying VX. They are greatly thankful to Jaehee Choi and Sung Hyun Yang for helping with some experiments. They also thank reviewers for their insightful comments on the article.
Author Disclosure Statement
No competing financial interests exist.