
Abstract
Abstract
Biodrying has been attracting much attention due to its capability of drying sewage sludge without using external energy. Although various aspects of biodrying have been studied, emission gas released from biodrying has rarely been characterized or treated. In this study, water vapors in emission gas were condensed by chilling and gaseous substances were further trapped in successive acid/alkali solutions. Mass balance analyses showed that water, C, and N removed from sludge by biodrying were completely recovered in the emission gas condensate (EGC), which contained 1,485.2 mg/L of chemical oxygen demand (COD), 16,500 mg/L of total nitrogen (TN, mostly ammonia nitrogen, NH3-N), and 662.7 mg/L of total organic carbon (TOC). 22 volatile organic compounds (VOCs) were detected in EGC. Acid-trap solution contained a high concentration of NH3-N (16,472.0 mg/L) and a moderate concentration of TOC (281.3 mg/L). Alkali-trap solution contained 22,676.7 mg/L of total inorganic carbon (TIC), but concentrations of other pollutants were low. Chlorination was demonstrated to be the best treatment method for EGC due to high removal ratios of TN, NH3-N, COD, and TOC at an optimized Cl:N mass ratio of 12.8:1. Since TIC was predominantly dissolved CO2, only the mixture of EGC and acid-trap solution was chlorinated at this ratio, and residual concentrations of NH3-N, TN, and TOC were 1.3, 163.3, and 62.0 mg/L with removal ratios of almost 100%, 99.0%, and 85.8%, respectively. These results indicated that chlorination was effective for removing pollutants contained in EGC of biodrying.
Introduction
S
When the sludge is thermally heated for drying, many types of volatile compounds (VCs) can be emitted as atmospheric pollutants, which are difficult to control and harmful to human beings (He et al., 2010). Several studies have reported that various pollutants, including inorganic compounds (mainly NH3 and H2S), volatile organic compounds (VOCs), and greenhouse gases (GHGs, CH4, CO2, etc.), were emitted during thermal drying of sewage sludge (Deng et al., 2009; Lu et al., 2013; Weng et al., 2015).
In the case of biodrying, water removal occurs along with both biological degradation of BVS and heating of the sludge matrix (40–75°C) (Zhao et al., 2010; Yang et al., 2014). As a result, composition of VCs emitted from biodrying is more complicated compared to thermal drying (Shao et al., 2012). These VCs may cause secondary pollution that should not be ignored. Various VCs, including malodorous sulfur compounds, aromatics, ketones, terpenes, and chlorinated compounds, were released from aerobic and combined hydrolytic–aerobic processes of municipal solid waste (MSW) biodrying (He et al., 2010). Thus, the exhaust gas emitted from biodrying should be properly treated to prevent VCs contained in the sludge and/or generated in the course of microbial metabolism during biodrying from escaping the system along with the airflow (Shao et al., 2012).
Several studies characterized emission gas condensate (EGC) and leachate generated from composting, a waste management process similar to biodrying (Krogmann and Woyczechowski, 2000). Researchers also found that the EGC from MSW biodrying was high-strength wastewater containing 3,500 mg/L of total organic carbon (TOC) and 1,665 mg/L of ammonia nitrogen (NH3-N) (Shao et al., 2012). In particular, removal of NH3-N is important because NH3-N causes environmental problems of eutrophication, decrease of dissolved oxygen, and toxic effects on aquatic ecosystems (Khuntia et al., 2013; Cheng et al., 2016). Meanwhile, even low ammonia gas in the atmosphere can irritate the human respiratory system, skin, and eyes, causing pulmonary edema and accumulation of fluid in the lungs (Timmer et al., 2005). Ammonia also contributes to form particulate nitrate, which is one of the main sources of fine particulate air pollution (Wang et al., 2009).
For removing NH3-N from wastewater, many technologies are available, including air stripping (Campos et al., 2013), advanced oxidation (Khuntia et al., 2013), breakpoint chlorination (Huang et al., 2009), membrane filtration (Ahn et al., 2011), chemical precipitation (Kwon et al., 2017), and biological treatment (Carrera et al., 2003).
Air stripping has been well known as a major physical method for removing NH3-N in wastewater. However, this method is inadequate for treating EGC because air stripping moves dissolved NH3-N to atmosphere (Kurniawan et al., 2006). Membrane filtration is also one of the effective methods for removing NH3-N. However, this method consumes a large amount of energy, and facility maintenance could be problematic (Kurniawan et al., 2006; Huang et al., 2009). Biological treatment has been used to treat low concentrations of NH3-N because the bacteria used in biological treatment are very sensitive to high concentrations of NH3-N and thus nitrification and denitrification are inhibited (Carrera et al., 2003; Kurniawan et al., 2006). However, these studies were conducted in open windrows or reactors, so that it was difficult to completely collect gas for analyses.
In short, the collection, characterization, and treatment of gaseous pollutants from sewage sludge biodrying have long been remained unclear (Shao et al., 2012).
In this study, an effective system, including a condensation unit and acid/alkali traps, was constructed for recovering the pollutants contained in the emission gas from sewage sludge biodrying. The EGC and trap solutions were characterized, and VOCs captured in the EGC were analyzed by headspace gas chromatography–mass spectrometry (GC-MS). The mass balances of water, carbon (C), and nitrogen (N) were established to confirm that mass loss of biodried sludge was completely recovered in emission gas. Then, EGC was treated by using various methods, among which chlorination was the most effective for EGC treatment. Finally, the Cl:N mass ratio for chlorination was optimized and applied to treat the combined wastewater of EGC and acid trap solution.
Materials and Methods
Biodrying of sewage sludge and collection of EGC
The sewage sludge with MC around 84–85 wt% was obtained from a WWTP in Yongin, Korea. The WWTP discharged sewage sludge containing primary sludge (35–45%), excess activated sludge (55–65%), and a small amount of anaerobically digested piggery manure (5–10%). The air-dried sludge (MC around 14 wt%) was prepared by spreading and exposing the sewage sludge in the ambient atmosphere for 2 weeks at room temperature. Then, 7.50 kg of sewage sludge was mixed with 2.50 kg of air-dried sludge as a bulking agent, which resulted in MC of around 67 wt%. This mixed sludge was biodried for 7 days in a cylindrical reactor (diameter 300 mm, height 470 mm) made of polymethyl methacrylate (PMMA) with a perforated plate (1 mm pore diameter) on the bottom (Yang et al., 2013). The temperature of the sludge was detected with a digital thermocouple installed in the middle of the reactor.
During biodrying, dehumidified room air was supplied into the reactor at the bottom with a flow rate of 3 L/min by an air pump (LP-60A; Kosung Valve Co., Korea) (Hao et al., 2017). The emission gas released from the top of the reactor was condensed by using a condenser connected with a recirculating chiller (CCA-1111; Eyela, Japan) at 4°C. Then, the EGC was collected in a receiving flask (Fig. 1). The emission gas escaping the condenser passed through an acid trap containing 1.5 L of 2 M H2SO4 and then an alkali trap containing 1.5 L of 2 M NaOH for catching the residual pollutants. Finally, concentrations of O2, CO2, and NH3 contained in the emission gas were measured automatically every 25 min by using a gas analyzer (Multi-Master; Sensoronic Co., Korea).
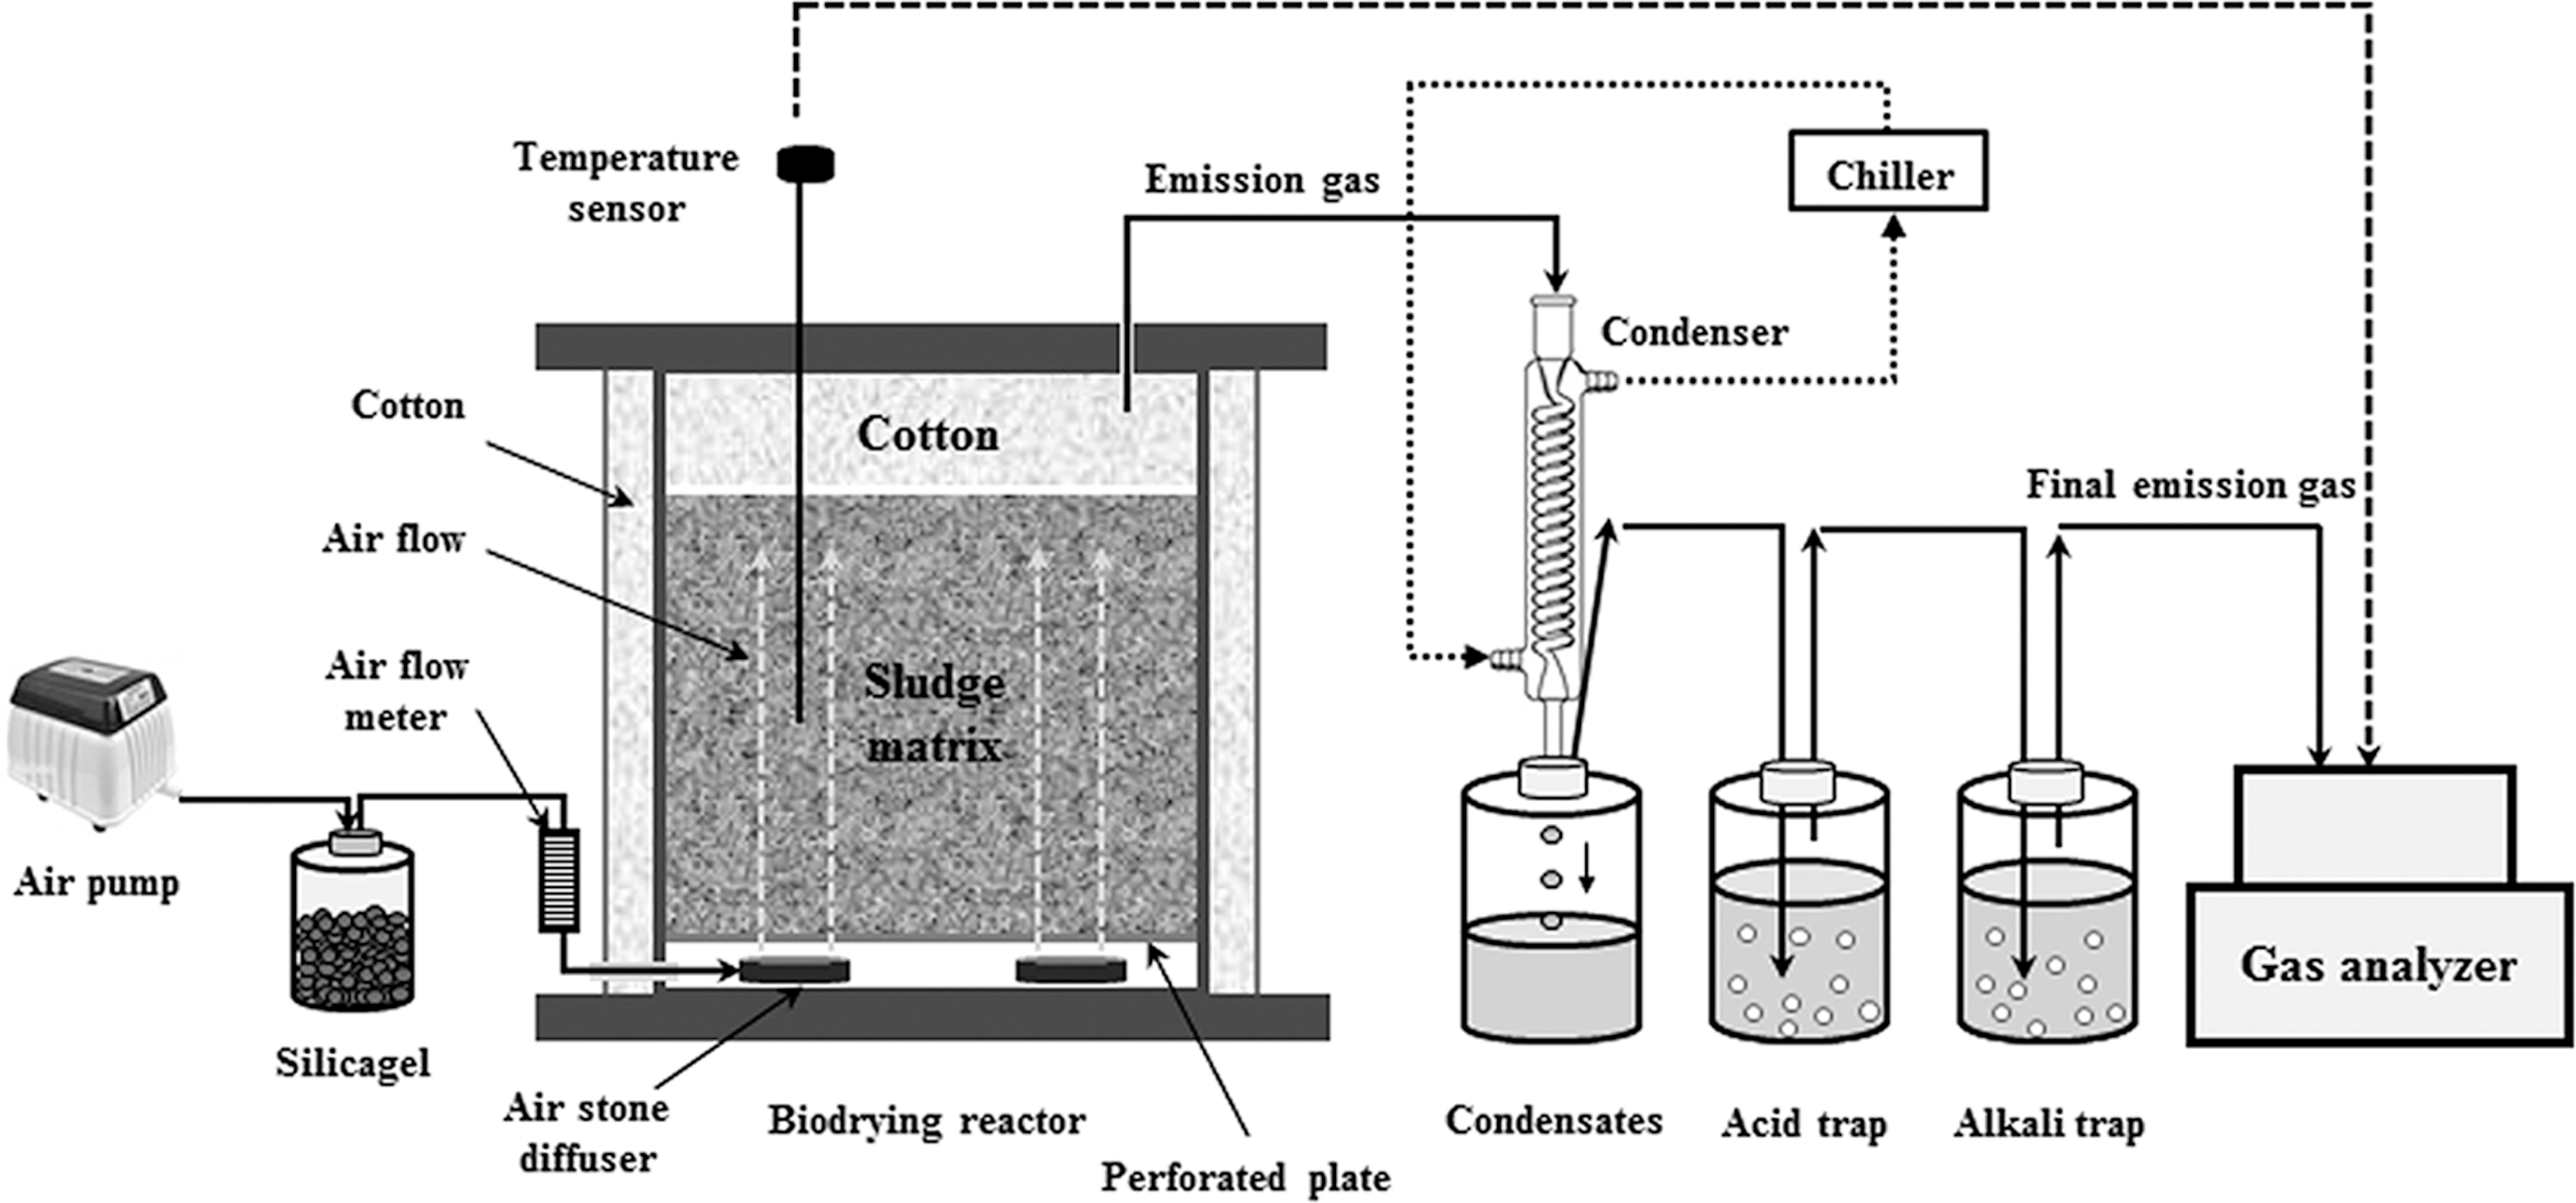
Schematic diagram of biodrying system used in this study.
GC-MS analysis
Headspace GC-MS analyses were carried out with a 60 m × 0.32 mm DB-624 capillary column (J&W Scientific, Folsom, CA) installed on a PerkinElmer Clarus 600 GC (Perkin Elmer, CT) equipped with a PerkinElmer Clarus 600T MS (Perkin Elmer) and a 30 m × 0.25 mm DB-5MS capillary column (J&W Scientific, Folsom, CA) on an Agilent 6890 GC (Agilent Technologies, CA) equipped with an Agilent 5973 mass selective detector (Agilent Technologies, CA). DB-624 column, a midpolarity column, was chosen for analyzing VOCs, and a low-polarity DB-5MS column was used for detecting semi-VOCs.
10 mL of EGC was filled in a vial that was connected to GC. VOCs of EGC were automatically released into the headspace of the vial and then analyzed by GC. Temperatures of needle and transfer line were 120°C and 180°C, respectively. Pressurization and injection continued for 1 and 0.08 min, respectively. The temperature of GC oven was initially held at 40°C for 2 min, increased to 220°C at the rate of 10°C/min, and then held at 220°C for 1 min. The injector temperature was 200°C, and carrier gas was helium.
Ozonation
Ozonation was demonstrated to be effective for the treatment of wastewater containing NH3-N and other pollutants. Removal of NH3-N by ozone in the presence of sodium bromide (NaBr) as a catalyst was previously described by the following reaction (Khuntia et al., 2013).
Advanced oxidation of EGC was carried out by adding ozone at the rate of 1.149 g/h to 300 mL of EGC by using an ozone generator (LAB-S; OzoneTech, Korea). The NaBr was added to the EGC as a catalyst at NH3:Br− molar ratio of 18:1 (Khuntia et al., 2013). Ozonation was conducted for 150 min, and treated EGC was analyzed for measuring residual concentrations of NH3-N, total nitrogen (TN), TOC, total inorganic carbon (TIC), and chemical oxygen demand (COD).
Struvite precipitation
Struvite precipitation experiments were carried out in 1 L beakers in batch mode. Monopotassium phosphate (KH2PO4) and magnesium sulfate heptahydrate (MgSO4·7H2O) were added as P and Mg sources.
After 300 mL of EGC was poured into the beaker, KH2PO4 and MgSO4·7H2O were added to the beaker to satisfy molar ratio of Mg:P:NH3-N to be 1:1:1 for struvite (MgNH4PO4·6H2O) formation (Kwon et al., 2017). During reaction for 90 min, the sample was mixed with a magnetic stirrer and the pH of the sample was monitored by a pH meter (Orion star A211; Thermo Fisher Scientific, Inc., MA). After the pH of the sample reached an equilibrium state (around pH 2), pH of the sample was adjusted to pH 8.5 with 10 M NaOH for the minimum solubility of struvite (Kwon et al., 2017). The suspension was centrifuged (SUPRA 30K; Hanil Science Industrial Co. Ltd., Korea) at 3,500 rpm for 15 min, and the supernatant was analyzed for measuring residual concentrations of NH3-N, TN, TOC, TIC, and COD.
During the struvite precipitation, NH3-N was removed by struvite formation as described by the following reaction (Kwon et al., 2017).
Chlorination
As an effective treatment method of wastewater, chlorination was able to oxidize various pollutants. In case of wastewater with high concentrations of NH3-N and TN, the following reactions are known to occur (Huang et al., 2009).
Chlorination of EGC was carried out in a 1 L beaker using 12% (w:v) sodium hypochlorite (NaOCl) as an oxidant. 100 mL of EGC was poured into the beaker, and initial pH of EGC was adjusted to pH 7 using 10 M H2SO4, which was known to be optimal for removing NH3-N (Huang et al., 2009). NaOCl was added at different doses to the beaker to yield different Cl:N mass ratios between 4 and 14. During the addition of NaOCl to the beaker, pH of EGC was maintained 6–8 by adding 10 M NaOH. The EGC was mixed by a magnetic stirrer (MS200; Misung Scientific. Co. Ltd., Korea) until pH of EGC was stable (around 60 min).
The chlorinated sample was collected and concentrations of total residual chlorine, free residual chlorine, NH3-N, TN, TOC, and TIC were analyzed. COD was not measured due to chloride interference that was added into EGC during chlorination (Kayaalp et al., 2010).
Analytical methods
The MC of sludge was measured by drying the sludge sample in a drying oven (SOF-W155; SciLab, Korea) at 105°C for 24 h (APHA, 2005), and the weight of dried sludge was regarded as total solids (TS) (Yang et al., 2014). The volatile solid (VS) content was obtained by measuring the remaining weight after heating the dried sludge at 550°C for 6 h in an electric muffle furnace (KMF-500; Kukje Engineering, Korea) (He et al., 2010). C, N, S, H, O contents of biodried sludge were measured by using an elemental analyzer (Flash EA1112; Thermo Fisher Scientific, Inc., MA).
The concentrations of NH3-N, NO2-N, NO3-N, TN, COD contained in the recovered solutions were measured by colorimetric analysis based on the salicylate method (Hach method 10031), diazotization method (Hach method 10019), chromotropic acid method (Hach method 10020), persulfate digestion method (Hach method 10072), and Environmental Protection Agency reactor digestion method (Hach method 8000), respectively. The concentrations of TOC and TIC were analyzed by using a TOC analyzer (TOC-V CPH; Shimadzu, Japan), which was able to analyze both organic and inorganic C. The pH was determined by a pH meter (Orion star A211; Thermo Fisher Scientific, Inc., MA). Concentrations of free residual chlorine and total residual chlorine were analyzed by colorimetric analysis based on N,N-diethyl-p-phenylenediamine (DPD) method (Hach method 8021 and 8167, respectively).
Results and Discussion
Sewage sludge biodrying
Initial MC and bulking agents are known to be critical parameters in biodrying processes. Yang et al. (2014) studied the effects of initial MC and bulking agent on the sludge biodrying and reported that air-dried sludge was the most effective bulking agent compared to sawdust, biodried sludge, and rubber, and initial MC of 50–70 wt% was optimal for sludge biodrying. Therefore, in this study, biodrying was conducted for the mixed sludge with initial MC of 67.50 wt%.
As shown in Fig. 2a, the temperature quickly increased during initial 2 days and the highest temperature was around 70°C. The rapid increase of sludge temperature indicated that metabolic heat was released from the microbial degradation of organics (Zhao et al., 2010). Temperature rise ceased at around 70°C because O2 demanded for aerobic decomposition was poorly satisfied over the 70°C and also easily BVS was almost exhausted (Yang et al., 2013). Afterward, the sludge temperature gradually decreased and reached near to room temperature at day 7.
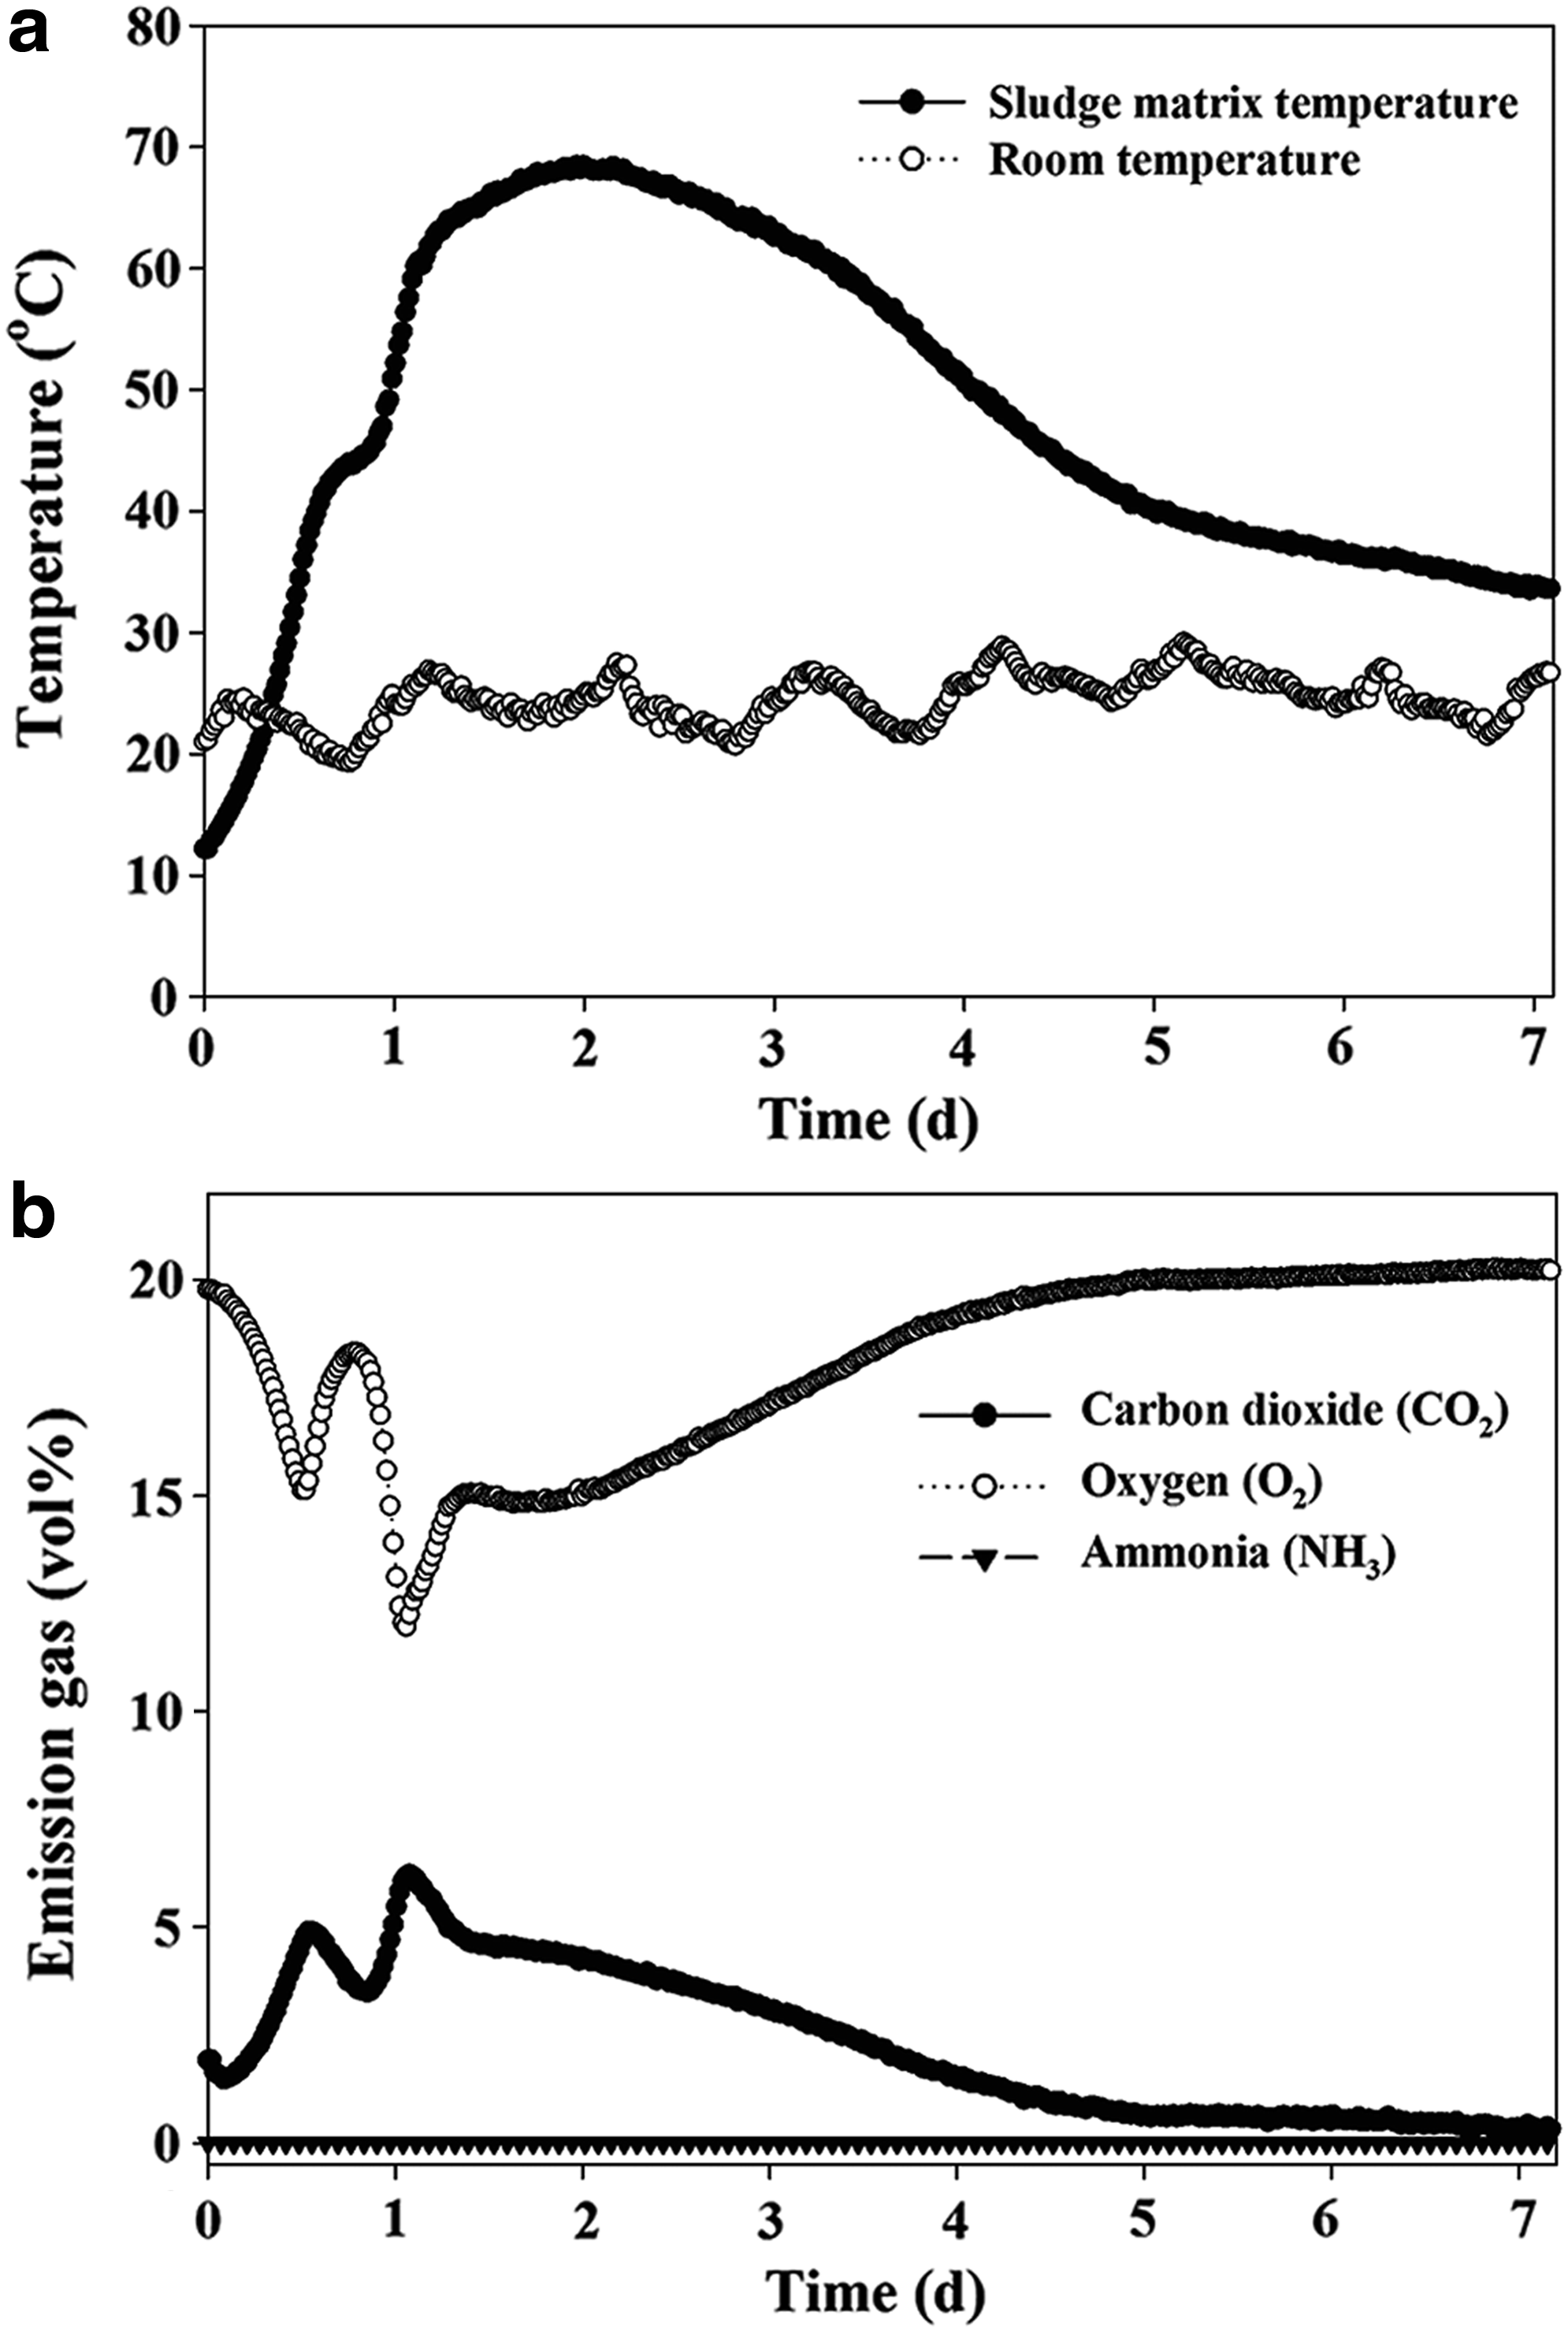
Temperature profile
During sludge biodrying, the microorganism metabolism produced not only metabolic heat but also CO2 from microbial respiration (Yang et al., 2013). As shown in Fig. 2b, although emission gas passed thorough condenser and acid/alkali traps, the concentration of CO2 in the final emission gas increased from 1.5 to 6.2 vol%, while O2 concentration decreased from 19.8 to 12.1 vol%. Then, the concentration of CO2 gradually decreased as sludge temperature decreased, whereas O2 concentration gradually increased to the atmospheric level. NH3 gas was not detected in the final emission gas because NH3 was almost completely recovered in the condensate and the acid trap.
The compositions of sludge before and after biodrying are shown in Table 1. The total weight of sludge decreased from 10.000 to 6.540 kg. Meanwhile, moisture was reduced from 6.744 to 3.751 kg so that MC of sludge decreased from 67.50 to 57.35 wt%. Similar results were also observed by a previous study on biodrying of sewage sludge with air-dried sludge as a bulking agent (Hao et al., 2017). Weight of headspace cotton, which was added to prevent heat loss and rewetting of sludge matrix in the reactor, increased from 0.735 to 1.070 kg because of absorption of condensed water. The TS and VS decreased from 3.247 to 2.790 and from 2.389 to 1.934 kg, respectively, indicating that the removed TS (0.457 kg) was almost the same as the consumed VS (0.455 kg).
Change = [(after − before)/before] × 100%.
Weight of elements on dry basis.
Percentiles of elements on TS.
TS, total solids.
The decrease of C was the highest (0.359 kg) among the measured elements, and 27.59% of C initially contained in sludge was removed during biodrying. N and hydrogen (H) were also removed as much as 36.13% (0.069 kg) and 25.52% (0.049), respectively, whereas oxygen (O) and sulfur (S) did not decrease significantly with removal ratios of 8.76% and 9.38%, respectively.
Characteristics of EGC, acid trap, and alkali trap
Compositions of EGC, acid trap, and alkali trap
The compositions of EGC, acid trap, and alkali trap are shown in Table 2. For EGC, the concentration of NH3-N was 16,400.0 mg/L and was almost the same as TN concentration (16,500.0 mg/L), whereas concentrations of NO2-N and NO3-N were negligible. EGC was alkaline (pH 8.97) because of the high concentration of NH3-N. These results indicated that the N contained in sludge was removed mainly as NH3 gas during biodrying. Many studies have reported that the high concentration of NH3 was emitted from thermal drying of sludge (Deng et al., 2009; Lu et al., 2013). The acid trap solution also contained high concentrations of TN (16,487.8 mg/L) and NH3-N (16,472.0 mg/L) and extremely low concentrations of NO2-N (0.012 mg/L) and NO3-N (0.444 mg/L), similar to the EGC. Concentrations of TN, NH3-N, NO2-N, and NO3-N in the alkali trap solution were only 1.3, 0.7, 0.031, and 0.733 mg/L, respectively (Table 2). Phosphate was not detected in EGC, acid trap, or alkali trap.
COD, chemical oxygen demand; EGC, emission gas condensate; TIC, total inorganic carbon; TN, total nitrogen; TOC, total organic carbon.
Concentrations of COD, TOC, and TIC in the EGC were 1,485.2, 662.7, and 10,711.8 mg/L, respectively. TOC in the EGC was thought to be VOCs emitted from sludge due to the high temperature during biodrying. However, most TIC in EGC was thought to be attributed to CO2, which was produced from microbial metabolism during biodrying. The concentrations of COD, TOC, and TIC in the acid trap were 377.4, 281.3, and 96.2 mg/L, respectively. The TIC concentration in the acid trap was much lower than that of the EGC because CO2 was not trapped in acid solution as expected (Peng et al., 2012). The COD, TOC, and TIC concentrations in the alkali trap were 111.3, 64.3, and 22,676.7 mg/L, respectively. The TIC concentration in the alkali trap was much higher than that of the acid trap, whereas COD and TOC concentrations were lower than those in the EGC and acid trap.
Mass balances on water, C, and N during biodrying are given in Table 3. During biodrying, 2.993 kg of water was removed, in which 2.592 kg was recovered as EGC and 0.335 kg was absorbed into headspace cotton. The C loss was 359 g, in which 1.72 g of TOC and 27.76 g of TIC were collected in EGC, and 0.10 g of TOC and 34.02 g of TIC were trapped in the alkali trap. Besides, TOC and TIC in the acid trap were only 0.42 and 0.14 g, respectively. Residual 294.84 g of C was thought to be released as CO2 in the final emission gas. When total CO2 was calculated from CO2 profile in Fig. 2b, C in the final emission gas was 303.67 g, which was reasonably close to the calculated value. Sixty-nine grams of N were removed from sludge during biodrying and most of them were recovered in EGC (42.77 g) and acid trap (24.73 g). From these results, it was obvious that the water, C, and N lost were nearly completely recovered in EGC and acid/alkali traps.
∼0: Volumes of acid and alkali solutions were negligibly changed.
303.67: C in the final exit gas obtained by manually integrating CO2 concentration with respect to time in Fig. 2.
ND, not determined.
Composition of VOCs released during biodrying of sewage sludge
DB-624 and DB-5MS columns were specifically chosen for the analysis of VOCs and semi-VOCs, respectively. The released VOCs in EGC were analyzed by headspace GC-MS by using these two columns. TOC concentration in the EGC was much higher than those in acid/alkali solutions (Table 2), and thus, it was thought that most VOCs released from sludge during biodrying were recovered in EGC. As shown in Fig. 3, 11 peaks from GC-MS with the DB-624 column and 14 peaks from DB-5MS column were identified by the National Institute of Standard Technology (NIST) Mass Spectra Library (www.nist.gov). Among those 25 substances, 2-butanol, isovaleraldehyde, and dimethyl disulfide were overlapped, and hence, 22 VOCs were identified (Table 4). However, many peaks remained unknown because they were not matched with any substances in the NIST library.

Gas chromatograms of headspace GC-MS analysis for VOCs in EGC with
The DM-624 column detected VOCs, of which molecular weights were mostly less than 100 Da. Among them, 2-propanol and 2-butanol were often detected from household or human wastes (feces and urine), and it was suspected that these compounds were discharged into sewage (Wilkins, 1994; Sato et al., 2001). Furthermore, Wilkins (1994) reported that 2-propanol, 2-butanol, acetone, and 2-butanone were produced in the course of microbial growth. Acetone and 2-butanone were often detected from MSW or sewage, and these ketone compounds are known to give off sweet or solvent smell (Gostelow et al., 2001; Louhelainen et al., 2001; He et al., 2010). Acetic acid and butanoic acid were also frequently detected from human feces and urine (Sato et al., 2001; Wilkins, 1994). 3-Amino-2-oxazolidinone has been well known as a metabolite of nitrofuran antibiotics, commonly used as an antibacterial veterinary drug (McCracken and Kennedy, 1997). It was also reported that 3-amino-2-oxazolidinone has been emerging as a micropollutant in the environment (McCracken and Kennedy, 1997; Manzetti and Ghisi, 2014).
It seems that a significant fraction of ingested antibiotics are released from human or animal via urine or feces, and are discharged into sewage. Isovaleraldehyde, which is a flavor component, has been found in low concentrations in many types of food and often detected in wastewater (Gostelow et al., 2001; Kim and Kim, 2014). Sulfur compounds have been well known to be malodorous and were often detected from household waste or sewage sludge (Wilkins, 1994; Gostelow et al., 2001; Harrison et al., 2006). Dimethyl disulfide was also detected from biodrying of MSW and is known to be a major component causing malodor in biodrying of MSW (He et al., 2010). 1-Propene-1-thiol has been detected from black tea flavor (Rawat et al., 2007).
As also shown in Table 4, GC-MS analysis with DB-5MS column detected fourteen VOCs, including 2-butanol, isovaleraldehyde, and dimethyl disulfide, which were also detected by DB-624, and molecular weights of detected substances were mostly larger than 100 Da. It was reported that isoamyl alcohol was produced by whey fermentation and often detected from alcoholic beverage (Dragone et al., 2009). It was also reported that this compound could be formed from olive oil in an enzymatic process (Kiritsakis, 1998). Because olive oil is widely used for cooking, it was suspected that waste cooking oil was discharged into sewage and was detected from sewage sludge.
Siloxane compounds, including decamethylcyclopentasiloxane, dodecamethylcyclopentasiloxane, tetradecamethylcyclopentasiloxane, and tetracosamethylcyclododecasiloxane, have often been detected from sewage sludge or domestic wastewater (Schweigkofler and Niessner, 1999; Thomaidi et al., 2016). Due to their physicochemical properties, some of them attach to suspended solids in sewage and thus maybe detected from sewage sludge. Recently, it was reported that siloxane compounds were classified as emerging organic contaminants because they may act as endocrine disruptors (Thomaidi et al., 2016). Silico-organic compounds were widely used for manufacturing household items (e.g., silicones, shampoos, skin creams, tooth pastes, and silicone oils), and thus, they are often detected in domestic wastewater worldwide (Schweigkofler and Niessner, 1999; Thomaidi et al., 2016).
Hexadecane and 1-nonadecene were often detected from sewage sludge or municipal wastewater (Schweigkofler and Niessner, 1999). Benzenes were commonly found in sewage sludge (Zhao et al., 2010). These compounds are persistent and bioaccumulative toxins and exert harmful effects on human, animal, soil, and vegetation (Harrison et al., 2006). Galaxolide is widely used as a cosmetic ingredient and often detected from sewage sludge (Carballa et al., 2004). Due to physicochemical properties of Galaxolide, it adsorbs and remains onto solid surfaces of sewage. Carballa et al. (2004) reported that Galaxolide could be removed by primary and biological treatment in sewage treatment plants.
The EGC contained high concentration of NH3-N and various VOCs, similar to the previous studies (Krogmann and Woyczechowski, 2000; He et al., 2010; Shao et al., 2012). Interestingly, N-bearing compounds were not detected by GC-MS analysis. Therefore, it was thought that most of N contained in the sludge seemed to be released into the emission gas in the form of NH3.
Treatment of EGC and acid trap solution
Comparison of methods treating EGC and acid trap solution
Concentrations of NH3-N and COD in EGC and acid trap were much higher (16,400.0 mg/L NH3-N, 1,485.2 mg/L COD in EGC and 16,472.0 mg/L NH3-N, 377.4 COD mg/L in the acid trap) than those in the alkali trap (0.7 mg/L NH3-N and 111.3 mg/L COD) (Table 2). Therefore, conditions for EGC treatment were optimized first, and then, the mixture of EGC and acid trap was treated at the optimized treatment parameter. Ozonation, struvite precipitation, and chlorination were chosen for treating EGC, because these processes are effective, simple, and inexpensive to operate (Huang et al., 2009). After ozonation, NH3-N, TN, TOC, and TIC concentrations were 14,866.7, 14,911.7, 605.3, and 8,890.2 mg/L, respectively, which indicated that pollutants were almost not removed by ozone, and thus, removal ratios remained below 17% for all pollutants.
According to Equation (1), active bromine (HOBr) as an intermediate was produced by reaction between ozone (O3) and bromide ion (Br−) (Khuntia et al., 2013). It reacted with NH3 and converted into nitrogen gas (N2). In addition, decrease of TOC and TIC was thought to be caused by VOC and CO2 removal by stripping action of ozonation.
After struvite precipitation, NH3-N, TN, TOC, and TIC concentrations of EGC were 2,425.0, 2,550.0, 414.8, and 3,115.3 mg/L, respectively. Most of NH3-N, TN, and TIC were removed, whereas TOC was partially removed.
As shown in Equation (2), struvite formation decreased pH of the solution, and thereby, HCO3− existing in the solution was thought to be converted into CO2 gas because the solubility of CO2 decreases at low pHs (Cohen and Kirchmann, 2004), which resulted in the decrease of TIC. Moreover, this chemical reaction induced the temperature of EGC to increase to 42–47°C, and, in this condition, a part of VOCs might be vaporized from EGC. Removal ratios of NH3-N, TN, TOC, and TIC were 85.2%, 84.6%, 37.4%, and 70.9%, respectively. Although it was more effective than ozonation, it was still insufficient for treating EGC because residual NH3-N and COD concentrations were still as high as 2,425.0 and 870.0 mg/L, respectively.
Chlorination was carried out at pH 7 and Cl:N mass ratio of 10:1 following Bishop and Pressley (1973). As seen in Table 5, most of NH3-N, TN, TOC, and TIC were effectively removed by chlorination, and removal ratios reached 93.6%, 92.9%, 82.5%, and 78.8%, respectively. Compared to other methods, removal ratios achieved by chlorination were much higher for all pollutants.
NA, not analyzed due to chloride interference against COD measurement.
For the reaction of Equation (5), it has been known that the pH should be controlled to maintain between pH 6 and pH 8 at all times (Bishop and Pressley, 1973). Therefore, the pH of EGC was maintained in this range using 10 M NaOH. Overall reaction for chlorination is expressed as Equation (6). Organic C of the EGC was also oxidized and might be emitted as CO2 (Shang et al., 2000). Removal of captured volatiles in EGC was indicated by decreased TOC. While NaOCl was added, the temperature of EGC increased to 45–50°C, which might volatilize VOCs from the EGC, and thus TOC decreased. TIC also decreased after chlorination because the solubility of CO2 decreased at high temperature and neutral pH (Cohen and Kirchmann, 2004).
Comprising these results, chlorination was chosen for treating the EGC. However, after chlorination, residual NH3-N concentration was still as high as 1,056.7 mg/L. It meant that chlorination with Cl:N mass ratio of 10:1 did not reach a breakpoint, which is defined as a point where total residual chlorine is minimized, and the NH3-N is completely removed (Bishop and Pressley, 1973). Therefore, chlorination was carried out with Cl:N mass ratios in the range of 4–14 for further optimization.
Optimization of Cl:N mass ratio for chlorination
The Cl:N mass ratio is a critical parameter in chlorination, and its stoichiometric ratio for NH3-N removal has been well known as 7.6:1 (Huang et al., 2009). However, wastewater containing various substances other than NH3-N commonly cannot reach the breakpoint at this stoichiometric ratio because a part of chlorine is used for oxidizing carbonaceous substances in wastewater (Shang et al., 2000). Bishop and Pressley (1973) reported that the Cl:N mass ratio of wastewater needed normally to be about 10:1 to reach the breakpoint. Therefore, chlorination was carried out with Cl:N mass ratios in the range of 4–14, and concentrations of total and free residual chlorine were measured at these different Cl:N mass ratios.
As shown in Fig. 4, results could be divided into three zones. In A zone (Cl:N mass ratios of 4–8), as the Cl:N mass ratio increased, total residual chlorine also increased because monochloramine was formed by reaction of HOCl and NH4+ as indicated by Equation (4) (Capodaglio et al., 2015). On the contrary, in B zone (Cl:N mass ratios of 9–12.8), HOCl reacted with monochloramine to form N2 as in Equation (5), and thus, total residual chlorine gradually decreased as Cl:N mass ratio increased. At Cl:N mass ratio of 12.8:1, the concentration of total residual chlorine was the lowest (40 mg/L). When Cl:N mass ratio was higher than 12.8 (C zone), free residual chlorine sharply increased because NH3 was exhausted in the EGC, and thus, total residual chlorine also rapidly increased. Therefore, it was calculated that EGC reached breakpoint when the Cl:N mass ratio was 12.8:1.

Effect of Cl:N mass ratios on free and total residual concentrations of chlorine in the EGC after chlorination.
As shown in Fig. 5, concentration of residual NH3-N monotonically decreased as Cl:N mass ratio increased. The highest removal ratio was obtained at Cl:N mass ratio of 12.8:1, at which the residual concentrations of NH3-N, TN, TOC, and TIC were 1.5, 130.0, 83.1, and 1,888.7 mg/L with removal ratios of almost 100%, 99.2%, 87.5%, and 82.4%, respectively.
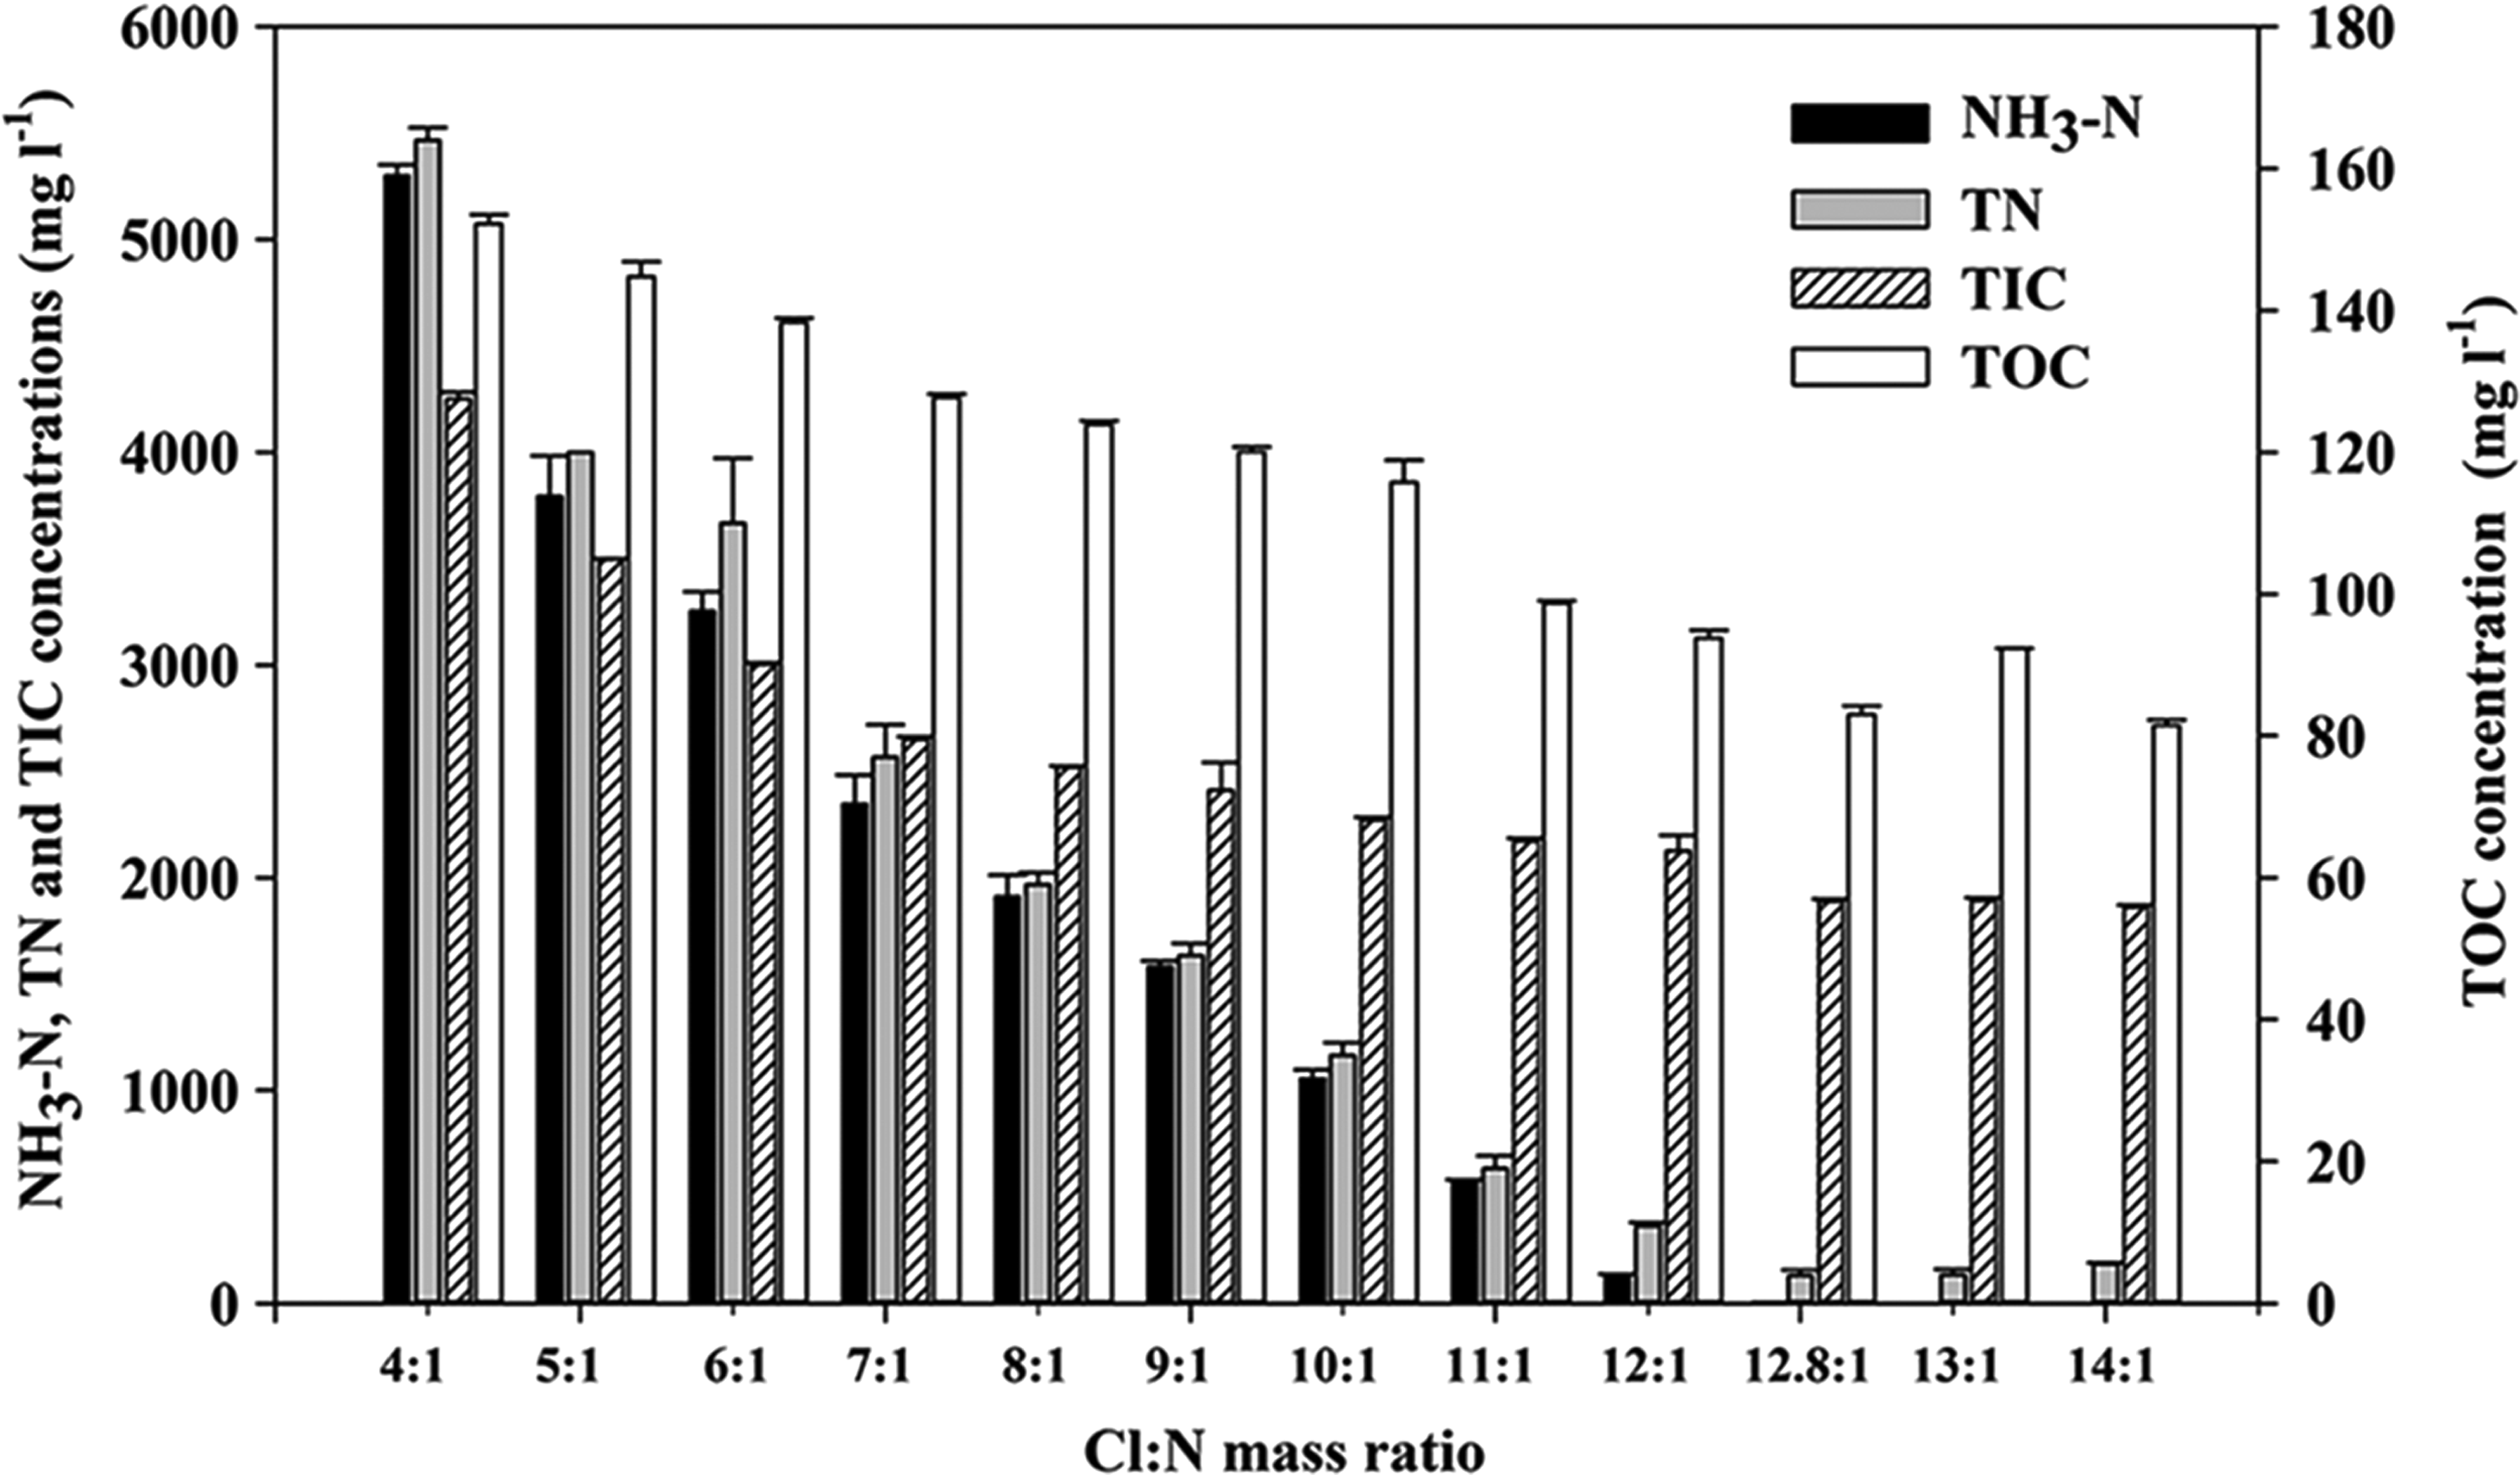
Effects of Cl:N mass ratios on residual concentrations of NH3-N, TN, TOC, and TIC in EGC. TIC, total inorganic carbon; TOC, total organic carbon; TN, total nitrogen.
By using the optimal Cl:N mass ratio (12.8:1), mixture of EGC and acid trap was treated. As shown in Table 6, NH3-N, TN, COD, TOC, and TIC concentrations in the mixture of EGC and acid trap were initially 16,366.7, 16,466.7, 993.3, 435.0, and 684.3 mg/L, respectively. When acid trap was poured into EGC, pH of mixture sharply decreased, and gas bubbles were evolved. It was suspected that TIC of mixture decreased because HCO3− existing in mixture was converted into CO2 gas as the solubility of CO2 decreased at low pHs (Cohen and Kirchmann, 2004). After chlorination at Cl:N mass ratio of 12.8:1, residual concentrations of NH3-N, TN, TOC, and TIC in the mixture were 1.3, 163.3, 62.0, and 152.6 mg/L, respectively, and thus their removal ratios were 100%, 99.0%, 85.8%, and 77.7%, respectively. In addition, concentrations of free and total residual chlorine in the mixture were 14.7 and 55.0 mg/L, respectively.
NA, not analyzed due to chloride interference against COD measurement.
From these results, it was concluded that NH3 recovered from exit gas of sewage biodrying could be treated effectively by using chlorination. Furthermore, organic pollutants were also successfully removed by chlorination. Although chlorination removed the pollutants efficiently, gas emissions during the reaction and the residual chorine might exert side effects to the environment. Thus, the mechanisms and reactions between the NaClO and the VOCs contained in the mixture during chlorination should be further investigated. If necessary, residual chlorine and organic substances of the treated mixture need to be further treated, or sent back to the WWTP before discharge.
Conclusions
In this study, emission gas from the biodrying reactor treating 10 kg of sewage sludge was chilled first to collect condensate and then passed through acid/alkali solutions successively to trap gaseous pollutants. After 7 days of biodrying, 2.993 kg of water, 359 g of C, and 69 g of N were removed from the sludge. The removed water was almost completely recovered as 2.592 kg of EGC and 0.335 kg of water absorbed into cotton filled in the headspace of the reactor. Masses of C and N contained in the condensate, acid trap, and alkali trap were calculated based on measured concentrations of TOC, TIC, and TN and were reasonably close to the masses lost from the sludge during biodrying.
EGC was high-strength wastewater containing 1,485.2 mg/L of COD, 16,500 mg/L of TN (mostly NH3-N), 662.7 mg/L of TOC, and 10,711.8 mg/L of TIC. In EGC, 22 volatile and semivolatile substances were detected by GC-MS, almost all frequently found in the sewage sludge. Acid trap solution also contained a high concentration of TN (16,487.8 mg/L) and a moderate concentration of TOC (281.3 mg/L), while TIC concentration was low (96.2 mg/L). TOC and TN concentrations in the alkali solution were low. TIC concentration reached 22,676.7 mg/L due to dissolution of CO2 produced during sludge biodrying.
To remove NH3-N and organic substances contained in EGC and acid trap solution, methods of ozonation, struvite formation, and chlorination were chosen and compared for EGC first. Chlorination showed the highest removal for all pollutants among these three methods. Cl:N mass ratios were varied from 4 to 14 with the breakpoint found at 12.8:1. At this Cl:N mass ratio, NH3-N and TOC were removed from EGC nearly 100% and 87.5%, respectively.
Finally, EGC and acid trap solution were mixed and chlorinated at the Cl:N mass ratio of 12.8:1, and residual concentrations of NH3-N, TN, TOC, and TIC were 1.3, 163.3, 62.0, and 152.6 mg/L, resulting in removal ratios of almost 100%, 99.0%, 85.8%, and 77.7%, respectively. Therefore, it was concluded that emission gas from sludge biodrying was quantitatively and qualitatively characterized and successfully treated through breakpoint chlorination.
Footnotes
Acknowledgment
This work was supported by the Basic Science Research Program through the National Research Foundation of Korea (NRF) funded by the Ministry of Education (2015R1D1A1A01059073).
Author Disclosure Statement
No competing financial interests exist.