
Abstract
Abstract
The City of Fresno, CA with extensive use of galvanized iron pipe (GIP) has historically used groundwater (GW) as its drinking water source. In 2004, Fresno introduced treated surface water (SW) to its distribution system and started receiving increased discolored water reports. A systematic approach was developed to reproduce the nature of GIP corrosion issues in Fresno and to explore potential discoloration mitigation strategies. Laboratory testing showed that the GW was more corrosive to zinc wire (representative of new GIP) and less corrosive to iron wire (representative of aged GIP) compared with SW. For harvested “good” GIP with a relatively high percentage of zinc contacting water, water turbidity (<2.1 Nephelometric Turbidity Unit), iron (<0.01 mg/L), and zinc (<0.66 mg/L) levels were relatively low for both SW and GW conditions. For harvested “bad” GIP with a relatively high percentage of iron surface contacting water, water turbidity, iron, and zinc levels after exposure to typical GW for 13.5 weeks were 47–89% lower than levels after exposure to typical SW, indicating less likelihood of discolored water with GW. A corrosion control strategy with orthophosphate at 1 mg/L as P and water pH 7.5 reduced problems with turbidity, iron, and zinc release by 36–87% for exposure of “bad” GIP to SW only or to the alternating condition between SW and GW.
Introduction
G
In the high-profile case of Tucson, Arizona in 1992, a switch from noncorrosive groundwater (GW) to corrosive surface water (SW) triggered release of iron rust from old GIP, resulting in thousands of discolored water reports from consumers (Reiber et al., 1997). The water discoloration problems related to GIP corrosion were partly solved by accelerating the removal of GIP service lines. As of 2017, more than 275 miles of old GIPs in Tucson's water distribution system have been replaced. The unpredictable nature of old GIP was highlighted again during the recent Flint, MI water crisis, triggered by a switch from a relatively noncorrosive Lake Huron SW with orthophosphate corrosion inhibitor to a more corrosive Flint River SW without corrosion inhibitor (Schock and Lytle, 2011; Davis et al., 2016; Masten et al., 2016; Pieper et al., 2017; Rhoads et al., 2017).
In the aftermath of the Flint Water Crisis, many consumers have started to associate red water with highly elevated lead (Reiber et al., 1997; HDR Engineering, Inc., 2009; Clark et al., 2015; Masters and Edwards, 2015; Pieper et al., 2017), and the specific circumstances of GIP influences the release of iron, zinc, and lead into water (Fig. 1). Lead release from new GIP can pose a significant health concern as the zinc coating containing up to 2% lead by weight corrodes (Fig. 1A) (Triantafyllidou and Edwards, 2012; Triantafyllidou et al., 2014; Clark et al., 2015). After the zinc coating is depleted and age of GIP increases, the underlying iron surface becomes increasingly exposed to flowing water, with relatively little risk of producing very high lead in water (Fig. 1B, C), although there are serious problems with mobilization of iron rust that contains some lead residual from the zinc coating (Fig. 1D) (Baylis, 1926; Carbucicchio et al., 2008; Clark et al., 2015; Pieper et al., 2017). But if lead pipe is installed upstream of GIP, over years of service, the growing iron rust scale layers can also adsorb and concentrate lead from the water (Fig. 1E) (Sandvig et al., 2008; HDR Engineering, Inc., 2009; McFadden et al., 2011; Wasserstrom, 2014; Clark et al., 2015). When that leaded iron scale detaches, it is possible to observe red water that also has lead levels in the hundreds, thousands or even >10,000 μg/L (Reiber et al., 1997; Quevauviller and Thompson, 2005; Pieper et al., 2017).

Five scenarios of GIP corrosion related to iron (Fe), zinc (Zn), and lead (Pb) leaching potential to potable water. GIP, galvanized iron pipe.
Discolored water concerns and associated lead exposure due to galvanized iron corrosion can be mitigated by implementing appropriate corrosion control treatment (CCT), including adjustment of water pH/alkalinity and adding corrosion inhibitors (Trussell and Wagner, 1996; Reiber et al., 1997; McNeill and Edwards, 2001; Schock et al., 2005). However, the mechanisms of each CCT are poorly understood and the effectiveness depends on water quality, hydraulic flow patterns, temperature, and many other factors (Benjamin et al., 1990; LaRosa-Thompson et al., 1997; Sarin, 2000; McNeill and Edwards, 2001). An increase of water pH up to 8.4 may increase iron release due to reduced buffering capacity, but can eventually decrease iron release at much higher pH due to increased buffering from hydroxide ion and silica (McNeill and Edwards, 2001; Masters and Edwards, 2015). Orthophosphate inhibitors may mitigate iron corrosion by forming a protective scale, whereas polyphosphate inhibitors can sometimes increase solubility of iron complexes or concentration of colloidal iron (McNeill and Edwards, 2000, 2001; Lytle et al., 2005; Wang et al., 2017). Silicate as a corrosion inhibitor can eventually form a protective film in pipe surface and reduce iron particle size, making discoloration of iron in water less noticeable to the consumer (Armstrong et al., 1994; Rushing et al., 2003; Lintereur, 2008).
The City of Fresno, California has historically used GW from 236 wells to meet all of the municipal and industrial water demands of the City's service area, and GIP has performed satisfactorily in terms of leaks, pipe blockage, red water complaints, and the Lead and Copper Rule compliance (EPA, 1991a). As a result, GIP was not banned as a plumbing material as it was in many other cities. The Fresno GW sources (Table 1) have a typical pH of 7.4 and high levels of natural silica at ∼50 mg/L as SiO2, both of which can contribute to low rates of iron corrosion and red water complaints (Armstrong et al., 1994; LaRosa-Thompson et al., 1997; McNeill and Edwards, 2001; Rushing et al., 2003; Schock et al., 2005; Lintereur, 2008).
LSI >0.8 indicates a corrosive water to iron (Larson and Skold, 1958).
GW, groundwater; SW, surface water; LSI, Larson Skold Index.
In 2004, in an effort to meet increasing water demand and reduce the overdrafting of local GW resources, Fresno began to deliver treated SW with a typical pH 9.0 and ∼4.7 mg/L silica as SiO2 to the water distribution system in Northeast (NE) Fresno that serves ∼22,500 homes along with GW from 32 wells. To optimize corrosion and manganese control strategies, the City used 70/30 blend (70% orthophosphate +30% polyphosphate) between 2004 and 2007 and changed to 50/50 blend (50% orthophosphate +50% polyphosphate) after 2007. In 2016, the SW pH was adjusted to 8.4, and in the same year ∼2500 consumers (∼210/month) reported discolored water, most of which occurred in parts of NE Fresno. Moreover, in response to an effort to increase GW sustainability (CA DWR, 2016), Fresno constructed a new 160-million-dollar SW treatment plant with an 80 million gallons per day capacity, which would distribute even more SW throughout the city. Given that over 80% of Fresno homes presently have GIP service lines and home plumbing, avoiding problems by replacing these pipes at a cost of roughly $10,000–15,000 per home is extremely challenging.
Using Fresno, CA as an example, this study developed a novel approach that could help to provide a road map for water utilities who consider switching their water sources in the future. This work reproduced the nature of GIP corrosion issues in Fresno after introducing SW and explored potential corrosion control strategies to reduce water discoloration. Specifically, this study examined (1) the corrosivity of GW and SW to pure iron and zinc metal, which represent extremes of GIPs encountered in practice, (2) the corrosivity of typical GW and SW to GIPs harvested from the Fresno homes with preexisting pipe scale, and (3) corrosion control strategies that might control water turbidity, iron, zinc, and lead release when a combination of SW and GW were used.
Materials and Methods
Two phases of bench-scale experiments were conducted, including examining (1) the corrosivity of GW and SW toward zinc and iron wires and (2) water turbidity and metal release from harvested GIP under a range of representative past and future Fresno water use scenarios.
Phase 1: Corrosivity of GW and SW
Relative corrosivity of GW and SW to pure iron and zinc wires was examined to gain preliminary insight as to the nature and source of the GIP corrosion problem as a function of pipe age. Iron (>99.9% Fe) and zinc (>99.95% Zn) wires (2 mm diameter [d]; 5.7 cm long) were glued (Loctite Super Glue Plastics Bonding System with Activator) to the center of 125 mL glass jar lids (Supplementary Fig. S1; Supplementary Data are available online at www.liebertpub.com/ees). Zinc wires represented new GIP with a 100% zinc coating intact (Fig. 1A), whereas iron wire represented a scenario where the protective zinc coating has been completely depleted (Fig. 1C).
Each jar was filled completely with filtered SW (i.e., SW was not treated with corrosion inhibitors and disinfectants) from NE Surface Water Treatment Facility (SWTF) in Fresno or with GW from 1 of 32 wells in NE Fresno, where most of the discoloration problems were reported (Supplementary Table S1).Water conditions were tested in duplicate and continuously well-mixed on an orbital shaker table (MaxQ3000) at 100 rpm for 7 days. The water pH for each GW condition was adjusted to a target pH, representing an average pH for each well monitored historically and provided by Fresno. The original filtered SW pH ranged from 7.2 to 7.4 and was adjusted to 7.1, 7.9, or 8.4, representing the historically used SW pH in Fresno. The water pH was achieved using carbon dioxide (CO2) and 0.1 M sodium hydroxide as confirmed by a pH meter (Model Oakton 11 series).
Visible changes in water clarity were recorded and photographed over the course of 7 days. Before and after the 7-day testing, turbidity of water sample was recorded after thoroughly shaking each glass jar (LaMotte 2020 Portable Turbidimeter), and total iron and total zinc concentrations were measured on a Thermo Electron X-Series Inductively Coupled Plasma-Mass Spectrometer (ICP-MS). The 10 mL aliquots were collected after thoroughly shaking, acidified with 2% v/v concentrated nitric acid, and digested for a minimum of 16 h before analysis per Standard Method 3125-B (APHA, AWWA, and WEF, 1998). For data quality assurance and quality control (QA/QC), blanks and spikes of known concentrations were measured every 10–15 samples. In addition, the impact of Loctite glue on water turbidity, water pH, and metal levels (i.e., total zinc, iron, and lead) was evaluated and found negligible as indicated in Supplementary Table S2.
Phase 2: Harvested GIPs examined under representative past and future Fresno water scenarios
GIP coupons
GIPs (d = 1.3–2.5 cm) were harvested from two homes that had previously reported water discoloration problems to Fresno and sent to Virginia Tech. To minimize disturbance to the pipe interior scale, the pipes were filled with GW from well six (Supplementary Table S1), which was one of the most frequently used wells in NE Fresno. The two ends of each pipe were closed with rubber stoppers during transport. The pipes were cut into 2 cm long coupons. All coupon surfaces that were not exposed to tap water in service were coated with epoxy (Devcon 5-min epoxy), during which time the coupons were held in a 100% humidity condition to prevent the scale from drying. In this manner, only aged surfaces that contacted water in service were exposed to water during subsequent tests. In total, 420 coupons were cut from GIPs and all coupons were epoxied (PC ·11 white epoxy paste) to the bottom of a 125-mL glass jar.
Coupon conditioning
All 420 GIP coupons were exposed to well 6 (Supplementary Table S1) at a water pH of 7.4 ± 0.3 for 4 weeks to allow scales to recover (Supplementary Fig. S1). A “dump-and-fill” protocol was executed three times per week (Monday, Wednesday, Friday), in which the contents of the glass reactors were inverted to “dump” the water, after which the reactors were immediately and completely filled with fresh target solution every Monday, Wednesday, and Friday or every 2–3 days. For QA/QC, the impact of Devcon and PC ·11 epoxies on water turbidity, water pH, and metal levels (i.e., total zinc, iron, and lead) was evaluated and found negligible as indicated in Supplementary Table S2. Water turbidity was measured at the end of the 4-week conditioning experiments using the method in Phase 1. Also, 50 “good” and 50 “bad” GIP coupons were selected based on the level of water turbidity during contact with each material for bench scale testing. Specifically, the 50 coupons with the highest turbidity were selected to represent “bad” coupons, while the 50 coupons with the lowest turbidity represented “good” coupons. The interior scale of the “good” and “bad” GIP coupons was examined for elemental composition via environmental scanning electron microscope with an attached X-ray energy dispersive system (ESEM/EDS).
Bench-scale testing
During the first 5.5 weeks, 90 (45 of the 50 “good” coupons and 45 of the 50 “bad” coupons) coupons were used to evaluate 15 water conditions that have been historically used in Fresno (Supplementary Table S3). Five GW, five SW, and five alternating conditions were examined. Each alternating condition was conducted by alternating between one SW and one GW every 2–3 days, to simulate the alternating scenario occurring in Fresno. The representation of each water condition is explained in detail in Supplementary Table S3. Three of the 45 “good” coupons and three of the 45 “bad” coupons were exposed to each water condition. The GW from well six (Supplementary Table S1) and the filtered SW from SWTF were shipped to Virginia Tech for use in this phase of testing. The water pH with ±0.3-unit difference for each condition was achieved with CO2 or 0.2 M calcium hydroxide (Ca(OH)2), representing water pH adjustment options in NE SWTF in 2016. The corrosion inhibitors tested included 1 mg/L orthophosphate as P, 1 mg/L 70/30 blend (70% orthophosphate +30% polyphosphate) as P, 1 mg/L 50/50 (50% orthophosphate +50%polyphosphate) blend as P, 3 mg/L silicate as SiO2, and 1 mg/L zinc orthophosphate as P with 0.4 mg/L Zn as confirmed by ICP-MS. The Ca(OH)2, 70/30 blend, and 50/50 blend were chemicals used by the City of Fresno and were shipped from existing stocks to Virginia Tech.
A “dump-and-fill” protocol was conducted three times per week (Monday, Wednesday, Friday) as described in the conditioning phase. All glass jars were placed on an orbital shaker table (MaxQ3000) at 100 rpm to ensure well-mixed water conditions. The baseline water turbidity, iron, and zinc were defined as the level measured in the water in contact with GIP coupons for the first 2 days in bench scale testing, which was collected right before the first water change. The water turbidity and metal analyses (total iron, zinc, and lead) were completed before the first water change in bench scale testing (baseline) and after the 5.5-week exposure.
Between weeks 5.5 and 9, the dump-and-fill protocol was conducted on a weekly basis and no data collection was performed. Between weeks 9 and 13.5, 3 initial water conditions were discontinued and all 100 coupons (90 used in the first 9 weeks +10 additional) were used for 12 initial water conditions examined during the first 9 weeks and for 2 new water conditions (Supplementary Table S2). In total, 17 water conditions were examined throughout 13.5 weeks of exposure to support execution of a larger pilot scale follow-up study in Fresno. The water change and maintenance protocol remained the same as described previously in the bench-scale testing section. The water turbidity and metal analyses (total iron, zinc, and lead) were conducted at the end of the 13.5-week exposure.
Data analysis
All statistics were conducted in RStudio (version 3.3.2). An alpha value (α) of 0.05 was selected to determine the statistical significance. Nonparametric statistics, including Wilcoxon test and Kruskal–Wallis test, were used to compare the mean ranks for non-normally distributed data (Dalgaard, 2008). The Spearman's test was used to examine the correlation between metals (iron, zinc) and turbidity.
Results and Discussion
Nature of the problem: pure Zn, pure Fe, and inherent corrosivity of GW and SW
Turbidity and zinc levels in zinc wire test
When duplicate zinc wires (representing new GIPs with 100% zinc coatings) were exposed to 32 GWs and one SW at three water pHs for 7 days (Supplementary Fig. S2A), there was no visible change in water clarity in any of the 70 glass jars throughout the 7-day experiment (Supplementary Fig. S2B). The average turbidity ranged from below the detection level of 0.05 Nephelometric Turbidity Unit (NTU) to 0.3 NTU for GW conditions, which was significantly lower than the 0.4–1.2 NTU measured for SW conditions (Wilcoxon test, p < 0.05) (Supplementary Table S1). Although GWs had lower turbidity, GWs were more corrosive to the pure zinc wires compared with SW, as the average zinc leaching was significantly higher in the GWs (Wilcoxon test, p < 0.05) (Supplementary Fig. S2A; Supplementary Table S1).
For SW at water pH of 8.4, 7.9, and 7.1, the average zinc concentration was 1.2, 1.5, and 2.1 mg/L, respectively. For 32 GWs, 87% of the samples were above the highest average zinc level of 2.1 mg/L in SW and 5% of the samples contained less than 1.5 mg/L average zinc, 50% contained less than 4 mg/L, and 95% contained less than 6 mg/L. Zinc levels in water did not cause water clarity concerns, as water turbidity was not correlated with zinc levels (Spearman's, p > 0.05). Even the highest zinc concentration of 7.7 mg/L, 1.5 times the secondary maximum contaminant level (SMCL) of 5 mg/L, did not cause any visual discoloration problems despite the fact that this concentration is sometimes expected to cause milky water and aesthetic concerns (EPA, 1991b; WRC, DWAF & DOH, 2001).
Turbidity and iron levels in iron wire test
When duplicate iron wires (representing aged GIPs with 100% iron rust surfaces) were exposed to 32 GWs and SW at three water pHs for 7 days (Fig. 2A), the water clarity changed dramatically among the different water conditions (Fig. 2B, E). Before testing started (day 0), all waters had very low average turbidity of 0.1 ± 0.1 NTU. On day 7, the average water turbidity for SW was 96.1-157 NTU, statistically similar to that (22.8–165 NTU) for GWs (Wilcoxon test, p > 0.05) (Supplementary Table S1).
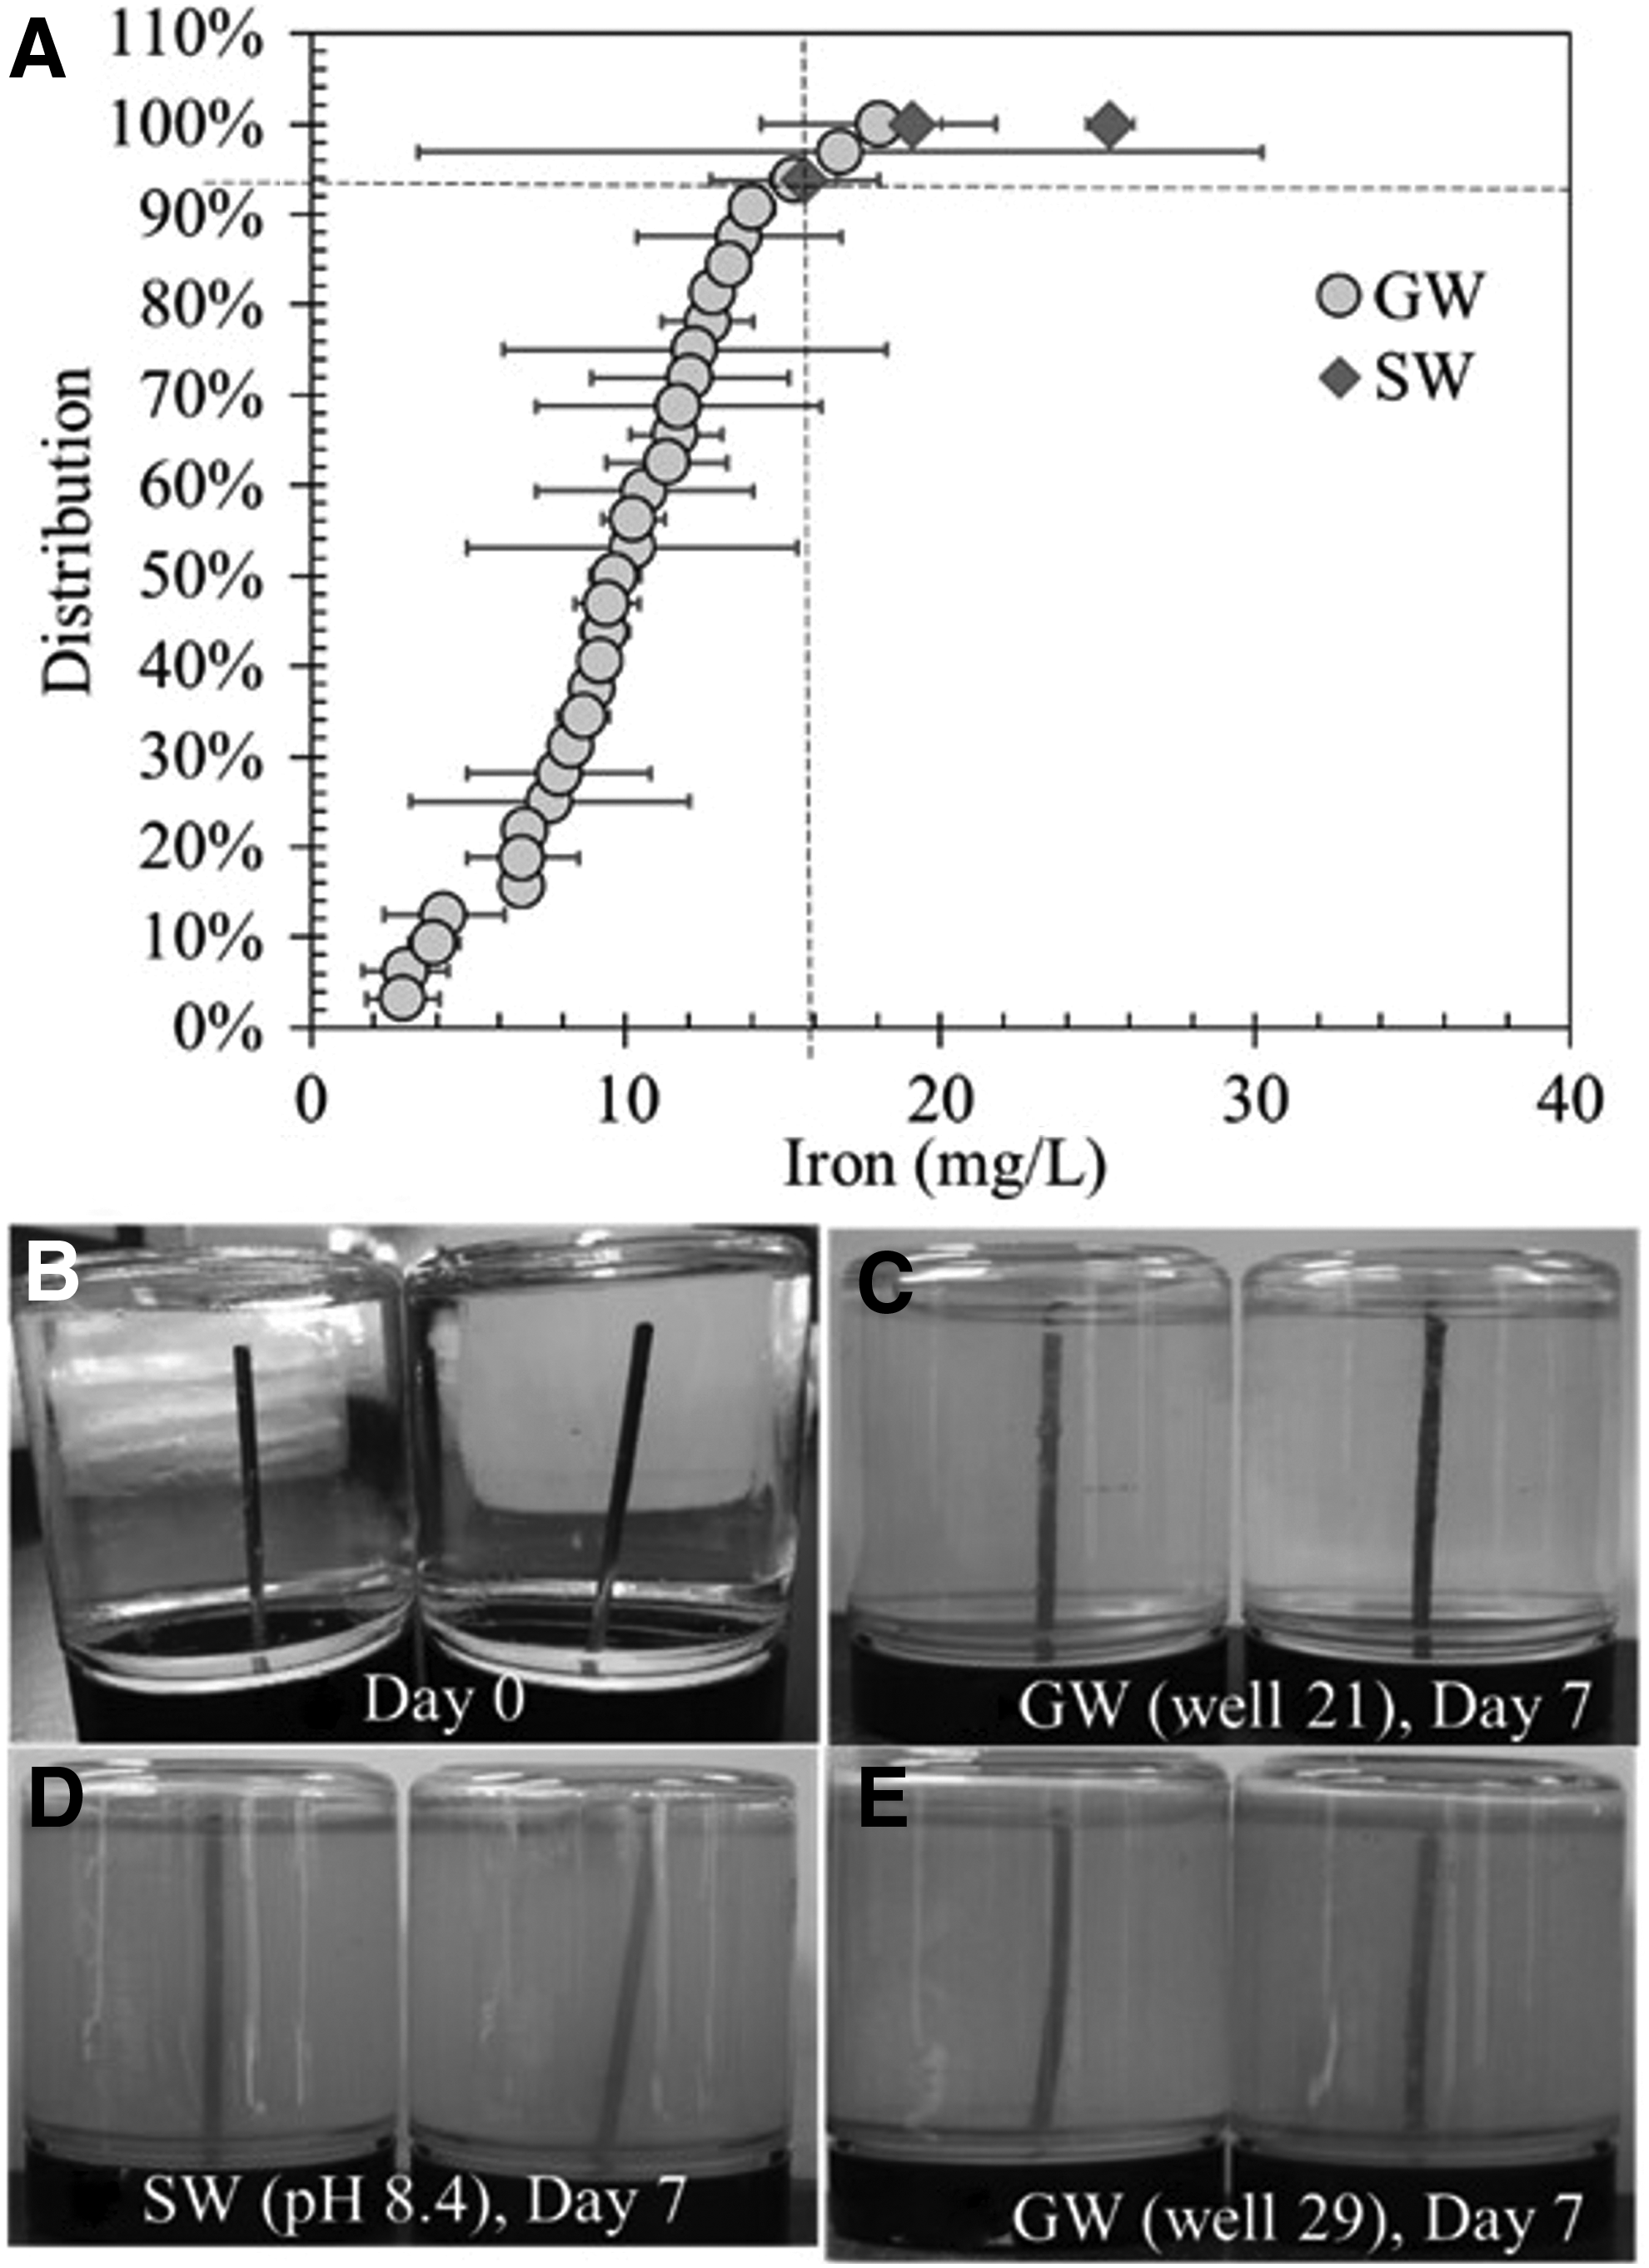
Distribution of iron release
Despite similar water turbidity, the SW was more corrosive to the iron wires than GW, as measured by significantly higher average iron leached into the water (Wilcoxon test, p < 0.05) (Fig. 2A; Supplementary Table S1). For SW at water pH of 8.4, 7.9, and 7.1, the average iron concentration was 25.4, 19.1, and 15.7 mg/L, respectively. For 32 GWs, 96% of the samples were below the lowest average iron level of 15.7 mg/L in SW and 5% of the samples contained less than 3 mg/L average iron, 50% contained less than 9.7 mg/L, and 95% contained less than 15.4 mg/L. The iron in water was the main contributor to water cloudiness as confirmed by a strong correlation between water turbidity and iron (Spearman rho = 0.76, p < 0.05).
Variability of zinc and iron levels
Zinc levels observed in zinc wire test had relatively low variability (Supplementary Fig. S2A). Duplicate zinc wires exposed to well seven water had an average zinc of 7.4 and 8.1 mg/L with a largest standard deviation of 0.6 mg/L among all water conditions. Larger variations were observed in the iron wire test (Fig. 2A). Duplicate iron wires exposed to well 21 had an average iron level of 7.3 and 26.3 mg/L with a largest standard deviation of 13.4 mg/L among all water conditions. This reflects the complex variability of iron corrosion even under the most reproducible and simple conditions that can be achieved in routine laboratory testing.
Summary
The SW at pH 8.4 caused the lowest average zinc leaching of 1.2 mg/L, the highest average iron leaching of 25.4 mg/L, and visually the most discolored water (Supplementary Table S1). This was consistent with previous studies demonstrating that water pH close to 8.3 and low buffering intensity induces the worst GIP corrosion and red water problems (AWWA, 1996b; Masters and Edwards, 2015). Therefore, corrosion control by adjusting pH away from 8.3, which is a minimum of buffering intensity, could sometimes be beneficial in reducing water discoloration from red water.
Characterization of selected “good” and “bad” harvested GIP coupons
After evaluating the nature of new and aged GIP corrosion with Fresno GW and SW using pure zinc and iron wires, the interior scale of selected 50 “good” and 50 “bad” harvested GIP coupons from Fresno homes were analyzed by ESEM/EDS before bench scale testing (Supplementary Fig. S3).
The 50 selected “good” GIP coupons contained mostly zinc-based scale and relatively little iron, representing relatively new or “good” GIP in Fresno (Fig. 1A; Supplementary Fig. S3). The composition of the scale from six measurements by ESEM/EDS was 11.2% (±4.9%) carbon (C), 36.1% (±3.1%) oxygen (O), 14.3% (±1.5%) silicon (Si), 0.2% (±0.2%) phosphorus (P), 0.4% (±0.4%) calcium (Ca), 2.4% (±0.4%) iron (Fe), and 35.4% (±6.5%) zinc (Zn) on a normalized mass basis. These 50 coupons produced an average baseline water turbidity of <0.05 NTU, iron of <0.053 mg/L (18% of the SMCL of 0.3 mg/L), and zinc of 0.25–0.85 mg/L (4.9–17% of the SMCL of 5 mg/L) (Supplementary Table S4), which were measured at the beginning of bench-scale testing and illustrates why new GIP sometimes gives satisfactory performance (EPA, 1991b).
In contrast, the 50 selected “bad” coupons contained much more reddish iron rust-based scale, representing relatively old or “bad” GIPs in Fresno (Fig. 1C, D; Supplementary Fig. S3). The composition of the scale from six measurements by ESEM/EDS was 2.9% (±1.1%) C, 37.2% (±2.6%) O, 7.9% (±0.4%) Si, 0.3% (±0.3%) P, 1.4% (±0.2%) Ca, 45.7% (±2.6%) Fe, and 4.6% (±1.1%) Zn on a normalized mass basis. Both zinc-based and iron-based scales contained a small amount of phosphorus (0.2–0.3%) and relatively large amounts of silicon (7.9–14.3%), indicating some incorporation of phosphate-based corrosion inhibitor and natural silicate minerals in pipe scale of the NE Fresno water system.
These “bad” GIP coupons produced an average baseline water turbidity of 6.9–15.9 NTU, iron of 0.50–3.6 mg/L, and zinc of 0.54–5.13 mg/L (Supplementary Table S5). The majority of GIPs in Fresno homes would probably fall in-between the performance of these selected “good” and “bad” GIPs. The 50 “good” and 50 “bad” GIP coupons were allocated to 17 groups with 3–6 coupons in each group (Supplementary Table S3), and the baseline water turbidity, iron, and zinc levels among the 17 sets were statistically the same for “good” and “bad” groupings (Kruskal–Wallis test, p > 0.05). It is worth noting that the “good” GIP with zinc-based scale had relatively low variability in water turbidity, iron, and zinc, whereas the “bad” GIP coupons with iron-based scale had relatively large variability, which was also shown in the wire tests and in the following bench scale testing results.
Corrosivity of typical GW and SW to harvested GIPs from Fresno residential homes
The historical water discoloration problems in Fresno after switching from typical GW to treated SW were successfully reproduced as indicated by varied water turbidity, iron, and zinc release from GIPs (Fig. 3; Supplementary Tables S4, S5).
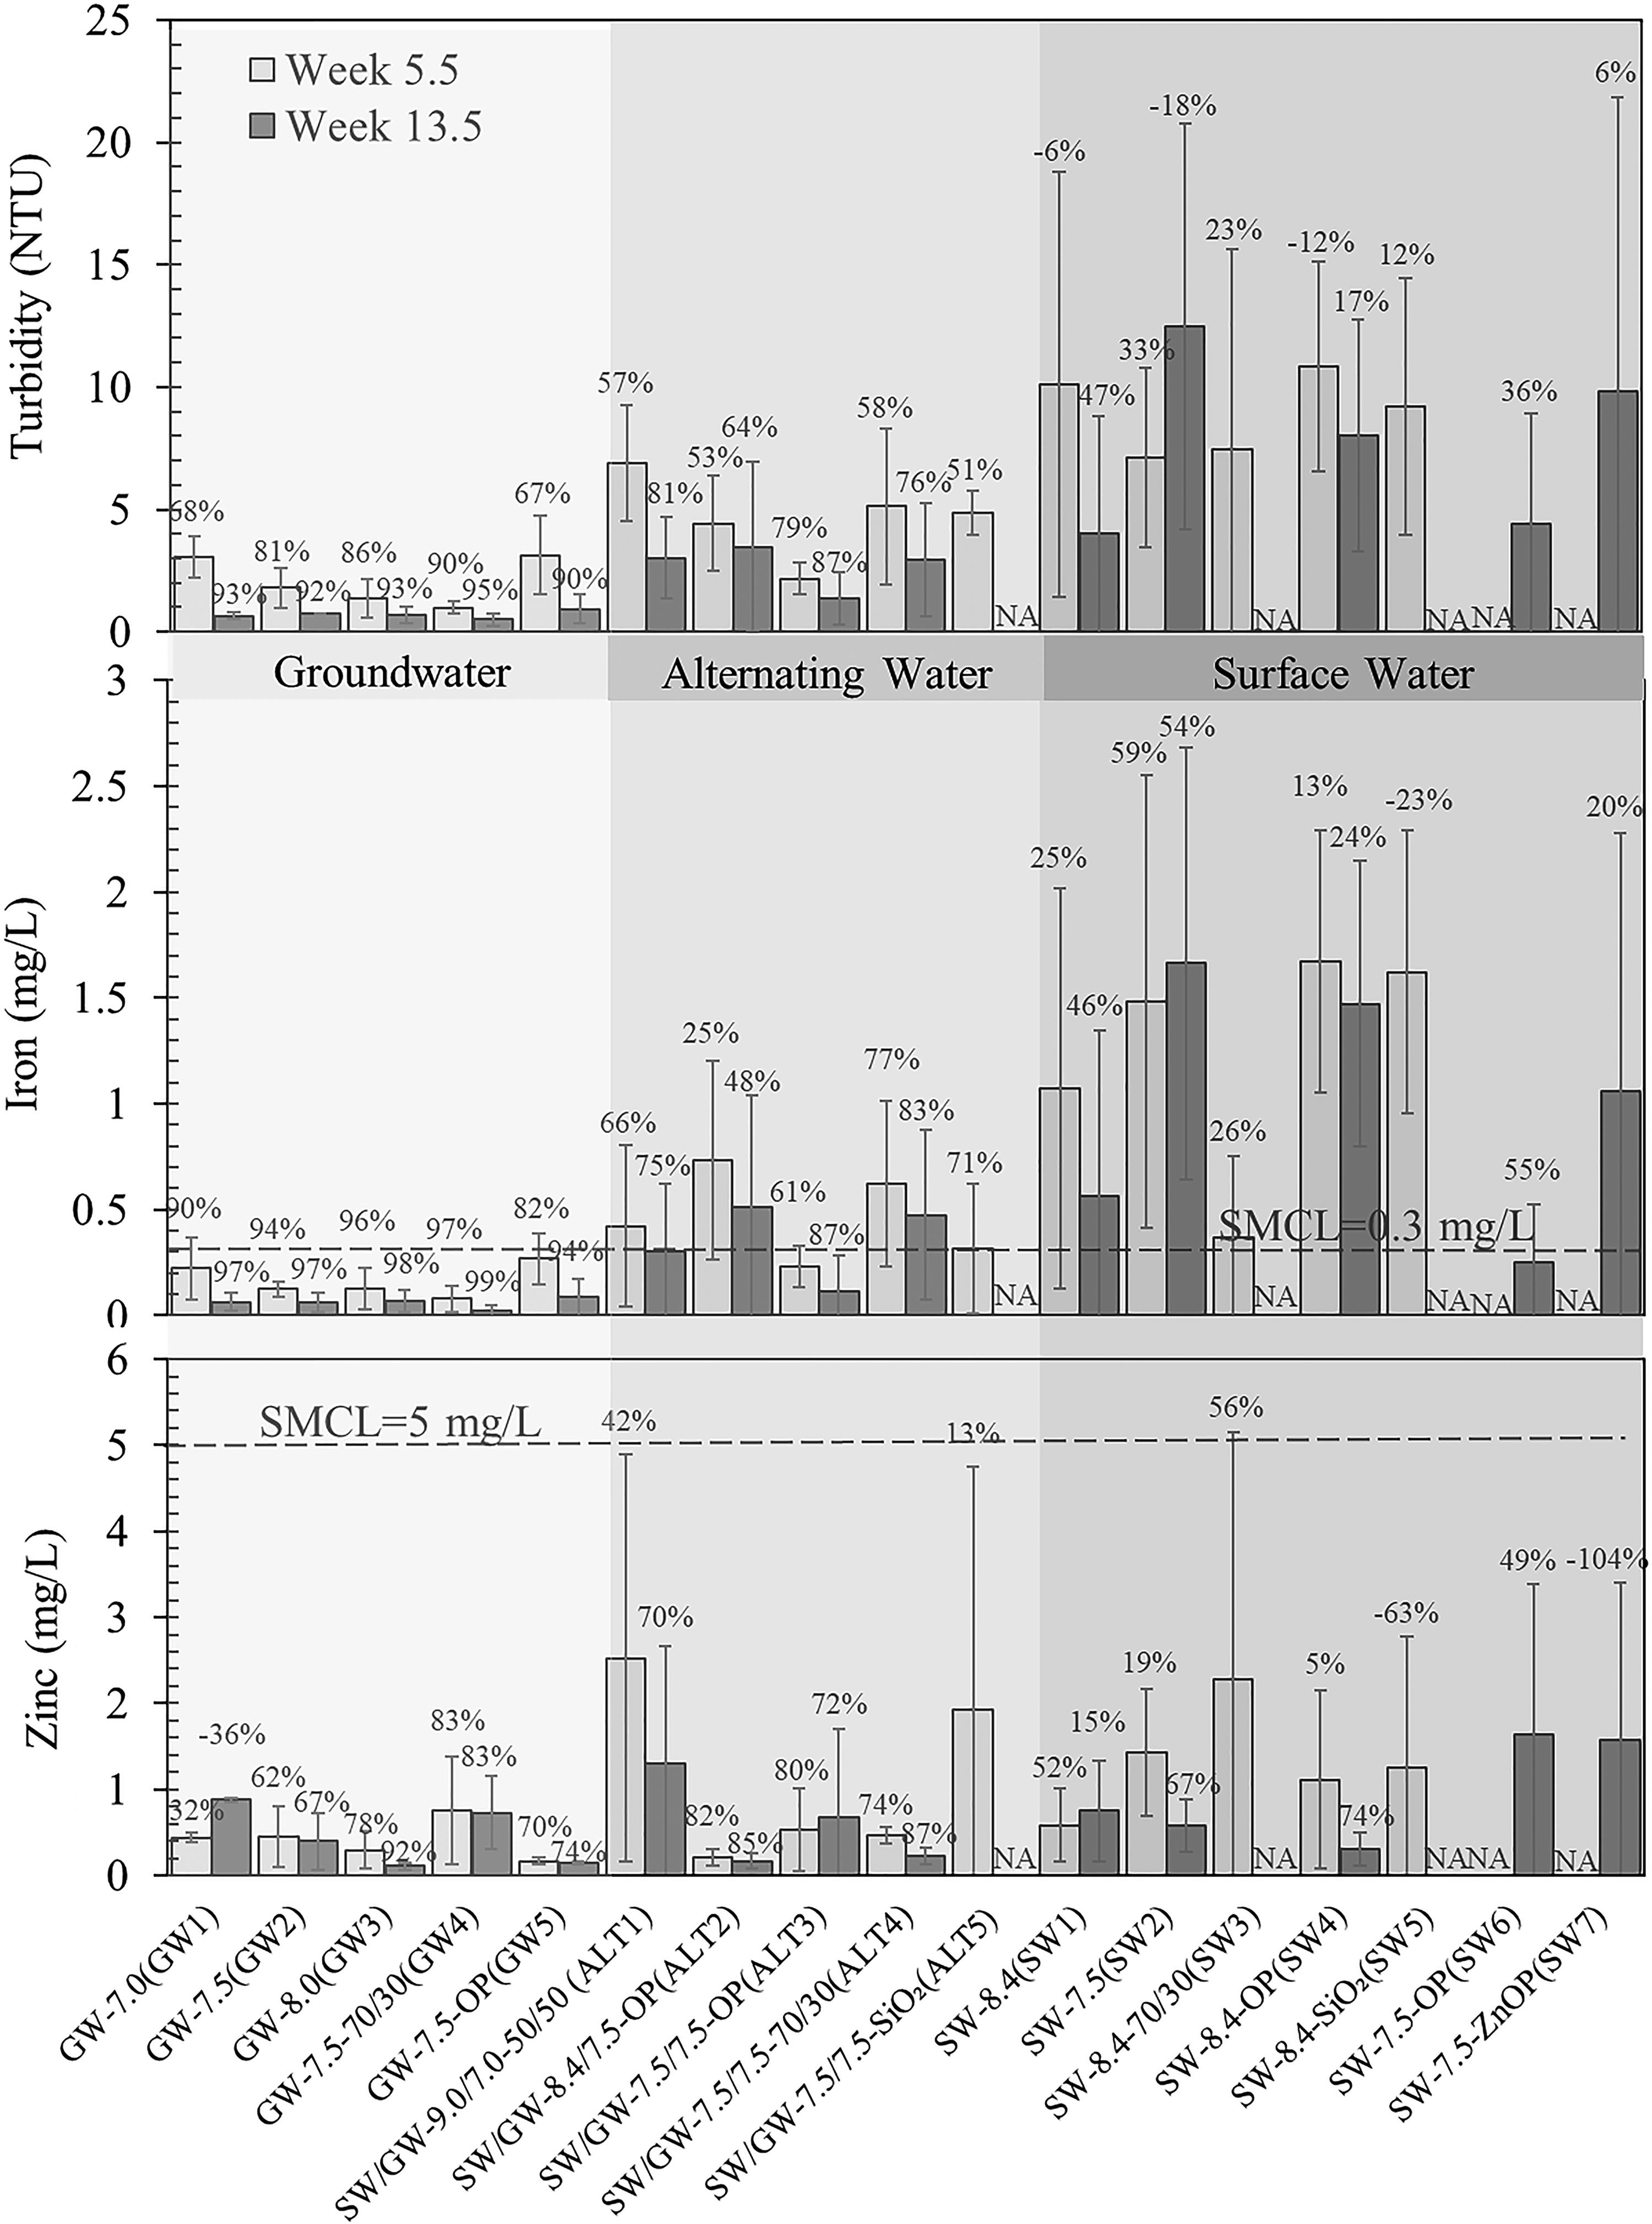
Water turbidity, total iron, and total zinc release for “bad” GIP coupons. The indicated percentage illustrates the percent reduction compared to the baseline level, and error bars indicate one standard deviation (negative number = increase in concentration relative to baseline, Calculation S1). OP, 1 mg/L orthophosphate as P; 70/30, 1 mg/L blend (70% OP +30% polyphosphate [PP]) as P; 50/50, 1 mg/L blend (50% OP +50% PP) as P; SiO2, 3 mg/L silicate as SiO2; ZnOP, 1 mg/L Zn OP as P; GW-7.5-70/30 (GW4), GW at pH 7.5 with 1 mg/L 70/30 blend as P; SW/GW-9.0/7.0-50/50 (ALT1), alternating water between SW at pH 9.0 with 1 mg/L 50/50 blend as P; and GW at pH 7.0 with 1 mg/L 50/50 blend as P; SMCL, secondary maximum contaminant level; NA, not applicable.
Three “good” and three “bad” GIP coupons were exposed to a historically typical GW quality in Fresno (pH 7.5 without CCT [Table 1; Supplementary Table S3]). The water turbidity, iron, and zinc levels were relatively stable throughout the 13.5-week exposure. For the three “good” coupons, the average baseline water turbidity, iron, and zinc levels were below detection level (0.05 NTU), <0.027, and 0.29 mg/L, respectively (Supplementary Table S4). After 13.5 weeks of exposure with the “dump-and-fill” protocol, the average water turbidity, iron, and zinc were 0.3 NTU, below detection limit (0.01 mg/L), and 0.16 mg/L (Supplementary Table S4).
For the three “bad” coupons, the average baseline water turbidity, iron, and zinc were 9.5 NTU, 2.1, and 1.2 mg/L, respectively, decreasing to 0.7 NTU (92% reduction), 0.06 mg/L (97% reduction), and 0.4 mg/L (67% reduction) after 13.5 weeks of exposure (Fig. 3; Supplementary Table S5; Calculation S1). The low levels of water turbidity (0.7 NTU), iron (<SMCL of 0.3 mg/L), and zinc (<SMCL of 5 mg/L) confirmed that the corrosivity of GW to GIP with zinc-based scale and to GIP with iron rust-based scale was relatively low, at least in terms of discolored water and iron release (EPA, 1991b). This can help explain why areas in Fresno with typical GW would have a low likelihood of water discoloration reports from GIP corrosion before SW was introduced in 2004.
Similarly, six “good” and five “bad” GIP coupons were tested using the filtered SW at pH 8.4 (SW1 in Fig. 3), representing a typical water quality in NE Fresno during 2016 (Table 1; Supplementary Table S3). After 13.5-week exposure, the six “good” coupons achieved below detection level of iron (0.01 mg/L), but did show a slight increase in turbidity and zinc to 0.4 NTU and 0.23 mg/L, respectively, compared to the typical GW (Supplementary Table S4). However, the five “bad” coupons showed 470%, 830%, and 88% increase in water turbidity, iron, and zinc concentration, respectively, compared to the typical GW (Supplementary Table S5). Specifically, after 13.5 weeks of exposure, the average water turbidity, iron, and zinc levels were 4 NTU, 0.56, and 0.75 mg/L, respectively for SW, vs. 0.7 NTU, 0.06, and 0.4 mg/L for GW.
On the basis of these results, switching to treated SW in NE Fresno would be unlikely to cause discoloration issues for homes with new GIP or predominantly zinc-based scale as plumbing, but could cause serious problems in homes with aged GIP with iron-based scale—this is consistent with the high incidence of discolored water reports in some NE Fresno homes starting in 2016. The results also demonstrate how the discoloration of water samples collected within the same home could vary depending on the age and condition of pipe scales (zinc and iron rust-based) running to specific taps. That is, even in homes with discolored water problems, red water is sometimes observed only at a few taps and not others.
Controlling water discoloration by modifying water chemistry
The 32 wells in NE Fresno have a water pH range of 7.1–7.9 and the treated SW has a pH range of 8.4–9.0. The SWTF enhances corrosion control by adding corrosion inhibitors of 50/50 blend or 70/30 blend and is exploring more options, such as adding orthophosphate or zinc orthophosphate (Lytle and Snoeyink, 2002; Sarin et al., 2003, 2004; Liu et al., 2013). To have a comprehensive investigation, the water discoloration control by modifying water chemistry was monitored throughout the 13.5 weeks of exposure (Supplementary Table S3). The discussion below starts with results for “bad” GIP coupons (Fig. 3; Supplementary Table S5), followed by that for the “good” GIP coupons (Supplementary Table S4).
“Bad” GIP coupons
The GIP coupons with iron rust-based scale (“bad” coupons) could cause serious water discoloration problems, dependent on the water source and water quality modifications.
Exposure to GW
Fifteen “bad” coupons were exposed to five GW conditions, including GW1 (existing GW at lower water pH 7.0 without CCT), GW2 (existing GW at typical water pH 7.5 without CCT), GW3 (potential GW at higher water pH >8.0 by stripping out CO2 as a water pH treatment but without CCT), GW4 (GW at typical water pH 7.5 with 1 mg/L 70/30 blend corrosion inhibitor, which was used for manganese and corrosion control between 2004 and 2007 in Fresno), and GW5 (GW at typical water pH 7.5 with potential 1 mg/L orthophosphate corrosion inhibitor aiming at reducing polyphosphate use) (Supplementary Table S3).
For the five GW scenarios, the average baseline water turbidity of 9.5–10.1 NTU decreased to 0.5–0.9 NTU (or 90–95% reduction) after 13.5-week exposure (Wilcoxon test, p < 0.05) (Fig. 3). Likewise, the average baseline iron levels of 1.5–3.2 mg/L for the same five GW conditions significantly decreased to below the detection level of 0.01 mg/L, and the average baseline zinc levels of 0.5–4.4 mg/L significantly decreased to 0.1–0.9 mg/L (Wilcoxon test, p < 0.05). The resultant water turbidity (<1.5 NTU), iron (<SMCL of 0.3 mg/L), and zinc (<SMCL of 5 mg/L) levels among the five GW with CCT (i.e., pH adjustment and addition of corrosion inhibitors) were similar and relatively low (Kruskal test, p > 0.05) (Supplementary Table S5). Therefore, the GIP coupons with iron rust-based scale are expected to have low likelihood of discolored water concerns, in the areas of Fresno that are exposed to only GW and typical GW with 70/30 blend and orthophosphate corrosion inhibitor as CCT.
Exposure to SW
Twenty-five “bad” coupons were exposed to a total of seven SW conditions, including SW1 (SW at current water pH 8.4 in the Fresno water system without CCT), SW2 (SW at potential water pH 7.5 without CCT to match the typical GW water pH in Fresno), SW3 (SW at water pH 8.4 with 1 mg/L 70/30 blend corrosion inhibitor, which was used for manganese and corrosion control between 2004 and 2007 in Fresno), SW4 (SW at water pH 8.4 with potential 1 mg/L orthophosphate corrosion inhibitor), SW5 (SW at water pH 8.4 with potential 3 mg/L silicate corrosion inhibitor), SW6 (SW at potential water pH 7.5 with potential 1 mg/L orthophosphate), and SW7 (SW at potential water pH 7.5 with potential 1 mg/L zinc orthophosphate) (Supplementary Table S3).
After six “bad” coupons were exposed to SW3, with 70/30 blend and SW5 with silicate for 5.5 weeks, the average baseline water turbidity of 9.7–10.4 NTU decreased by 12–23%, smaller than the 33% reduction for SW2 at pH 7.5 without CCT (Fig. 3). Therefore, SW3 and SW5 were terminated at week 9 and SW6 and SW7 were added to investigate the role of orthophosphate and zinc orthophosphate in controlling water discoloration at water pH 7.5, which is a typical water pH in Fresno GW (Supplementary Table S3). At the end of the 13.5-week testing, the average water turbidity of 7.6–10.4 NTU for SW1, SW4, SW6, and SW7 significantly decreased to 4.0–9.8 NTU (or 6–47% reduction) (Wilcoxon test, p < 0.05), whereas the water turbidity of 10.6 NTU for SW2 increased by 18% (Wilcoxon test, p > 0.05) (Fig. 3). Meanwhile, the average baseline iron levels of 0.5–3.6 mg/L for the seven SW conditions decreased to 0.3–1.7 mg/L (Wilcoxon test, p > 0.05), and the average baseline zinc levels of 0.8–5.1 mg/L decreased to 0.3–1.6 mg/L (Wilcoxon test, p < 0.05).
The resultant water turbidity (<23.7 NTU), iron (70% of samples> SMCL of 0.3 mg/L), and zinc (<SMCL of 5 mg/L) levels for all seven SW conditions were on average 8.9, 12.6, and 1.3 times higher than the levels for all five GW conditions, respectively (Supplementary Table S5). Switching from GW to SW with certain CCT strategies in NE Fresno via pH adjustment (SW1 vs. SW2) or addition of 70/30 blend (SW1 vs. SW3), silicate (SW1 vs. SW5), zinc orthophosphate (SW2 vs. SW7), and orthophosphate at pH 8.4 (SW1 vs. SW 4) was deemed unlikely to resolve water discoloration problems, because of similar water turbidity, iron, and zinc levels after 13.5 weeks of exposure compared with control conditions without the extra corrosion control (Wilcoxon test, p > 0.05) (Supplementary Table S5).
However, addition of orthophosphate at pH 7.5 (SW6) showed potential in reducing water discoloration problems—the resultant average water turbidity level of 4.4 NTU for SW at pH 7.5 with orthophosphate (SW6) was about 1/3 of that (12.5 NTU) for SW at pH 7.5 without addition of orthophosphate (SW2) (Wilcoxon test, p = 0.09).
Exposure to alternating GW/SW
Fifteen “bad” coupons were exposed to five alternating water conditions, including ALT1 (alternating water between SW at water pH 9.0 and GW at water pH 7.0 with both sources treated with 1 mg/L 50/50 blend corrosion inhibitor, representing a water scenario present in Fresno from 2004 to 2016), ATL2 (alternating water between SW at current water pH 8.4 and GW at typical water pH 7.5 with both sources treated with potential 1 mg/L orthophosphate), ALT3 (alternating water between SW at water pH 7.5 and GW at water pH 7.5 with both sources treated with potential 1 mg/L orthophosphate), ALT4 (alternating water between SW at water pH 7.5 and GW at water pH 7.5 with both sources treated with 1 mg/L 70/30 blend), and ALT5 (alternating water between SW at water pH 7.5 and GW at water pH 7.5 with both sources treated with 3 mg/L silicate) (Supplementary Table S3).
For the five alternating water scenarios, the average baseline water turbidity of 9.5–15.9 NTU decreased to 1.4–3.5 NTU (or 47–87% reduction) after 13.5 weeks of exposure (Wilcoxon test, p < 0.05) (Fig. 3). Likewise, the average baseline iron and zinc levels of 0.6–2.7 and 1.1–4.4 mg/L, respectively, were significantly reduced to 0.1–0.5 mg/L (or 46–87% reduction) and 0.2–1.3 mg/L (or 70–87% reduction) (Wilcoxon test, p < 0.05). The resultant water turbidity (< 7.3 NTU), iron (40% samples>SMCL of 0.3 mg/L), and zinc (< SMCL of 5 mg/L) levels for the five alternating water conditions on average were 40–400% higher than the levels for the five GW conditions, but 41–64% lower than the levels for the seven SW conditions (Supplementary Table S5). This indicates that iron rust-based scale might cause discoloration problems in Fresno areas with alternating GW/SW, with the likelihood of inducing water discoloration in-between areas exposed to SW only and areas exposed to GW only.
CCT by matching orthophosphate inhibitor and water pH levels could potentially mitigate discolored water concerns when both GW and SW are used in Fresno as indicated by turbidity reduction for ALT3. The water turbidity was reduced by 79% after 5.5 weeks of exposure and 87% after 13.5 weeks of exposure (Fig. 3), the best compared to other alternating conditions with silicate, 70/30 blend or unmatched water pHs between GW and SW.
“Good” GIP coupons
In contrast to “bad” GIP coupons, the “good” GIP coupons with intact zinc-based scale did not cause any aesthetic water concerns with any of the examined water quality modifications via pH adjustment, addition of past and future potential corrosion inhibitors or alternating source water. In summary, when all selected 50 “good” coupons were exposed to the 17 water conditions (Supplementary Table S3), the water turbidity increased from below detection level (<0.05 NTU) to 2.1 NTU after 13.5 weeks of exposure (Supplementary Table S4).
In contrast, the average iron levels for all 17 water conditions decreased below detection levels (<0.01 mg/L) and the average zinc levels significantly decreased to 0.055–0.662 mg/L (Wilcoxon test, p < 0.05). Although the water turbidity increased significantly (Wilcoxon test, p < 0.05), the average water turbidity, iron, and zinc levels for the “good” GIP coupons were much lower compared with the “bad” GIP coupons with aged iron rust-based scale (Wilcoxon test, p < 0.05) (Supplementary Tables S4 and S5). Therefore, as long as GIPs maintain a coating dominated by zinc-based scale, the change in water quality due to source water change is relatively unlikely to cause water discoloration problems. But this zinc coating is destined to disappear.
On the basis of the “bad” and “good” GIP coupon testing results, the condition with pH 7.5 and orthophosphate 1 mg/L as P was selected for pilot scale testing to optimize corrosion control and to mitigate water discoloration concerns from the new source water.
Lead release from harvested GIPs
Lead leaching from both “good” and “bad” GIP coupons was relatively low, with a 90th percentile for week 0–13.5 less than 2.4 μg/L versus an EPA action level of 15 μg/L (Supplementary Table S6) (EPA, 1991a). This is a relatively low amount of lead given that the contact time was 8–12 times longer than the EPA required minimum 6 h (EPA, 1991a), and the mixing used in this study would be expected to increase lead release relative to stagnation. This result explains why Fresno remained in compliance with EPA action levels even when discolored water reports were high. Throughout the 13.5 weeks of exposure, 0.5% (3/580) of water samples contained more than EPA action level of 15 μg/L, with the highest sample measured at 237 μg/L. Only 1.4% (8/580) of samples contained more than 5 μg/L. The samples with higher levels of lead (>15 μg/L) were associated with very high iron levels of up to 7.7 mg/L and high zinc levels of up to 5.3 mg/L.
The simultaneous occurrence of high lead, zinc, and iron levels for the three samples implied sporadic mobilization of rust scale (Clark et al., 2015; Masters and Edwards, 2015; Pieper et al., 2017), consistent with scenario D in Fig. 1. As there are no lead service lines in Fresno, high lead levels in the range (up to 13,200 μg/L) of those observed in Flint or in Washington D.C. were never detected (Edwards et al., 2009; Pieper et al., 2017). This is consistent with the utility monitoring data that showed the lead and copper rule 90th percentile relatively low at below detection level (0.003 μg/L) (City of Fresno, 2016).
Limitations
This study was the first to systematically reveal the basis for consumer's aesthetic concerns and to examine the nature of GIP corrosion under various water chemistry scenarios using new, aged, and harvested GIP. Future mechanistic studies might help better understand the observed impacts of water pH, silica, hardness, alkalinity, dissolved oxygen, and calcium carbonate precipitation potential on GIP corrosion. However, as GIP is an undesirable legacy plumbing material that is destined for extinction, future investment in improved mechanistic understanding of GIP corrosion seems unlikely.
Conclusions
Zinc wire, iron wire, and harvested GIP coupon bench scale tests with characterization of GIP scale yielded the following conclusions:
• The 32 wells with GW were more corrosive to zinc, but less corrosive to iron, than the SW at water pH of 7.1–8.4 (based on levels of metals measured in water). • For “bad” GIP coupons with iron rust-based surface scale, the likelihood of inducing water discoloration problems after exposure to different water conditions for 13.5 weeks was in the order of SW (most likely)>alternating water>GW (least likely). • The “good” GIP coupons with zinc-based scale did not show any water discoloration concerns after exposure to SW, GW, or alternating source water for 13.5 weeks. • The lead release from harvested GIPs with different scales (zinc-based or iron rust-based) was in compliance with EPA regulations. • For areas exposed to alternating water or SW, CCT with orthophosphate at 1 mg/L as P and water pH at 7.5 appeared to be a promising approach to reduce the extent of discoloration that Fresno residents were experiencing.
Footnotes
Acknowledgments
The authors acknowledge the financial support from the City of Fresno, CA, and the National Science Foundation under grant CBET-1336616. The authors thank Maddie Brouse, Hisyam Mohsin, and Sophia Lee for their help with setting up and maintaining the experiments. Opinions and findings expressed herein are those of the authors and do not necessarily reflect the views of the City of Fresno, CA, and the National Science Foundation.
Author Disclosure Statement
No competing financial interests exist.
References
Supplementary Material
Please find the following supplemental material available below.
For Open Access articles published under a Creative Commons License, all supplemental material carries the same license as the article it is associated with.
For non-Open Access articles published, all supplemental material carries a non-exclusive license, and permission requests for re-use of supplemental material or any part of supplemental material shall be sent directly to the copyright owner as specified in the copyright notice associated with the article.