
Abstract
Abstract
Catalytic ozonation was used to remove cyanotoxin-nodularin (NOD) from drinking water in a pilot plant. This investigation evaluates the effectiveness of the catalytic ozonation process in degradation of NOD using a hybrid silver-titanium dioxide catalyst coated on diatomite (Ag-TiO2/DM). Degradation kinetic parameters were determined using NOD removal to evaluate the effectiveness of the catalytic ozonation method. Mutagenicity of water was evaluated using an Ames test during the catalytic ozonation processes in the presence of a hybrid Ag-TiO2 catalyst. Results reveal that the Ag-TiO2 catalyst significantly enhances the rate of degradation of NOD by increasing the rate of production of hydroxyl radicals (OH•), owing to initiation of decomposition on the surface of the catalyst. Calculated pseudo-first-order rate constant (koverall) of the reaction of NOD with O3 and OH• was 9.65 × 10⁻⁴/s without catalyst. However, the greatest improvement in koverall in this study was observed using 500 mg/L Ag-TiO2/DM, which increased koverall by a factor of eight. The Ames test reveals that NOD exhibits positive mutagenic activity in the Salmonella/microsome assay with the strains TA98 and TA100 in the absence and presence of S9. However, based on mutagenic activity of NOD during oxidation, ozonation may reduce the toxic response of test samples. Compared with ozonation-only process, Ag-TiO2/DM exhibited better ozonation capability with reducing mutagenic activities of NOD. Like the Ames test results, the Microtox test results reveal that catalytically ozonated samples are significantly less toxic and exhibit markedly lower residual toxicity than the original samples. Toxic effects of NOD on ozonated samples are greatly influenced by Ag-TiO2/DM dosage and reaction time, possibly yielding by-products that may change mutagenic properties of NOD.
Introduction
T
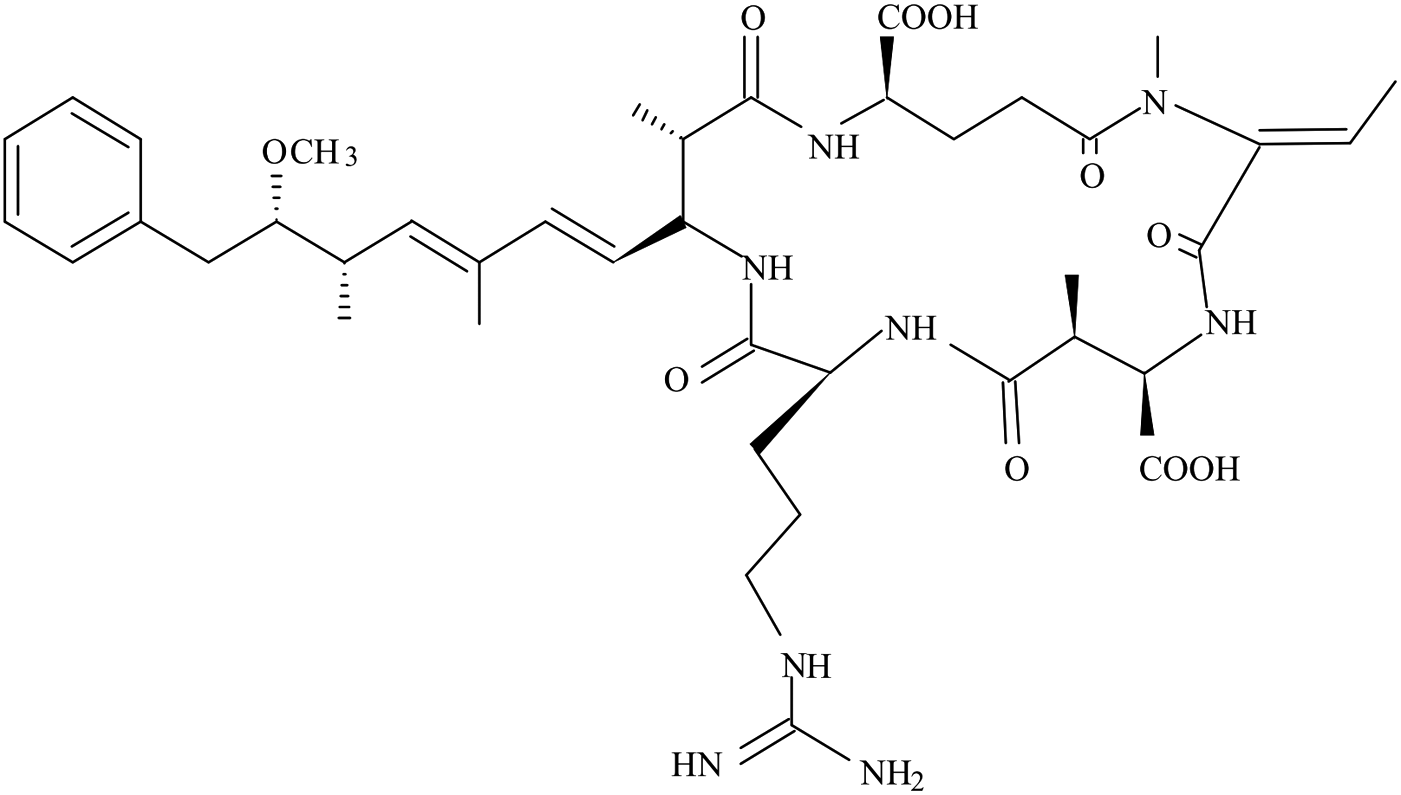
Chemical structure of NOD.
Dissolved cyanotoxin in water samples has been detected in the concentration range 0.1–10 μg/L (Falconer and Humpage, 2005). In actively growing cyanobacteria, most NODs are located in the cells, as very little extracellular toxin is produced. Cell-bound concentrations are many orders of magnitude higher than extracellular concentrations, so the concentration of dissolved toxins may be much higher in aging or declining blooms when cell lysis is triggered and the toxins are released into the environment. The dangers of exposure to cyanotoxin motivate the search for improved human toxin exposure assessment and removal methods.
Heterogeneous catalytic ozonation is a novel form of advanced oxidation, which combines ozone with the adsorptive and oxidative properties of solid-phase metal oxide catalysts to achieve the room-temperature mineralization of pollutants in wastewater (Gracia et al., 1996; Legube and Karpel Vel Leitner, 1999; Kasprzyk-Hordern et al., 2003; Nawrocki and Kasprzyk-Hordern, 2010). Supported and unsupported metals and metal oxides are the most commonly tested catalysts of the ozonation of organic pollutants in water (Ma and Graham, 1997; Ni and Chen, 2001; Beltrán et al., 2002; Nawrocki, 2013). Titanium dioxide is a well-known catalytic material that is used in industry as a heterogeneous catalyst (Rosal et al., 2009). It exhibits high catalytic activity, and is nontoxic, insoluble, and inexpensive. Titanium oxide has been repeatedly reported to be an active material that can accelerate the reaction rates between ozone and various compounds. In the mineralization of carboxylic acids with low molecular weight, it has reportedly yielded forty times greater conversion than noncatalytic homogeneous ozonation (Gracia et al., 2000; Beltrán et al., 2002; Rosal et al., 2008). Moreover, in many studies, the improvement in catalytic ozonation performance of such Ag-deposited monophasic TiO2 (mainly anatase) under ozonation has been attributed to surface plasmon resonance and the consequent extension of the response of TiO2 into the ozone (Li et al., 2012). Although various investigations have addressed the effectiveness of catalytic oxidation in the remediation of organic waste, the optimal parameters of catalytic ozonation remain to be studied. This investigation evaluates the effectiveness of catalytic ozonation in the degradation of NOD in drinking water with pilot-scale plant. The degradation kinetic parameters for NOD removal were obtained to determine the effectiveness of the catalytic ozonation method. The mutagenicity of water was evaluated using the Ames test during catalytic ozonation in the presence of a hybrid Ag-TiO2 catalyst.
Materials and Methods
Chemical reagents
NOD (>95%, molecular weight = 824.96 g/mol) was purchased from EMD Biosciences (Gibbstown, NJ). Acetonitrile, trifluoroacetic acid, n-butanol, and methanol at HPLC grade were purchased from Merck (Darmstadt, Germany). The NOD stock solution was prepared at a concentration of 50 mg/L using deionized water, which was obtained by passing tap water through a Milli-Q system with resistance >18.1 MΩ/cm and on-line TOC <4 μg/L. Ag-deposited titania on the surface of diatomite was synthesized by the sol–gel method using titanium isopropoxide (Ti(OCH(CH3)2)4) that had been purchased from Sigma–Aldrich (Mo, American), and isopropyl alcohol ((CH3)2CHOH) and silver nitrate (AgNO3) that were purchased from Merck & Co. (Darmstadt, Germany).
Preparation of supported Ag-TiO2 film on diatomite
The natural diatomite employed in this study was procured from Merck & Co. The BET surface area, total pore volume, and average pore size of the diatomite are 24.46 m2/g, 0.17 cm3/g, and 21.58 nm, respectively. The monophasic titania sol for use in the catalyst coating method was prepared by mixing 50 g of 2.5 mm diatomite with titanium isopropoxide and isopropyl alcohol in a 1:10 (v/v) ratio. A 50 mL volume of distilled water was added dropwise with constant stirring for 24 h at room temperature and pH = 5.0. The sol was then left to age for 12 h to form a gel, before being heated to 80°C for 12 h. The resultant mixed-phase catalyst was calcined at 500°C for 1 h to yield monophasic anatase. The Ag-deposited monophasic titania that was coated on the surface of diatomite was prepared by adding AgNO3 solution (1 weight%) dropwise into a mixture of 50 g of 2.5 mm diatomite in titanium isopropoxide and isopropyl alcohol (1:10 (v/v) ratio) with constant stirring. Then, the sample was calcined at 500°C and at a ramping rate of 4°C/min for 1 h to yield a film of Ag-TiO2 that was coated on diatomite (Ag-TiO2/DM) (Fig. 2). The thickness of the Ag-TiO2 film was found to be 2.5 μm using stylus profilometry.

SEM images of Ag-TiO2 film on diatomite and EDAX analysis of Ag-TiO2/DM composite film.
Ozonation kinetic experiments
In the kinetic experiments, 2.0 mg/L of NOD was dissolved in Milli-Q water to produce the synthetic water model. The applied concentrations of Ag-TiO2 catalyst were 0–500 mg/L, corresponding to dosages of 50–200 mg-TiO2/L and 36–148 mg-Ag/L. The ozonation semibatch experiments were carried in a thermostatic cylindrical Pyrex cell with a capacity of 4 L. The ozone gas was produced from pure oxygen by a commercial ozone generator (Ozoteck, Model OZ1-BTU, CA) with a gaseous flow meter (Model 824 nylon MFM's LZB-6, Absolute Ozone, AB, Canada). A constant flow rate of oxygen generated approximately 4.3 g O3/h. The concentration of ozone used was 44.5 mg/L and the aqueous ozone concentration is maintained at a range of 3.1 to 3.8 mg/L. The solution was stirred continuously using a magnetic bar. Its pH value was maintained at 7.0 ± 0.1 with the automatic controller of pH; the reaction temperature was maintained at 20°C ± 0.2°C. Ozone concentrations at the gas inlet and outlet of the reactor were measured using an online ozone gas analyzer (Zibo Ideal Measurement and Control Technology Co. Ltd, IDEAL-2000). The aqueous ozone concentration was determined by spectrophotometry using the indigo method (APHA et al., 2005).
Ozonation pilot setup
Pilot studies were conducted in Ci-Lin Lake located in Nantou county, Taiwan. The pilot-scale process train (Fig. 3) consisted of two parallel pilot systems of ozonation and catalytic ozonation. Glass columns were used as the contact reactors (1,800 mm height, 150 mm i.d.). The ozonation reactor and catalytic ozonation reactor columns packing with diatomite (DM, D: 2.5 mm) and diatomite coating Ag-TiO2 film (Ag-TiO2/DM), respectively. The raw water was filtered with 5 μm membrane before being pumped to the pilot test. The influent water qualities of pilot testing system are listed in Table 1. The influent water that contains 2.0 mg/L of NOD was fed using a peristaltic pump (Masterflex_ L/S, Vernon Hills, IL) rated at 2.2 L/min. Ozone was formed from pure oxygen (> 99.99%) using an ozone generator (Ozoteck, Model OZ1-BTU, CA). The ozone gas flow rate at the inlet of the reactor was 0.09 N m3/h. Ozone concentration in the gas phase was approximately 46.7 mg/L, which was measured using an online ozone gas analyzer (Zibo Ideal Measurement and Control Technology Co. Ltd, IDEAL-2000). The ozone-water mixture is generated using a Venturi tube with internal diameter of 25 mm and length of 120 mm. The ozone-water mixture was fed from the bottom of the ozone contactor continuously injected into water through a porous ceramic dispersion plate. The hydraulic loading of ozone contactor [water: packing = 2.35: 1 (v/v)] was approximately 7.5 m/h, which provided a hydraulic retention time of 10 min. The concentration of the aqueous ozone is maintained at the range of 2.5–0.2 mg/L, which was measured by spectrophotometry using the indigo method. The amount of ozone consumed was defined as the difference between the initially applied ozone dose and the sum of the ozone residues in water and gas (APHA et al., 2005).
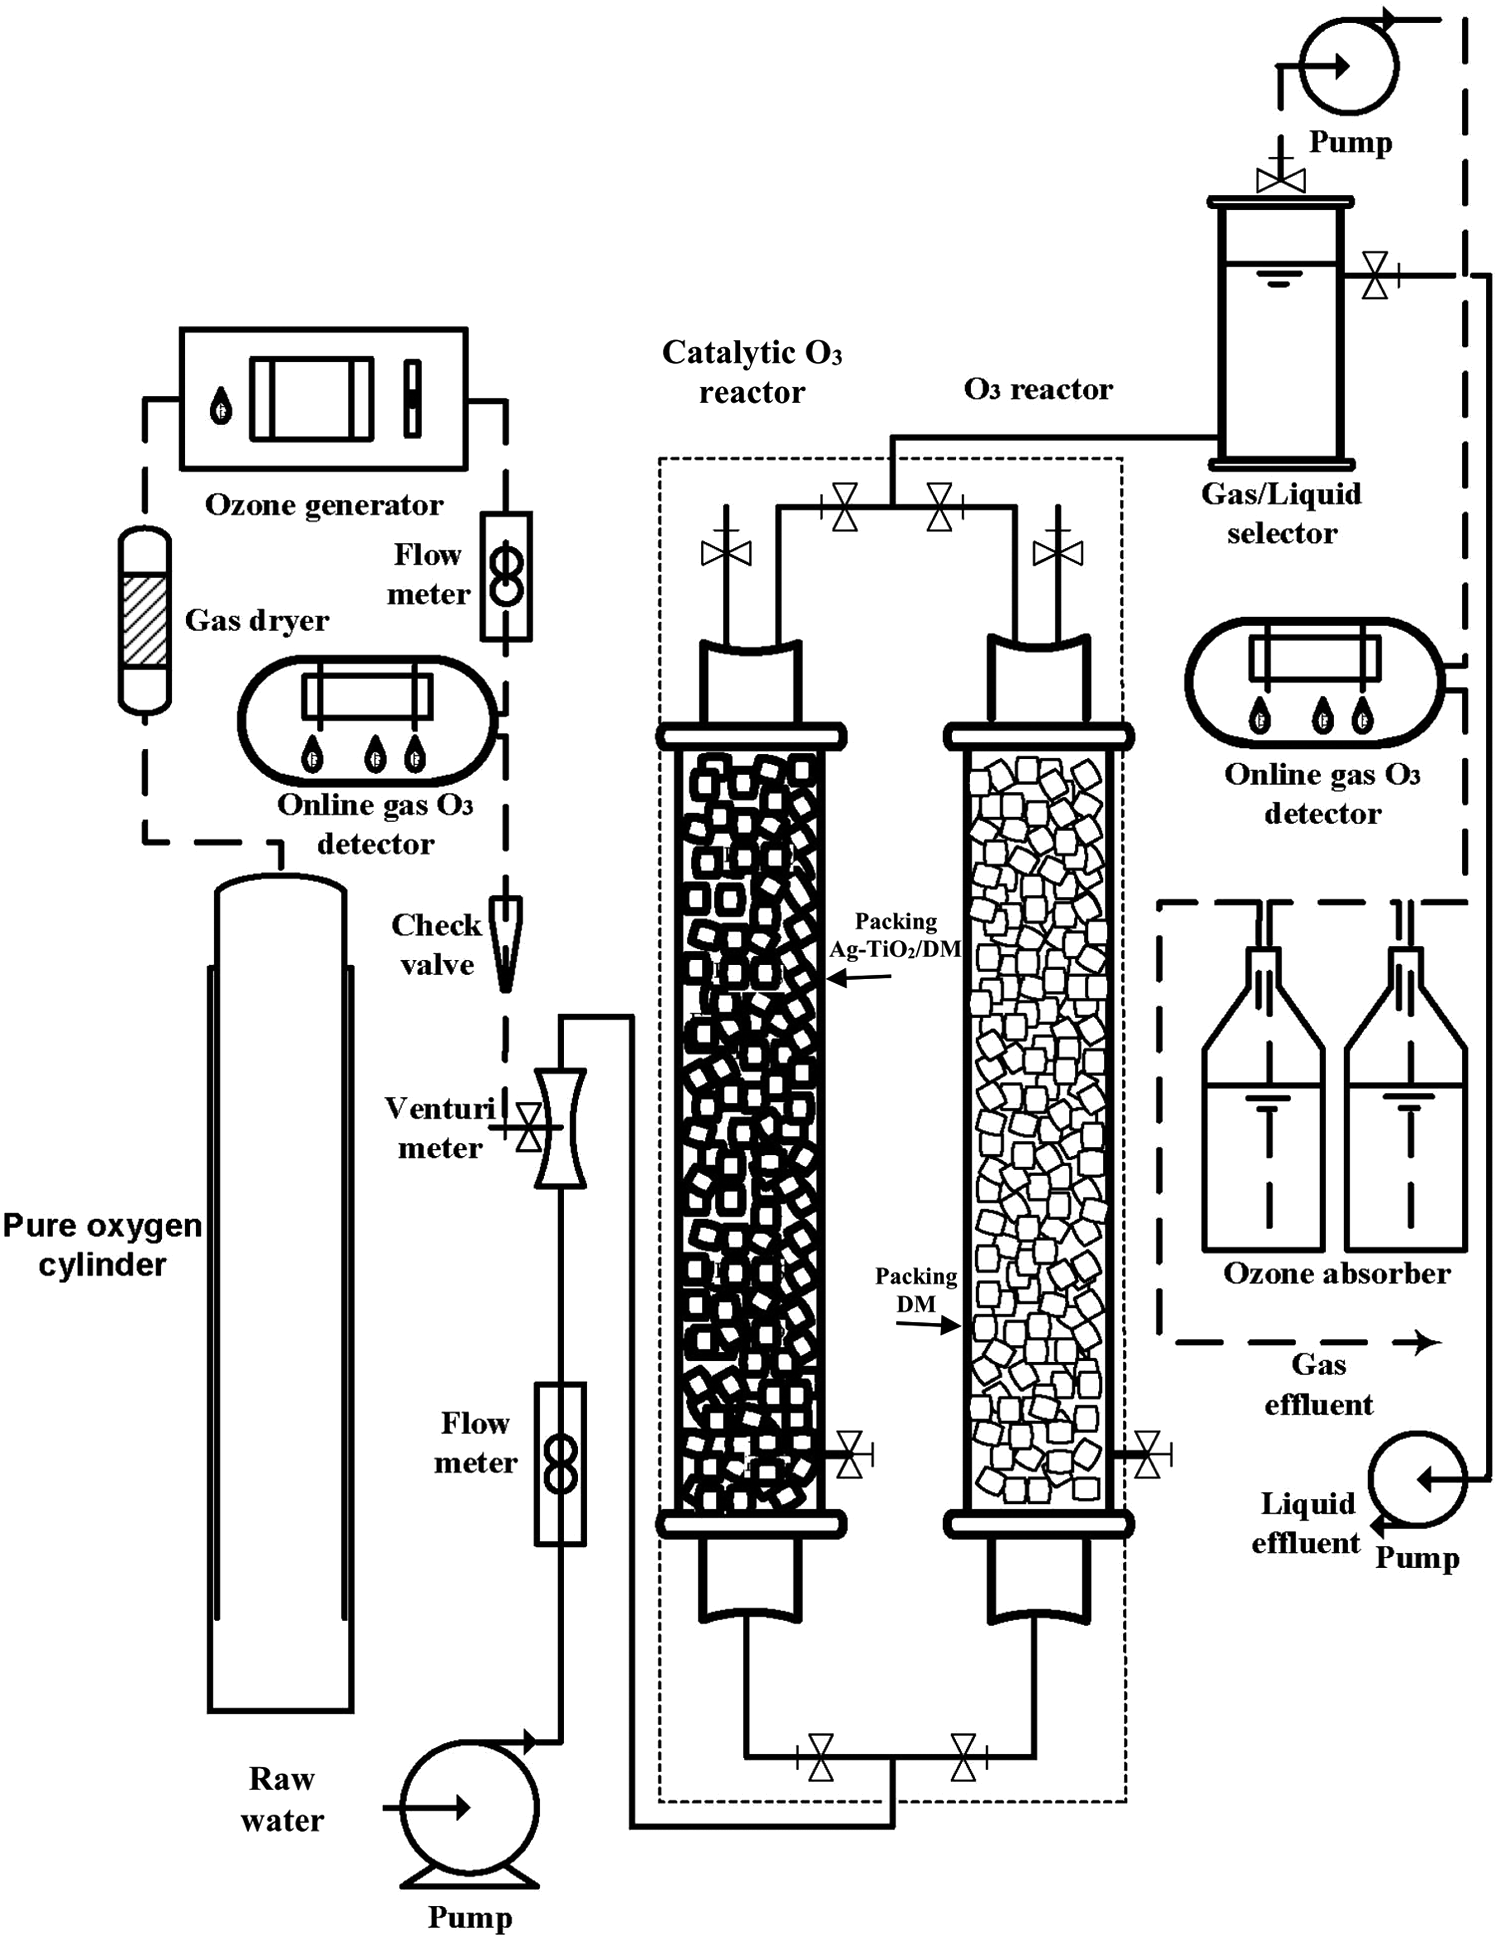
Schematic of catalytic ozonation processes at pilot-scale experimental setup.
TDS, total dissolved solid; Chl-a, Chlorophyll-a; DOC, dissolved organic carbon.
Mutagenicity and toxicity testing
Catalytic ozonated samples that were to undergo mutagenicity testing were concentrated by solid-phase extraction using 15 g silica gel C18 cartridges (Sep-Pak Plus C18 cartridges) (Water Chromatography; Millipore), following USEPA 525.2 (USEPA, 1999) with some modifications (Monarca et al., 2004). Cartridges were activated using solvents before elution with 40 mL of ethyl acetate, 40 of mL dichloromethane, and 40 of mL methanol, and were then washed with 500 mL of distilled water. Next, the samples were pumped through those cartridges (10 L/cartridge) using a multisample concentration system. Cartridges in which adsorption had occurred were eluted using ethyl acetate, dichloromethane, and methanol (40 mL/cartridge per solvent). The eluates were dried using a rotary evaporator in flowing nitrogen at a rate of 30 mL/min. For a negative control, the same procedure was used, except for the addition of 10 L of mineral water that was obtained from an unpolluted groundwater source with a dissolved organic carbon concentration of 0.11 mg/L.
Following evaporation of the solvent, extracts were dissolved in dimethylsulfoxide (DMSO) and tested in triplicate using equivalent volumes of 0.25, 0.5, 1, 2, and 4 L per liter plate with a maximum volume of 200 μL DMSO. The Ames test used Salmonella typhimurium TA98 and TA100 strains (Development Center for Biotechnology, Hsinchu, Taiwan) with and without in vitro microsomal activation (S9 mix) (Maron and Ames, 1983). As is well known, the TA98 strain detects frameshift mutagens and the TA100 strain responds to base-pair substituted mutations. The positive controls were 2-nitrofluorene (Sigma) for TA98 − S9 (10 μg per plate; revertants per plate, 1,136 ± 187), sodium azide (Sigma) for TA100 − S9 (10 μg per plate: revertants per plate, 1,252 ± 166), and 2-aminofluorene (Sigma) for both strains with S9 (10 μg per plate: revertants per plate, 1,622 ± 279 for TA98 + S9 and 968 ± 146 for TA100 + S9). DMSO was also tested for negative controls (100 μL per plate; TA98 − S9, revertants per plate, 9.6 ± 1.5; TA100 − S9, revertants per plate, 30.2 ± 6.4; TA98 + S9, revertants per plate, 14.2 ± 3.7; and TA100 + S9, revertants per plate, 40.1 ± 9.6). The mean values from triplicate tests are expressed as mutagenicity ratios. A ratio is generally considered to be positive when either two consecutive dosages or the highest nontoxic dose generates a response that is at least double the amount of the solvent control and at least two consecutive doses.
The Microtox test involved an SDI Model 500 analyzer and lyophilized cultures of Vibrio fischeri NRRL-B-11177 (Bioresource Collection and Research Center, Hsinchu, Taiwan). The Microtox acute toxicity sensor measured changes in natural bioluminescence that were caused by V. fischeri. The inhibition of bacterial light emissions was monitored in duplicate experiments at 15°C, following exposure for 15, 30, and 60 min. The solutions of the extract, at five concentrations in a geometric sequence that had been exchanged with Milli-Q water, were analyzed. Dilution was begun using a 100x concentration factor by diluting 0.5 mL extract with an equal volume of the bacterial suspension. Toxicity of sample was expressed in terms of EC50, indicative of the percentage of sample required to reduce the light output by 50%. EC50 and 95% confidence intervals (CIs) were calculated using the REGTOX software application for Microsoft Excel (Vindimian, 2005). In the experiment, three EC50 values were calculated after 15, 30, and 60 min and were denoted as the 15-min EC50, 30-min EC50, and 60-min EC50, respectively.
Chemical analysis
NOD was analyzed by HPLC with a gradient mixer pump and a high-resolution triple quadrupole mass detector (Ultima, Micromass, United Kingdom). It was quantified against a reference standard (Gibbstown, extract from Nodularia, purity 96%). The samples were concentrated using solvent-water evaporator systems (ASE 100; Dionex, CA) before being analyzed by HPLC-MS using a Symmetry C18 column (3.9 × 150 mm). The injection volume was 10 μL, and the flow rate of the mobile phase was 0.8 mL/min. The mobile phase was a mixture of Milli-Q water, trifluoroacetic acid (0.05%, v/v), and acetonitrile. The mass spectra were recorded simultaneously using Micromass Quattro Ultima mass spectrometer in positive ion mode. The capillary voltage was set to 3 kV, and the cone voltage was set to 90 V. The desolvation gas (nitrogen) temperature and flow rate were set to 200°C and 600 L/h, respectively. The ion source temperature was set to 90°C. The mass spectra data were obtained in the positive ion model by full scanning from m/z 150 to 2,000 (Fig. 4). A transition in the molecular weight from m/z = 824.4 (M + H)+ to 255.2 was used to determine NOD concentration. The method detection limit (MDL) of LC-MS was 0.15 μg/L using an injection volume of 10 μL.

LC-MS mass spectrum of NOD.
An electron paramagnetic resonance (EPR) experiment was performed to identify the radicals that are formed in the catalytic ozonation processes (Labaki et al., 2012; Davies, 2016). An EPR spectrum was obtained in situ using a Bruker EXM-10 (Hanau, Germany) spectrometer in the X-band mode. Ag-TiO2/DM samples were then suspended in ozonated water and placed in thin-walled quartz tubes (ID 3 mm; L 150 mm) to generate cylindrical samples of identical dimensions. Next, EPR spectra of the Ag-TiO2/DM samples were recorded using a modulation amplitude of 0.25 mT and a microwave power of 20.02 mW. Typical values of receiver gain ranged from 8.9 × 10⁴ to 5.6 × 10⁵. In addition, EPR spin trapping experiments were conducted at 293°K, using 5,5-dimethyl-1-pyrroline-N-oxide (DMPO) (Aldrich, MO). The EPR spectrometer parameters in the spin-trapping experiments were as follows; center field of 3, 457 G, sweep width of 20 G, modulation amplitude of 0.4 G, scanning time of 5.0 s, microwave frequency of 9.7 GHz, and a microwave power of 10.0 mW.
Results and Discussion
Kinetics of NOD degradation
Ozone degradation of NOD found in Fig. 5 presents the degradation of NOD (Co = 2 mg/L) with various concentrations of the Ag-TiO2 catalyst, 0, 50, 100, 250, and 500 mg/L, in a semibatch system. At the maximum Ag-TiO2 (500 mg/L) concentration, NOD decayed rapidly for 5 min, and then less rapidly. The high concentrations of NOD and oxidants (O3 and radicals) were primarily responsible for the initial high reaction rate. About 98.5% of NOD was removed at pH 7, revealing that Ag-TiO2 significantly increased the extent of degradation of NOD. The results of Fig. 5 also displayed that NOD degradation behavior was varied as a function of different Ag-TiO2 concentration. The increase in Ag-TiO2 concentration from 50 to 500 mg/L will also lead to the increase of the NOD degradation rate.
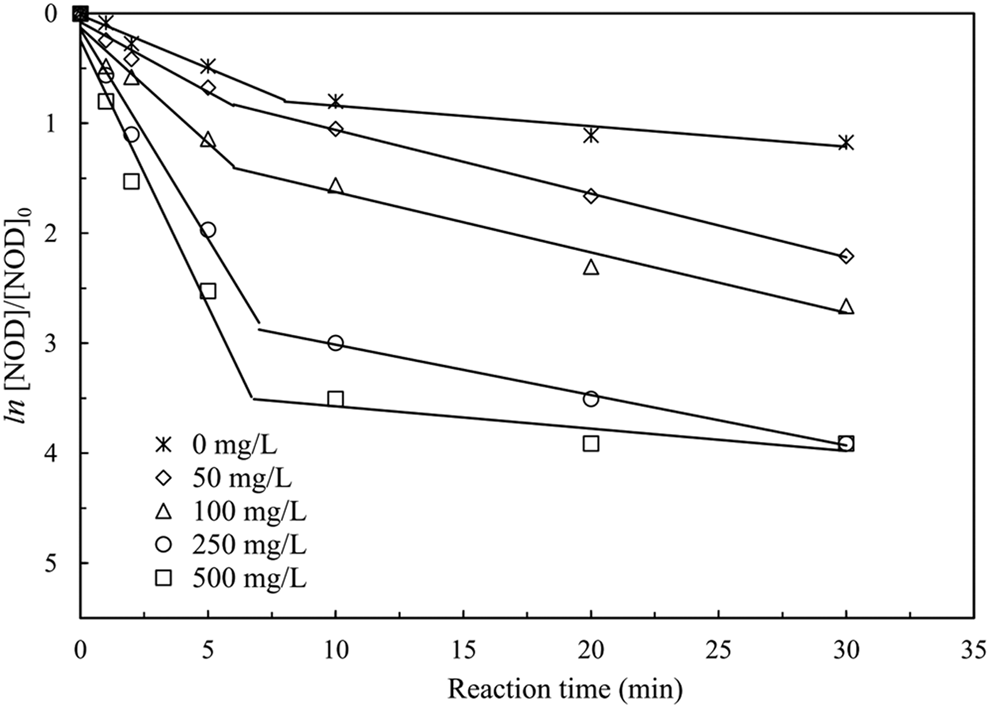
Dimensionless NOD degradation curves in the first-order kinetic at various Ag-TiO2 dosages. Conditions: pH = 7.0; Initial concentration of NOD = 2.0 mg/L.
In the Ag-TiO2 catalyzed ozonation system, a two-step NOD degradation behavior was observed. Initial catalyst dosage in solution has an impact on the rate of NOD degradation. It is suggested that this rapid NOD concentration drop during the first 5 min of reaction is due to the catalyst provided favorable activated sites for ozone conversion to radicals (Jung and Choi, 2006). Subsequently, slow ozone decomposition followed, which lasts at least 30 min. This suggests that a two-stage NOD degradation approach more closely simulated experimental data. The rate constant for the reaction of O3 with NOD was investigated under pseudo-first-order conditions. Previous investigations on ozonation of cylindrospermopsin (CYN) over a wide pH range have demonstrated that the reaction between O3 and CYN could be described by second-order kinetics, first-order in active oxidant (O3+OH•), and first-order in CYN (Wu et al., 2015). Based on these studies, it can be assumed that the reaction of O3 with NOD follows second-order kinetics:
where k is rate constant for the degradation of NOD by Ox; [Ox] is the total concentration of oxidant species (O3+OH•). Under experimental conditions with ozone in large excess, the reaction rate can be assumed to be pseudo first order when ozone concentration is constant during reaction. Then, the expression of the rate of NOD degradation becomes
where k
app
= k[Ox], the apparent first-order kinetic constant. This expression can be integrated as follows:
The semilogarithmic plots of NOD residual concentrations versus time (t = 0–5 min) are satisfactorily linear (R2 > 0.947) in all experiments, which satisfied the assumed pseudo-first-order law. The presence of catalyst accelerates NOD k app (8.07 × 10⁻³/s) in the presence of 500 mg/L Ag-TiO2.
Moreover, the pilot test was applied to predict the degradation of NOD in natural water by ozone and ozone combined catalyst in dynamic time-resolved experiments. For that, in addition to the rate constants, the decrease of ozone in the water must be known. With the experimental ozone concentrations, the ozone exposure (CT value), defined as the integral of ozone concentration over the reaction time, can be determined by the following equation:
Then, with the CT value and the rate constants, the concentration of NOD can be calculated from Eq. (2)
where [NOD] in the final concentration of nodularin, [NOD]0 is the initial concentration of nodularin, and k app is the apparent second-order rate constant for the ozonation of nodularin. Following this procedure, the degradation of NOD during the oxidation experiments was calculated. The results are included in Fig. 6. Good agreement between the experimental and predicted values was observed, which validates our kinetic model. Therefore, this kinetic model can be applied to predict the degradation of other toxins during ozonation or catalytic ozonation application to drinking water production, if the rate constants for its reactions with the toxins are known.
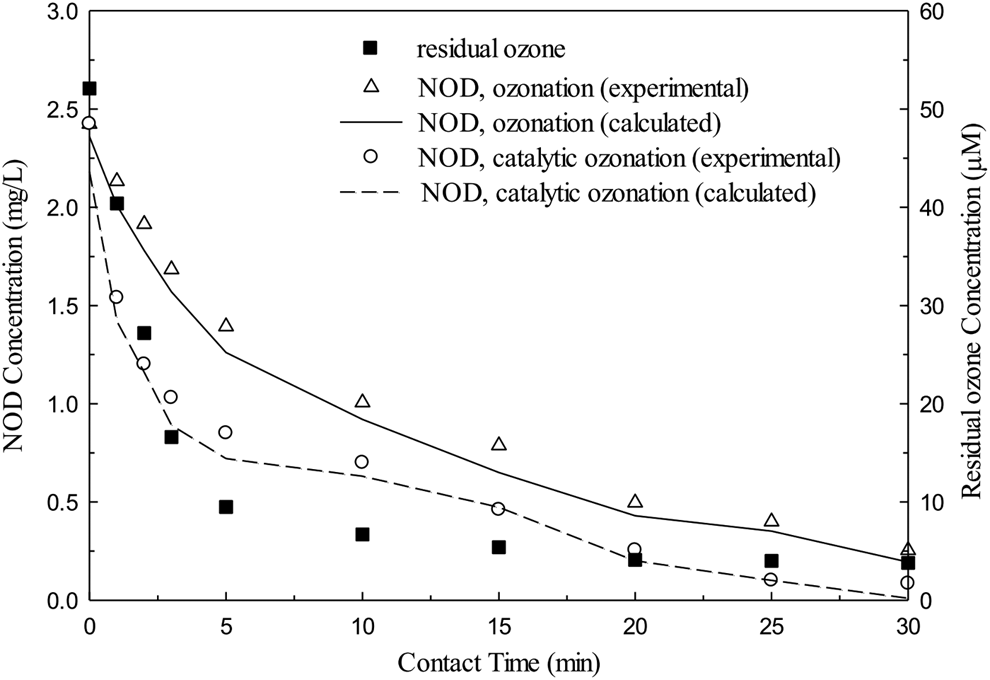
Degradation curves of NOD during the ozonation experiments and kinetic modelpredicted values. Conditions: pH = 7.0; Initial concentration of NOD = 2.0 mg/L; Ozone dosage = 2.5 mg/L.
Moreover, oxidation during catalytic ozonation involves reactions of molecular ozone and hydroxyl radicals, the latter of which can be formed from ozone decomposition and reaction with toxin, and is known to predominate at conditions that favor ozone decay. However, the knowledge of the OH radical concentration evolution with reaction time presented more problems, since there is no method for the direct measurement of the concentration of these species. This investigation uses the method for the direct detection of paramagnetic species to demonstrate the OH• production during catalytic ozonation. In this study, catalytically generated paramagnetic radicals were detected using EPR. The short-lived reactive radical intermediates (Ra•), denoted collectively as Ra•, were trapped by the spin-trapped agent, DMPO, to form adducts (DMPO-Ra•) with higher stability. Figure 7 shows the EPR spectra of radical intermediates in the noncatalytic and Ag-TiO2 catalytic ozonation processes, respectively. The noncatalytic ozonation system yielded an EPR signal with four lines at an intensity ratio of 1:2:2:1, corresponding to the DMPO-OH• adduct. When the Ag-TiO2 catalyzed reaction was carried out in a solution of O3, a strong EPR spectrum of the DMPO-OH• adduct (indicated by asterisks) was obtained (Fig. 7, spectrum (d)). The above results demonstrate that the use of Ag-TiO2 to catalyze ozonation increased the amount of OH• radicals that were formed. Comparing these results to those in the literature (Kasprzyk-Hordern et al., 2003; Chen et al., 2011; Yang et al., 2014) reveals that, in this investigation, the O• radicals formed on the surface of the ozonated catalyst. This observation is related to the increase in the concentration of the catalyst, which is the only species that can promote the decomposition of ozone and the generation of radicals in this process. Therefore, the catalytic activity of Ag-TiO2 contributed only slightly to the formation of OH•.

EPR spectra of
Toxic and mutagenic activities of NOD
Catalytic ozonation with Ag-TiO2 catalyst is an efficient method of oxidation, which reduces the toxic and mutagenic activities of NOD. Table 2 show the Ames test data regarding the revertant bacterium number in case of TA-98 and TA-100 tester strains, with and without activation after oxidation with catalytic ozonated water sample concentrates. The results demonstrate that NOD exhibits positive mutagenic activity in the Salmonella/microsome assay with the strains TA98 and TA100. However, based on the mutagenic activity of NOD during the oxidation processes, catalytic ozonation can either increase or reduce the toxic response of test samples. The Ag-TiO2 dosage and the reaction time greatly affect the mutagenic effects of samples, and may result in the formation of by-products that may change the mutagenic properties of NOD.
Mutagenicity ratio = (revertants for samples)/(revertants for blank control).
Test strains without S9.
Test strains with S9.
Data are the mean of triplicate plates.
The 15-, 30-, and 60-min EC50 of the ozonation of NOD samples, based on Microtox test, are listed in Table 3. The results reveal that the original NOD was very toxic to V. fischeri bacteria. Catalytic ozonation of NOD using a large dose of Ag-TiO2 greatly reduced its toxicity. Consistent with the results of the above Ames test (Table 2), the toxicity of catalytic ozonated samples depended mainly on Ag-TiO2 dosage. NOD that was catalytically oxidized using 0.5 mg O3/L exhibited reduced toxicity at high catalyst dosages, whereas an Ag-TiO2 blank and the use of a lower Ag-TiO2 dosage (100 mg/L) slightly increased toxicity. The 15-min EC50 value of the original NOD was 67 μg/L, which was reduced around 62 μg/L following catalytic ozonation with 50 mg Ag-TiO2/L for 30 min. Increasing the catalyst dosage to over 250 mg/L weakened the toxic response of bacteria for short periods (<3 min). The results suggest that the conditions of catalytic ozonation strongly influenced the mutagenic properties of NOD. In this study, catalytic ozonation was found effectively to degrade aqueous NOD, whereas reducing the TiO2 dosage increased the toxicity of the treated samples for short periods by forming intermediate by-products in the initial stage of ozonation (data not shown). The toxicity of the oxidation by-products must be evaluated in the same manner as those in other drinking water oxidation or disinfection processes, such as advanced oxidation process or photocatalysis (Mazur-Marzec et al., 2006; Onstad et al., 2007; Pantelić et al., 2013). Also, prolonged catalytic ozonation stabilized toxic responses to yield EC50 values that exceeded the corresponding values that were achieved using the original NOD.
Mean of three replicates.
95% confidence interval.
Conclusions
This investigation demonstrates that Ag-TiO2 accelerates ozone decomposition, leading to the production of hydroxyl radicals, ultimately accelerating the oxidation of toxic micropollutants. The catalytic ozonation of a toxin with ozone can be modeled as second order in both reactants, and as pseudo first order in either the ozone or the toxin concentration. At an initial NOD toxin concentration of 2.0 mg/L, 3.1–3.8 mg-O3/L, and a solution pH of 7, the overall reaction rate constant (Koverall) varied from 9.65 × 10⁻⁴ to 8.07 × 10⁻³/s with the Ag-TiO2 dosage from 0 to 500 mg/L. Furthermore, in dynamic time-resolved experiments, a kinetic model of catalytic ozonation was successfully applied to predict and confirm toxin oxidation with an ozone consumption curve.
Toxicity of the test samples demonstrated that catalytic ozonation may significantly reduce the toxic potential of NOD toxin under suitable conditions. Notably, as the mechanism of the toxin has not been thoroughly understood, further research should more thoroughly elucidate the oxidation of NOD. The toxicity of oxidation by-products must be assessed in the same manner as those in other water oxidation or disinfection processes, such as advanced ozonation or chlorination.
Footnotes
Acknowledgments
The authors would like to thank the Ministry of Science and Technology of the ROC, Taiwan, for financially supporting this research under Contract No. MOST105-2632-E-241-001. Ted Knoy is appreciated for his editorial assistance.
Author Disclosure Statement
No competing financial interests exist.