




Abstract
Abstract
Dredging efficacy in reducing polychlorinated biphenyl (PCB) sediment contamination in the Lower Fox River, Wisconsin, was assessed by comparing predredging and postdredging concentration profiles from portions of Operable Unit (OU) 3 and OU4. Sediment PCB concentrations (in 0.15 m depth intervals) from predredging and postdredging core locations were compared. Results show that dredging reduced PCB concentrations in the surface sediment layer (0 to 0.15 m) in 77% of the locations. At locations where surface layer PCB concentrations were lower than predredging sediments, concentrations were reduced by an average of 72%. Average PCB concentration in the surface layer of all postdredging cores was 1.86 ppm compared to 0.61 ppm in the second (0.15 to 0.30 m) layer. The difference (significant at the p = 0.006 level) suggests that residual sediments were present in the postdredging surface layer. Dredging reduced the maximum PCB concentration in sediment cores at all locations except the 2% where the maximum predredging PCB concentration in the sediment profile was less than 1.5 ppm. Dredging reduced the maximum PCB concentration in the sediment profile by 84% on average (significance level of p = 0.008).
Introduction
T
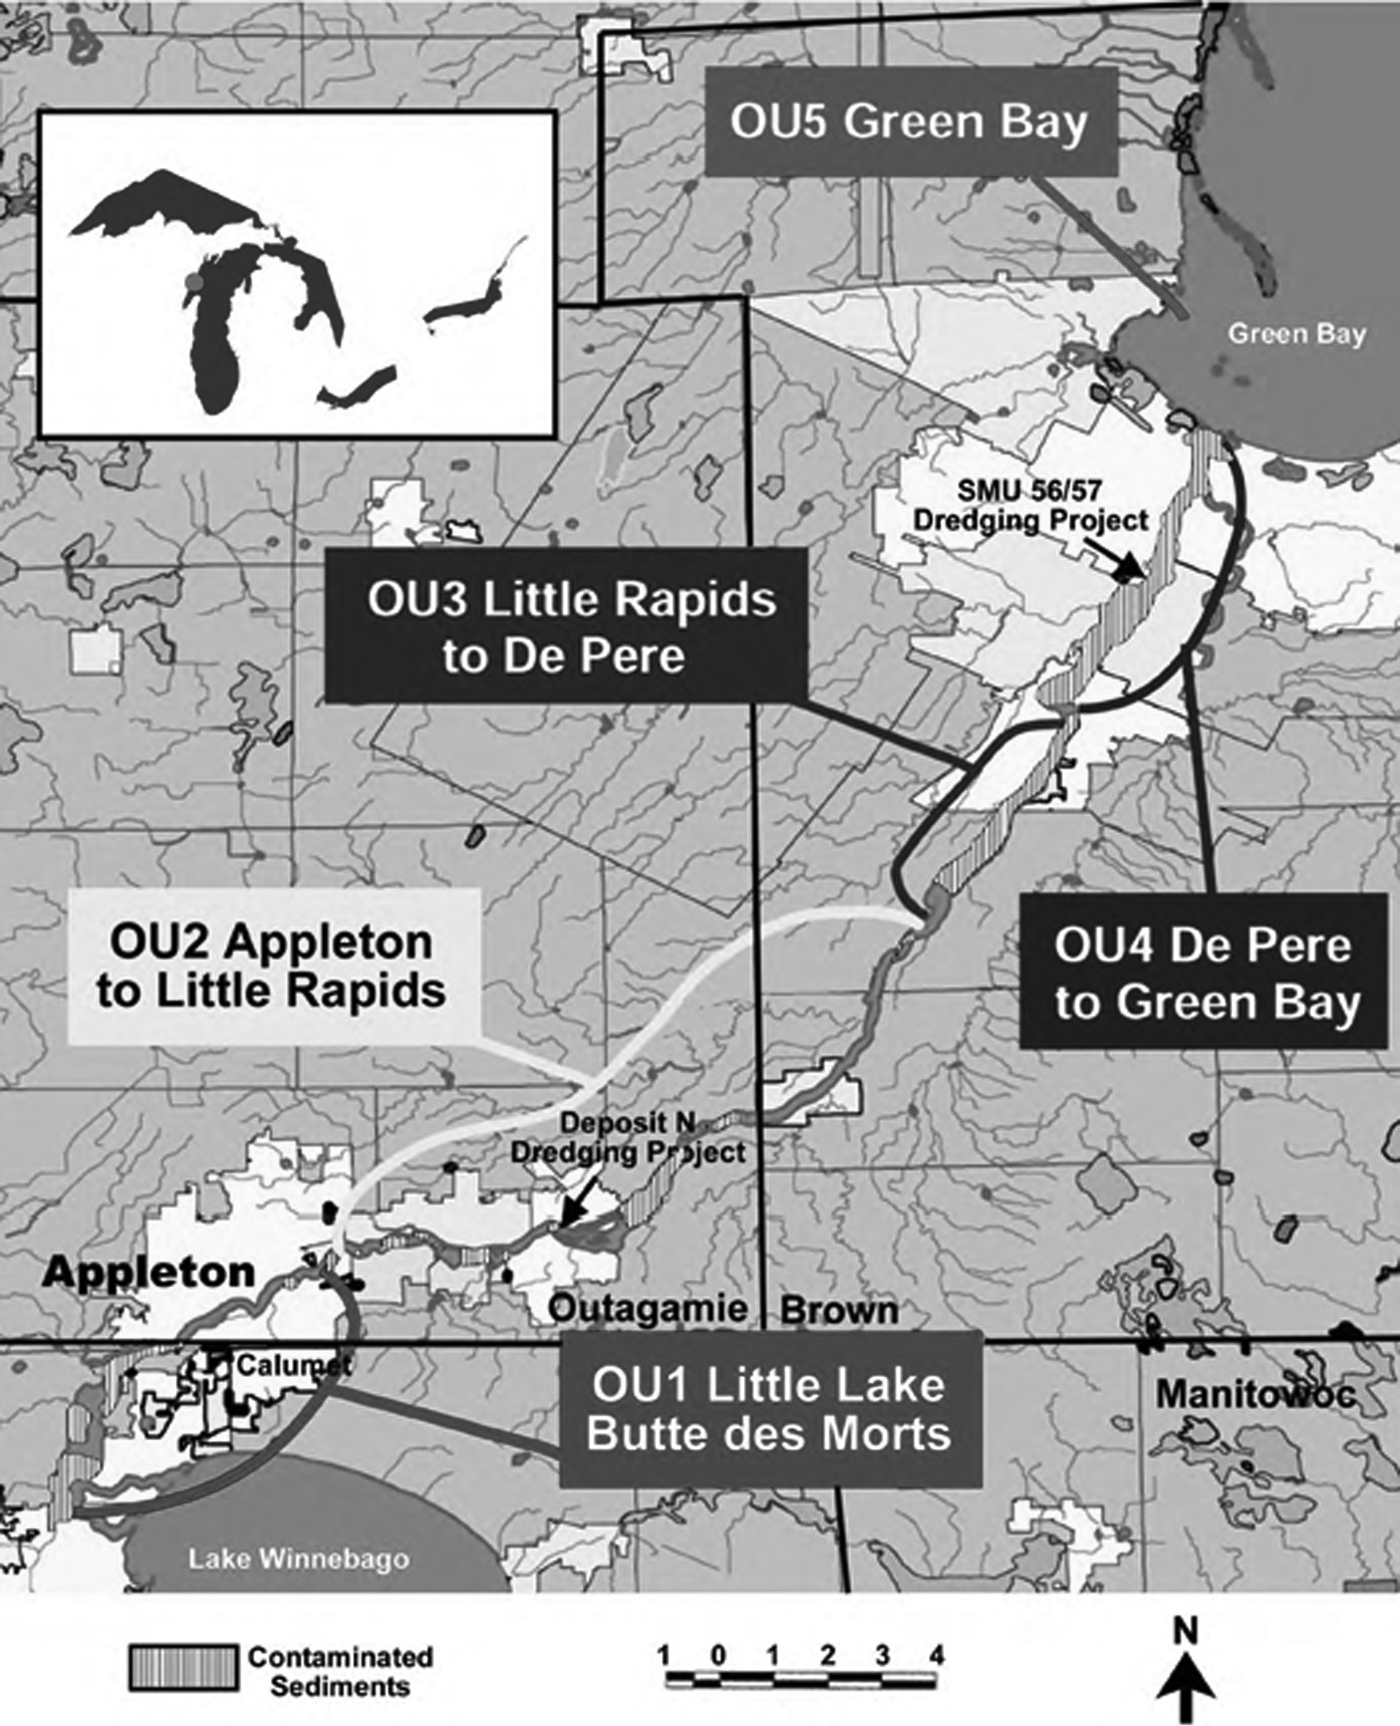
Lower Fox River basin, PCB-contaminated sediments and operable units. PCB, polychlorinated biphenyl.
PCBs were discovered in LFR and Green Bay sediments in the 1970s (Shaw Environmental, Inc. and Anchor Environmental, L.L.C., 2006). The U.S. EPA (2016) estimated that 14 million cubic yards of sediments in the LFR and Green Bay were contaminated by PCBs. Wildlife researchers have detected PCBs in various bird species and fish in the LFR (Radatz, 2004). The Record of Decision (ROD) provided a description of risks to environment and human health in 2007, caused by PCB contamination at LFR, and the conclusion suggested that the main contaminant of concern (PCB) at the site puts human health and ecological receptors at risk in all operable units (OUs) (U.S. EPA and WDNR, 2007).
Exposure pathways that put human health at risk are inhalation of PCB particles through air, skin contact with PCB contaminated surface water and sediment, and fish consumption. Fish consumption poses the highest risks to human health (U.S. EPA and WDNR, 2003; U.S. EPA and WDNR, 2007). The 2007 ROD (U.S. EPA and WDNR, 2007) for OUs 3, 4, and 5, which include part of the LFR and Green Bay, identified 3.32 million cubic yards of sediment for removal from OU3 and OU4. This volume contains about 13,700 kg of PCB that would be removed of the 21,400 kg of PCB estimated to be in the system (U.S. EPA and WDNR, 2007). The ROD identified five remedial action objectives (RAOs): (1) practicable surface water quality improvement throughout the LFR and Green Bay, (2) protect humans who consume fish from exposure to contaminants that exceed standard levels; (3) protect ecological receptors from exposure to contaminants above standard levels; (4) reduce transport of PCBs from LFR into Green Bay and Lake Michigan, and (5) limit the downstream PCB movement during the remedy implementation (U.S. EPA and WDNR, 2007). To achieve these RAOs, the U.S. EPA and Wisconsin Department of Natural Resources (WDNR) organized the Lower Fox River Superfund Site into five OUs based on similar sediment features, hydraulic characteristics, and other environmental conditions (Tetra Tech et al., 2012).
The ROD identified specific remedial actions for PCB-contaminated sediments and established a 1 ppm PCB concentration cleanup criterion to meet the project goals. The ROD established a cleanup standard of 1 ppm PCB in sediment as higher levels do not provide protection of human health and the environment. According to ROD, surface-weighted area concentration (SWAC) levels of 0.28 and 0.25 ppm PCB for OU3 and 4, respectively, would be achieved if all sediments above 1.0 ppm are removed or covered by caps and sand covers. Additional time (10–20 years) will be required before PCB concentration in fish tissues would reach safe consumption levels for high-intake consumers (U.S. EPA and WDNR, 2007; U.S. EPA, 2018). An Administrative Order on Consent (AOC) for OU3 and 4 was executed by the Fort James Operating Company, Inc. and NCR Corporation in cooperation with the WDNR and the U.S. Environmental Protection Agency (Shaw Environmental, Inc. and Anchor Environmental, L.L.C., 2006).
This research evaluates the success of dredging to reduce sediment PCB concentrations in portions of OUs 3 and 4 of the LFR. Postdredging PCB concentrations were compared to the nearest predredging sediment cores within the same dredge unit to determine the success of dredging actions in reducing sediment PCB concentrations. OU3 extends from Little Rapids Dam to the De Pere Dam at river mile 7.1. The predominant land use along OU3 is agricultural and residential. This reach of the LFR has a relatively steep gradient and many areas have sand, gravel, and rock beds. However, a number of areas have shallower gradients and pools, which are the primary areas included in the ROD. Targeted OU3 sediments had a dry density of 510 kg/m3 (moisture content of 158%) and contained 45% sand and gravel and 55% silt and clay. (Shaw Environmental, Inc. and Anchor Environmental, L.L.C., 2006).
OU4 extends from De Pere Dam through the city of Green Bay, to the confluence with Green Bay. The area around OU4 is highly urbanized, including the City of Green Bay. Land uses include residential, industrial, commercial, and agricultural. OU4 has a much flatter slope than upstream reaches of the LFR and contains a Federal Navigation Channel, although the channel is no longer maintained in the upper reaches of OU4. In this OU, the river bottom contains more soft sediment and much less gravel and rock than OU3. Targeted OU4 sediments had a dry density of 568 kg/m3 (moisture content of 138%) and with an average of 50% sand and gravel and 50% silt and clay. (Shaw Environmental, Inc. and Anchor Environmental, L.L.C., 2006). OU4 sediment samples used in this study were from the most upstream reaches.
Background
Contaminated sediments pose potential risks to human health and the environment in many water bodies. The problem has received growing attention in recent years with a primary focus of reducing contaminant concentrations in fish and other aquatic species. Dredging is commonly used to remove contaminated sediments; capping and monitored natural recovery are other remedial technologies frequently used to manage contaminated sediments. While dredging can remove contaminated sediments from the system, studies have shown that some contamination remains after dredging, referred to as residual sediments, which can potentially mitigate the desired reduction in risk (Bridges et al., 2010). Uncertainty associated with estimating the nature and extent of postdredging residual contamination is a significant limitation to predicting the effectiveness of environmental dredging.
The nature and extent of postdredging sediment residuals are related to multiple environmental factors such as sediment geotechnical and geophysical characteristics, the variability of contaminant distributions, and physical site conditions. Dredging equipment and operation can also affect residual sediment generation; dredge type, size, overdredge allowance, dredge cut slopes, positioning accuracy, and operator experience have been cited as important factors (Bridges et al., 2008; Palermo et al., 2008; Fuglevand and Webb, 2009).
Patmont et al. (2018) synthesized currently available residual sediment data and the limited number of studies conducted on the subject. They applied a mass balance approach to the data to quantify the amount of postdredging residual sediment data. The results were combined with sediment density data to generate an empirical equation for estimating the mass of residual sediments (as a% of total mass) based upon the density of sediment within the dredging prism. This article analyzes residual contaminant concentrations, rather than volume or mass of sediment, as a measure of environmental dredging effectiveness.
Data source
This study analyzes predredging samples collected between 2004 and 2008 and postdredging samples collected between 2009 and 2011 summarized in annual remedial action summary reports (Tetra Tech, 2011, 2012a, 2012b). These reports summarize predredging samples collected to determine the extent of the PCB contamination and define the dredge prism for remedial activities. Predredging sediment cores used for analysis in this study extended 2.4 m below the sediment surface, while the postdredging samples extended to only 0.30 m under the premise that the majority of contaminated sediment had been removed by dredging. Sediment samples were collected from cores at 0.15 m intervals except for surface sediment samples, which were collected from grab samples. PCB concentrations in samples were analyzed using the Fox River Method to maintain the comparability of existing and historical data. The Fox River method is a site-specific laboratory procedure by Ann Arbor Technical Services. It is a four-step method, including particle size reduction, extraction (Soxtherm), extract cleanup, and gas chromatography analysis (Shaw Environmental, Inc. and Anchor Environmental, L.L.C., 2006).
Remedial approach
Swinging ladder hydraulic dredges were used to remove sediments within the design dredging prism. The design dredging depth in each area was set to the sediment elevation where PCB concentrations dropped below 1 ppm plus a 15.24 cm (0.5 ft.) overdepth. The overdepth accounted for dredging equipment accuracy and provided tolerance to ensure all contaminated sediments are removed. (Shaw Environmental, Inc. and Anchor Environmental, L.L.C., 2006). The allowable overdepth was not included in the dredging volume estimates in the ROD.
Currently available dredging equipment has been shown to leave behind a small amount of the targeted contaminated sediment (Bridges et al., 2008). “Generated residuals” refers to dislodged sediment not captured by the dredging process. Generated residuals typically have similar chemical characteristics as the targeted sediments, but are typically unconsolidated with a lower bulk density. High constituent concentrations in residual sediments can jeopardize the effectiveness of the remedial operation. Sand cover or engineered caps were combined with dredging in some areas of the LFR to reach the desired postdredging sediment PCB concentrations. Those areas are not included in this study.
PCB (SWAC) based on postdredging samples of the 0.15 m surface sediment layer is used to determine if dredging achieved the target PCB concentrations. Nontargeted areas already have surface PCB concentrations of 1 ppm or lower. Achieving surface sediment PCB concentrations lower than 1 ppm in each dredging area would ensure that the SWACs over the entire OU achieved the project goals (Tetra Tech et al., 2012). If surface sediment PCB concentrations exceeded the 1 ppm target, additional dredging, placement of a sand cover, or placement of a residual cap was used to achieve the target SWAC (Tetra Tech et al., 2012).
Methods
Location, depth, and PCB concentrations for sediment samples from 556 predredging and 450 postdredging sediment cores from OU3 and OU4 were used in this study. Point shapefiles of dredging coordinates and dredge units were made using ArcMap 10.2. Raster data were aligned with spatial data using georeferencing in ArcMap to determine whether the postdredging and predredging core coordinates were in the same dredge unit. The distances between each postdredging core and nearby predredging cores within the same dredge unit were calculated using the northing and easting coordinates of the core locations. Predredging and postdredging core locations closest in proximity were identified using ArcInfo versions of ArcCatalog 10.2 and Arc Map 10.2 (ESRI, Redlands, CA). In cases where there were more than one postdredge core sample in a postdredge unit, only the postdredge cores closest in distance to a predredge core were selected for comparison. Ultimately, only 124 pairs of predredging and postdredging core locations within the same dredge unit, 104 in OU3 and 20 in OU4, were determined to be sufficiently close to assess dredging effectiveness. Figure 2 shows the proximity of those predredging and postdredging core pairs. Except for a few, the cores were within 60 m; over 50% were within 30 m. The surface area of dredged units used to match locations of predredge and postdredge cores was in the range of 0.024 to 2.8 hectares. PCB measurements from 15 cm sections of sliced sediment cores of predredging and postdredging were used for analyses in this study.
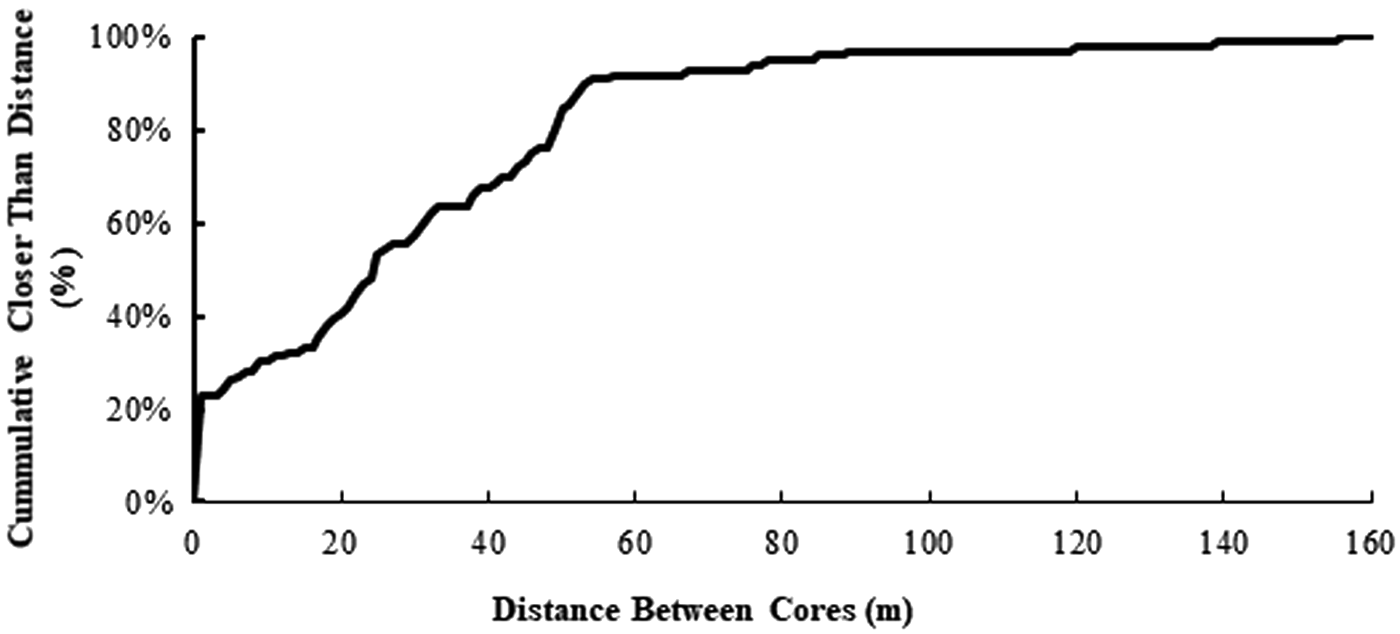
Cumulative probability distribution of distance between predredging and postdredging sediment cores compared.
Results and Discussion
Table 1 shows PCB concentrations with depth in the top 1.20 m of the predredging cores; results from 619 samples are summarized in Table 1. Out of 124 predredging sediment cores used in this study, 12 contained samples below 1.20 m (to a depth of 2.4 m). Data from the 38 samples below 1.20 m are not included in Table 1.
Polychlorinated Biphenyl Concentrations in Top 1.20 m of 124 Predredging Sediment Cores from OU3 and OU4 Used in This Study
OU, Operable Unit; PCB, polychlorinated biphenyl.
The table shows that PCB concentrations exceeded 1 ppm in 263 samples (43% of all samples within 1.20 m) between the sediment surface and a depth of 0.45 m. In contrast, PCB concentrations exceeded 1 ppm in only 58 of samples (9%) below 0.45 m. PCB concentrations were highest in the second layer and tend to decrease with depth below that layer (Fig. 3). Median concentrations in every layer were lower than the average concentrations, suggesting that the majority of samples were less than the mean and the average is skewed by a few high concentrations.
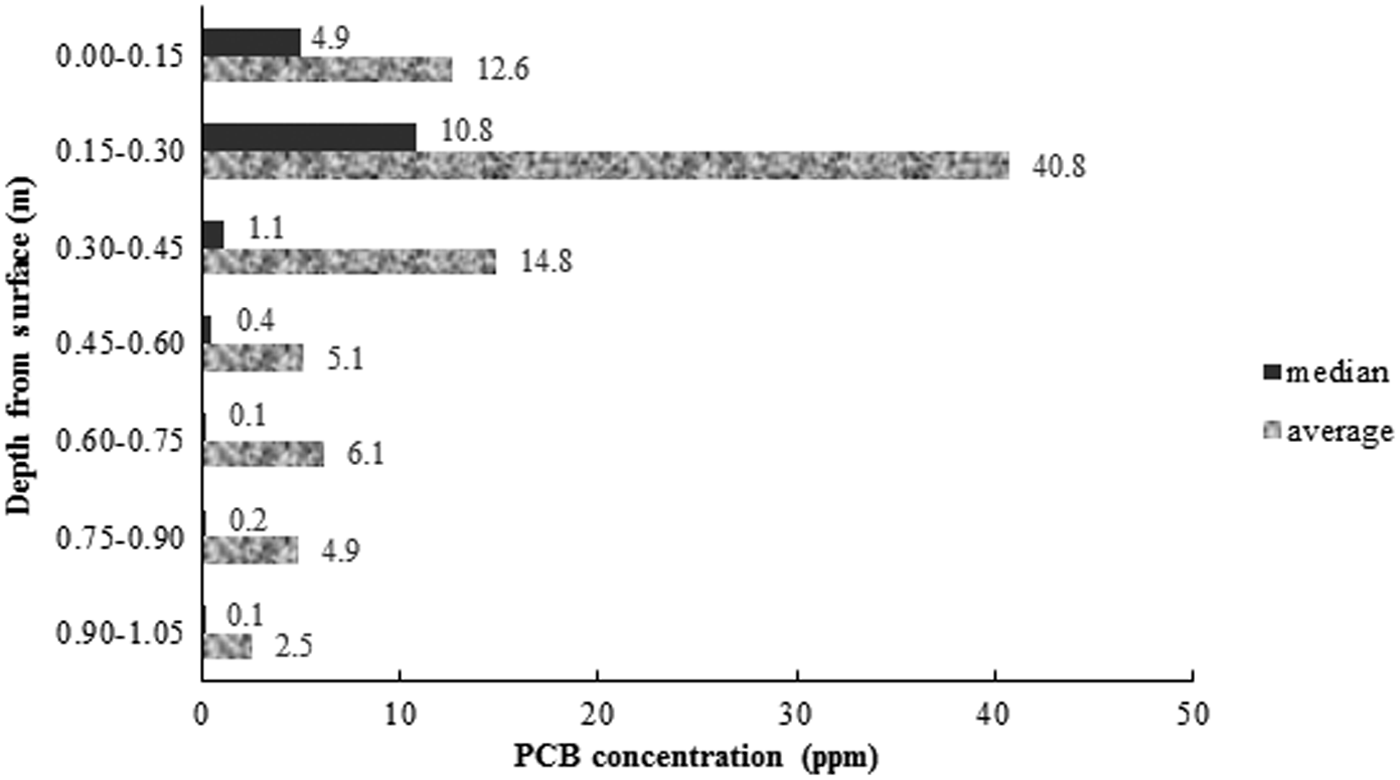
Predredging average and median vertical sediment PCB concentrations.
Since the dredging prism was designed to target the 1 ppm sediment layer, and postdredging surveys ensured the target elevations were met, postdredging PCB concentrations should theoretically be less than 1 ppm. Table 2 shows postdredging sediment PCB concentrations (ppm) in the upper two postdredging sediment layers (only two were collected). These data show that only 23% of the postdredging surface layer samples met this criterion (i.e., PCB concentration ≤1 ppm). The PCB concentration exceeded 1 ppm in the remaining 77% of the postdredging cores. Postdredging PCB concentrations in the surface layer (0.0 to 0.15 m) averaged 1.86 ppm with a median of 1.42 ppm, indicating that the average is skewed by a few high concentrations. Postdredging surface layer PCB concentrations exceeded 3 ppm in only 11% of the cores. No station had PCB concentrations above 10 ppm in the surface layer.
Postdredging Polychlorinated Biphenyl Concentration Distribution in OU3 and OU4
Based on 124 paired sediment core locations used in this study; column totals may not equal 100% due to rounding.
Predredging PCB concentrations in the surface sediment (0.0 to 0.15 m) ranged from 0.1 to 350 ppm with a mean of 12.6 ppm (standard deviation = 34.2 ppm). Postdredging PCB concentrations in the surface sediment layer ranged from 0.3 to 6.2 ppm with a mean of 1.86 ppm (standard deviation = 1.2 ppm). Since targeted dredging elevations were a depth where sediment PCB concentrations were 1 ppm or less, surface layer PCB concentrations greater than 1 ppm represent either variations in sediment concentrations or residual sediments from the dredged layer. A few cores showed significantly higher concentrations in both the surface layer and below. These could be undredged inventory resulting from inaccurate characterization or variations in sediment PCB concentrations over a short distance due to natural or anthropogenic features.
The sediment layer below the postdredging surface (0.15 to 0.30 m) had an average PCB concentration of 0.7 ppm with a median of 0.3 ppm. These are both less than the surface layer. Eighty-two percent of the postdredging cores had PCB concentrations equal to or less than 1 ppm in the second layer. Only 18% of the postdredging cores had concentrations greater than 1 ppm in the 15–30 cm layer, compared to 77% in the surface layer. These lower concentrations in the second layer are also consistent with the presence of residual sediments in the surface layer.
Figure 4 compares predredging and postdredging sediment PCB concentrations in the surface sediment layer. The match line represents no change between predredging and postdredging surface layer PCB concentrations. A paired-sample T-test using SPSS software showed that the means of the populations are significantly different (p = 0.006). The average predredging surface sediment PCB concentration was 12.6 ppm, while the postdredging surface sediment PCB concentration was 1.86 ppm. This represents a 72% reduction in surface PCB concentrations. Twenty-three percent of the cores had higher surface sediment PCB concentrations after dredging than before. However, the predredging surface sediment PCB concentrations at these stations were all less than 1.5 ppm, which indicates that dredging is less effective in reducing PCB concentrations when predredging concentrations are already low. Although the predredging and postdredging locations were paired in this study based upon spatial proximity, they were not coincidental. Thus, not all the concentration differences can be attributed to dredging, especially those in the low concentration range.
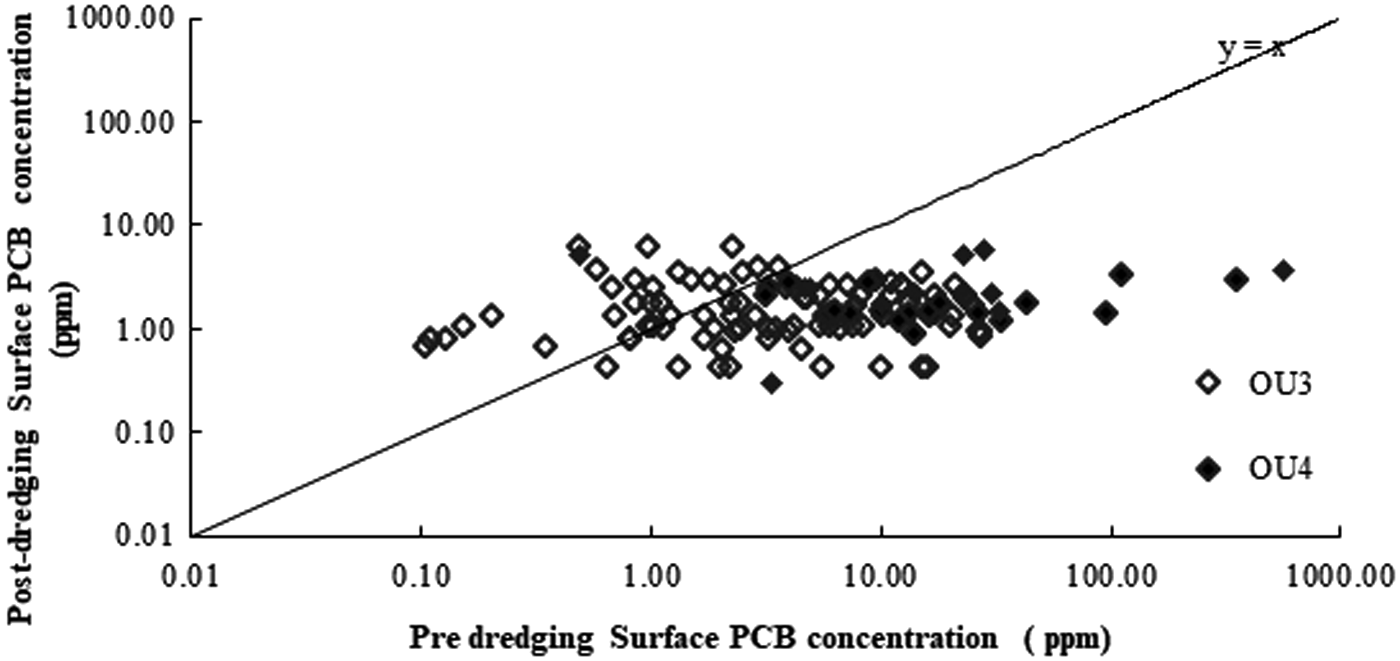
Comparison of predredging and postdredging surface sediment PCB concentrations.
Figure 5 compares predredging and postdredging maximum PCB concentrations in LFR sediments before and after remedial dredging. The match line represents no change between predredging and postdredging maximum PCB concentrations. Two cores had similar predredging and postdredging maximum PCB concentrations; a third had a slightly higher postdredging maximum PCB concentration (1.8 ppm compared to 1.1 ppm). All had predredging maximum sediment PCB concentrations near 1 ppm. Postdredging maximum surface sediment PCB concentrations were only weakly related to predredging maximum PCB concentrations. SPSS software was used for paired-sample T-tests to compare the means of predredging and postdredging maximum PCB concentrations. These showed that dredging reduced predredging maximum surface sediment PCB concentrations by 84% on average with a p-value of 0.008. This p-value indicates that the means of the two data sets are significantly different, that is, the mean postdredging maximum PCB concentration is significantly lower than the mean predredging maximum PCB concentration. Although the maximum postdredging surface sediment PCB concentrations are lower than maximum predredging PCB concentrations at a statistically significant level, only 25% of the cores had maximum postdredging PCB concentrations lower than the target concentration of 1 ppm. Thirty-eight percent of the stations had PCB maximum postdredging concentrations in 1–2 ppm range and 28% of the stations in the 2–3 ppm range. Nine percent of the stations had maximum postdredging PCB concentrations >3 ppm.
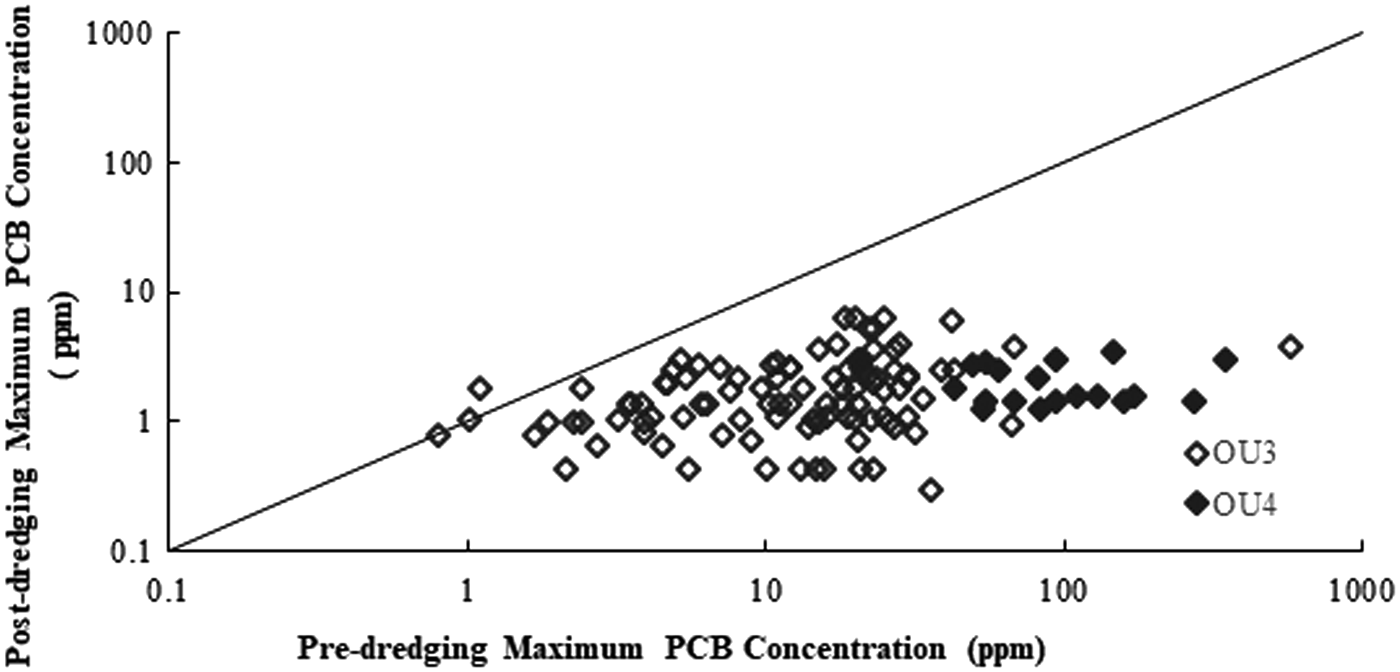
Comparison of predredging and postdredging maximum PCB concentrations.
Closer inspection of the surface PCB concentration data shown in Fig. 4 shows that postdredging surface sediment PCB concentrations were not strongly related to predredging concentrations of the sediment core.
Statistical analysis showed no correlation (r2 = 0.02) between postdredging PCB concentrations in the surface layer and the distance between the predredging layer with maximum PCB concentration and the sediment removal level. The minimum, maximum, and average distance between predredge with maximum PCB and dredge level was 0.15, 1.37, and 0.58 m, respectively. It was thought that the results might vary between cores where the highest PCB concentrations occurred farthest away from the dredging depth and those where the highest concentrations were adjacent to the dredging depth. Instead, postdredging PCB concentrations seem to be independent of where the predredging maximum PCB concentration existed in comparison to the sediment removal level.
Similarly, it was hypothesized that postdredging PCB concentrations may be related to the maximum PCB concentration in predredging core. No relationship was identified (r2 = 0.0001).
Conclusions
Comparing PCB concentrations from 124 closely located predredging and postdredging cores from portions of OU3 and OU4 in the LFR provided quantitative information about the efficacy of remedial dredging. The following observations are drawn:
Dredging significantly reduced maximum sediment PCB concentrations. Postdredging maximum sediment PCB concentrations were lower in all, but two locations, both in OU3. Measured predredging to postdredging maximum PCB concentrations in these two locations were 1.10 to 1.81 ppm and 1.02 to 1.05 ppm, respectively. On average, maximum sediment PCB concentrations were reduced by 84%. PCB concentration reduction was greater for sediments with higher initial PCB concentrations. Dredging reduced PCB concentrations in the surface sediment layer (0.0 to 0.15 m) in most areas (77%). Predredging surface PCB concentrations of these data pairs averaged 22 ppm, while postdredging concentrations averaged 1.1 ppm. In contrast, the 29 locations where surface sediment concentrations were not reduced averaged a surface predredging PCB concentration of 1.1 ppm and a postdredging surface concentration of 2.63 ppm. Postdredging sediment PCB concentrations were generally higher in the surface layer (0.0 to 0.15 m) than the second sediment layer (0.15 to 0.30 m). The average postdredging sediment PCB concentration in the surface layer was 1.86 ppm, while it was 0.61 ppm in the second layer. The predredging and postdredging mean surface and maximum sediment PCB concentrations suggest that dredging effectively reduced sediment PCB concentrations.
Postdredging PCB concentrations seem to be independent of vertical location of the predredging maximum PCB concentration in the sediment core in comparison to the targeted dredging elevation.
Footnotes
Author Disclosure Statement
No competing financial interests exist.