
Abstract
Abstract
The leakiness index (LI) is an effective tool to measure the potential of landscapes in retaining resources (e.g., water and soil) that are vital for plant growth and environmental improvement in arid and semiarid landscapes by using vegetation coverage (VC) and digital elevation model (DEM) data derived from remote sensing images. However, sensitivity and applicability of LI in subtropical area have been rarely reported. In this study, effect of data resolution of the input parameters (VC and DEM) of LI was analyzed by using upscaling and downscaling methods. We also try to demonstrate application potential of LI in the Beijiang riparian vegetation buffer zone, a subtropical area, by comparing the result produced from LI with that from the universal soil loss equation (USLE). Results indicated that sensitivity of DEM to resolution and its influence on LI were lower compared with VC. LI sharply increased from 0.33 to 0.68 with decreasing VC, but minimally varied with increasing DEM. Performance of LI showed fluctuating changes in 1995, 2000, 2005, 2010, and 2015 with leakiness values of 0.09, 0.12, 0.21, 0.24, and 0.23, respectively. LI was significantly and positively correlated with erosion rate calculated using USLE in the corresponding period (p = 0.025), suggesting that LI can exhibit high potential in indicating soil and water conservation function in the targeted area. With decreasing data resolution (from 30 to 60, 80, 90, 120, 250, and 500 m), LI displayed a knee point at 120 m resolution scale; hence, 120 m resolution could be the critical scale for using LI to larger regions. This preliminary attempt can provide a better understanding of LI, and will contribute to the limited knowledge regarding the sensitivity and application potential of LI to subtropical area.
Introduction
Soil degradation or even erosion adversely affects grain yield, food production, and agricultural environment and has worsened in the second half of the twentieth century than in any other period (Xu et al., 2003; Liang et al., 2010). Soil erosion can increase flood/water logging disaster risks, exacerbate loss of soil nutrients, and influence environmental productivity and human well-being (Pimentel, 2006). Given the severe negative effects of soil erosion on human health and environment, researchers must develop effective methods for monitoring and controlling soil erosion to improve the effectiveness of ecological management and assessment (Xu et al., 2003).
The riparian vegetation buffer zone is a miniaturized landscape that plays important role in water–soil conservation (Gassman et al., 2006; Sahu and Gu, 2009). The riparian buffer zone, especially with perennial vegetation, can be used to improve water–soil conservation by uptaking runoff and decreasing velocity to prevent soil erosion (Gassman et al., 2006; Sahu and Gu, 2009). However, a series of human activities, such as deforestation, farmland reclamation, and urban land expansion, has degenerated the function of the riparian vegetation buffer more rapidly and extensively than those during any comparable period, to meet the rapidly increasing demands for timber, fiber, fuel, and food (Naiman et al., 1993; Deng et al., 2001).
Most riparian zones are occupied by construction land and farmland because of urbanization and agriculture developments, resulting in rapid reduction or even disappearance of riparian vegetation (Nakamura and Yamada, 2005; Wang et al., 2009), and aggravation of soil and water loss. Although the established measures for mitigating or preventing soil erosion (such as the “Grain-to-Green” project in China) have yielded significant benefits, the improvements are generally insufficient to keep pace with growing pressure induced by increasing human demands (Deng et al., 2012; Lu et al., 2013). Thus the water–soil conservation function of current riparian vegetation buffer zones must be investigated to make it get better improvement (Deng et al., 2001; Wang et al., 2009).
Generally, soil erosion can be studied using three methods. First, experiment methods, which are performed by artificial simulation of rainfall or scouring in field experiments (Zhou et al., 2006; Martínez-Murillo et al., 2013), are usually developed at different scopes (e.g., several square meters to a few square kilometers) (Zhou et al., 2006; Marques et al., 2007) or scales (e.g., plots, slope to catchment) (Fu et al., 2005; Kateb et al., 2013). Soil erosion can be measured directly in the field with some specific monitoring instrument (Lekha, 2004). However, data collection with this technique is time-consuming and costly. Therefore, some field studies have not adequately demonstrated soil erosion.
Second, model methods, which are scientific and effective approach to study the physical aspects of water-soil conservation, are usually conducted through combination of semidistributed or distributed models (universal soil loss equation [USLE], revised universal soil loss equation [RUSLE], water erosion prediction project [WEPP], and soil and water assessment tool [SWAT]) with advanced technologies, such as remote sensing and GIS technology (Zhang et al., 2008; Pavanelli and Cavazza, 2010; Chang et al., 2016). These models can simulate ecological processes, but require massive data aggregation, for example, 10 to 50 parameters are needed for RUSLE (Renard et al., 1997).
Last, the coupling index between landscape and water and soil sediment, which is an alternative tool for studying soil erosion, saves labor and material and financial resources compared with field research, and is superior in data collection compared with other physical models (Fu, 2014). The coupling index shows an ideal performance in analyzing the relationship between soil erosion and landscape pattern, in contrast to previous landscape indices (such as patch density, connectivity, and Shannon's diversity index) developed based on biological processes that describe the spatial or nonspatial characteristics of landscape (Ludwig et al., 2002, 2006, 2007).
The leakiness index (LI) is a coupling tool used to determine the important functions of landscape in retaining nutrients on the runoff path (Ludwig et al., 2007). Nutrients are retained under the influence of vegetation or terrain, which functions as a sink to obstruct runoff and prevent soil erosion (Ludwig et al., 2002, 2006, 2007; Bastin and Ludwig, 2006). Soil erosion comprises two important processes, namely, soil particle separation and in situ removal under the influence of rainsplash or runoff scouring, water movement, or sediment transport across landscape (Liu et al., 2013a, 2013b). During the second process, water and sediment may be redistributed by the prevention or alleviation effect of barriers, such as vegetation or terrain (Lesschen et al., 2009; Yuan et al., 2009; Mayor et al., 2013). Some studies reported the positive effects of vegetation patches on sediment trapping (Ludwig et al., 2002; Lesschen et al., 2009; Mayor et al., 2013). For example, vegetation coverage (VC) is an effective proxy to indicate the negative correlation between vegetation patches and soil erosion (Boer and Puigdefábregas, 2005), that is, high VC reflects high capacity for landscape to capture more or less leak water and soil sediments (Ludwig et al., 2005; Lesschen et al., 2009).
In addition to vegetation, terrain can also control soil erosion by moderating or accelerating water flow on the earth's surface (Zhang et al., 2008; Yuan et al., 2009). Previous studies contributed knowledge of LI concerning satellite-derived vegetation and terrain parameters (Ludwig et al., 2005; Franz et al., 2012) and verified the applicability of this index to semiarid or arid landscapes (Ludwig et al., 2002, 2006, 2007). However, parameters are mainly derived from remote-sensing images; hence, the significant effects of different scales on LI cannot be ignored because the scaling effect is crucial in landscape ecology, especially for landscape patterns; moreover, the choice of a suitable scale is directly related to the reliability of the results (Gustafson, 1998). Scale in landscape ecology generally refers to the grain (resolution) and extent (size), both spatially and temporally. Spatial scale analysis has gained increased research attention. Under the influence of spatial resolution, landscape patterns change correspondingly (Wu et al., 2000). Thus, measuring changes in parameters with different resolutions is conducive to the sensitivity analysis of LI and its application at widescale.
Vegetation can contribute to protecting soil against erosion by reducing or intercepting runoff (Zuazo and Pleguezuelo, 2008; Lesschen et al., 2009; Mayor et al., 2013). Changes in resolution will affect vegetation spatial pattern, hence leakiness. Vegetation patches that are clumped with fine resolution will intercept the limited resource, whereas patches dispersed with coarser resolution will exhibit the opposite effect (Bautista et al., 2007). In addition, terrain factor is commonly presented using digital elevation model (DEM) (Wang et al., 2013). The decreased resolution of DEM might create a smoother and less defined landscape with moderate slope gradients and reduced curvatures, thereby reducing erosion because a relatively flat ground replaces the original terrain (Reddy and Reddy, 2015). Consequently, the decreased resolution results in material deposition. Therefore, the influence of resolution on vegetation and DEM data must be explored for wide application of LI and further research on water-soil conservation.
Landscape indices with multiscale formulas are more suitable than those with single dimension in terms of landscape interpretation, comparison, and monitoring (Wu et al., 2002; Whigham et al., 2012). Thus, changes in indices with different resolutions must be analyzed to elucidate their sensitivity and usability. Despite the increasing interest in the function of LI in retaining nutrients and sediment, research on its sensitivity to input parameters, particularly in the subtropical riparian vegetation buffer zone, remains limited (Bastin and Ludwig, 2006). Meanwhile, there is an indisputable fact that USLE has been used as a quasi-distributed model in estimation of soil loss for its application not only in northern China (such as the Loess Plateau) (Schnitzer et al., 2013) but also in southern China (such as Fujian and Yunnan Province) (Zhou et al., 2014; Wang et al., 2017), hence Guangdong Province (Wen et al., 2013; Gao et al., 2017), so USLE is an effective method to assess soil erosion.
Given the first application of LI to study area, we first analyze the correlation between results generated by LI and USLE to indicate the usability potential of LI in study area. As for the aim of this study, it refers to investigate the influence of DEM and VC resolution on LI, analyze the sensitivity of LI to the Beijiang riparian buffer zone by using datasets from 1995 to 2015, and determine the appropriate scale of LI for its applicability in subtropical areas.
Materials and Methods
Study area
The 10 km riparian vegetation buffer zone along the mainstream of Beijiang River in Guangdong Province was selected as the research object (Fig. 1). The Beijiang River, a major tributary of the Pearl River in southern China, with the length of 582 km, lies roughly within 23°09′-25°41′N, 111°52′-114°41′E, covering more than 4.6 × 10⁵ km2. The climate in Beijiang River basin is characterized by subtropical humid monsoon with an average annual temperature of 22°C and average annual precipitation ranging from 1,600 to 1,800 mm that occurs mainly during the flood season from April to September (Zhao et al., 2015b). This region is covered by the tropical red soil with a clay-to-loam texture and features weak structure, inherent fragility, and vulnerability to water erosion (Zhao et al., 2015b). Soil in Beijiang River basin has suffered severe degradation because of high-intensity land development and utilization (Zhao et al., 2015a). The primary vegetation is evergreen broadleaf tree and dominated by mangroves, bamboo, masson pine, and eucalyptus forest.
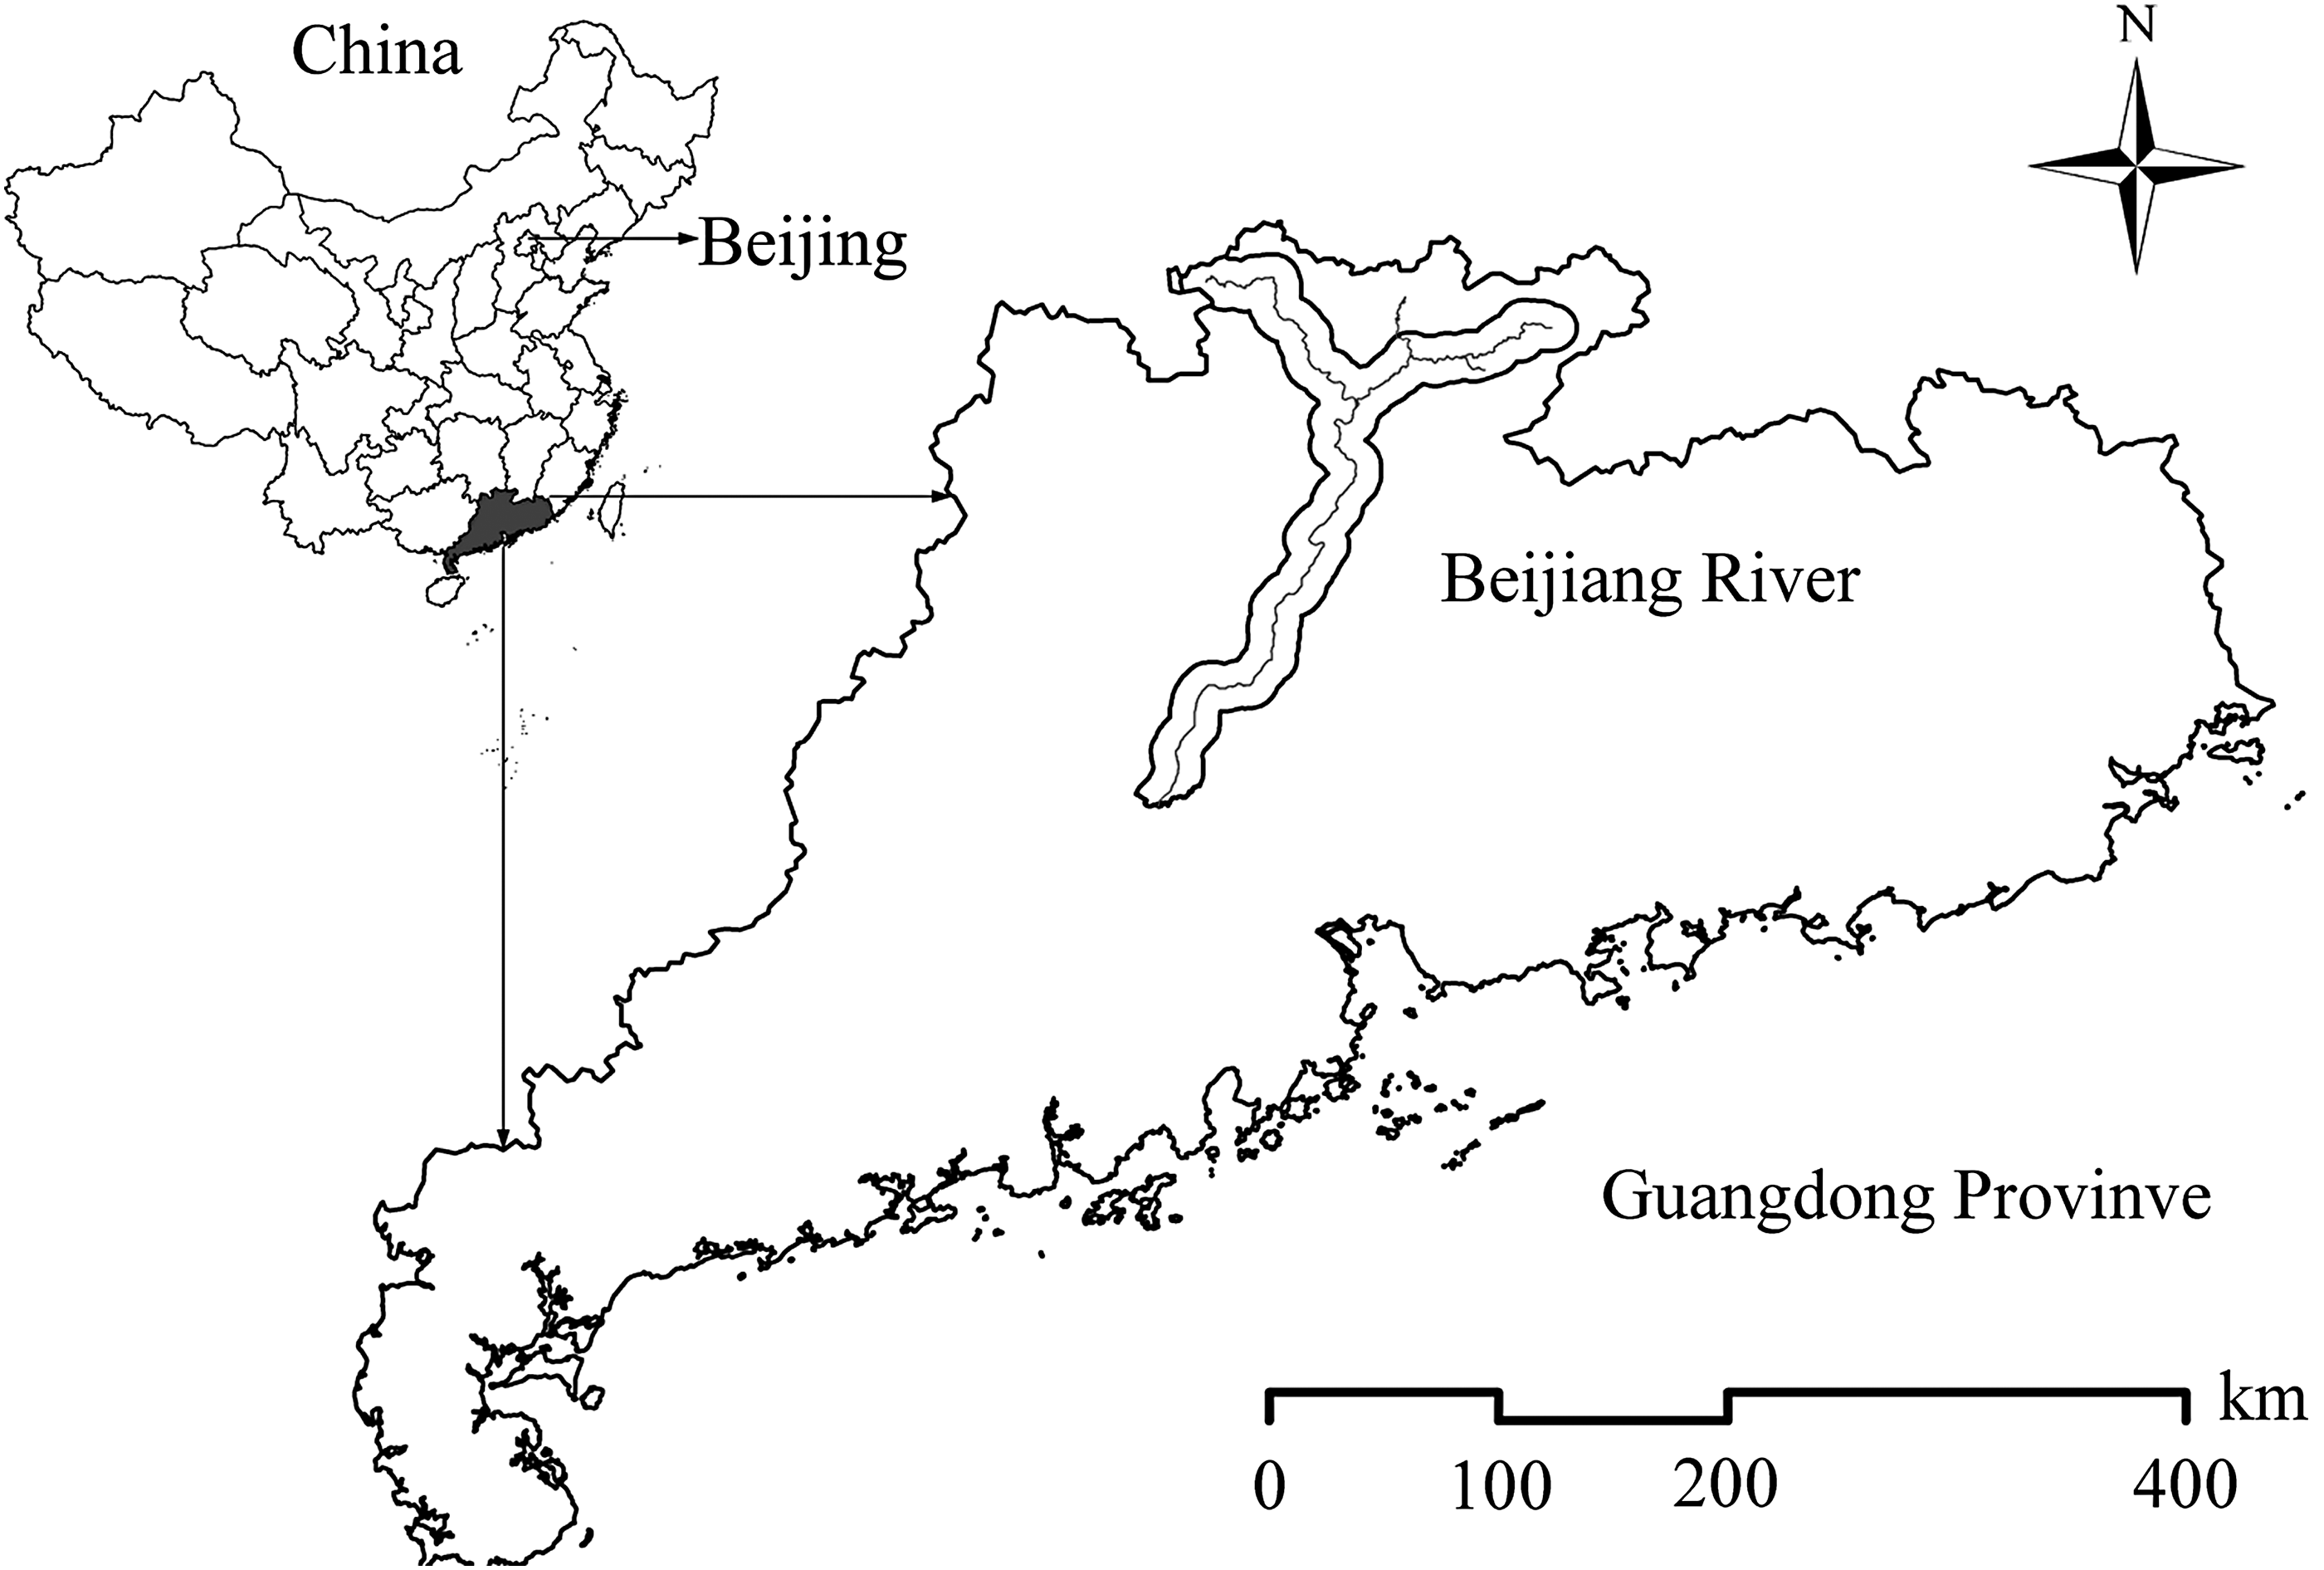
Location of Beijiang River riparian buffer zone.
In addition, this region comprises mountains and hills in the upper area, which is accompanying the acute contradictions between more population and less land. Therefore, water and soil losses in this region are a severe ecological issue caused by climatic and topographical conditions and human disturbances (Liang et al., 2010). Moreover, the Beijiang River basin is the main source for sediment discharge into the Pearl River and exhibits adverse impact on the Pearl River Delta; therefore, the soil and water conservation function of the Beijiang riparian vegetation buffer zone must be investigated (Liang et al., 2010).
Calculation of LI
LI is an effective tool to evaluate landscape function for retaining resources in Australia based on the progressive accumulation of resource from the first grid to the last grid along the flow direction until out of the landscape system of interest (Ludwig et al., 2006). LI was initially derived from the directional leakiness index (DLI) and cover-based directional leakiness index (CDLI) (Ludwig et al. 2002, 2006). However, for both DLI and CDLI, landscape pattern is assumed to be simple with uniformly smooth terrain; thus, one can assume flow direction as single or spatial maps can be oriented to make the flow unidirectional. In this regard, LI was developed with multiple flow algorithms to improve them; LI not only considering vegetation but also terrain exhibits significant advantages over DLI and CDLI (Ludwig et al., 2007).
In runoff path, vegetation and depression are regarded as runoff and sediment sink, respectively, for capturing resources; meanwhile, the bare area and convex terrain are considered the sources of runoff and sediment. The number of source grid cells that connect along the flow direction without interruption by a sink grid cell is the key factor that influences the retention capability (Liu et al., 2013a). VC is used to indicate water-soil conservation, but this index neglects terrain factor, resulting in bias analysis (Wei and Yang, 2002). LI combines vegetation and terrain to optimize the research of landscape function for water-soil conservation. The following formula is used to calculate LI:
where the term in square brackets raised to the k power indicates the potential of a landscape to retain resources. The retention term should be subtracted from 1 to characterize leakiness. The landscape leakiness ranges from 0 (no leakiness) to 1 (totally leaky). The smaller the value is, the lower the risk of soil erosion and the higher the capability of water-soil retention of the landscape will be. Lmax indicates the maximum leakiness value (0% of VC), and Lmin represents the minimum leakiness value (100% of VC). The parameter k determines the steepness of the decay curve formed in the plot of LI against the proportion of VC. Here, k = 5 provides a good fit for LI to the decay curve in terms of the practical conditions for soil and vegetation in China (Liu et al., 2013a, 2013b), in contrast to that mentioned by Ludwig et al. (2006, 2007). Lcal represents the calculated value of the potential leakiness of a landscape mosaic and is determined by multiple flow direction algorithm. The formula can be described as follows:
where Pi,j is the progressive flow value of each grid cell, Lcal is the sum of contributions from all the neighboring grids (including those that are adjacent and diagonal), and m indicates the total number of grids adjacent to the target pixel. The progressive value of each grid (Pi,j) can be expressed as follows:
where n (range from 1 to 8) is the representative of the eight grids adjacent to the target. These adjacent pixels may contribute a proportion of their progressive flow to other adjacent pixels at low elevation; hence, the proportion of the progressive value from the adjacent pixels (n) to the pixel being considered is represented by Sn, which is determined by the gradient between the grids. Adjacent grids have different heights, which determine the flow direction; the direction, in turn, affects the grids that receive runon and the proportion that flows into adjacent cells as runoff. Li,j can be described as follows:
where b is the steepness of the linear function relationship between soil loss and VC; the value is suggested to be −0.065 in arid or semiarid areas (Ludwig et al., 2007). In this study, we revised b to be −0.053 according to the soil and vegetation condition in southern China (Cai et al., 2000; Liu et al., 2013b). The parameter Ci,j represents VC of each grid cell.
Calculation of soil loss rate
Given the rare utilization of this index in subtropical areas, the USLE, one of the most widely applied empirical models for assessing soil and water conservation function for landscape, was implemented to calculate soil loss rate and compare the results obtained from LI by using data in 1995, 2000, 2005, 2010, and 2015, to interpret whether LI has the potential to indicate the soil and water function in the study area. The erosion was given by the following equation:
where A is the soil loss rate (t/[ha·a]); R is the rainfall erosivity factor ([MJ·mm]/[ha·h·a]); K is the soil erodibility factor [t·ha·h]/[ha·MJ·mm]; LS is the topographic factor (slope steepness and slope length); C is the crop management factor, and P is the conservation supporting practice factor. The aim of this study is to analyze the sensitivity of LI; thus, the exhaustive calculation process and factor-layer distribution are not displayed in the text, but the detailed algorithm is available in relevant literature (Wischmeier and Smith, 1978; Pan et al., 2010; Wen et al., 2013).
Data sources and processing
This study first analyzed the sensitivity of LI to Beijiang riparian vegetation buffer zone, and then explored application potentiality of LI in the study area. The detailed data process is shown as follows:
Data for sensitivity of LI to different resolutions of the input parameters
The basic data for sensitivity analysis included DEM with original resolution of 10 m obtained from Google Earth, and VC with 30 m resolution from Geospatial Data Cloud (www.gscloud.cn). The sensitivity of LI to different resolutions of input parameters (VC and DEM) can be done by alternatively varying and fixing one input parameter through upscaling the high-resolution data of a parameter to match low-resolution data, or downscaling the low-resolution data to match the high-resolution data. In this process, the information of one parameter is kept constant by downscaling the grid with large size (lower resolution) so as to demonstrate the effect of other parameters (upscaling) on LI.
As shown in Table 1, to analyze the effects of vegetation data resolution on LI, the vegetation data with 30 m resolution were upscaled to 80 and 250 m; meanwhile, the DEM data were first resampled from the original resolution of 10 to 250 m, and then downscaled from 250 to 80 and 30 m (data information did not change when the resolution was downscaled). The effect of vegetation data on LI was analyzed by matching the upscaling vegetation information to the downscaling DEM. Similarly, to analyze the effects of DEM data resolution on LI, the vegetation data with 30 m resolution were downscaled to 15 and 10 m to match the DEM data, upscaling from the original 10 m resolution to 15 and 30 m to make the influence of DEM resolution on LI realized.
DEM, digital elevation model.
Extraction method of VC
Previous studies on leakiness employed various indices, such as PD54, Stress-related Vegetation Index (STVI), and Redness Index (RI) (Ludwig et al., 2006; Dunwoody et al., 2013), to describe VC. In this study, VC was derived using the normalized digital vegetation index (NDVI) by using ENVI software. NDVI was the optimal VC indicator with higher sensitivity and widely applied for VC monitoring (Qi et al., 2000). The formula of NDVI is shown below:
where NDVI is the normalized digital vegetation index, and IR and R refer to the reflectance values of the near-infrared and red spectral bands, respectively. VC was defined based on NDVI:
where VC is the vegetation coverage of single pixel or grid; NDVIsoil is the NDVI value of grid with bare land and is the minimum value of NDVI (also known as NDVImin); and NDVIveg is the NDVI value of the grid with vegetation and is the maximum value of NDVI (also known as NDVImax). NDVImin and NDVImax can be determined according to field observation, remote sensing survey, and setting the confidence interval (Ma et al., 2012). This study applied the method of confidence interval, which is based on the number of pixels. When the pixel number reaches five figures, NDVImin and NDVImax can be identified and VC can be derived.
Generation of soil loss rate
Spatial distribution of R was obtained through Kriging interpolation supported by ArcGIS 9.3 based on the monthly rainfall data of 10 surrounding cities during 1995–2015. The K-factor was calculated with different soil types of study area from www.geodata.cn. LS-factor was derived from 30 m resolution DEM with the help of ArcGIS 9.3. C factor and P factor were determined by VC and land use types in corresponding period, respectively. Finally, the spatial-distributed layer of five factors was overlapped and multiplied to generate the soil loss rate.
Other relative data analysis
LI was computed using programming language and implemented in Arc/info 9.3 with Arc Macro Language (AML). Correlation analysis among variables was processed in SPSS 17.0.
Results
Response of LI to VC and DEM resolutions
Response of LI to VC resolutions
Variation of NDVI resolution could lead to changes in VC. Figure 2 and Table 2 show the changes in image information and values of NDVI and VC with different resolutions. As shown in Fig. 2, images were blurred increasingly with coarser resolutions for both NDVI and VC. The effect of resolution on image contrast was particularly evident at 250 m, and the image definition became almost undistinguishable, especially for VC. The mean values of NDVI at different resolutions presented minimal change, whereas the standard deviation (SD) values decreased with decreasing resolutions; hence, the image contrast decreased with reduction in resolution (Fig. 2 and Table 2). The mean values of VC, showing different trends compared with that of NDVI, apparently decreased as the grid size increased from 30 to 250 m. Conversely, SD values kept increasing with decreasing resolution.
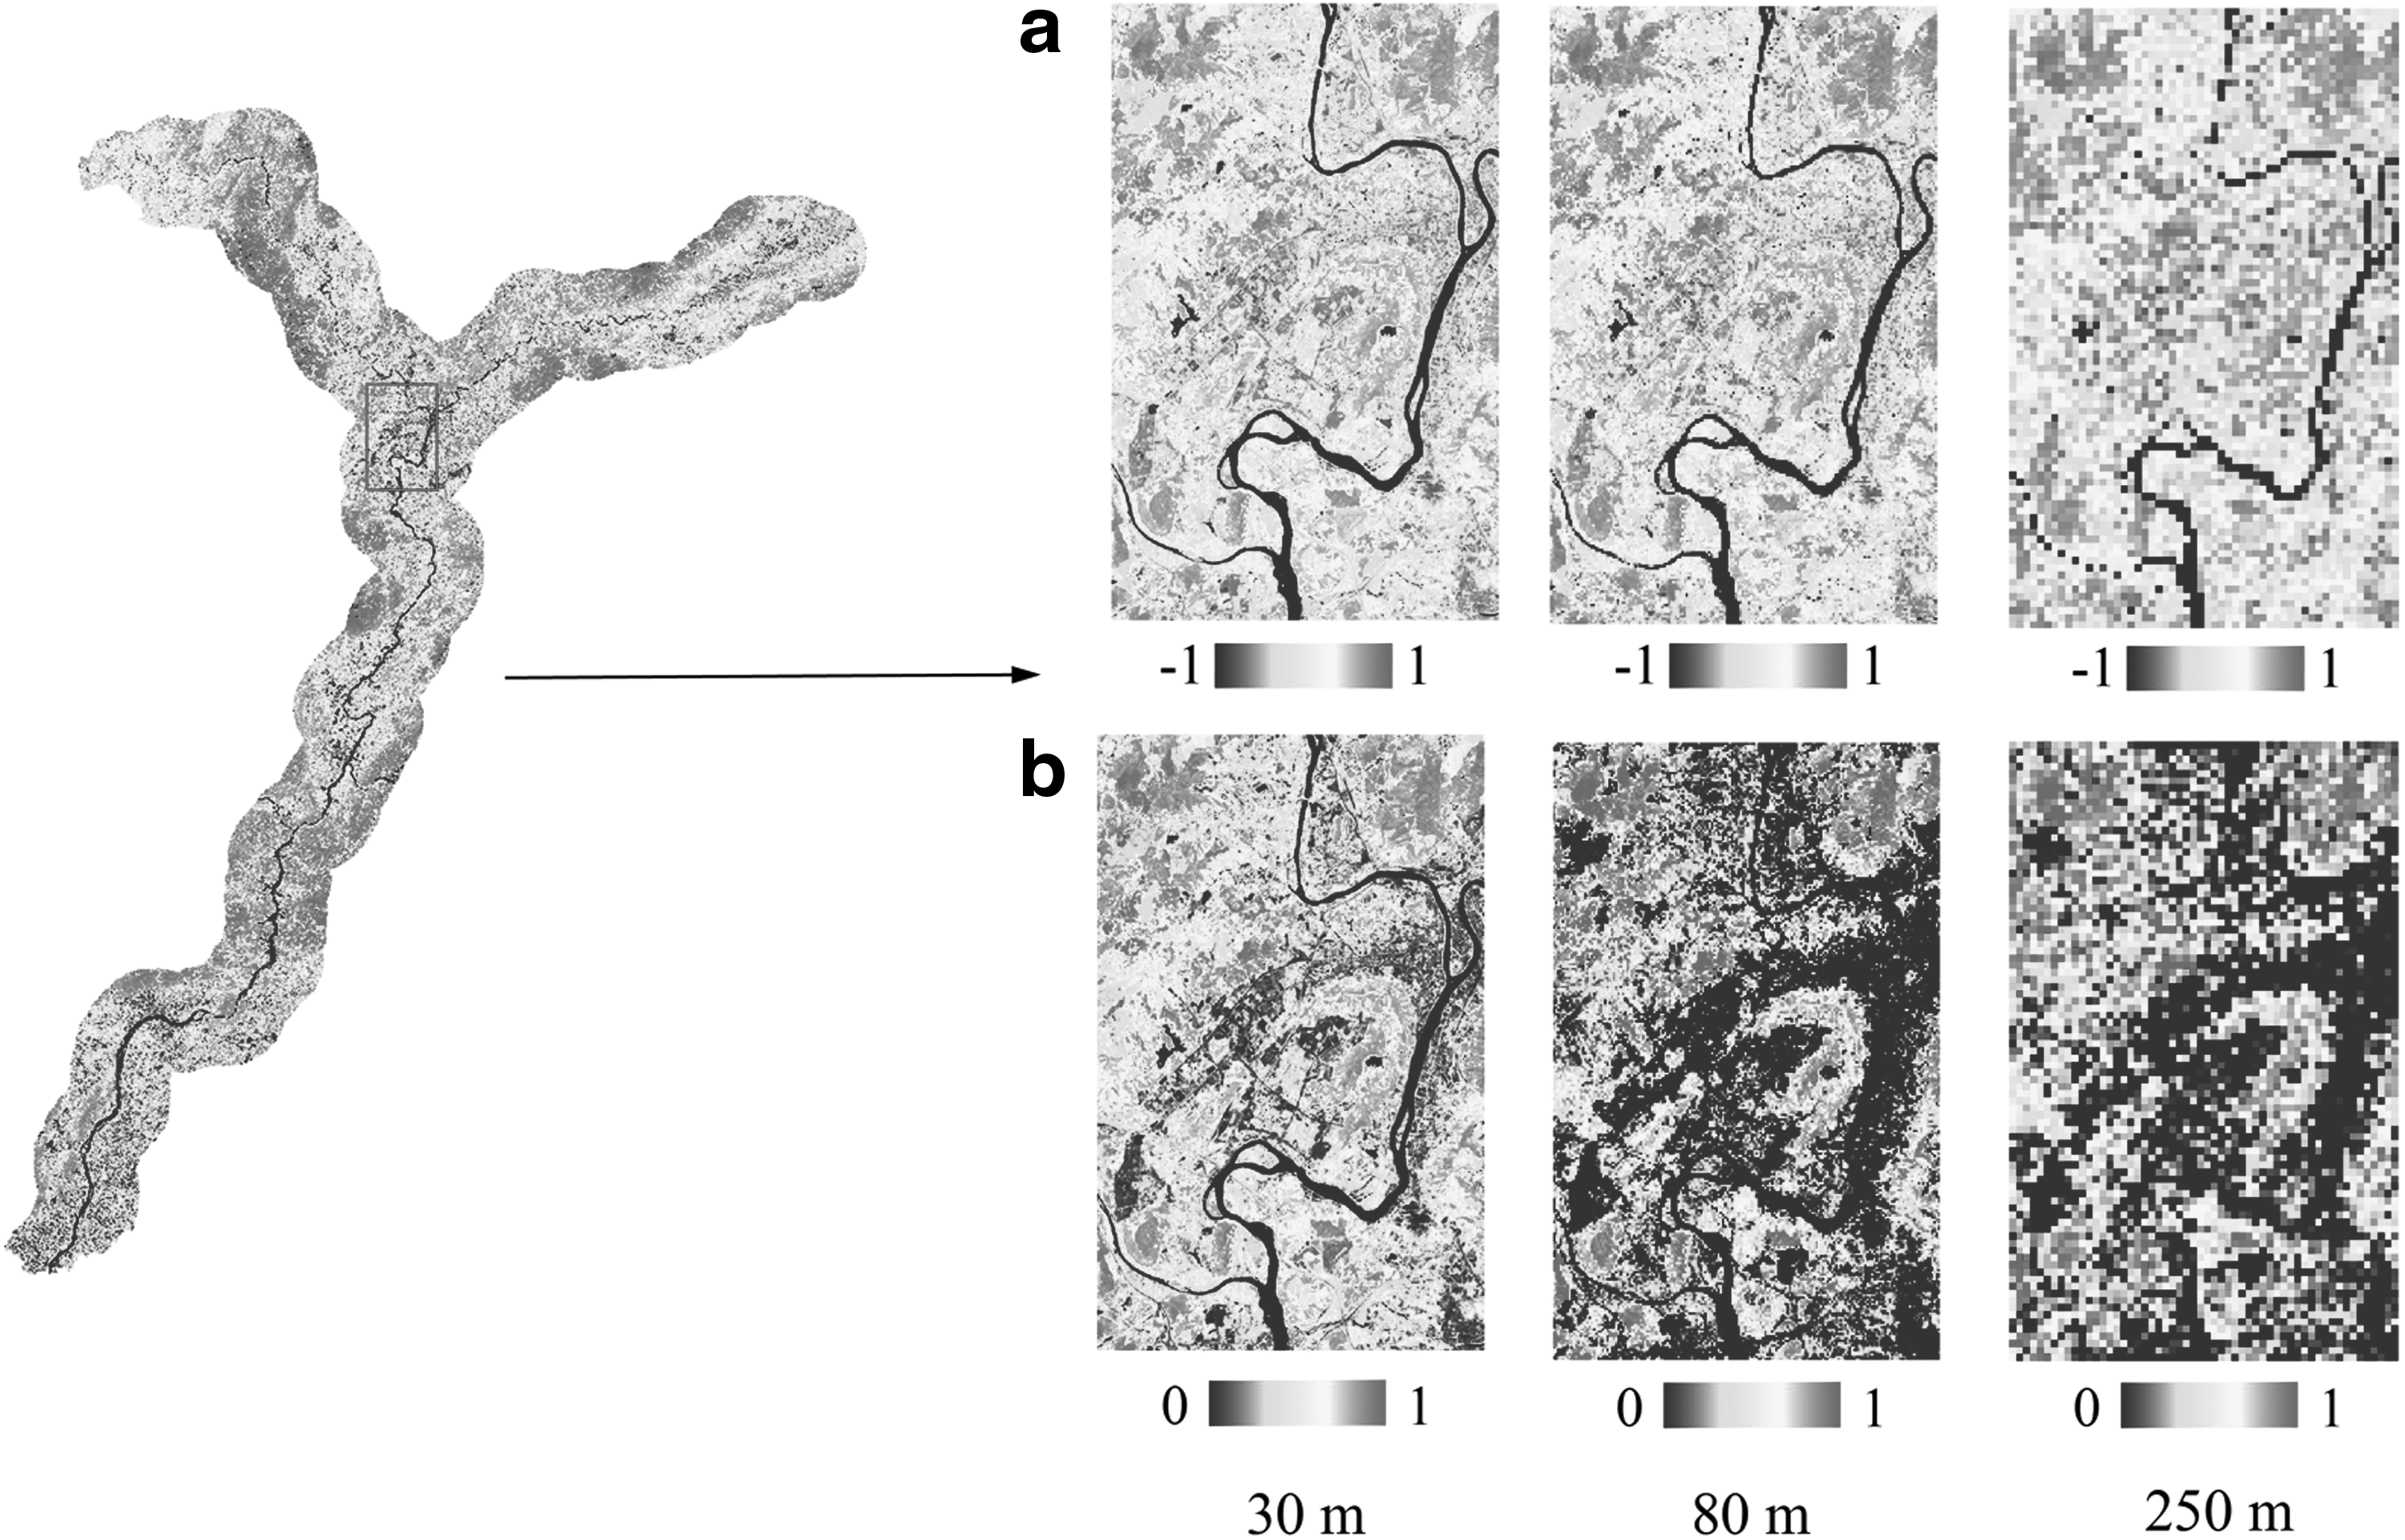
Change in NDVI
LI, leakiness index; NDVI, normalized digital vegetation index; SD, standard deviation; VC, vegetation coverage.
LI increased with decreasing VC. Along with the upscaled resolutions, the average VC decreased from 0.60 to 0.48, and the LI steadily increased from 0.33 to 0.68. This finding indicates the inverse relationship between leakiness and coverage (Table 2).
Relationship between DEM resolution and LI
Table 3 shows the mean and SD values of elevation and slope gradient derived from DEM. As the resolution decreased, the elevation showed no significant difference and maintained nearly constant. The slope gradient slightly varied in terms of mean and SD values, which decreased ∼0.2. Both LI and average slope gradient decreased with the upscaled resolution of DEM. The average slope gradient decreased with the upscaled resolution from 9.76 to 9.33, whereas LI showed subtle change, remained almost constant from 10 to 15 m, and presented a small drop from 15 to 30 m.
Application of the LI
Application potential of LI in Beijiang riparian vegetation buffer zone
As shown in Fig. 3, from 1995 to 2015, LI changed from the minimum value of 0.09 in 1995 to the maximum value of 0.24 in 2010. Regression analysis results revealed a significant correlation (p < 0.05) between LI and soil loss rate during 1995–2015. It can be inferred that LI has the potential to be an effective index used to evaluate soil and water conservation function (Fig. 4).
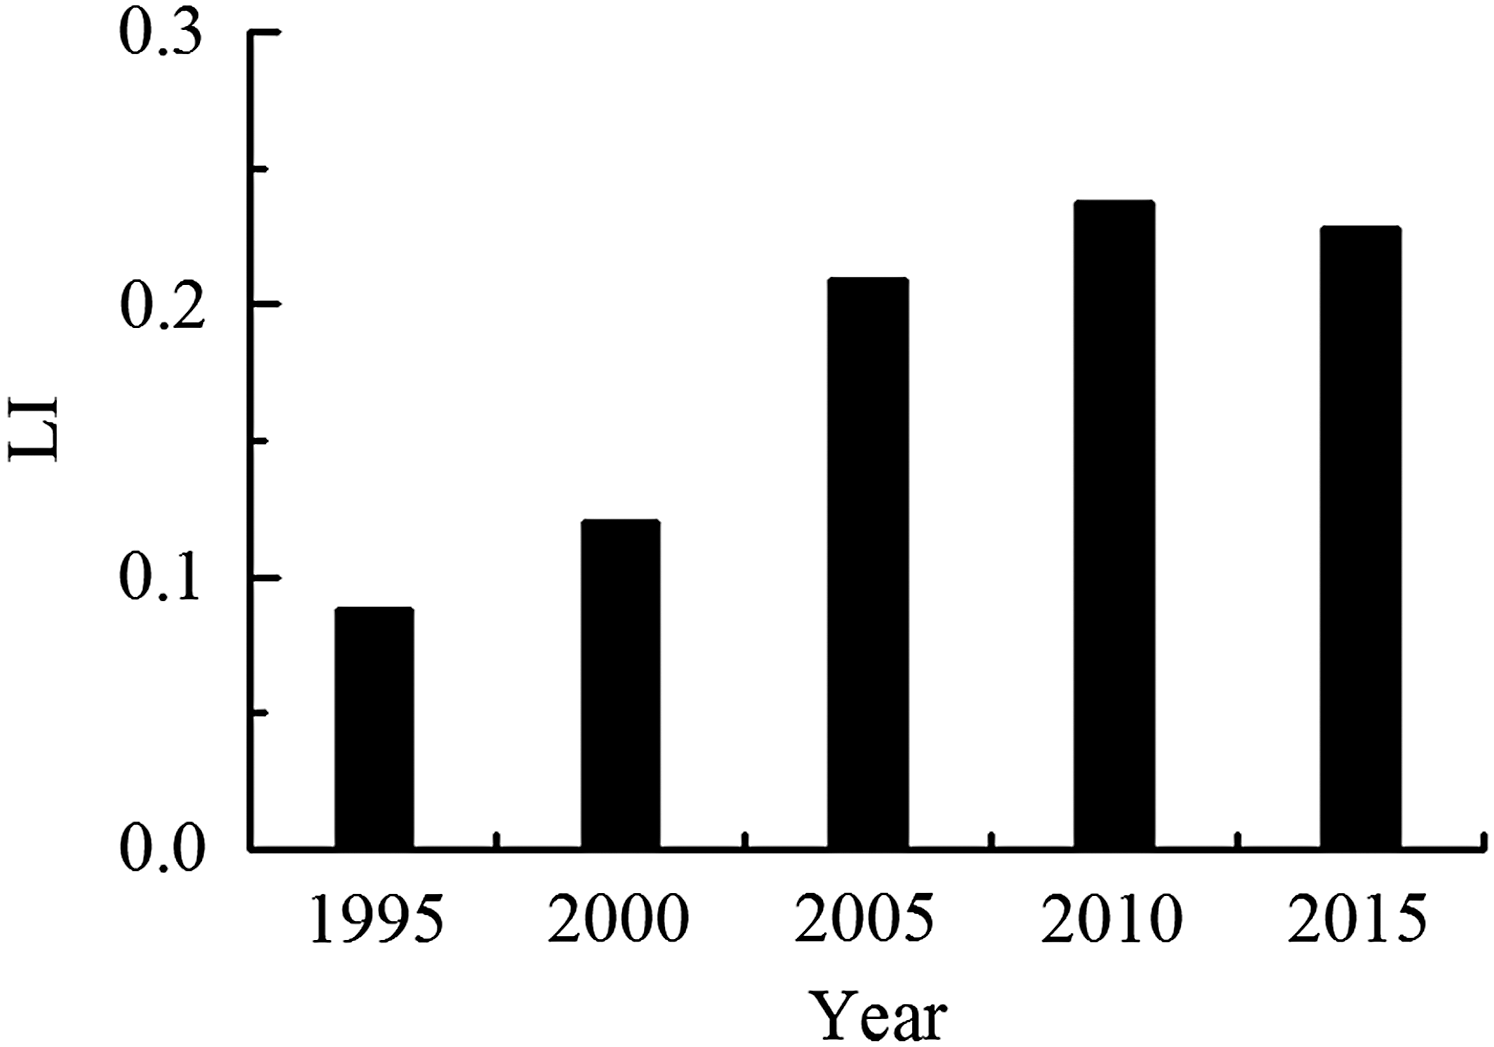
LI data from 1995 to 2015 in the Beijiang riparian vegetation buffer zone. LI, leakiness index.
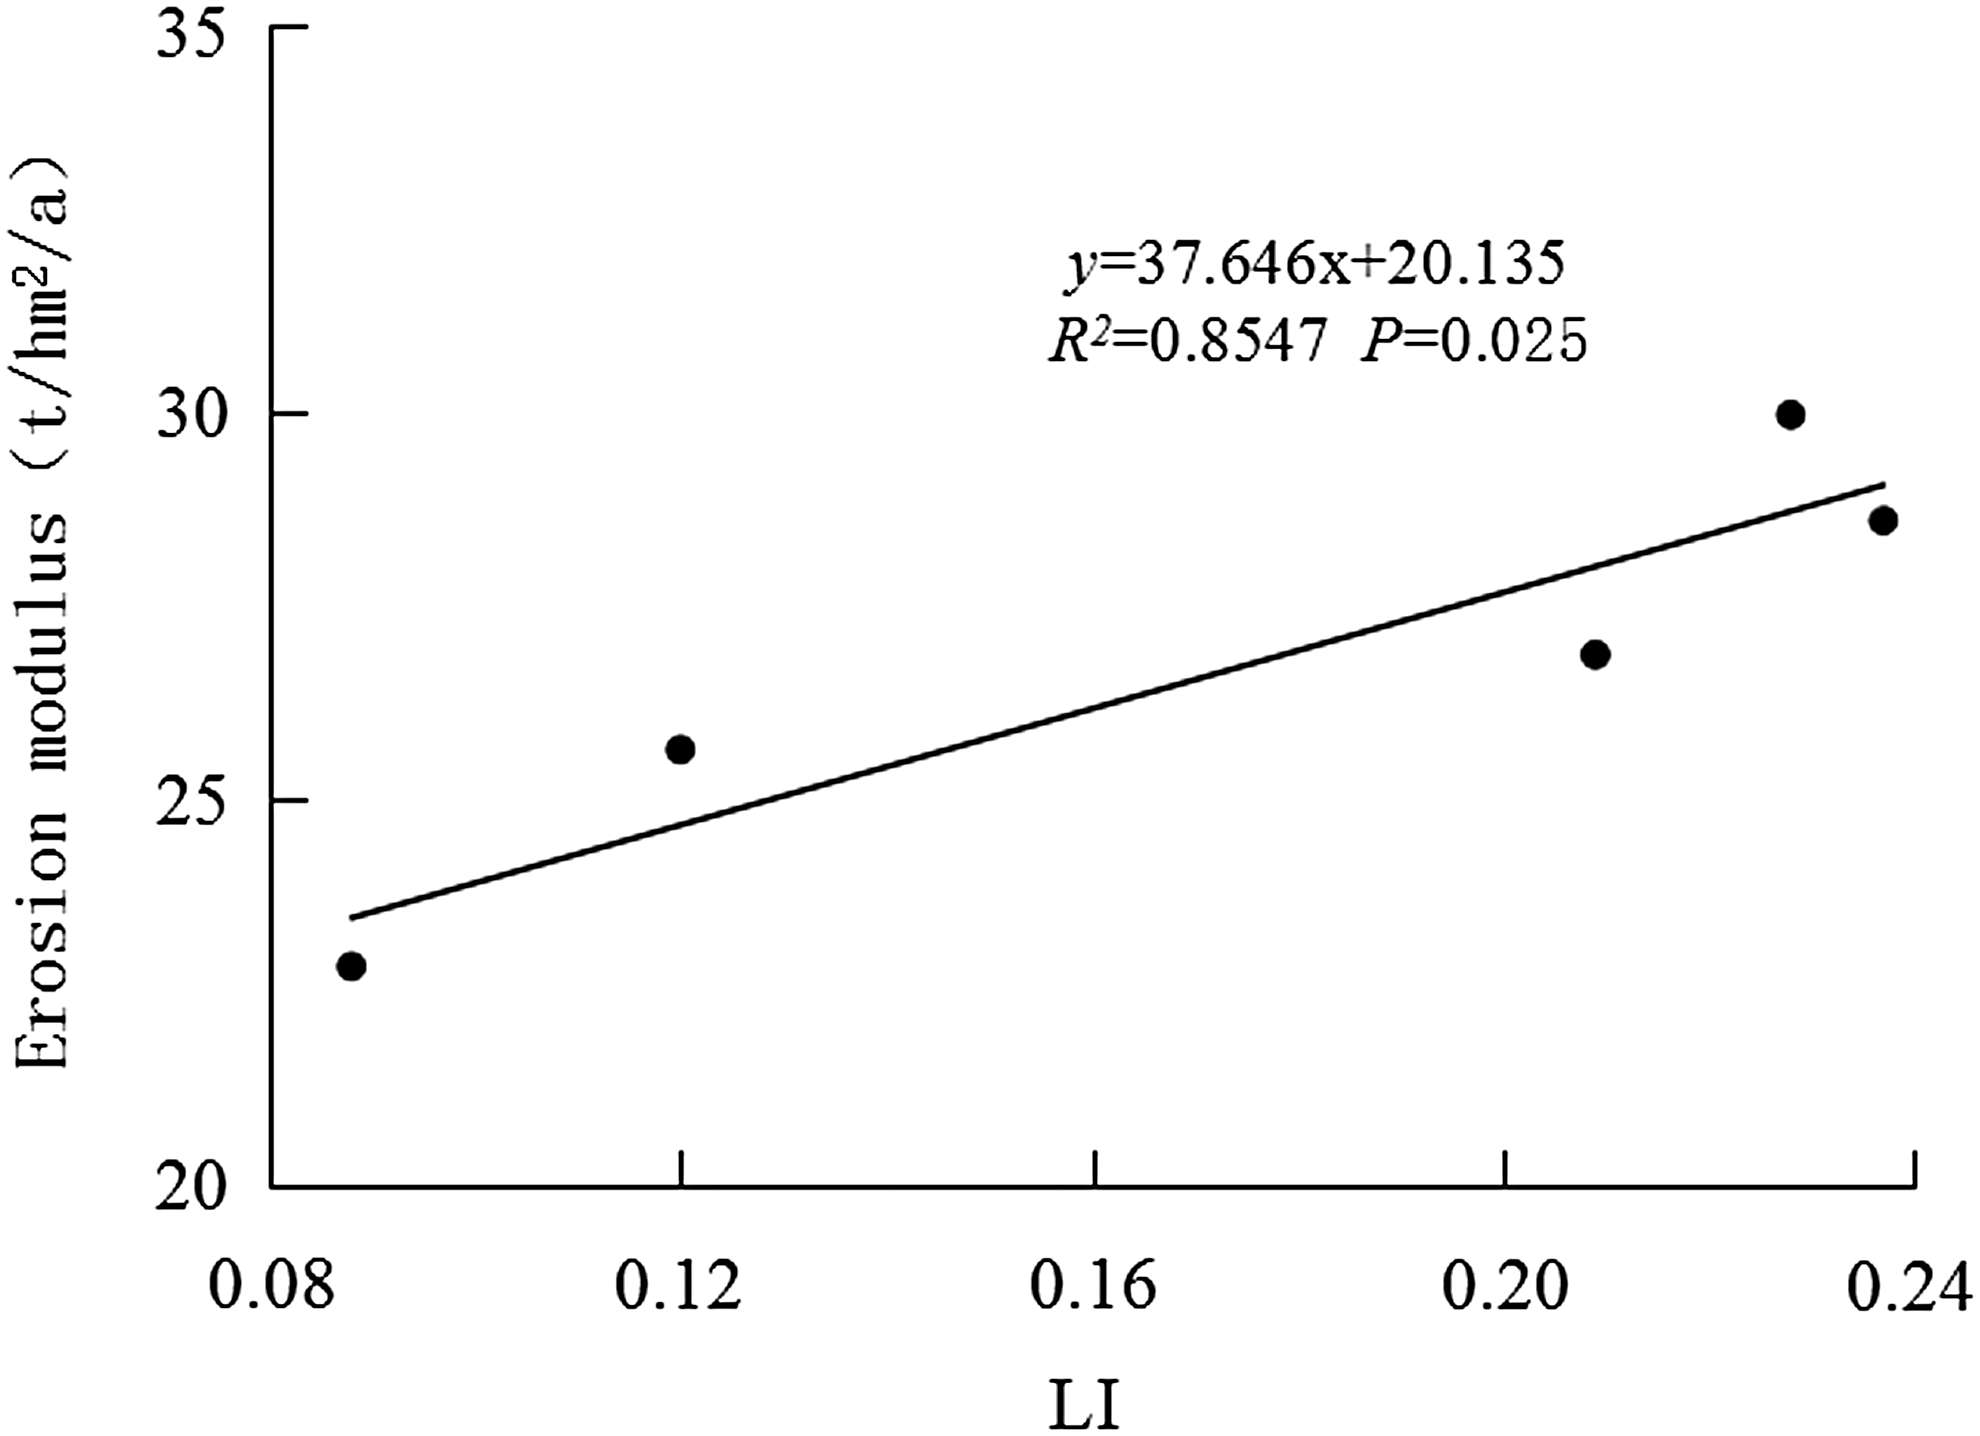
Correlation between LI and soil erosion during 1995–2015.
Application to subtropical area
The Beijiang riparian vegetation buffer zone is a fraction of the subtropical region. Despite the high sensitivity and applicability potential of LI to the study area, whether this index can be applied or not to large areas must be further studied. Image resampling is an effective method used to expand the research scope to a large area (Zhang et al., 2014). Therefore, upscaling method was used to determine the verification that LI was sensitive to the coarser resolution. Moreover, Dunwoody et al. (2013) confirmed the sensitivity of LI to the upscaled resolution. As such, we predict that LI exhibits the potential to be applied in subtropical areas. Figure 5 showed the dynamic changes in LI at different resolutions. LI showed a continuous and constant increase from 0.23 at 30 m resolution to 0.90 at 120 m resolution, and steadily declined with decreasing resolution from 120 to 500 m. The clear knee point at 120 m suggested that 120 m could be the appropriate resolution for the use of LI in subtropical areas.

Change in LI for upscaled resolutions.
Discussion
VC, terrain, and soil erosion
Bare patches contribute to excess runoff and soil loss, and vegetation patches are critical in concentrating resources. As a surface obstacle, vegetation strongly influences the movement of runoff and sediment. Consequently, erosion risk is reduced (Lesschen et al., 2009) by capturing or retaining limited resources (such as rainwater, soil sediments, and nutrients) (Boer and Puigdefábregas, 2005), intercepting precipitation and enhancing water infiltration (Ludwig et al., 2002; Mayor et al., 2013). The significant function of vegetation patches in water and soil conservation has been widely recognized and verified by different studies worldwide (Zhou et al., 2006; Bautista et al., 2007; Zuazo and Pleguezuelo, 2008; Kateb et al., 2013).
VC is an effective factor used to prevent soil erosion and improve the ecological environment (Ludwig et al., 2005; Mayor et al., 2013). As shown in Table 2, VC is inversely correlated with LI and thus can effectively prevent and control soil erosion. The result is consistent with findings of studies conducted in southeast Spain and the dry land ecosystem; hence, vegetation patches largely determine hydrological connectivity (Lesschen et al., 2009; Mayor et al., 2013). In terms of the objective region, VC influenced water and soil conservation based on the variation of LI (Fig. 3). Basically, perennial vegetation cover may strongly influence landscape leakiness because the coverage will directly impact the flow connectivity and sediment movement over time (Ludwig et al., 2007). The dominant vegetation in subtropical area is evergreen broad-leaf forest; remotely sensed images are less susceptible to ephemeral vegetation produced under the influence of rainfall. Therefore, acquisition of remotely sensed images exhibits less time restriction.
Soil erosion can be partly attributed to terrain conditions. Terrain factors, such as slope and surface roughness, directly or indirectly affect soil erosion (Koulouri and Giourga, 2007; Cerdan et al., 2010). The rougher the terrain is, the slower the material transportation will be. By contrast, material transportation and soil erosion are aggravated by the accelerated wind and surface runoff in smooth surfaces. Energy obtained by runoff at every rainfall event weakens with gentle slope; hence, rainfall erosivity is conducive to nutrient deposition. The situation reverses for steep slope. As shown in Table 3, LI decreased with the coarser resolution even if the trend was very weak; this finding indicates that DEM resolution minimally influenced LI. The slight increase in LI from 10 to 15 m can be attributed to rainfall intensity, soil stability, or other reasons (Zhao et al., 2015a).
Influence of VC and DEM resolution on LI
VC depends on resolution (Friedl et al., 1995). When the 30 m image was upscaled to 80 and 250 m, the mean values of VC showed a downward trend. By contrast, SD values increased, indicating the obvious sensitivity of VC to resolution. VC and LI presented opposite tendencies with the decreased resolution, implicating that LI will decrease with increasing VC. The influence of resolution on VC results in the influence of VC on LI.
The surface condition, as one of the factors influencing soil erosion, is usually described using DEM. To determine the sensitivity of LI to DEM resolution, scholars analyze the effects of resolution on elevation and slope. Terrain significantly contributes to erosion by reducing or increasing the energy of the surface material transportation, thereby increasing the soil erosion intensity (Hutchinson, 2003). The intensity of soil erosion caused by runoff is affected by elevation and slope (Wang et al., 2013; Zhao et al., 2015a). Different resolutions could influence terrain condition, and the gentler slope derived from a larger grid could make resources or materials easier to deposit or infiltrate on the slope surface. However, as shown in Table 3, the mean and SD values of slope exhibited lower sensitivity to the upscaled resolution compared with elevation. The decline in LI accompanying the resolution was minimal, indicating that LI showed weak sensitivity to change in DEM resolution in the study area.
Soil erosion research in Beijiang Basin is often conducted by field or simulation experiment (Zhao et al., 2015a, 2015b), Thus far, few studies are focused on indices to present landscape functions for soil and water conservation. This study applies LI by integrating landscape patterns and process to provide a solution to research on soil and water conservation landscape function. LI is a common indicator used to reflect the ability of landscapes to retain runoff or nutrients along flow pathway in arid and semiarid regions (Ludwig et al., 2006, 2007); introducing this index to subtropical regions can extend its use for sensitivity analysis. These results indicate that this index is sensitive to the target region with remote-sensing data. In addition, the universally acknowledged model (USLE) was used to estimate the erosion condition and verify the applicability of LI to the study area. The correlation between LI and mean erosion verified that LI can be used in the Beijiang riparian vegetation buffer zone with improved performance.
For the application example, applying LI to the Beijiang riparian vegetation buffer zone exhibits great potential. Based on the good application potential of LI to the test area from 1995 to 2015, 30 m resolution was selected as reference for scaling to explore the applicability of LI in large areas (Zhang et al., 2014). In this procedure, the selection of upscaled values directly influenced the data accessibility for the wide use of LI. As shown in Fig. 5, the 60, 90, and 120 m resolutions are resampled according to original grid size to improve upscaling accuracy, especially for the marginal part of raster data. Data were easily obtained with 80, 250 and 500 m resolutions from Multispectral Scanner (MSS) and Moderate Resolution Imaging Spectroradiometer (MODIS), thereby increasing data accessibility. With the coarser resolution, a clear knee point was observed at the 120 m resolution for LI (Fig. 5); hence, this resolution could be the critical scale for the use of LI to broader regions. Thus, for large areas, data from remote-sensing images with 120 m resolution can provide effective information for soil erosion based on LI.
Limitation and prospective
Unlike distributed or semidistributed models, emphasizing more on landscape patterns and not on landscape function or ecological consequences (Chen et al., 2008), LI is an effective tool to link landscape patterns with ecological function and simulates the erosion process with simplicity and convenience. However, limited information is known about sensitivity of LI, especially for the subtropical regions. This study improved application scope of this index. However, it is still far from enough.
Although we illustrated the application potential of LI in Beijiang riparian vegetation buffer zone, Guangdong Province, southern China, the applicability of LI still requires further verification with more field experimental data, and whether LI can be applied to other subtropical areas also needs to be determined. One can, of course, overturn the conclusion in this study through field verification.
In this study, the influence of VC and DEM with different image resolutions on LI was analyzed. However, the data with 10 m original resolution were unavailable and therefore, a constraint exists in matching VC to DEM with fine resolutions and obtaining accurate LI. Nevertheless, upscaled DEM data with 10 m original resolution and downscaled VC data with 30 m resolution were used to keep VC constant to analyze the impact of DEM resolution on LI.
As for the application of LI in larger subtropical area, 120 m was obtained through upscaling method. The dynamic changes of LI with the resolutions from 30 to 60, 80, 90, 120, 250, and 500 m showed that there was a clear knee point at 120 m, suggesting that 120 m may be the critical scale for the application of LI in a larger area. Although this result can provide certain reference, there is still some uncertainty and require some field verification to confirm its practicability due to the limitation of data.
Evergreen broad-leaf forests are dominant in subtropical areas. Inevitably, the litter layer or undergrowth coverage, which effectively obstruct surface flow and mitigate soil erosion, can be obscured by tree and shrub canopies. Consequently, satellite sensors based on reflected radiation in the visible wavelengths cannot accurately estimate ground cover, as also mentioned by Ludwig et al. (2007). Therefore, some improvements are needed to improve index application in subtropical regions.
In contrast to erosion models, LI is not intended to monitor the actual amount of soil lost or sediments during rainfall; LI, instead, links landscape pattern and erosion process. Although soil erosion is also controlled by other factors such as soil texture, rainfall, and infiltration rate, vegetation and terrain are the major factors considered to calculate LI. However, the preliminary attempt to apply LI to subtropical area presented good performance, indicating LI can be used to promote studies on soil and water conservation in wide regions.
Conclusions
Soil erosion is a dynamic process that has become an issue to be solved urgently. LI is a good indicator of landscape function in soil and water conservation; however, its sensitivity analysis, especially in riparian vegetation in subtropical regions, has been rarely investigated. In this study, the effects of image resolution of input parameters (DEM and VC) on LI were analyzed to investigate the feasibility of this index to the Beijiang riparian vegetation buffer zone and confirm its effectiveness in subtropical regions.
Influence of resolution on elevation and slope was less than that on VC, as determined by computing the mean values and SD. The effects of VC resolution on LI were greater compared with DEM. LI was found to be sensitive to the Beijiang riparian vegetation buffer zone by comparing changes in VC and LI during 1995–2015. Analysis based on USLE model indicated the significant correlation between erosion loss rates and LI (p = 0.025); hence, LI presented great application potential in the study area. The upscaling based on the original 30 m resolution indicated that LI is applicable for investigating the landscape function of soil and water conservation in large subtropical regions with 120 m resolution.
This study can contribute to the limited body of knowledge regarding the sensitivity of LI according to the satellite-derived DEM and vegetation parameters, especially for subtropical and humid areas. The sensitivity analysis in this study is conducive to studies in subtropical regions, but must be further improved.
Footnotes
Acknowledgments
This research was funded by the National Natural Sciences Foundation of China (41301197, 41771202), the Colleges and Universities Key Scientific Research Projects of Henan Province (18A170004), and the Program for Innovative Research Team (in Science and Technology) in University of Henan Province (16IRTSTHN012).
Author Disclosure Statement
No competing financial interests exist.