
Abstract
Abstract
Continuous release of personal care products in environmental systems provokes adverse effects in aquatic ecosystems, as result of compound-specific biological interactions and chemical activity. Such substances are classified as organic compounds and are frequently found on consumer goods used by people in everyday activities. This study investigates the presence and risks of four parabens and triclosan on tributaries of the Iguassu River, located in the south region of Brazil. Important reservoirs used for potable water consumption are in the Upper Iguassu basin. Monitoring efforts were conducted in three rivers in the form of five campaigns along 10 control sections. Compound concentrations were determined by solid phase extraction and gas chromatography hyphenated to a mass spectrometer. Estimation of environmental risk for each compound was performed employing risk indexes, considering detected concentrations for the sections, lethal and effective median concentrations (LC and EC50) for various trophic levels reported in the literature. Concentration values show clear anthropic influence, presumably from raw domestic sewage discharges or effluents from wastewater treatment plants. Annual subtropical seasonality and low rainfall rates during winter can influence and increase the detected concentrations, also influencing the hazard quotient (HQ). The environmental risk assessment reveals that HQ tends to increase along the river course. As for the sensitivity of different trophic levels, parabens tend to affect particular trophic groups, while triclosan affects all four trophic groups.
Introduction
O
Primary classes of PCPs include antiseptics (e.g., triclosan), fragrances (e.g., musk), repellents (e.g., DEET), preservatives (e.g., parabens), and UV filters (e.g., benzyl cinnamate). These substances are widely and constantly employed and are pseudo-persistent and bioactive. Moreover, they have bioaccumulation potential (Brausch and Rand, 2011; Haman et al., 2015; Li et al., 2016).
PCPs are considered ubiquitous compounds (Błedzka et al., 2014; Gasperi et al., 2014; Tijani et al., 2016) and an emerging group of endocrine disruptors; therefore, they are of great interest to the scientific community. PCPs were detected in surface waters (Garrido et al., 2016), groundwater (Postigo and Barceló, 2015; Serra-roig et al., 2016; Yang et al., 2017) and drinking water supplies (Zhao et al., 2010; Aristizabal-Ciro et al., 2017), human placenta (Valle-Sistac et al., 2016), marine organisms (Prichard and Granek, 2016), and sewage sludge (Chen et al., 2017; Karthikraj et al., 2017). Furthermore, toxicological studies suggest that PCPs are toxic to aquatic organisms, such as algae, fishes, and invertebrates (Dobbins et al., 2009; Yamamoto et al., 2011). However, their toxicity may affect other organisms and even may cause risks to humans; thus it is necessary to assess their risks and control their pollution levels (Ma et al., 2016).
For instance, studies related consumption of PCPs, remarkably parabens, to higher breast cancer occurrence (Darbre and Harvey, 2014). Parabens are a homologous series of hydroxybenzoic acid produced by esterification of the C4 position (including methyl-, ethyl-, propyl-, and buthyl- as radicals). Parabens are synthetic, highly stable, and low-cost compounds, attractive features for industrial applications. As they inhibit fungal and yeast growth and activity, they are employed in cosmetics, pharmaceutical and food industries as antimicrobial preservatives (Błędzka et al., 2014; Haman et al., 2015). Usually, methylparaben (MeP), ethylparaben (EtP), and propylparaben (PrP) are the most commonly used and therefore the most detected parabens in water samples and in the effluent of wastewater treatment plants (WWTP) (Li et al., 2016; Santos et al., 2016).
Other popular PCP is triclosan, a diphenyl ether of high solubility with antiseptic properties. It can be found in soaps, deodorants, body washes, body moisturizers, toothpastes, and plastics, due to its broad-spectrum bactericidal activity. It is also an endocrine disruptor and is one of the most detected organic compounds in wastewaters, usually in high concentrations (Montaseri and Forbes, 2016). Due to the potential of bacterial resistance, monitoring and risk assessment of triclosan is suggested and encouraged, and its addition to pollutant priority lists (Huang et al., 2016; Montes-grajales et al., 2017).
One of the concerns related to the presence of triclosan in aquatic environments is its capacity to absorb solar radiation, undergo photodegradation, and generate chlorinated byproducts and dioxins, which are extremely toxic (Aranami and Readman, 2007). Moreover, the use of chlorine for disinfection in water and WWTP might trigger triclosan degradation and consequently the production of dioxins. Dioxins are proven endocrine disruptors and their toxicity increases with the number of substituted chlorine molecules (Aranami and Readman, 2007; Buth et al., 2009; Montagner et al., 2014).
The majority of environmental monitoring pollutant priority lists takes into consideration the risk to public health and aquatic biota effects These priority lists are established according to the risk that each compound engender to studied species (Guillén et al., 2012). Environmental risk assessment is defined based on two factors: event occurrence probability (namely, the exposure to the target compound); and the severity of such event (Hernando et al., 2006). The exposure implications to each compound are intrinsically related to their toxic properties. Europe, the United States, Japan, and China produced large amounts of data concerning PCPs. However, little is known about the presence and behavior of these substances in subtropical aquatic environments. Data scarcity on the occurrence of such constituents prevents an adequate estimate of PCPs presence and its associated risks. It also makes it difficult to establish priorities in terms of monitoring these compounds in subtropical countries, since characteristics of consumption, surface water pollution, and climate differ from one region to another.
Therefore, the aims of this study were (1) to investigate the occurrence and temporal variation of four parabens and triclosan in the Upper Iguassu Basin, located in the south of Brazil; and (2) to assess potential risks to aquatic organisms, computing the hazard quotient (HQ) of each compound.
Materials and Methods
Study setting
The Iguassu River is the largest river in Paraná State, with an extension of 1,275 km. It drains an area of 70.799 km2 and its sources are located in the Metropolitan Region of Curitiba, state capital. According to Köppen classification, the climate of the area is humid subtropical, characterized as Cfa. The temperature does not show large variation, and although there is no dry season, in summer the rainfall often presents a peak, as result of seasonal convective storms. The intense rainfall during the period of December to March causes increase of river flow, frequently causing floods in urban areas.
The Upper Iguassu basin reservoirs provide potable water to the population of Curitiba and metropolitan area (CMA). The CMA area is composed of 14 municipalities (IBGE, 2010), with 3 million inhabitants. Three watersheds in the Upper Iguassu basin were chosen as the object of study, due to their importance as regional drinking water supplies. Sampling was conducted on three of its rivers: Atuba (AT1, AT2, AT3, and AT4), Belem (BL1, BL2, and BL3), and Palmital (PA1, PA2, and PA3), depicted in Fig. 1. Further information concerning the watersheds is in Table 1.
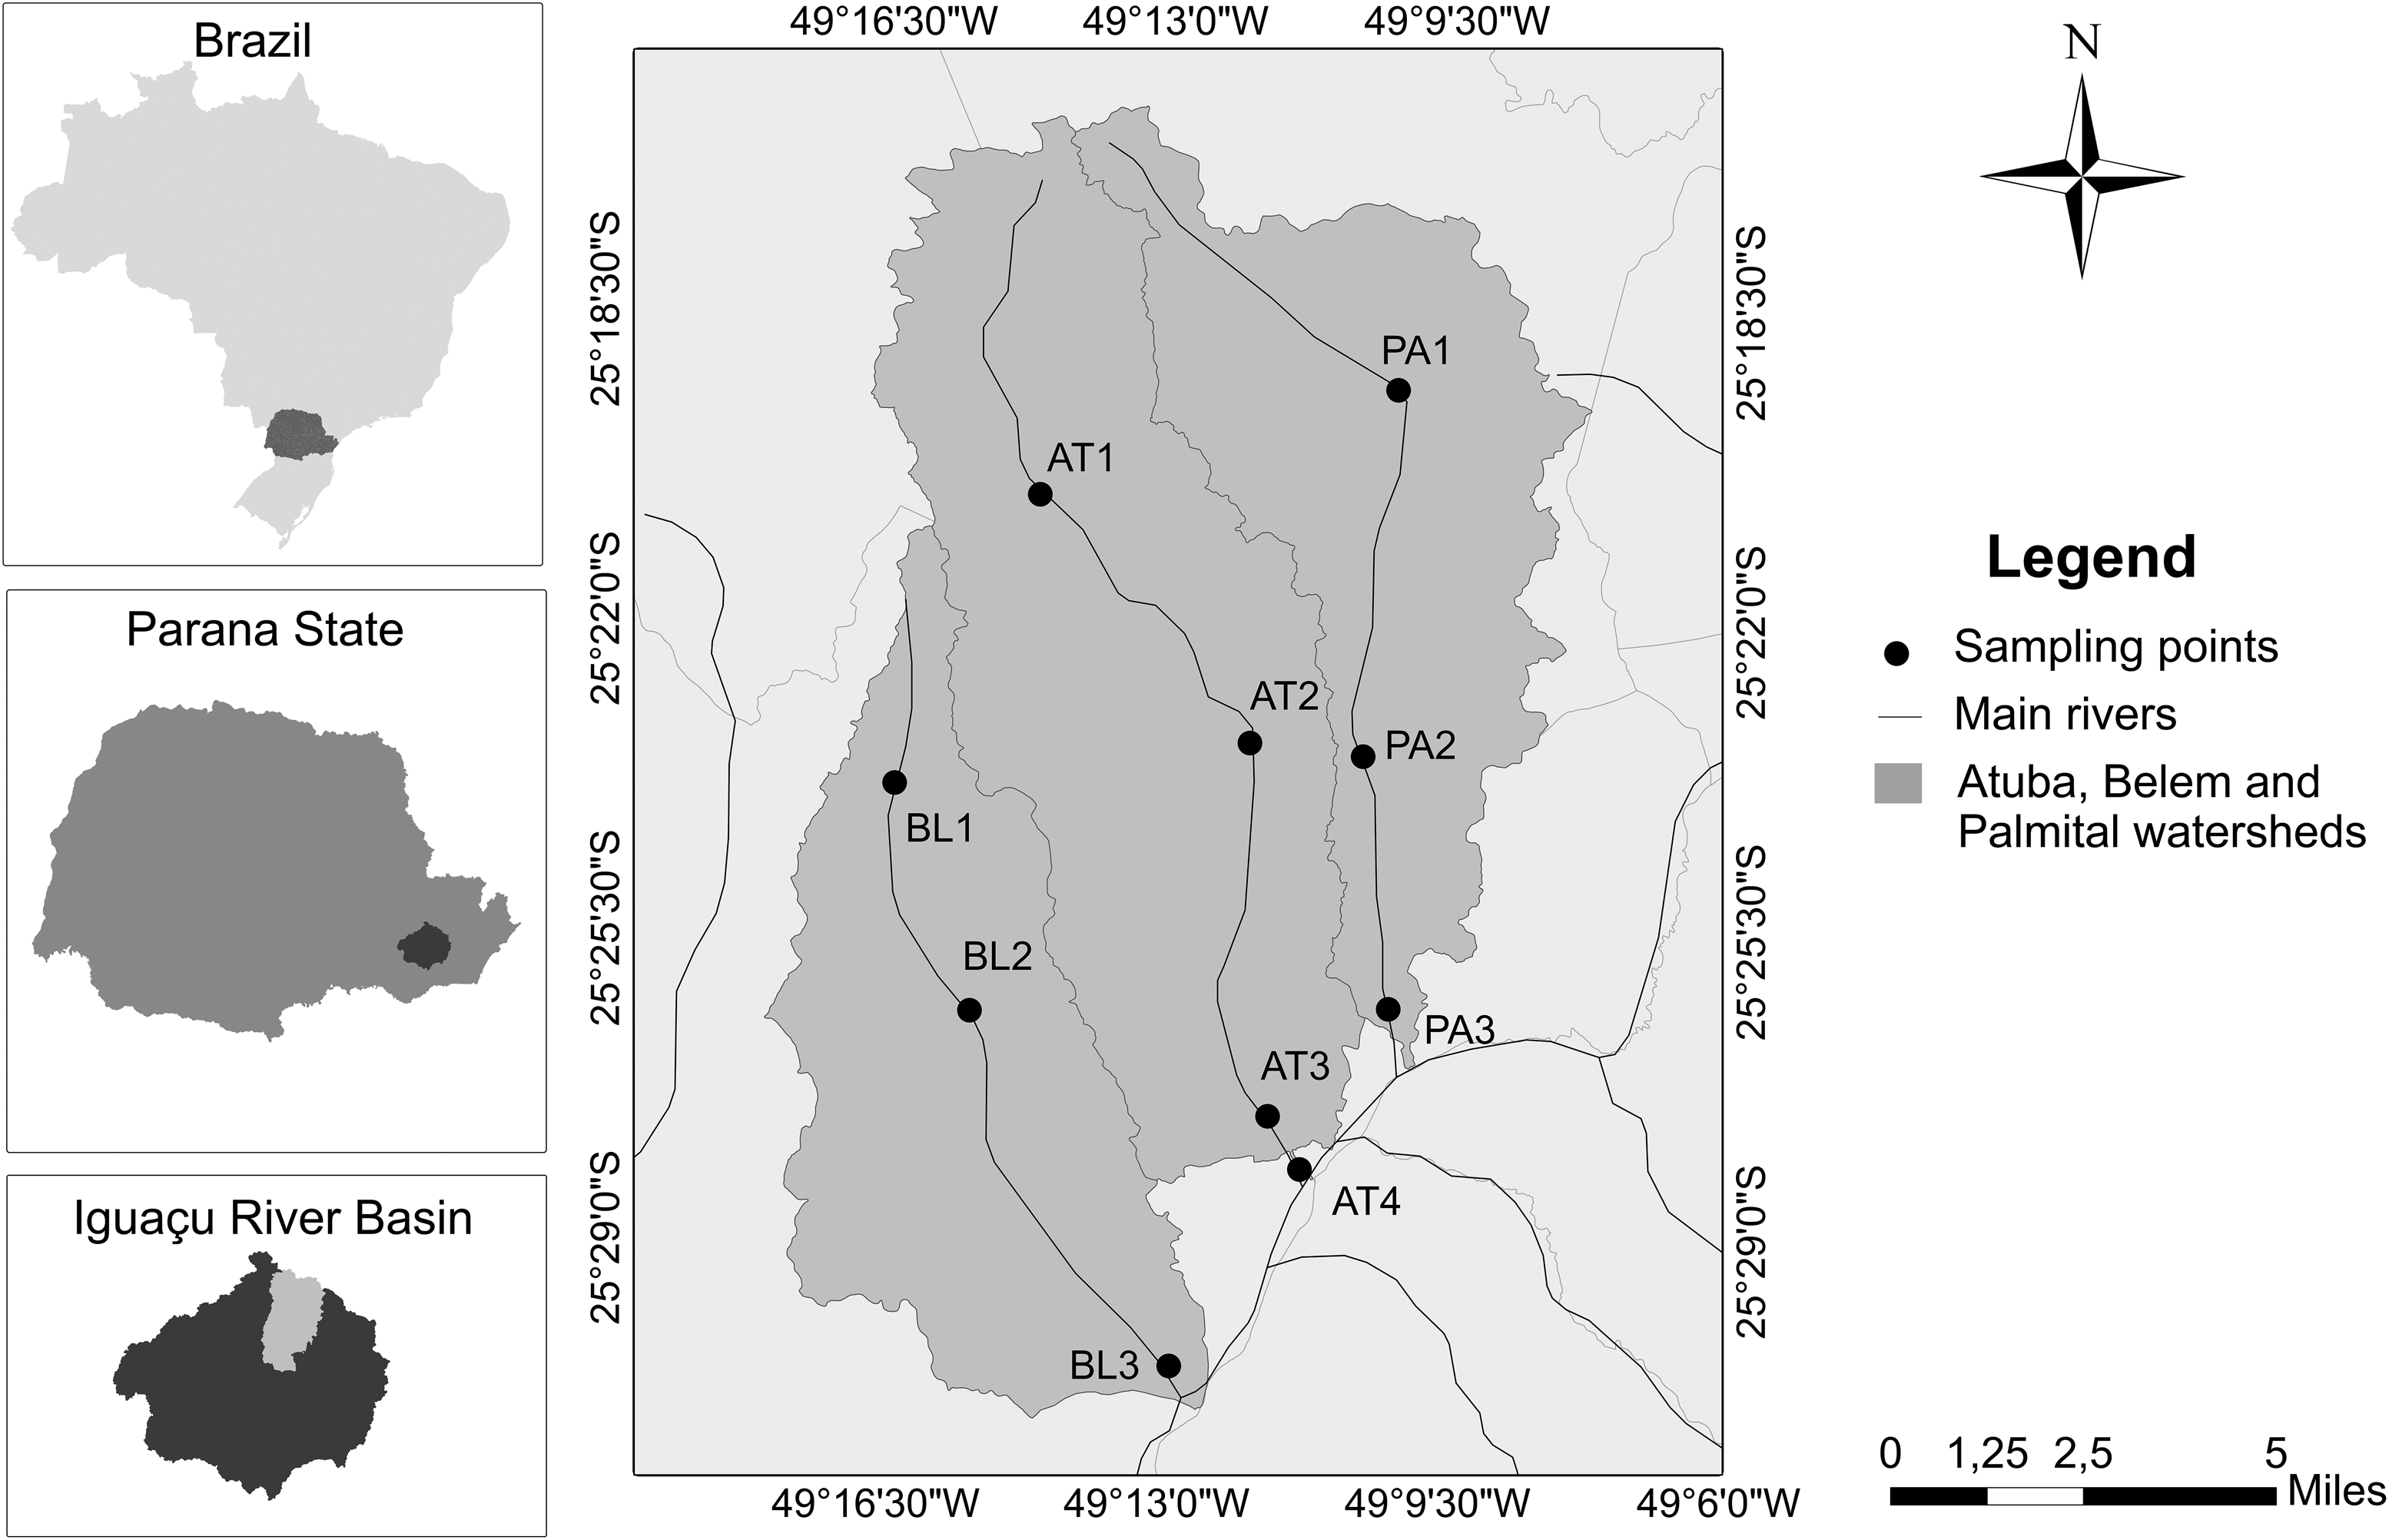
Localization of sampling points in upper Iguassu watershed.
Source: Mizukawa et al., 2017.
BL1 is the first sampling point after the source of the Belem River, and the least exposed to anthropogenic influence. Sampling point BL2 and BL3 are located in densely populated areas, with lack of infrastructure and an old and inefficient sewage collection system. As for the Palmital River, PA1 is located in a rural area inside the municipality of Colombo, while PA2 and PA3 were located in densely populated areas inside the municipality of Pinhais, with insufficient sewage collection and treatment system. In the Atuba River, AT1 is located in the municipality of Colombo, while AT2 is located on the border between the Curitiba and Colombo. Sampling point AT3 is situated on the Curitiba and Pinhais border. It is a densely populated area with many low-income inhabitants. AT3 is also located upstream the Atuba Sul WWTP, while sampling point AT4 is downstream the WWTP, receiving the effluent of the WWTP.
All detailed information about the sampling points can be found in the Supplementary Data. (Supplementary Table S1.
Analytical methodology
Analytical standards of MeP (≥99%), EtP (99%), PrP (≥99%), buthylparaben (BuP, ≥99%), triclosan (≥97%), and N,O-Bis(trimethylsilyl)trifluoroacetamide (BSTFA) + 1% trimethylchlorosilane (TMCS, ≥98.5%) were acquired from Sigma Aldrich (Steinnheim, Germany). The SPE HLB 12 mL cartridges with 500 mg of adsorbent phase were provided from Supelco (Bellefonte, PA). The solvents used in sample preparation and chromatography analysis, including methanol, hexane, ethyl acetate, acetonitrile, and acetone, were HPLC-grade, from Sigma Aldrich. Merck (Darmstadt, Germany) supplied hydrochloric acid (HCl, analytical grade) and porosity membranes of cellulose acetate were acquired from Millipore (Billerica, MA). Ultrapure water was prepared using a water purification system from Milipore. N2 and He gases (purchased from White Martins, Rio de Janeiro, Brazil) were 5.0 purity grade.
Individual standard stock solutions were prepared in methanol with a concentration of 100 mg/L, and stored in a freezer. Mixed stock solutions were prepared diluting the standard individual stock solutions. The mixed stock solutions were used to prepare the calibration solutions, in several concentrations.
Surface water samples were collected in five campaigns performed in April/2014, June/2014, October/2014, March/2015, and June/2015. They were collected in a Van Dorn water sampler and stored in 1 L amber bottles, previously decontaminated in a 5% v/v Extran detergent solution (Merck). The bottles were preserved in a temperature of 4°C in portable fridges, and transported immediately to the laboratory.
Water samples were filtered in 0.45 μm porosity membranes of cellulose acetate and subsequently acidified with HCl 6.0 mol/L until pH ≤3. For the solid phase extraction, HLB cartridges (with a capacity of 12 mL) were conditioned previously with 6 mL of the following solvents: hexane, ethyl acetate, methanol, and acidified ultrapure water (pH 3). The filtered samples (1 L) passed through the cartridges in a velocity of 6–8 mL/min, and were then vacuum dried. Subsequently, the cartridges were eluted with a mixture of 10 mL of acetonitrile and acetone (v/v 1:1), and then evaporated at 40°C in a TE-211 equipment from Tecnal (Piracicaba, Brazil). The evaporated cartridges were reconstituted with 1 mL of acetonitrile and transferred to 2 mL vials, preconcentrating the samples 1,000 times. Considering that some analytes are not volatile, to be analyzed by gas chromatography the samples must be derivatized. The derivatization consisted of a silylation reaction by the addition of 50 μL of BSTFA + 1% TMCS to 100 μL dry samples in inserts. The vials containing the inserts were placed in an incubator at 60°C for 30 min. The inserts were adjusted to 100 μL with ethyl acetate and the samples were analyzed by gas chromatography.
Analytical instrumentation consisted of an Agilent 7890A gas chromatography system (Palo Alto, CA), hyphenated to a triple quadrupole 700 mass spectrometer model equipped with an Agilent GC 80 automated sampler. Analyses were performed in a HP-5Msi silica capillary column—Agilent (30 m × 0.25 mm of inner diameter and 0.25 μm of film thickness). The temperature of the injection door was at 280°C and 2 μL of each sample were injected. The injection was performed in Splitless mode, keeping the Split valve closed for 1 min and a 50 mL/min of purge flow. A constant flow of 1 mL/min of Helium was used as carrier gas. The temperature of the oven was set to 100°C (maintaining this temperature during 2 min), followed by an elevation of 15°C/min until 180°C, 6°C/min until 270°C, and 5°C/min until 310°C, maintaining this temperature during 3 min. The resulting run time was of 33.33 min. Temperatures of the transference line and the ionization source were 280°C. Nitrogen was used as a collision gas in a flux of 1.5 mL/min.
Detection and quantification by MS/MS was performed in monitoring reaction mode. The most abundant transition was used for quantification and the following one was used for confirmation. The quality control parameters are present in Table 2. The method showed good recoveries (60.8–94.5%) and the limits of detection of the method (LODs—calculated for a standard deviation) ranged between 4.0 and 7.5 ng/L, while the limits of quantification (LOQs) were within the 13.4–24.9 ng/L range in a wide linear range for all compounds with good regression coefficients (50–100 ng/mL, R2 > 0.9904). Reproducibility and repeatability, expressed as coefficient of variation, had satisfactory values (<15%). Other detailed information is in Supplementary Data (Supplementary Table S2 and S3).
Linear range 50–100 ng/mL.
MeP, methylparaben; EtP, ethylparaben; PrP, propylparaben; BuP, buthylparaben; TCS, triclosan; RSD, relative standard deviation; LOD, limits of detection; LOQ, limits of quantification.
Risk assessment
The environmental risk assessment was performed according to the guidelines of the Environmental Risk Assessment of Medicinal Products for Human Use (Emea, 2006). It is based on the HQ, expressed as the ratio between the measured environmental concentration (MEC) in the sampling point and the predicted no effect concentration (PNEC) of an individual constituent [Eq. (1)]. Aiming to define a worst-case scenario, maximum detected concentrations were used as MEC (Ramaswamy et al., 2011; Kosma et al., 2014; Li et al., 2016; Molins- Delgado et al., 2016).
PNEC was calculated based on the effective median concentration (EC50) or the lethal median concentration (LC50) in acute toxicity tests, and no observed effect concentration (NOEC) in chronic toxicity tests of each compound in three representative trophic levels in the ecosystem: fishes, invertebrates, and algae. When available, bacteria and amphibians toxicity data were also employed. A literature review was performed, and the most sensitive values for each trophic level were used (acute and chronic toxicity data are show in Supplementary Tables S4 and S5). The values for acute PNEC and chronic PNEC were determined by dividing the EC50 (or LC50) and the NOEC values by an evaluation factor (EF) [Eqs. (1)–(3)] (Ferrari et al., 2004; Ginebreda et al., 2010).
The EF was applied following the guidelines of the Technical Guidance Document on Risk Assessment (European Comission, 2003). An EF of 1000 was applied to acute toxicity tests and an EF of 100 was applied to chronic toxicity tests (Sanderson et al., 2003; Park and Choi, 2008).
The classification criteria applied was the following: if HQ was equal or superior to 1, there is a high environmental risk; when the values were 1 < HQ <0.1, it indicated an average risk; and values lower than 0.1 do not imply any risks to the trophic level (Hernando et al., 2006).
Results and Discussion
Occurrence and seasonal variation of parabens and triclosan
Target PCPs were parabens (MeP, EtP, PrP, and BuP) and triclosan. In every sample analyzed in this research at least one of the parabens and triclosan were detected. Fig. 2 shows the variation of the measured concentrations during the five sampling campaigns for each river. MeP and PrP were the parabens detected with higher frequency and concentrations during the sampling campaign, reaching 3.59 and 2.05 μg/L. Usually, esters of lower molar mass are widely used by the industry due to their high water solubility, which explains the superior concentrations of MeP and PrP in surface water. The concentration ranges can be found in the Supplementary Data (Supplementary Table S6).
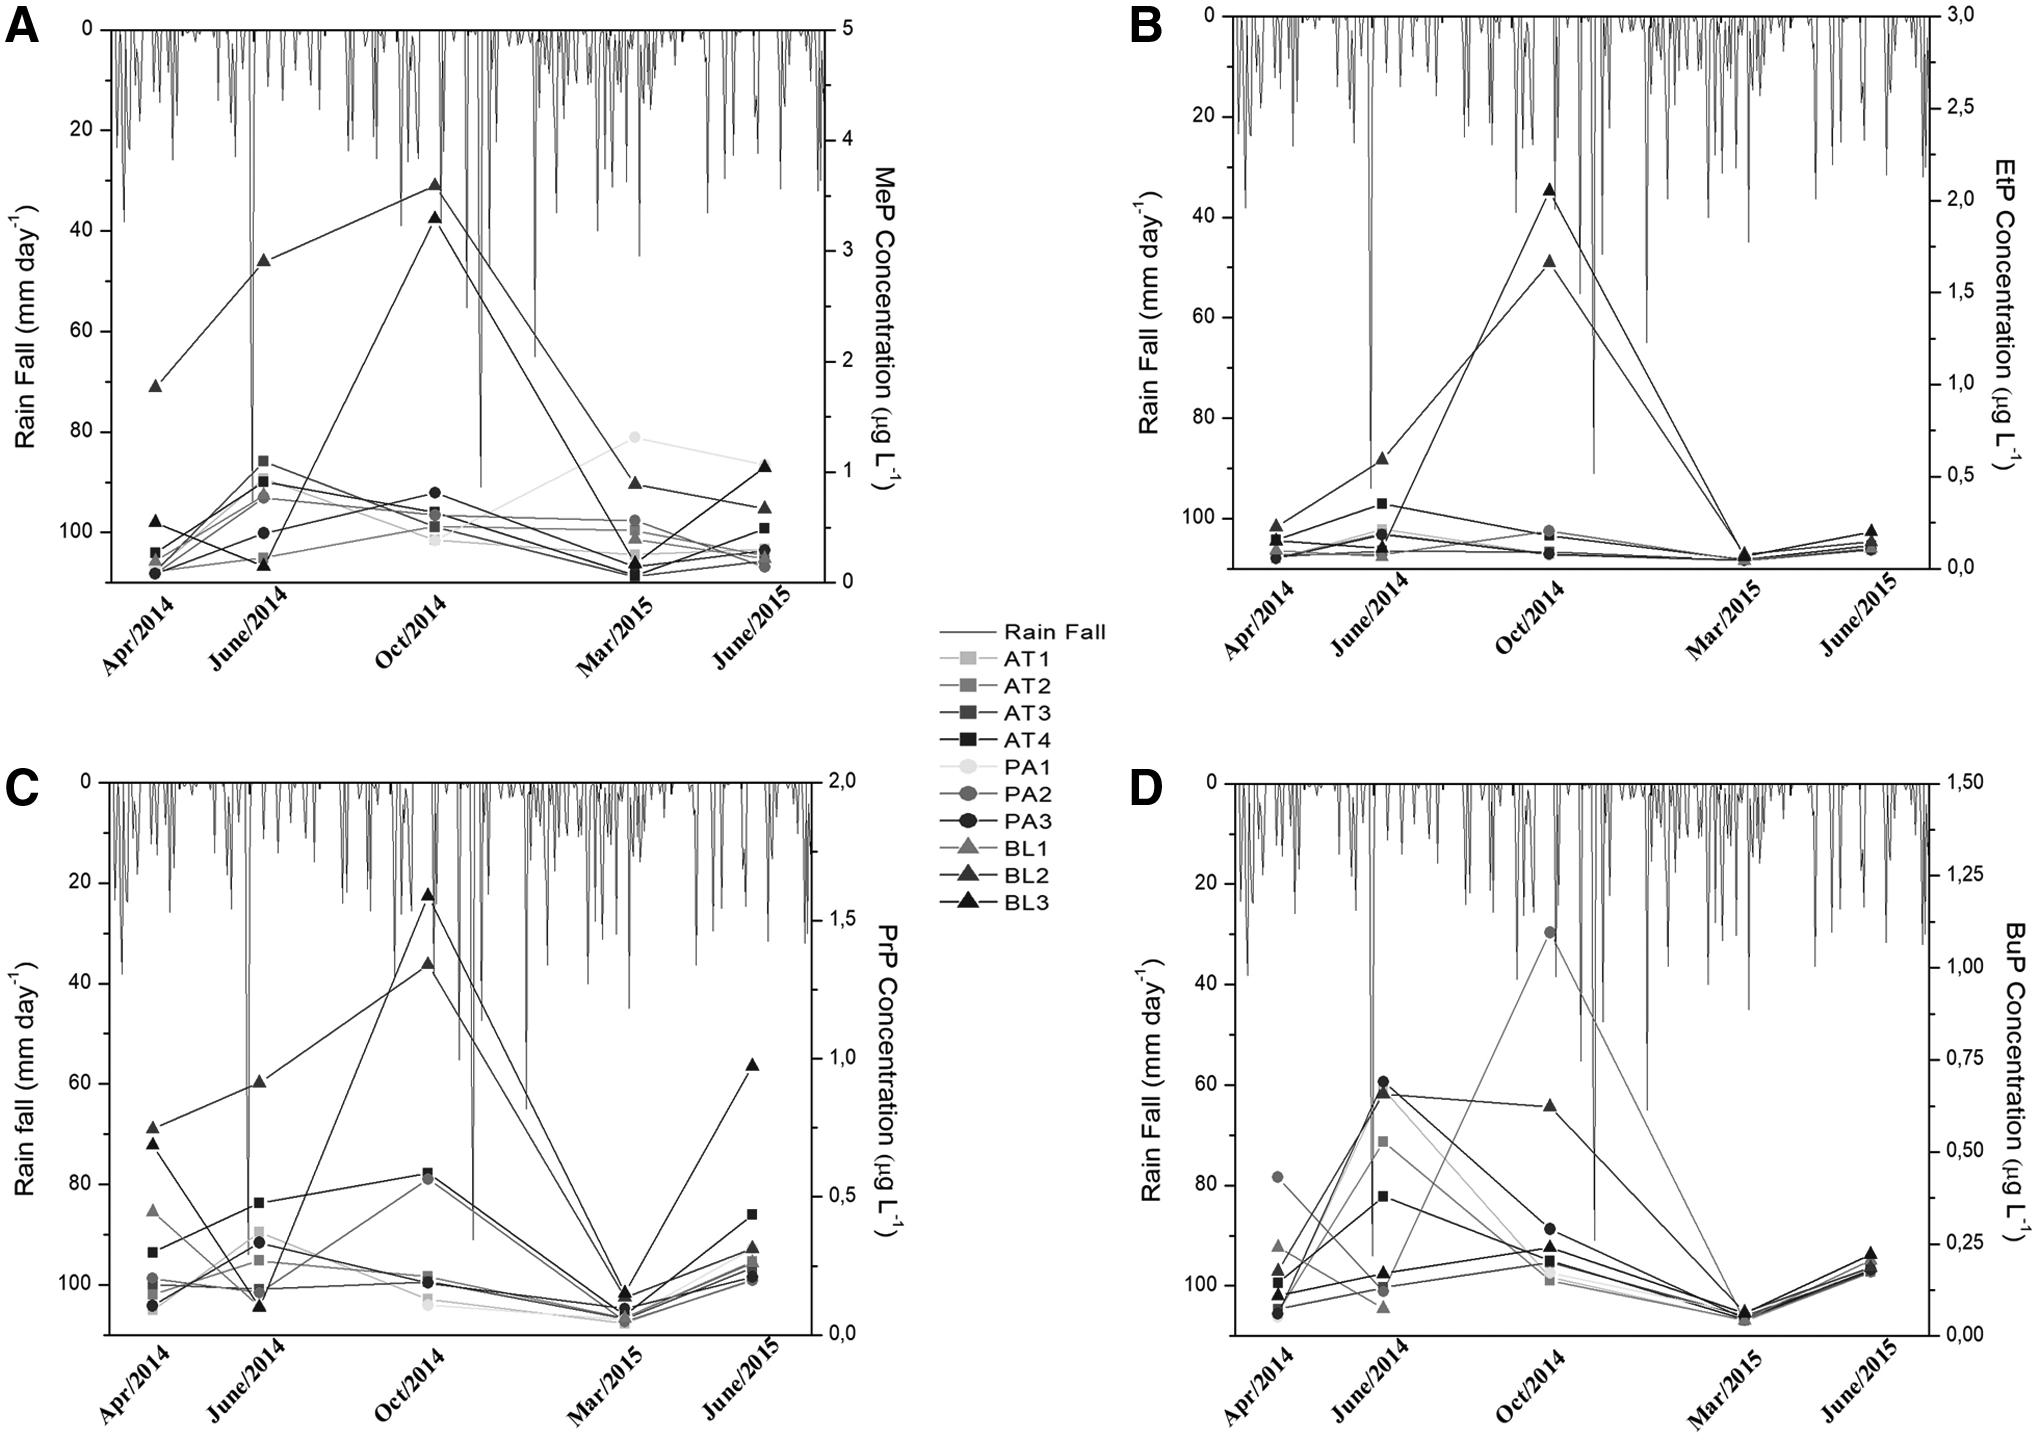
Concentration values of MeP
In a previous study about parabens in the Upper Iguassu basin (e.g., Santos, 2016) MeP and PrP were also the compounds detected with higher frequency. The concentrations reached 2.87 μg/L (MeP), 1.48 μg/L (EtP), 0.48 μg/L (PrP), and 0.28 μg/L (BuP), values compatible with the ones found in the present study.
In studies performed in further aquatic environments, the concentrations of MeP were also superior to concentrations of other parabens, although the ones found in this study were higher than the concentrations reported in the literature. Studies performed in Spain by Gorga et al. (2013) in the Ebro River, detected concentrations of nanograms per liter, reaching 13 ng/L of Ethylparaben. In Japan, maximum concentration values varied from 163 ng/L (BuP) to 676 ng/L (MeP) (Yamamoto et al., 2011). The only study with similar results was performed in China, where MeP and PrP reached values of 1.06 μg/L of MeP and 2.14 μg/L of PrP (Peng et al., 2008).
Detected concentrations of triclosan were also expressive. The compound was detected in 100% of the samples and the concentrations reached 10.3 μg/L (Fig. 3). Concentration values of triclosan detected in this study are superior to values found previously (Santos et al., 2016) in the Upper Iguassu watershed, where the maximum concentration value was 0.41 μg/L of triclosan. This comparison may reveal that the pollution levels of the basin are increasing, which should raise concern about water quality in the basin.
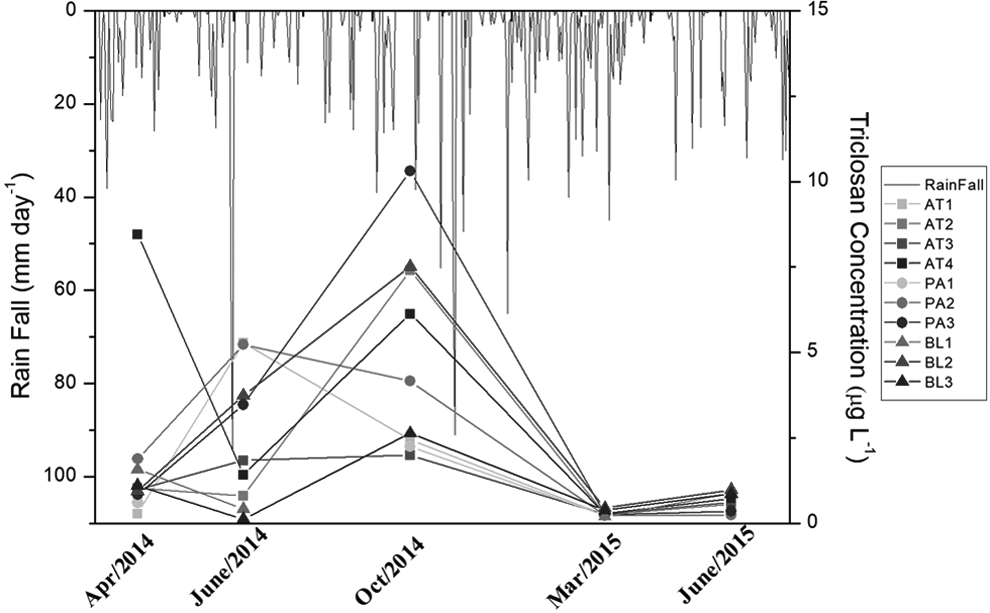
Concentration values of triclosan related with rainfall rates in sampling points during the five sampling campaigns.
In a global scenario, higher concentration values of triclosan are usually found in the nanogram per liter (ng/L) range, while in the Upper Iguassu watershed they were detected in the range of micrograms per liter (μg/L). In a study conducted in the United Kingdom, concentration values ranged from 5 to 24 ng/L (Kasprzyk-Hordern et al., 2008), while in China there was a variation from 35 ng/L to 1.02 μg/L (Peng et al., 2008). In a research performed in USA the concentration values of triclosan were inferior to 2.2 μg/L in superficial waters (Kolpin et al., 2002). In Singapore, concentrations detected ranged from 0.23 to 61.2 ng/L (You et al., 2015), and in Spain concentrations below 45 ng/L were detected (Kuster et al., 2008). In this study, the concentrations varied from 120 ng/L to 10.3 μg/L.
As for concentration variability between campaigns, highest concentrations were detected in October/2014 (C3). All the parabens and triclosan peaks were observed during this campaign. Another campaign that presented high concentrations was the one performed in June/2014 (C2). In Figs. 2 and 3 the range of concentrations for parabens and triclosan, along with rainfall rates for the monitored period are illustrated.
As mentioned before, the climate of the study area is described as Cfa, humid subtropical. Although there is no dry season, winter periods show lower rainfall rates, which may influence river flow and hence compounds dilution. During the period of May/2014 to October/2014, rainfall rates were lower, as seen in Figs. 2 and 3. It presumably influenced the detected concentrations of C2 and mainly C3, due to extended drought period, causing heightened peaks.
During summer season, rainfall rates are higher, due to intense convective storms, as seen in Figs. 2 and 3. Such storm events may also influence compounds dilution. In the sampling campaigns performed shortly after the summer period, April/2014 (C1) and March/2015 (C4), detected concentrations were usually lower when compared to other sampling campaigns.
This assumption was confirmed by statistical analysis of data. The sum of the normalized concentrations (mean and standard deviation) for each compound was calculated. The higher values, which indicated higher degradation levels, were found in sampling campaigns where accumulated rainfall (from 5 days before the campaign) was null (sampling campaigns 2, with sum of 52.90, and sampling campaign 3, with sum of 59.41). Sampling campaigns 1 and 4 had accumulated rainfalls of 13.0 and 7.4 mm, respectively. The sums of the normalized concentrations were smaller during these campaigns (20.28 and 3.75, respectively), indicating that rainfall contributed to smaller concentrations of PCPs in the studied rivers.
Consequently, the subtropical climate, mainly the rainfall regime, may seasonally influence water quality in subtropical areas. Even though the area shows no defined dry season, rainfall fluctuation interferes in the pollution levels of the basin.
Spatial distribution of parabens and triclosan
The Belem River showed higher levels of pollution and BL2 was the most contaminated sampling point, followed by BL3. In the section of BL1, where the anthropic influence is not expressive, lower concentrations were detected. The catchment area of the Belem River has the highest population density of the studied catchments, reaching 7867.7 residents/km2 and also has the lowest average flow (1.3 m3/s).
Sampling points BL2 and BL3 are in intensely urbanized areas in Curitiba, which is also the first established area of the city. This results in an old sewage collection system attending a great number of inhabitants. This combination led to constantly untreated sewage discharge into the Belem River, causing increase in concentrations of PCPs in the surface water. Sampling point BL2 showed concentrations of 7.51 μg/L of triclosan and 3.59 μg/L of MeP while BL3 reached 2.63 μg/L of triclosan and 3.29 μg/L of MeP, both in C3. Concentrations of EtP, PrP, and BuP were also high in points BL2 and BL3.
The Atuba and Palmital Rivers had overall lower concentrations. The Atuba River is the largest of the three rivers, has the biggest catchment area in this study, and a WWTP releases treated effluents in its course. It is located between points AT3 and AT4. Usually, compounds concentration in AT4 is far superior to the concentrations of AT3. Triclosan concentration in campaign C3 reached 8.43 μg/L at AT4. This suggests the applied treatment (upflow anaerobic sludge blanket reactor followed by dissolved air flotation) may not be efficiently removing these contaminants. Aerobic treatments showed higher efficient removal rates, like conventional activated sludge, where studies reached removal rates above 80% (González-Mariño et al., 2011; Błędzka et al., 2014; Li et al., 2015; Karthikraj et al., 2017).
Concentrations detected in the Palmital River were usually lower than the ones at the Atuba and Belem Rivers, with an exception of point PA3 at C3, which registered 10.3 μg/L of triclosan.
The most contaminated sampling points are located in intensely urbanized areas that lack infrastructure, which can result in direct disposal of untreated wastewater to rivers. Values detected in this study can relate to the discharge of WWTP effluent or raw sewage in the rivers, magnified by high urbanization levels in the study area. The lowest concentration values were detected in the sampling points located near the source of the rivers (AT1, PA1, and BL1). In these areas, urbanization is not so intense and the anthropic influence in the rivers is minor.
Risk assessment
The four most representative trophic levels in aquatic environments (bacteria, algae, invertebrates, and fishes) were investigated in this study, aiming to verify the environmental risk caused by emerging compounds. Data regarding EC50 were gathered from previous studies (the results are in the Supplementary Data), and the most susceptible values of toxicity to the organisms were chosen to calculate the HQ.
The results regarding HQ for the four trophic levels, stipulated a worst-case scenario are summarized in Fig. 4. Bacteria are the most susceptible group to parabens (EC50: 0.26–5.9 mg/L), which is expected due to its broad spectrum bactericidal activity (Li et al., 2016). However, only EtP presented a HQ above 1, the majority values to bacteria were beneath 1, which indicates a moderate risk (MeP and BuP) or no risk (EtP) to the studied ecosystems. Concerning other organisms, parabens offer moderate risk to invertebrates; however, they offer little adverse potential to other trophic levels. It is important to emphasize that parabens occur in complex mixtures in aquatic environments, and their synergetic effects can increase toxicity levels. In toxicity tests, the synergetic effects are not taken into consideration, which can underestimate the real risks to organisms (Cleuvers, 2003; European Comission, 2003; Gros et al., 2006; Li et al., 2016)
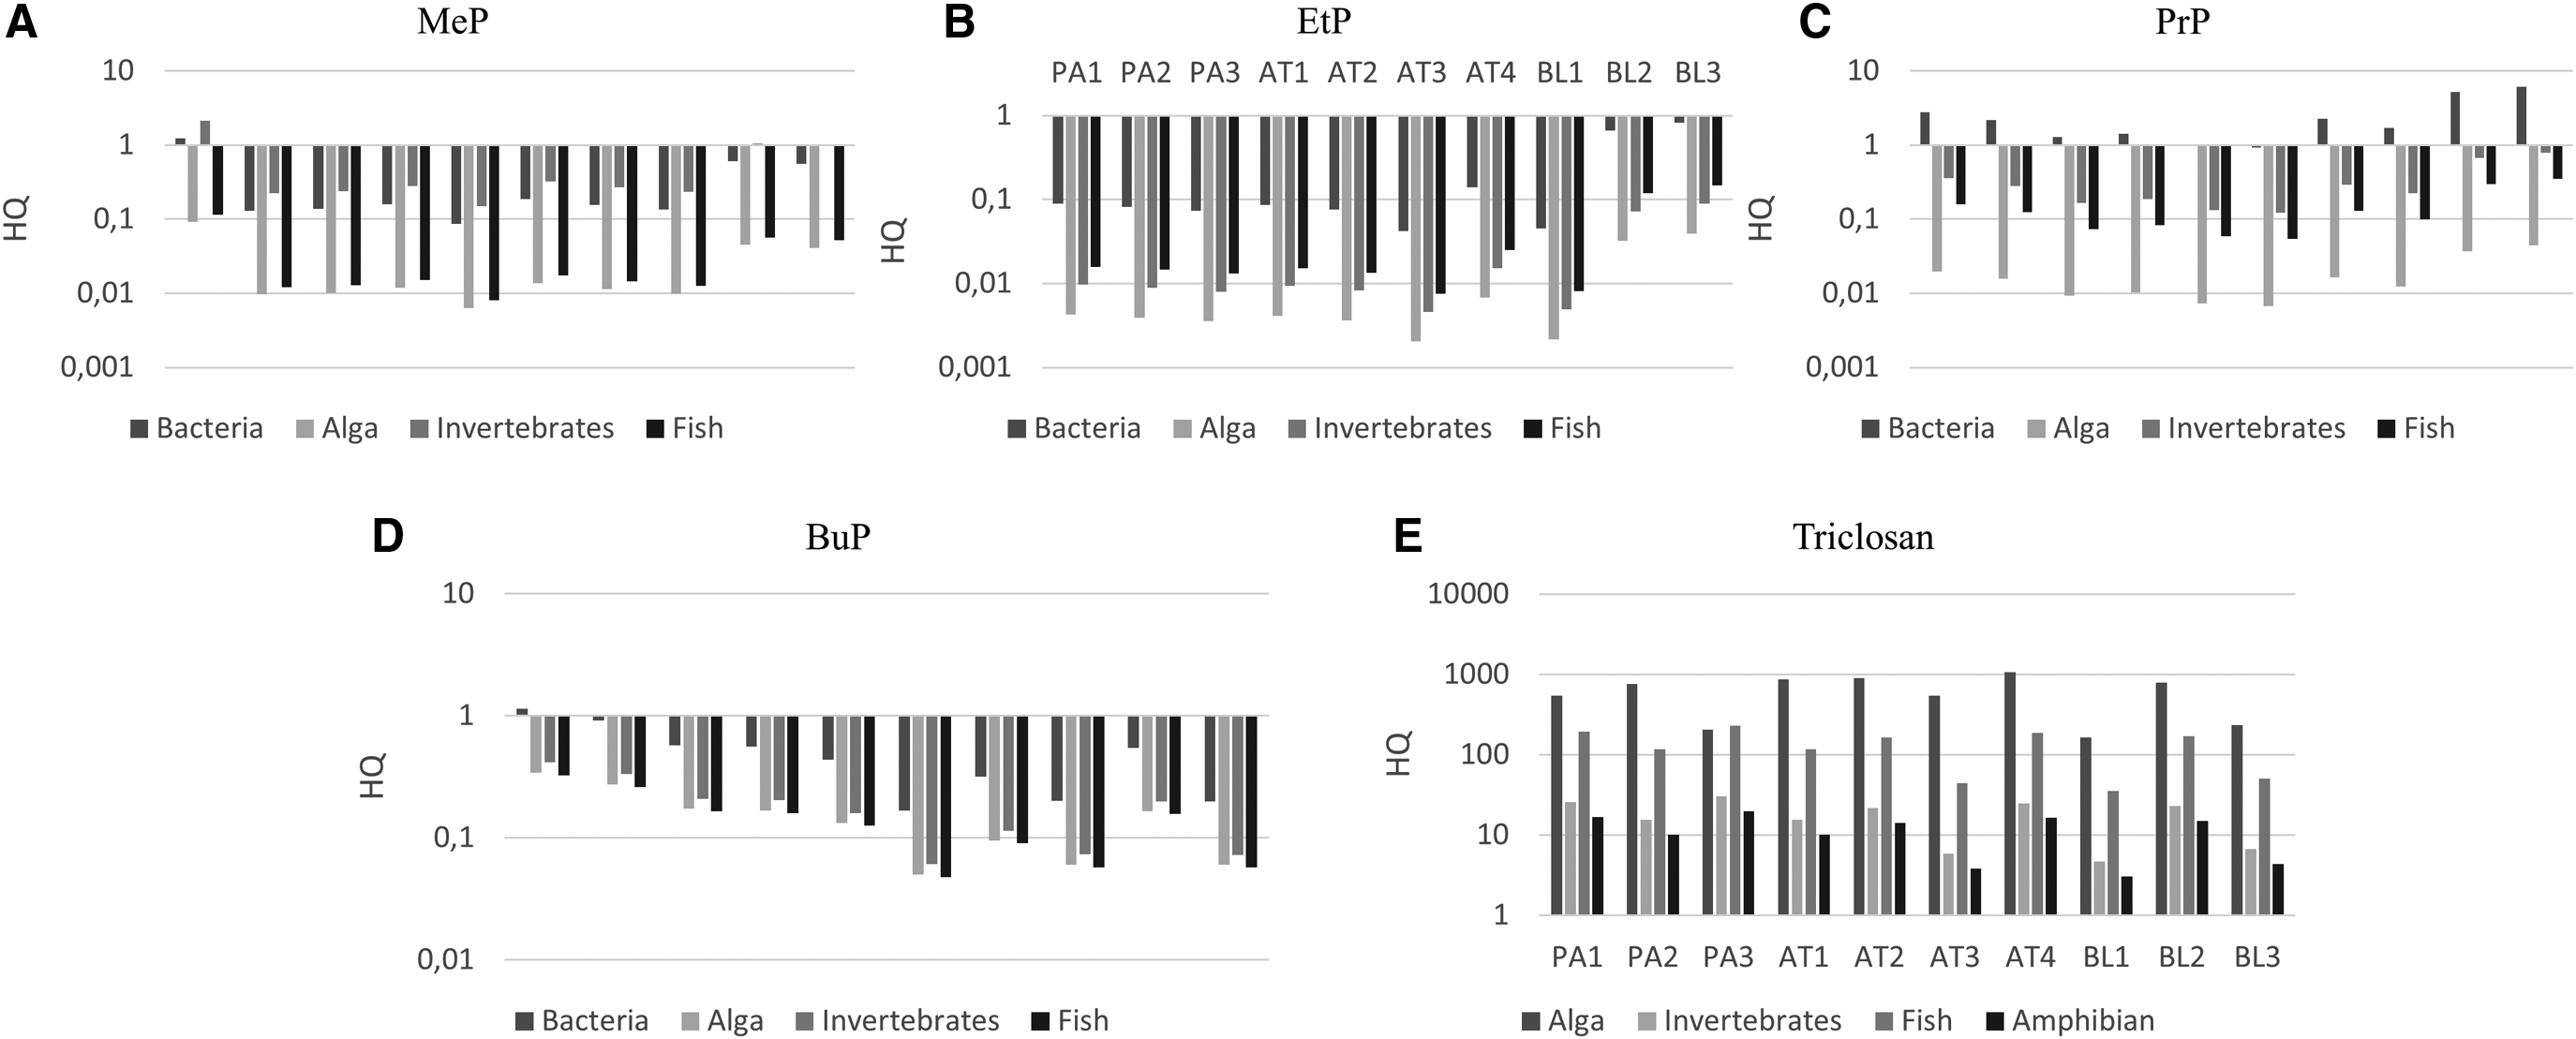
HQ to acute toxicity of personal care products in different trophic groups in upper iguaçu watershed.
Triclosan was the most important compound in terms of environmental risk (Fig. 4). It presented a high hazard risk (HQ >1) to the four taxonomic groups studied (algae, invertebrates, fishes, and amphibians). Studies show that triclosan can enter, immigrate, and persist in aquatic environments in a larger extension than expected. Moreover, its tendency to bioaccumulate and generate dioxins increases the concern regarding its potential impact on human health and on the balance of ecosystems (Von der Ohe et al., 2012). The risk assessment performed by other authors demonstrates that this compound must be prioritized when it comes to environmental monitoring, based on the PNEC values that were found (Wang et al., 2010; Von der Ohe et al., 2012).
The most sensitive values of NOECs of each contaminant (obtained from the literature) and the calculus of PNECc are in tables in Supplementary Data. The HQ values calculated to worst-case are demonstrated in Fig. 5. Results indicate high chronic risk to some of the investigated compounds, which implies a presumable significant impact in aquatic environments and their biota. Therefore, long-term exposure to compounds such as triclosan and BuP should have priority in studies and researches due to their high HQ. The taxonomic group most susceptible to chronic exposure is fishes, as there are moderate risks in the presence of parabens and high risks in the presence of triclosan.

HQ risk of chronic toxicity of personal care products in different trophic groups in upper Iguaçu watershed.
Conclusion
Results indicate that rivers are under a great anthropic influence, probably affected by domestic sewage disposed in the rivers. The Belem River was the most contaminated river, mainly at point BL2, in consequence of high population density in the basin and a lack of proper sanitation systems. The WWTP had an influece in the concentration of the emerging contaminants in the Atuba river, mainly triclosan. The values at AT4 were eightfold superior to concentration values upstram at sampling point AT3, upstream WWTP. In addition, annual subtropical seasonality of region and low rainfall rates during winter can influence and increase the detected concentrations. In areas where annual precipitation is low, or dry seasons are more severe, the concentrations may have even more heightened peaks. This would also be characterized as a worst-case scenario, which is important for risk assessment studies. Therefore, calculating the HQ of such compounds, mainly triclosan, is recommended in areas where the climate is arid, semi-arid, or where dry seasons are severe, such as Northeast Brazil or Southeast Asia. Furthermore, the need of toxicity tests considering synergetic effects and complex mixtures is emphasized, since they can cause greater risks to the environment and the biota.
Toxicological researches usually study species that are susceptible to contaminants to establish EC50/LC50 and NOEC. Other characteristics are also considered, like reproducibility, survival in laboratory conditions, and their cost. An evaluation of local species and specific toxicological studies are suggested to confirm the potential risks of parabens and triclosan in this environment.
Footnotes
Acknowledgments
Mizukawa acknowledges CAPES Foundation, Ministry of Education of Brazil, for the scholarship (Process No. 0137-14-6). MSDC thanks the financial support of CNPq, MCTI/CNPq/CT-Hidro (Process No. 404259/2013-8), the PPGERHA–Graduate Program in Water Resources and Environmental Engineering of UFPR, and the NIPTA–Interdisciplinary Nucleus of Research in Environmental Technologies. D. B. Ferreira and J. Antonelli are acknowledged for their assistance during the development of the article.
Author Disclosure Statement
No competing financial interests exist.
References
Supplementary Material
Please find the following supplemental material available below.
For Open Access articles published under a Creative Commons License, all supplemental material carries the same license as the article it is associated with.
For non-Open Access articles published, all supplemental material carries a non-exclusive license, and permission requests for re-use of supplemental material or any part of supplemental material shall be sent directly to the copyright owner as specified in the copyright notice associated with the article.