
Abstract
Abstract
In the alpine sandy lands of China, there are great peculiarities and regional differences in the erosion and deposition characteristics of straw checkerboards. Fencing life of straw checkerboards is primarily affected by the erosion depth change of each intrinsic part over several years and takes great importance in optimizing the structures of straw checkerboard barrier. By way of seasonal measurement of steel chisels in straw checkerboards with three sizes and each in three slope positions, yearly and seasonal sand depth and intensity were obtained to describe the erosion and deposition characteristics in each type of straw checkerboard from the year of 2012 to 2015. Simulated three dimensional concaves revealed that serious erosion always occurred in the center- and south-oriented parts of the large straw checkerboards in higher slope positions. In contrast, deposition obviously appeared in the north- and west-oriented parts of those smaller sizes and lower slope positions. Similarly, a large deposition intensity with a range of 80–120 kg/[m2·a] mainly exists in small-size and low-slope checkerboards and increased to two to three times compared with the erosive checkerboards in large sizes or higher slope. Winter and yearly erosion and deposition rates showed that the 1.5-m interval checkerboard on the middle slope would have the longest fencing life with ∼5 years, while the 1 m interval ones on the toe and the 2 m interval ones on the top had problems of overaccumulation and over-erosion, respectively, which restricted their lifetimes to 2 years. Thus, straw checkerboard should be allocated optimally according to the erosion and deposition characteristic. Generally, the medium size could be applied to all slope positions, while the small one and the large one were most suited to the top and the toe slope positions, respectively.
Introduction
S
Starting from the 1950s, straw checkerboard has been comprehensively studied and optimized in terms of material, specification, protecting mechanism, and ecology restoration (Xu, 1982; Chang, 2000; Wang and Zhen, 2002; Qiu et al., 2004). There was not sufficient research on the fencing life which determined the engineering availability and practicability, especially in some cold and windy areas, such as the Qinghai-Tibet Plateau (Han et al., 2000; Qu et al., 2005). Initially, Chen and Li (1987) had predicted that the protection longevity of the straw checkerboard was ∼4 years and found that the root of the straw would be completely decayed after 10 years. Yao et al. (2006) attempted to set a statistical formula for estimating the life span of the straw checkerboard. Primarily, the formulas were based on the wind-breaking and sand-fixing effect and reflected the influence of the size and height of the straw checkerboard. Dong and Wu (2006) chose two arid areas in the northwest (NW) of China, the Tengger desert and Kubuqi desert, to compare the fencing lives of different sand barrier materials with different sizes; overall, the protection time was limited to 2 years. However, the intrinsic change of erosion and deposition of straw checkerboard should be regarded as the principle factors for predicting the fencing life, not only focused on their macro protecting benefits. Moreover the way of evaluating fencing life needs more field observations and specific environment considerations in alpine sand lands than in arid deserts.
Typically, a larger size leads to deeper erosion, and a smaller size yields easier sand burying. Moreover, the top of a sand dune produces stronger encroachment than the toe slope position because the wind velocity increases with the slope degree and elevation rising. It is important to optimize the straw-checkerboard barrier structures and choose adaptive site conditions for improving barrier's lifetime and ecological benefits. In past researches, the size of 1 × 1 m was chosen to be the best size for its good function of blocking sand flow in arid and semiarid zones; however, this size was easy to trap in serious sand burying and cost depletion compared with larger sizes. In arid and semiarid areas of China, the straw-checkerboard base is decayed more quickly under a strong sand flow. Although the sand-fixing effect normally surpasses 80%, the fencing life would be less than 3 years in wet and cold alpine land (Niu, 1999; Zhang et al., 2007). To conclude, the specialty of the environment in alpine sand lands, which is obviously different from that in arid and semiarid areas, determines the erosive and depositional intensity and different fencing lives (Jiang et al., 2012; Zhan and Yan, 2012). Considering the insufficiency and high cost, the protection life of straw checkerboards should be prolonged through allocation of the appropriate sizes in the appropriate slope positions. Undoubtedly, the research of the erosion (deposition) characteristic and fencing life of straw checkerboard in alpine areas is meaningful for exploring the protecting mechanism and ecological benefits (Yang et al., 1997; Zhang et al., 2014).
This article aims to observe the erosion features and evaluate the fencing life of different sizes of straw checkerboards in different dune slope positions. According to a continuous observation of the erosion and deposition features, and intricate predictions of fencing life, an optimization of barrier sizes suited to slope positions will promote theoretic mechanism of barrier protection and direct the local sand-control work.
Materials and Methods
Study site
The study site, named Ketu Sand Land (WPSER), is located on the eastern shore of Qinghai Lake, northeast (NE) of the Qinghai-Tibet Plateau (Fig. 1). The altitude is ∼3,200 m, from the west to the east, the topography changes from sandy grasslands and stabilized sand dunes to mobile sand dunes, and the sand dunes are of crescent or pyramidal shapes. Being a connection knot of two climate zones, the eastern monsoon climate zone and the alpine climate zone, the average yearly temperature of this area is ∼0.7°C, the average yearly precipitation is ∼370 mm, and the average evaporation is 1483.9 mm. In terms of the wind environment, the strong west wind creates an aerial wind velocity of over 4 m/s, especially in winter and spring. Alternately, in summer and autumn, the dominant wind changes to be NE and southwest (SW) because of the lake effect, and the yearly change and the daily change of wind direction are both great (Zhang and Gao, 2007).
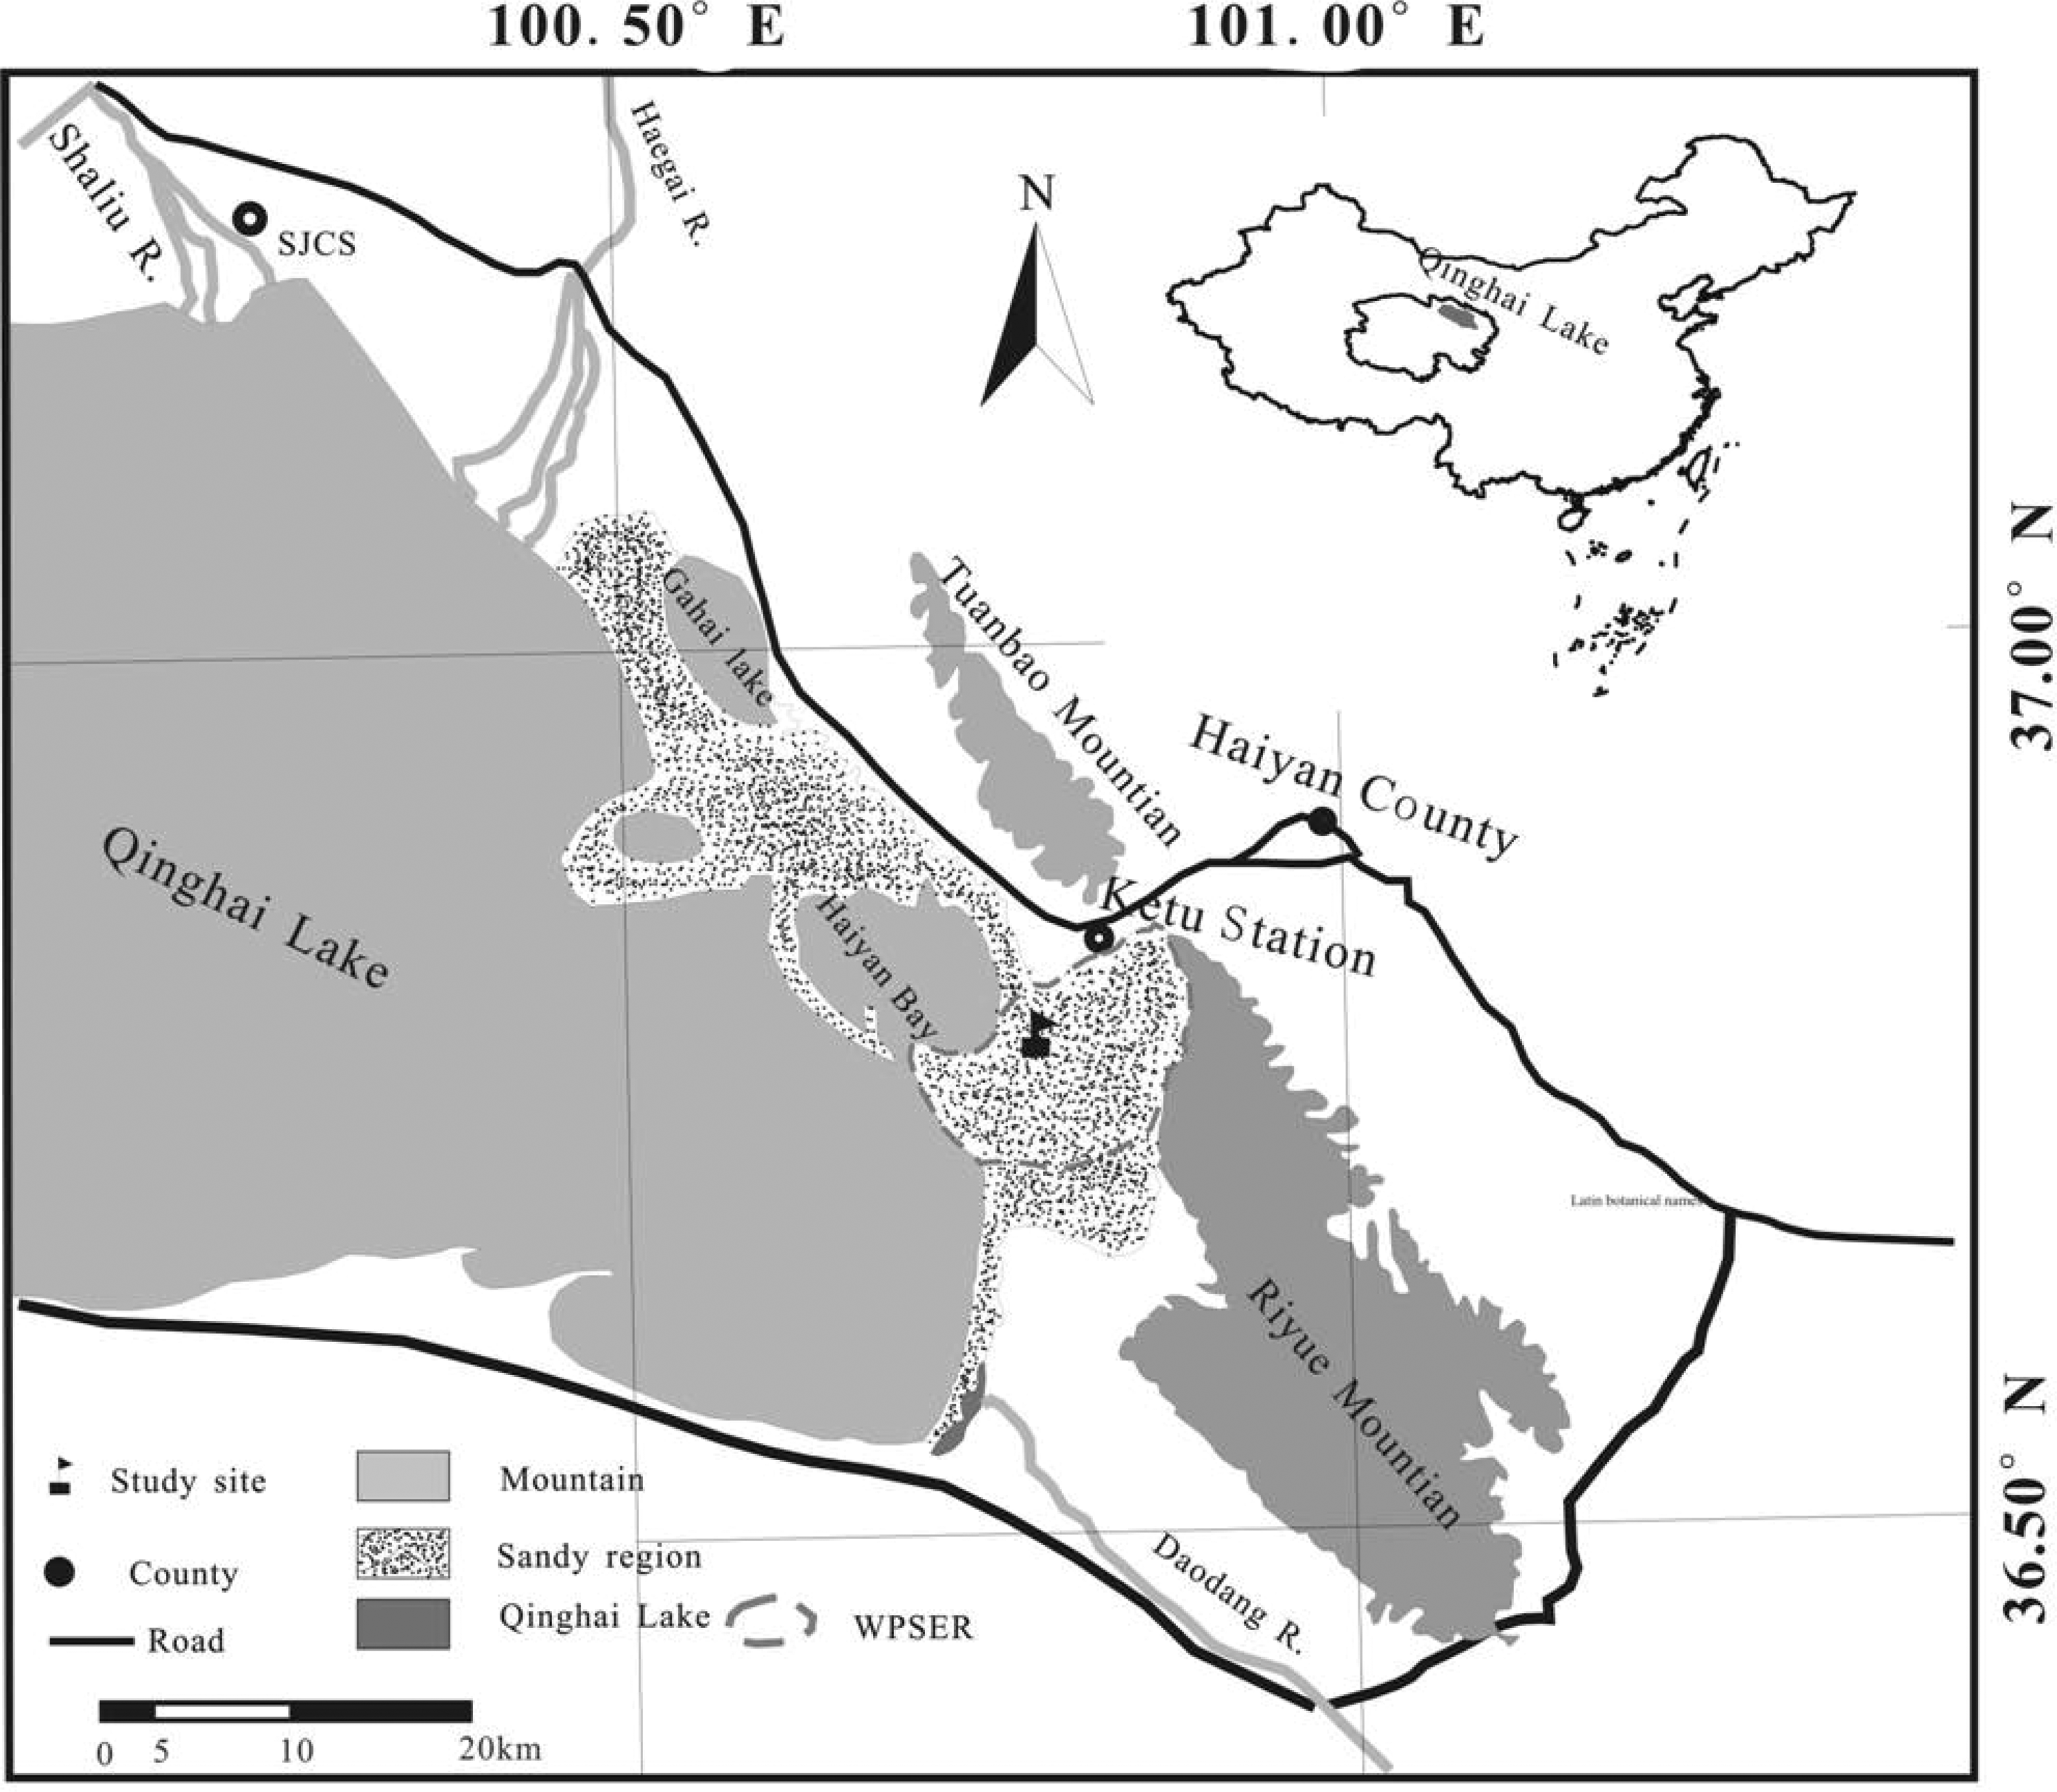
Study area of Ketu sand land.
A detailed experimental site, a long sand stripe stretching from north to south, was chosen from the west side of the Ketu Sand Land. We paved three types of straw checkerboards, including 1 × 1 m (A, small size), 1.5 × 1.5 m (B, medium size), and 2 × 2 m (C, large size) sizes, on the toe (X), the middle (Y), and the top (Z) of the windward slope. All of the barriers were made of sere straw, and half-hidden structured with 15 cm high above sand surface and 15 cm deep under the sand surface, and managed with a series of insurances, like ramming sand, trimming straw head, and watering for moisture. In all nine permutations of straw checkerboard experimental sites, there are almost no plants and other artificial measures. In addition, each site's soil structure is similarly composed of coarse and medium sand with a bulk density of 1.52 g/cm3.
Methods
Experimental methods
A 30 cm long steel bar was used to measure the sand depth (h, the positive value means sand deposition, and the negative one means sand erosion) (Dong and Wu, 2010), and there are 45 steel bars (each intrinsic part has about nine random points) equally distributed in each intrinsic checkerboard. In addition, there are four samples (AX1, AX2, AX3, AX4, …, CZ3, CZ4) of each type of checkerboard observed synchronously, and five intrinsic parts of every straw checkerboard, that is, the C, the NW, the SW, the NE, and the southeast (SE) parts, were analyzed to determine the main erosion and deposition positions (Fig. 2). In 2012–2013, we collected the sand depth data (averaged from the steel bars in corresponding intrinsic part) every 1 or 2 months and then selected four profiles and random measuring points in the concave section to simulate three-dimensional form (Zhou et al., 2009). By the method of dangling vertical measurement from a 15 cm high horizontal plane to the sand surface (d), the sand depth h (h = 15 − d) was used to reflect sand erosion and deposition. In the next 2 years (2013–2015), we continually measured the steel bar length eight times in every March and August; relatively, the seasonal wind frequency and speed in 16 directions were automatically recorded by the regional weather station (Vintage Pro2) and plotted with wind roses (Fig. 3).
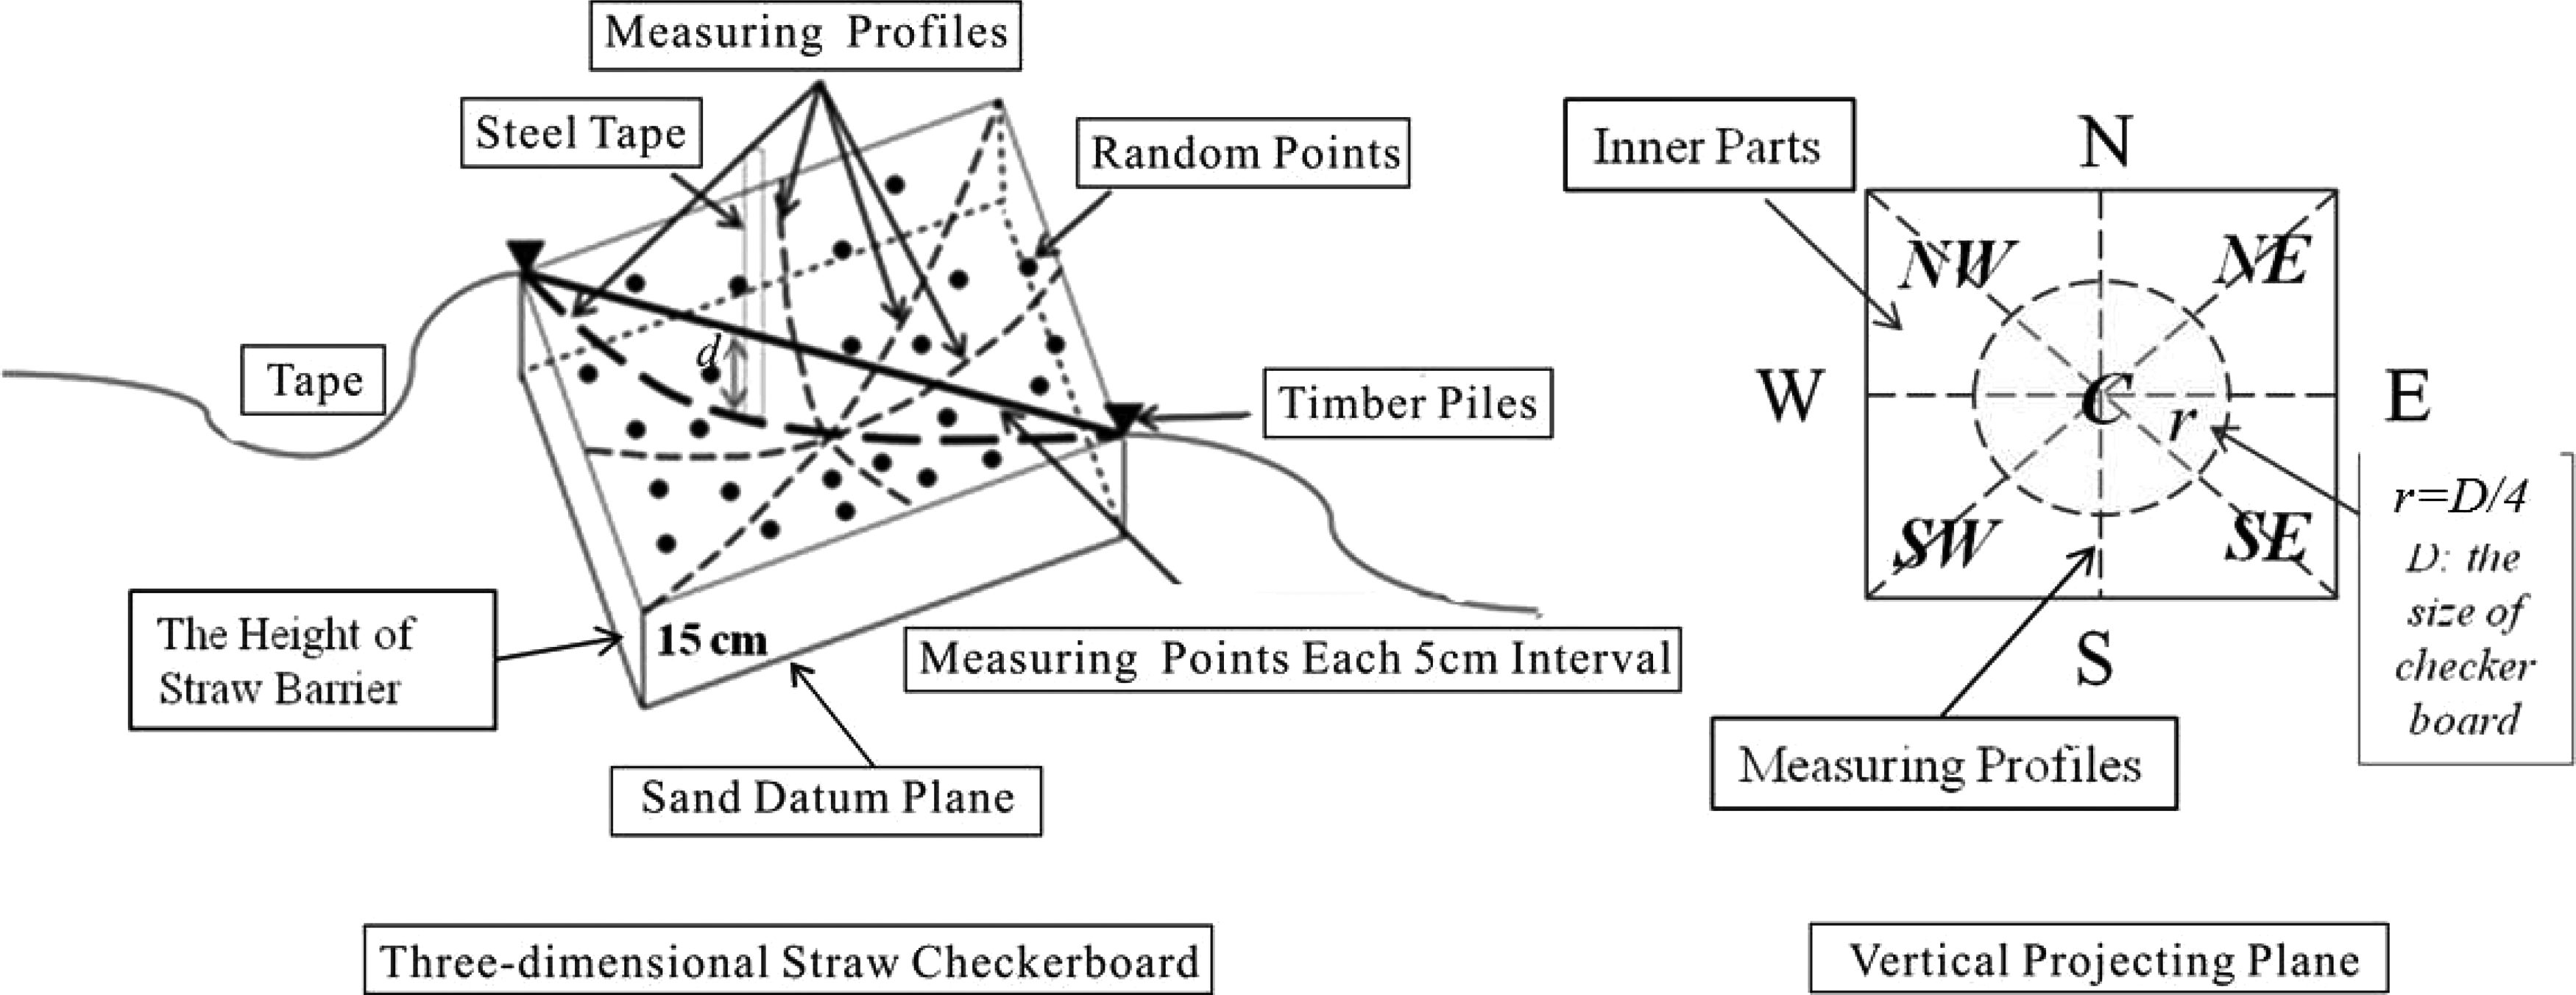
Method of sand depth measurement and intrinsic part distribution.

Wind frequency and wind speed change in 2012–2013.
Statistics
Erosion coefficient (P)
H is the maximum sand depth (cm) of the C part of the checkerboard. D is the interval (m) of each type of checkerboard. P reflects the stability of each concave surface, when it is close to 0.1; the checkerboard is more stable.
Erosion/deposition amount (Q)
Q is the net erosive/depositional sand amounts (kg), q (g/cm3) is the density of the surface soil, Si (cm2) is the area of each depth range taken up by the checkerboard (%), and hi (cm)is the average sand depth of the i range. This factor is managed by the geographic information system (GIS) software.
Erosion/deposition intensity (Qm)
Qm is the erosive amount per square meter (kg/m2), Q is the net erosive sand amounts (kg), and S is the area (m2) of each size checkerboard, the positive Qm denotes deposition intensity, and the negative one denotes erosion intensity (An, 2011).
Erosion/deposition rate (Qr)
Qr is the erosion/deposition amount per month or year, t is the time (one period), and h is the erosion depth in the related period (t), the positive Qr denotes deposition intensity, and the negative one denotes erosion intensity.
Fencing life (L)
Two methods of evaluating fencing life are used and compared. L1 is calculated through the erosion (deposition) rate according to the erosion and deposition depth change in different periods. According to the exposure and burial length and different erosion and deposition rates, it can be assumed that the effective fencing life is finished when the underground straw is essentially blown out or the upper straw is totally buried. Considering the different erosion/deposition rates in different parts of the checkerboard, the C part has the maximal erosive and minimal depositional rate, which is contrary to the surrounding part. Hence, for the depositional style checkerboards, the minimum fencing life (Lmin) is equal to 15 (the above barrier height is 15 cm) divided by the deposition rate of the surrounding part, and the maximum fencing life (Lmax) equals 15 divided by the erosion rate of the C part. For the erosive style checkerboards, the minimum and the maximum fencing life are equal to 15 (the buried barrier depth is 15 cm) divided by the erosion rates of the C part and deposition rate of the surrounding part, respectively. For comparison, L2 is calculated through the actual input sand and the output sand volume (Yao et al., 2006). A (m2) is the straw-checkerboard area, HS (m) represents the sand burying depth in some periods, and QD and QE are the net deposition volume and the net erosion volume in each unit (m3/a), respectively.
Results
Formation of surface concave
According to the average sand depth of four samples in each measuring point of straw checkerboard from 2012 to 2013, the wind erosion and sand accumulation states are intuitively presented under an erosion morphology simulation (Fig. 4). The color approaching dark red represents greater sand deposition, whereas the color shows serious wind erosion hazard when it changes to dark blue. Obviously, the toe-slope checkerboard with the small size is almost fully covered by sand, but the top-slope one with the large size is severely eroded in the C-to-NW part. In the intrinsic structure of each surface concave, the surrounding parts are depositional especially in SE and SW directions, and the C and north parts are comparatively erosive thus causing the concaves to undulate and produce an air vortex (Wang and Zhen, 2002).
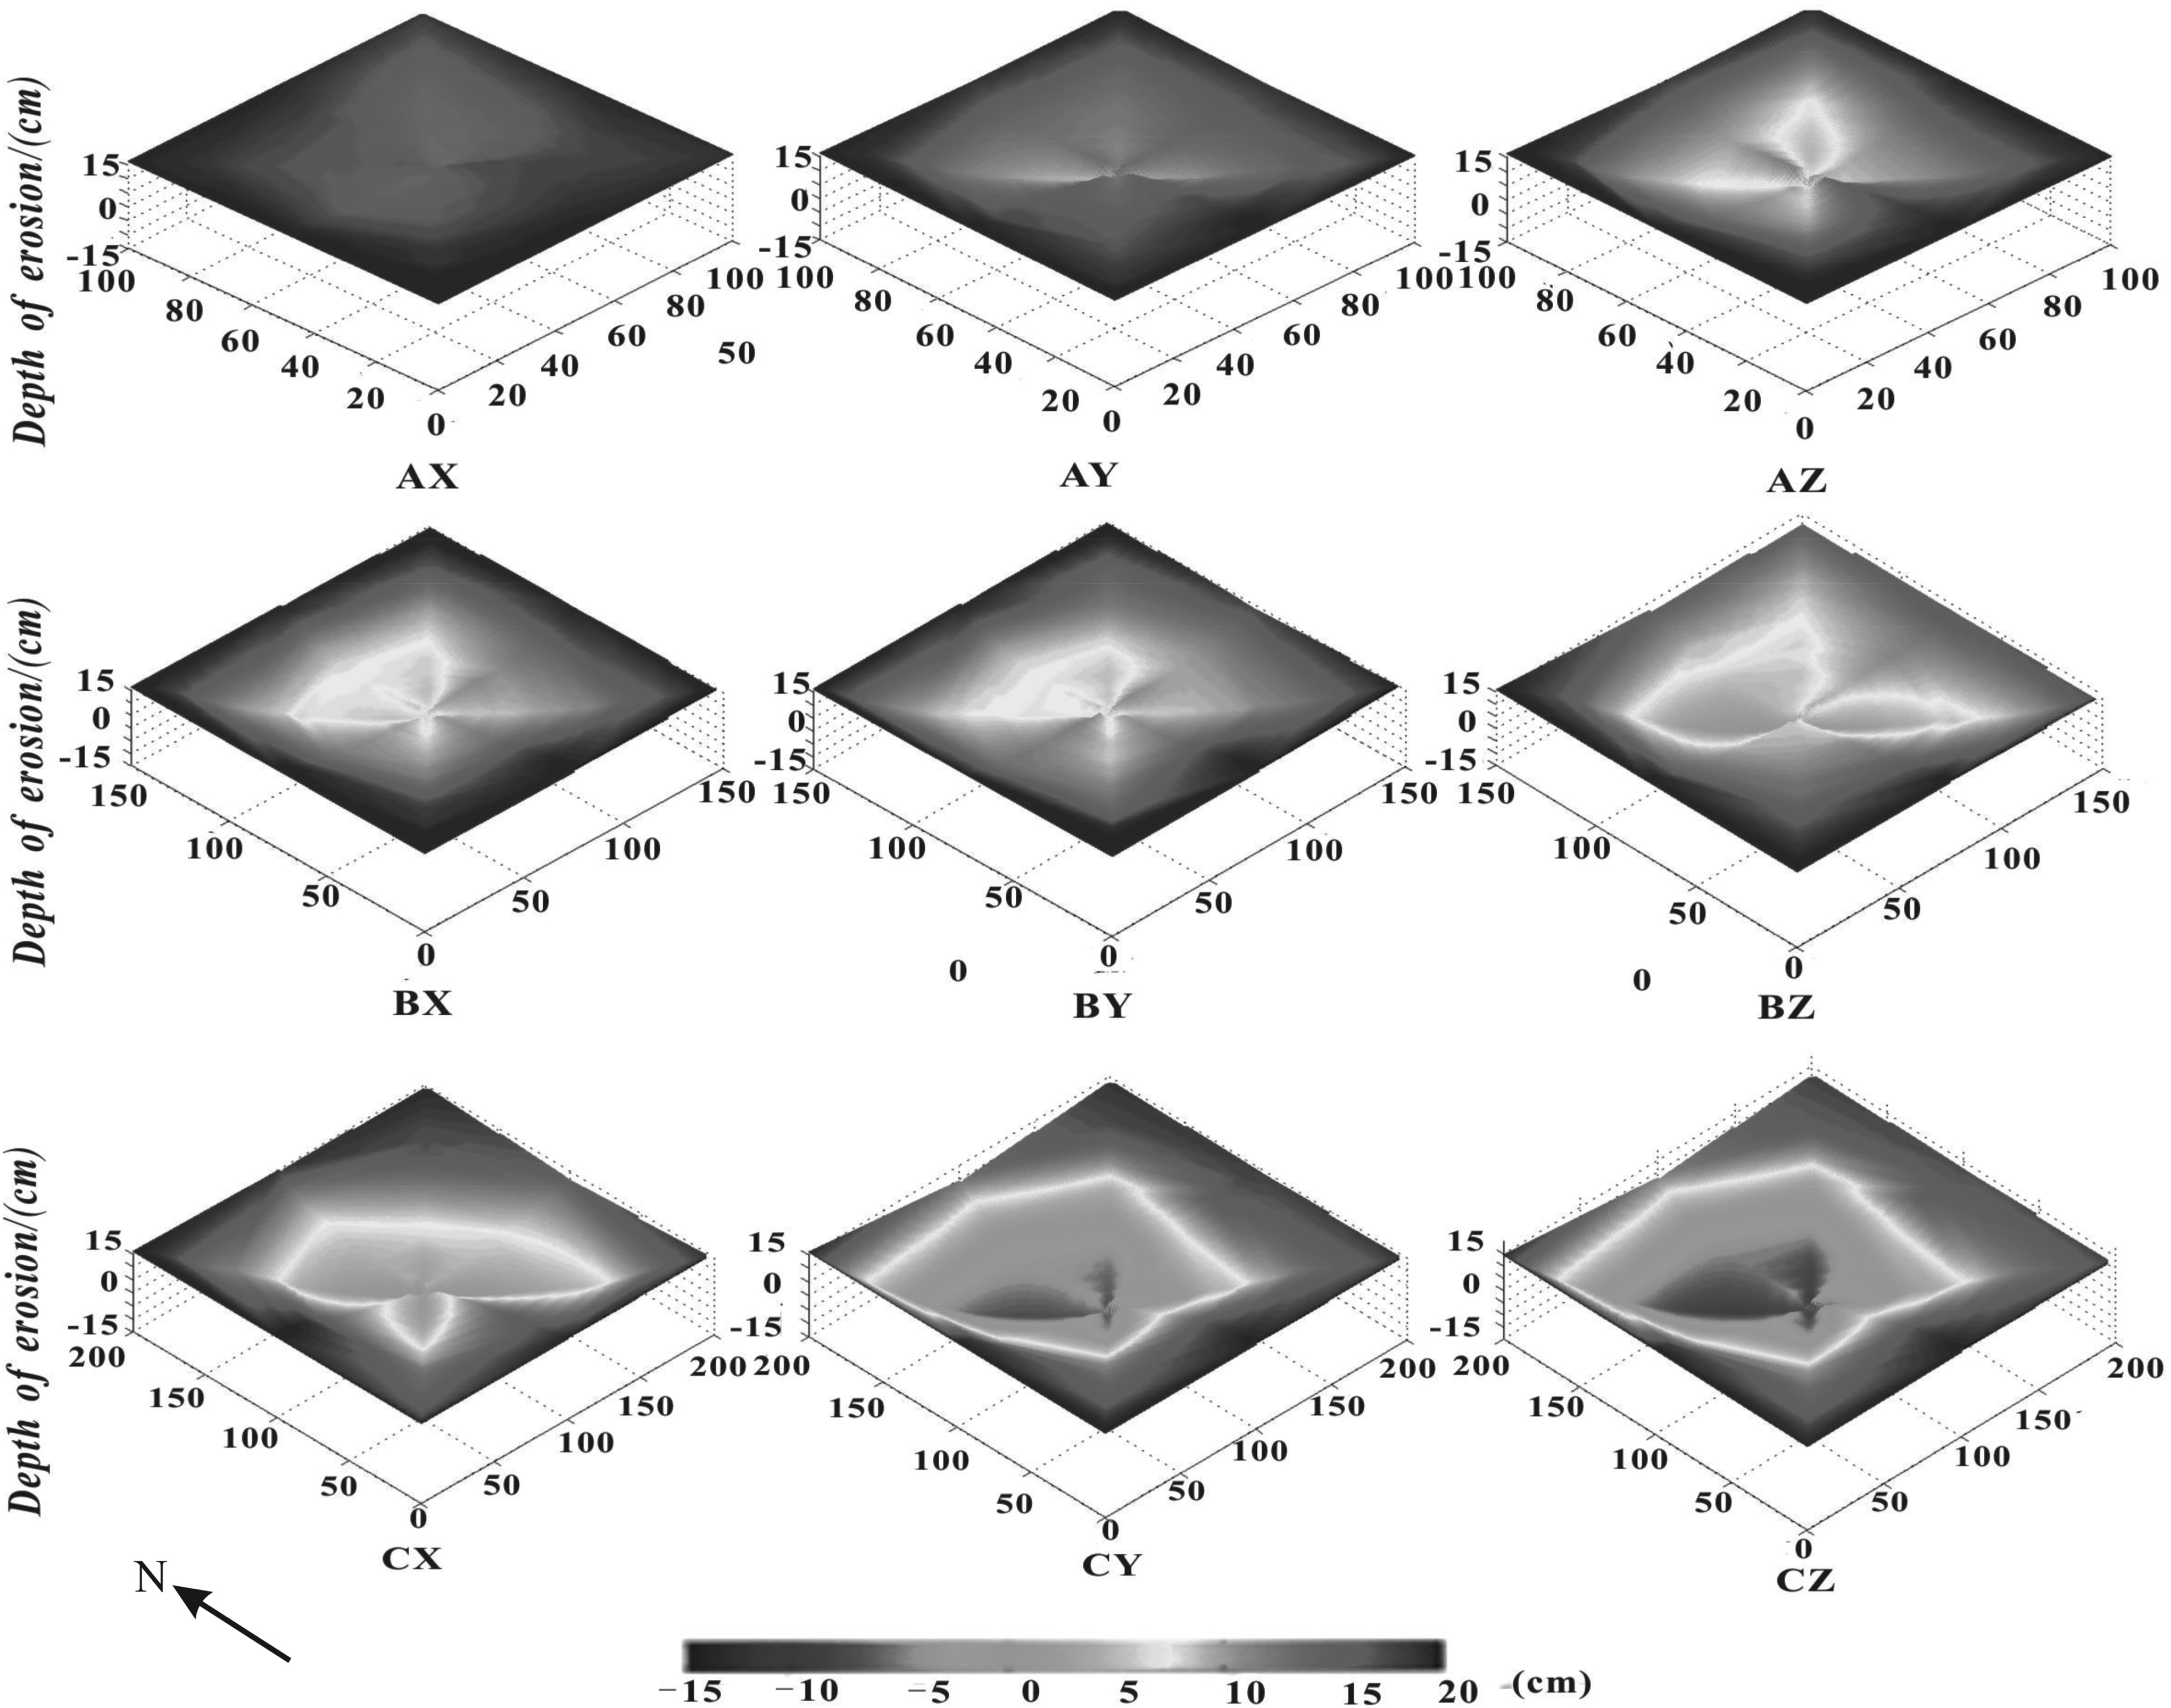
The erosion/deposition morphology simulation of straw checkerboards. A: 1 × 1 m; B: 1.5 × 1.5 m; C: 2 × 2 m; X, the toe slope; Y, the middle slope; Z, the top slope.
General erosion/deposition characteristics
In analysis of the sand depth, erosion coefficient, and erosion/deposition intensity, the erosion characteristics of straw checkerboards show some significant diversities in seasons, sizes, and slope positions. It can be seen that the mean sand depth decreases as the slope position rises and size increases, and the depth difference (h/cm) in sizes (7 < h < 8) is larger than that in slope positions (2 < h < 5), which can be explained by the depth range and significance of variance test of each type of checkerboard (Fig. 5). If the slope position is constant, the erosion depth of the large size reaches the maximum value, that is, 2.8–4.2 times deeper than the small size and 1.4–1.6 times deeper than the middle size. Under the same size, the top-slope position is eroded most, that is, almost 1.3–2.1 times deeper than the toe-slope position and 1.1–1.4 times deeper than the middle-slope position.

Sand depth of all measuring points in intrinsic checkerboards.
The stability of the concave surface of the straw checkerboard is normally determined by the erosion coefficient, and the benefits of wind prevention and sand fixing are usually reflected by the erosion/deposition intensity (Fig. 6). The erosion coefficient (P) reveals that the small size checkerboards in the top-slope position, the large size in the toe-slope position, and the middle size in all three slope positions are stable with a range of 0.09–0.10. Corresponding to the deposition intensity, the small size checkerboards and toe-slope ones are seriously sand accumulated (80 < Qm < 120), and the top-slope checkerboards with large size are severely eroded in the C parts (40 < Qm < 60). According to the t-test of One-Way Analysis of Variance (ANOVA), the slope variance is significant (p < 0.05) just in the small and large size checkerboards, and the size variance, except for the large and small size difference, is significant (p < 0.05) in other slope positions for all sizes.

Erosion coefficient and deposition intensity of each straw checkerboard.
Seasonal change of sand depth in different parts of checkerboards
Specifically, five intrinsic parts of each checkerboard are compared with regard to erosion depth, and various seasons, sizes, and slope position differences are tested in one-way ANOVA from Fig. 7.

The seasonal erosion depth change in different intrinsic positions of each straw checkerboard. Positions of a concave: NW, northwest; NE, northeast; SW, southwest; SE, southeast.
Season difference
In autumn, most of checkerboards are weakly eroded or accumulated in all intrinsic parts (−2 < h < 2), there into, large size and top-slope ones tended to be moderately eroded in the central part. In winter, all NW and SW parts of checkerboards suffer strong sand depositions (h > 4), especially for those of small sizes and the toe-slope checkerboards. In spring, the C, NW, and SW parts of each checkerboard are highly sand deposited, and other parts particularly in the middle and large sizes on the top of the slope are lightly eroded (−2 < h < 0). Generally, the entire year is depositional for small sizes and toe-slope checkerboards, and spring and winter are the main erosive seasons in the C and SW parts of the large-size and top-slope checkerboards. Moreover, some checkerboards are confronted with repeating weak erosion in summer and autumn and deposition in spring. For the middle-size and middle-slope checkerboards, there is little erosion difference throughout the whole year for almost every intrinsic part.
Size difference
Generally, large sizes are easily eroded, especially in the C part of checkerboard; the small size, middle size, and large size have light deposition (2 < h < 8), light erosion (−4 < h < 0), and strong erosion (−12 < h < −4) statuses, respectively. In detail, the surrounding parts of small-size checkerboards are always piled up with sands, whereas the NW and NE parts in some large-size checkerboards are seriously drawn out. Considering the D-value (difference between the highest value and lowest value) in all intrinsic parts, the small size is less than 3 cm, while the large size reaches 5–13 cm. The size differences of the toe-slope and top-slope checkerboards are significant (p < 0.05), mainly the seasons of winter and spring.
Slope position difference
Slope position differences are distinct (p < 0.05) both under the same season and size; all parts of those three sizes are deposited more greatly on the toe slope than on the middle and top slope in winter. In addition, the central part deposition depth of the toe slope is ∼2.3 times deeper than the middle slope and almost 3 times deeper than the top slope. Moreover, the surrounding parts' deposition depth ratio of these three slope positions reaches up to 34:5:12. For the top-slope checkerboards, every part of the checkerboards is eroded, and most were almost 1.7–15.1 times more than that in the middle slope position.
Erosion/deposition rate (Qr) and Fencing Life
Erosion/deposition rate
The erosion rate (Qr) in the winter differs from that in the entire year (Table 1), and the winter Qr of the surrounding parts is larger than the yearly Qr; for example, the winter deposition depth in the surrounding parts of the toe-slope and middle-slope checkerboards takes one-half or one-third of the entire year's deposition, and the winter erosive depth in the C part contributes 47–100% to the full year's erosion, that is, the winter Qr is 1.2–6 times larger than the yearly Qr. In terms with the large size in top-slope position, the time reaches 2.5. The strong erosion in the east-related parts in winter and autumn is complementary to the strong deposition in spring and summer, which is good to reduce the harmfulness of over-erosion or over-deposition, and thus, all sizes' winter Qr values are higher. With regard to the middle-and-toe slope checkerboards, the winter is an erosive season, but the spring and summer are depositional seasons because the leading wind direction changed adversely.
A: 1 × 1 m; B: 1.5 × 1.5 m; C: 2 × 2 m; X, the toe slope; Y, the middle slope; Z, the top slope.
Fencing life
Figure 8 shows a distribution of a rough fencing life (L1) of each checkerboard. Small-size checkerboards on the toe slope are seriously sand buried such that its fencing life is inclined to 1.1–1.5 years, while the large and middle sizes in the same slope position have medium erosions and depositions with lifetimes of 1.5–4.5 years. On the middle slope, the fencing life of the small size increases to ∼2 years, which is still shorter than the medium and large size with a lifetime range of 1.7–4.0 years. On the top slope, the large sizes' fencing life heavily decreases to 1.4–2.6 years, whereas the small sizes yield the longest fencing life at most reaching up to 3.5 years, compared with the other two slope positions. In addition, the middle sizes maintain a long fencing life of ∼1.9–3.6 years. In another statistical method (L2, Table 1), the fencing life of each checkerboard is marginally shorter than Lmax but confined to the conjectural range (L1). Similar to L1, the L2 changes from 1.0 to 2.5 years. In analysis of the size and slope position differences, the middle size is widely suitable for all slope positions; the small size on the top slope and the large size on the toe slope (L2 > 1.5) are also suitable. In contrast, the toe-slope small size and the top-slope large size will lose their basic functionality of wind and sand prevention within 1–1.5 years.

Maximum and minimum fencing life distributions of all types of straw checkerboards.
Future lifetime change
In the next 2 years, a continuous observation of every checkerboard's sand depth was developed from August of 2013 to August of 2015 (Fig. 9). Based on the primary depth in 2012, the C part depositional depth of the small size increased one-third to onefold, the surrounding sand burying all passed the fundamental depth of 15 cm after 2 years, and the middle size's erosive depth remained at approximately −3 to 1 cm, which was a state of weak erosion and weak deposition, but the large size was eroded, at most exceeding 20 cm, in the following 2 years. Examining the tendency of each checkerboard, the middle size would maintain a long fencing life, at least three additional years, and small sizes and large sizes were polarizing; the former accumulated gradually until it was totally sand buried, and the latter eroded faster to face the threat of base crawling. Moreover, the small size on the toe slope and the large size on the top slope lost their basic protection function within 3 years and were in urgent need of being repaired.
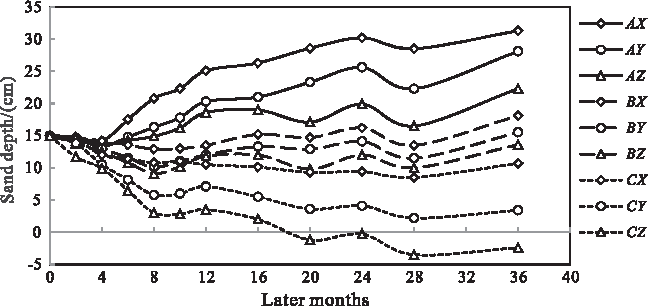
Sand surface depth change of each straw checkerboard in the past 3 years. A: 1 × 1 m; B: 1.5 × 1.5 m; C: 2 × 2 m; X, the toe slope; Y, the middle slope; Z, the top slope.
Discussions
Reason analysis of wind environment
Wind velocity and wind frequency were principle factors of forming the airflow field (Bagnold, 1941; Chepil and Woodruff, 1963) and producing the difference among sizes and slope positions in the checkerboards. According to the statistics of regional wind velocity and wind frequency in the corresponding period (Fig. 3), many of checkerboards were severely sand accumulated in the NW and NE parts because of the leading wind of the NW in winter and NE in spring. In addition, a high westerly and northerly wind frequency in winter and spring caused the strong erosions to the C, SW, and SE parts. In summer, the slope became the backward sand dune with the leading wind changing to the east, and almost all toe- and middle-slope positions were deposited weakly. Generally, a leading wind direction would cause deposition on the same direction part of the intrinsic checkerboard and erosion on the reversed direction. Based on the correlation coefficient between the wind velocity or wind frequency and the erosion depth of the corresponding intrinsic part, the medium- and small-size checkerboards on the toe slope had good positive correlations between the NW wind and NW part deposition (0.7 < R < 0.9), whereas in the SW, they had a weak positive correlation (R > 0.6) with wind velocity and little relation with the wind frequency. The NE wind was the most frequent direction but had a low average wind velocity; the deposition in the NE part was weaker than the erosion in the SW part, which was mainly eroded by the SW wind in autumn.
To conclude, the great sand deposition in most checkerboards was mainly controlled by the high wind frequency and velocity of the NW wind, and the erosion in autumn and winter that occurred in the C and SE parts was due to the strong NW wind which was much stronger than the deposition in the spring and summer. As to the small size on the toe- and middle slope, the velocity of the SW and NW wind determined the entire year's deposition intensity, and the large size on the top slope under this directional wind was greatly accumulated in the surrounding parts. However, all of the checkerboards' C parts were complicated by erosion and deposition, which were affected by all wind directions.
Prospects of fencing life
Under the field observations of these 2 years, the small-size checkerboards on the toe slope were sand buried for almost 90% of the checkerboards area in the spring and winter, and they would become entirely buried after 1.5 years even though there was a calming period in summer and autumn. The large sizes on the top and middle slope were severely eroded such that the straw was totally blown out throughout a windy season and their protection life lost almost 80% after a year. Because of the adverse wind direction and depositional seasons of spring and summer, the fencing life was prolonged to 1–2 years, but their wind prevention and sand fixation were reduced year by year. In contrast, the medium sizes maintained a long fencing life and good ecology restoration for at least 3 years; however, all checkerboards should be repaired or transplanted with available artificial plants once the straw becomes seriously buried or eroded. In addition, the fencing life of straw checkerboards was not only decided by the wind and sand flow but also affected by the material quality, rainfall, human destruction, and other factors (Moreno-Ramón et al., 2014; Tejada and Benitez, 2014). Along with the increase of rainfall and decrease of wind-sand movement in the Qinghai basin in recent years, the straw flexibility and the antierosion ability of soil would be improved. In addition, many natural desert plants were recovered and enforced the fencing life of straw checkerboard. With the covering density increased, the straw would be protected with the sediment transport decreased sharply (Wasson and Nanninga, 1986; Li et al., 2003). Therefore, it could be predicted that many types of straw checkerboards would maintain at least another 3 years of fencing life under artificial mending and vegetation transplanting.
Optimization of size and slope position
Alpine desert controlling measures could be optimized, especially in the allocation of different sizes in different slope positions (Iversen and Rasmussen, 1999). Based on the erosion and deposition characteristics and fencing life of straw checkerboards, the 1 × 1 m size was propitious to the top slope, the 2 × 2 m size was fitted for the toe slope and the middle slope, and the 1.5 × 1.5 m size was well applied to all three slope positions because of its good protection benefits and long fencing life. Most likely, this configuration was centralized on the shifting sand dunes, but it was also suitable for various semistabilized or stabilized sand dunes (Xu et al., 1982). In addition, when some stabilized dunes are colonized or occasionally face a stormy weather sometimes, the 1.5 × 1.5 m and 2 × 2 m sizes could be a good choice for impeding the desertification in a later stage. When some moving sand dunes were intruding on a meadow, a lake, or an important road, the 1 × 1 m and 1.5 × 1.5 m sizes played an emergent role in holding back the sand dune from invading and attacking. Another factor is that the slope positions of sand dunes should be adjusted by the leading wind direction, the backward slope has no need to pave the straw-checkerboard barriers, and the toe slope and basin positions of a moving dune should be a large size. Moreover, the falling gradient of the slope demanded different sizes, and the high slope was easily eroded such that a small size is needed. In terms of the high financial cost of the checkerboards and hardships of paving the barriers, the sizes could be changed from a square style to rectangular style to save money and simplify construction; for example, the 1 × 1 m size could be replaced by the 1 × 1.5 m size with the long line extended against the leading wind (Wu, 2003; Wang et al., 2009).
Conclusions
Based on the simulated concave morphology and erosion characteristics, the small size and low slope position checkerboards are of depositional type, and the large size and high slope position ones are of erosive type. Specific to their size, slope, and season difference, the smaller size would be more greatly deposited in surrounding parts, the higher slope position must undergo more serious erosion in its C part, and great deposition mainly occurs in the NW and NE parts in spring and winter.
Generally, the deposition depth rate and intensity in the intrinsic checkerboard increased with size and slope reduction. Otherwise, the erosion hazard became heavier with size and slope expansion. In case of overaccumulation and over-erosion, the fencing life of checkerboards increased greatly in medium size and middle slope, which reached 6 years at the most. The small size on the toe and large size on the top trapped serious sand burying and basal sapping hazard, respectively, limiting their lifetime to 3 years. In practice, the small and large size were best fitted to the top and toe slope, respectively, for its long fencing life of 2–5 years, and the medium size was suited to all slope positions for their over 5 years lifetime.
Footnotes
Acknowledgments
The study was financially supported by the National Science Foundation of China (no. 41461001), National Science Foundation of China (no. 41461002), and Natural Science Foundation of Qinghai Province of China (2018-ZJ-966Q).
Author Disclosure Statement
No competing financial interests exist.