
Abstract
Abstract
With stable existence in liquids for over several weeks, nanobubbles have an extensive range of applications across many fields of science and engineering. For an effective and functional use of these bubbles, it is important to know the reason for their long-term stability. Therefore, a comprehensive laboratory investigation was performed to determine bubble size distributions and zeta potentials of nanobubbles, first with four different gases (test series I), then with different salt concentrations, pH levels, and temperatures of the solution (test series II). Experimental results from test series I showed that the average bubble size depended on the gas solubility in water, and zeta potential depended on the ability of the gas to generate OH− ions at the water/gas interface. Experimental results from test series II showed that bubbles with high negative zeta potentials can be generated in solutions of high pH, low temperatures, and low salt concentrations. The high pH solutions produced smaller but stable nanobubbles. Bubble diameter slightly increased with increasing salt concentration. However, bubble size did not show considerable dependence on solution temperature. Long-term tests showed that with time zeta potential of bubbles decreased while the bubble size increased. Even though bubble sizes are expected to decrease with time due to gas diffusion, results indicate increased bubble sizes. This is because of decrease in zeta potential and bubble movement due to Brownian motion which causes bubble coalescence over time to form larger bubbles.
Introduction
N
After generation, nanobubbles are found to exist in aqueous solutions for several weeks. Azevedo et al. (2016) reported that bubbles of radii 150–200 nm were in a solution for 2 weeks. The electrically charged liquid–gas interface of nanobubbles create repulsive forces that prevent bubble coalescence and, hence, high bubble densities creating highly dissolved gas concentrations in water creating smaller concentration gradients between the interface and the bulk liquid (Ushikubo et al., 2010). Moreover, the stability of bubbles increased by low rising velocity, which is negligible due to Brownian motion and low buoyancy forces (Chaplin, 2017). Other than these reasons, nanobubbles are considered to be stable by a mutual shielding against the diffusive outflow of gases, which can be achieved if bubbles are sufficiently close together or gathered into micrometer-sized clusters (Demangeat, 2015).
As of now, presence of stable nanobubbles has been experimentally confirmed, yet a clear theoretical basis has not been established to explain their long-term stability. Hence for effective and functional use of these bubbles, knowing their properties and behavior is quite important. Yet, nanobubble behavior is considered to be complex. Therefore, a further study is required for proper understanding of the stability of nanobubbles, impacted by generation techniques, coalescence, free radical generation, and influencing factors of stability of nanobubbles, such as temperature, pressure, pH, salt concentration, ion strength, presence of organic matters, the origin of the nanobubbles, and so on. The following section describes the exponential growth of the application of nanobubbles in many fields of science, technology, and industry.
Applications of nanobubbles
Nanobubbles have an extensive range of applications such as in drinking water and wastewater treatment, including decontamination of groundwater; decontamination of sediments and soils; biomedical engineering; and other industrial applications such as agriculture, fishery, and food.
One of the best uses of nanobubbles is the treatment of wastewater and drinking water that have been recently developed due to their ability to generate highly reactive free radicals (Agarwal et al., 2011). Hu and Xia (2018) showed the feasibility of remediating groundwater using ozone micro- and nanobubbles.
Meegoda (2017) proposed a new technology to decontaminate sediments using ultrasound with ozone nanobubbles. It uses three innovative technologies, namely, ultrasound, ozone, and nanobubbles, to provide a cost effective and environmentally sustainable onsite treatment of sediments with lower total cost over a shorter time span. It also has minimal adverse impact on the environment and the socioeconomic growth of the region. The ultrasound energy provides agitation and sediment decontamination. The ozone reacts with desorbed contaminants for removal from water. The nanobubbles help the dissolution of ozone gas in water (Meegoda and Batagoda, 2016; Meegoda et al., 2017). The use of nanobubbles was motivated by their air sparging experiments (Hu et al., 2010, 2011, 2014).
There are many biomedical applications of nanobubbles. One of them is the delivery of cancer drugs, where nanobubbles are placed in the body and are given the ability to identify tumor cells. The bubbles are blown up when they approach tumor cells, destroying the cancer (NHI, 2017). Nanobubbles have also been used in emergency procedure, where nano oxygen bubbles are injected directly into the bloodstream allowing people who are suffocating an extra 15 min during transportation to hospitals. While this is not a long time but it does allow for higher survival rate (Narayan, 2017).
There are many industrial applications of nanobubbles. Nanobubbles have shown the ability to create reactive oxygen species which contribute to seed germination. This increase in reactive oxygen species has the same effect as adding H2O2, resulting in higher germination rates (Liu et al., 2015). Also they used in sparkling water and sports drinks. With the addition of nanobubbles, the water can potentially keep gases for a longer time period (Bauer Nanobubbles, 2017). Nanobubbles also have application in paints. Due to the presence of nanobubbles, paint dries faster and also resists mold. In addition, there is an increase in brightness due to the nanobubbles (Bauer, 2014). They are also used as artificial flotation in water. This is accomplished by altering the ionic equilibria of dissolved ions in solutions and by changing the net charge on particle surfaces (Moleaer, 2017a).
Nanobubbles are also used in food industry. Nanobubbles are used to regulate pH levels in liquids utilizing carbon dioxide (CO2). This is achieved by adding nano CO2 bubbles, which are suspended in the water for a long time regulating solution pH (Moleaer, 2017c). Nanobubbles are also used in fish farming. Studies have shown that a decrease of oxygen leads to decreased respiration and feeding activity that slows growth rate of fish. However, with nano air bubbles, oxygen levels in water are maintained leading to high fish survival rates (Moleaer, 2017b).
Although there are many applications of nanobubbles as suggested above, there is limited understanding of the reason for their long-term stability. Therefore, this laboratory study was designed as a comprehensive investigation of nanobubbles based on four different gases and then further investigated to determine the nanobubble characteristics in an aqueous system under different salt concentrations, pH levels, and temperatures by measuring bubble size distributions and zeta potentials. Measured results were analyzed to develop meaningful conclusions on bubble stability.
In this research, bubble size and zeta potential of bubbles made of several gases in different solution environments were measured to study about nanobubble stability. The size of the bubble is the key parameter that is used to classify the bubble. Another most important parameter of nanobubbles is the electric charge on the bubble surface as the electric charge can be used to discuss the stability of a colloidal system. Hence the electric potential of colloidal system can be expressed in terms of zeta potential, and hence, zeta potential measurements were used to explain the bubble stability.
Experimental Methods
Generation of nanobubbles
Nanobubbles are frequently generated in solutions by creating cavities. Cavitation is caused by pressure reduction below the certain critical value. Based on the pressure reduction mechanism, cavitation mechanisms can be classified into four different types (Maoming et al., 2010; Agarwal et al., 2011; Padilla-Martinez et al., 2014).
Hydrodynamic—variation in the pressure of liquid flux due to system geometry (Maoming et al., 2010; Agarwal et al., 2011; Oliveira et al., 2018).
Acoustic—acoustic cavitation produced by applying ultrasound to liquids (Ashokkumar and Mason, 2000; Ashokkumar, 2011).
Particle—passing high intensity light photons in liquids (Poulain et al., 2015).
Optical—short-pulsed lasers focused into low absorption coefficient solutions (Lauterborn, 1979; Padilla-Martinez et al., 2014).
Nanobubbles are usually hydrodynamically generated using the following methods (Tsuge, 2014).
Dissolve gases in liquids by compressing gas flows in liquids, then releasing those mixtures through nanosized nozzles to create nanobubbles.
Inject low pressure gases into liquids to break gas into bubbles by focusing, fluid oscillation, or mechanical vibration.
In this research, the hydrodynamic cavitation was used to generate nanobubble (Maoming et al., 2010; Agarwal et al., 2011; Tsuge, 2014) where BT-50FR micro- and nano-sized nozzle was used (Meegoda et al., 2017). This gas–water circulation method generates a flume of micro- and nanobubbles in water. First, water is pumped into the nozzle with an eccentricity to create a swirling effect. The swirling water creates a vacuum at the outlet of the nozzle where the desired gas is injected at a controlled rate. The gas introduced by vacuum into the swirling water will exit from the outlet as a mixture of micro- and nanobubbles. The dynamic forces within the vortex will break the injected air into smaller bubbles. The BT-50FR micro- and nanobubble nozzle requires a minimum water pressure of 0.3 MPa, a water flow rate of 20 L/min, and an air flow rate of 0.2–1.0 L/min.
In this research, nanobubbles were generated using a 25 L chamber filled with 18 L of water and running the gas through nanobubble generating nozzle for 3 min. The gas except ozone was supplied from compressed gas cylinders with regulators. An ozone generator was used when generating ozone nanobubbles. Figure 1 shows the experimental setup used to generate nanobubbles.

Experimental setup. (The figure shows the ozone nanobubble generation setup. To generate other gas bubbles, gas inlet is directly connected to the gas cylinder instead of the ozone generator).
Measurement of size distribution and zeta potential
Bubble size distribution and zeta potential values were measured using a Malvern Zetasizer Nano ZS. The Zetasizer uses dynamic light scattering method to analyze the size and the zeta potential of gas bubbles in water. The Zetasizer is a noninvasive backscatter system, where the laser is directed toward bubbles and detects the backscatter of the laser to determine sizes of micro- and nanobubbles in water. The scatter detector can identify bubble sizes ranging from 0.3 nm to 10 μm.
The Zetasizer uses the Electrophoretic Light Scattering technology to calculate the zeta potential of the dispersed nanobubbles based on the electrophoretic mobility using a capillary cuvette. Approximately 1 mL sample of the nanobubble saturated water is added to the capillary column, and an electrical field is applied. The net charge on the bubble and the bubble size will dictate the mobility of a bubble within the capillary column. The mobility of a bubble is directly correlated to the zeta potential. Bubbles are illuminated with a laser, and the frequency of the scattered light from bubbles is a function of the velocity due to the Doppler shift. The Zetasizer analyzes the original beam and the scattered beam to identify the frequency shift. This frequency shift is related to the velocity of the bubble. The zeta potential is calculated using the Smoluchowski model.
Test procedure
The main objective of this study was to investigate the long-term stability of nanobubbles based on factors that influence the generation of nanobubbles. Therefore, nanobubbles were generated under the following four different conditions and tested for their size distributions and zeta potential values. Then, the results were analyzed.
Results and Discussion
Different gas types
Stability and reactivity of nanobubbles should depend on gasses inside cavities. Therefore, to investigate different gas bubble properties, nanobubbles were generated using different gasses, namely, ozone, oxygen, air, and nitrogen. Bubbles were generated in DI water where the electric conductivity of the solution was maintained at 0.3 mS/cm by adding NaCl (test series IA).
Figure 2a shows the variation of the bubble size with the gas type, and recorded average size data are based on six measurements. Ozone gas produced the maximum average bubble size followed by oxygen, air, and nitrogen, respectively. The trend in Fig. 2a shows that the bubble diameter of relevant gas types can be correlated to their gas solubility in water. The size/diameter results were based on the Number-Distribution data, where the peak values of the distribution curves are reported. Among the four types of gases used, ozone has the highest solubility, 13 times more soluble than oxygen (Ozone Solutions Inc., 2017), and ozone nanobubbles had the largest average diameter. While nitrogen having the lowest solubility in water (normally N2 is an insoluble in water) showed the smallest bubble diameter, the solubility of oxygen, air, and nitrogen in 20°C water at 1 atm is 3.10, 1.87, and 1.54 (% v/v), respectively (Wang et al., 2010). Figure 2b shows the zeta potential values for four gases, and average results were based on the six measurements. Ozone nanobubbles had the highest zeta potential value followed by oxygen, air, and nitrogen, respectively. However, the formed ozone nanobubble is ∼5% ozone and 95% oxygen by mass.
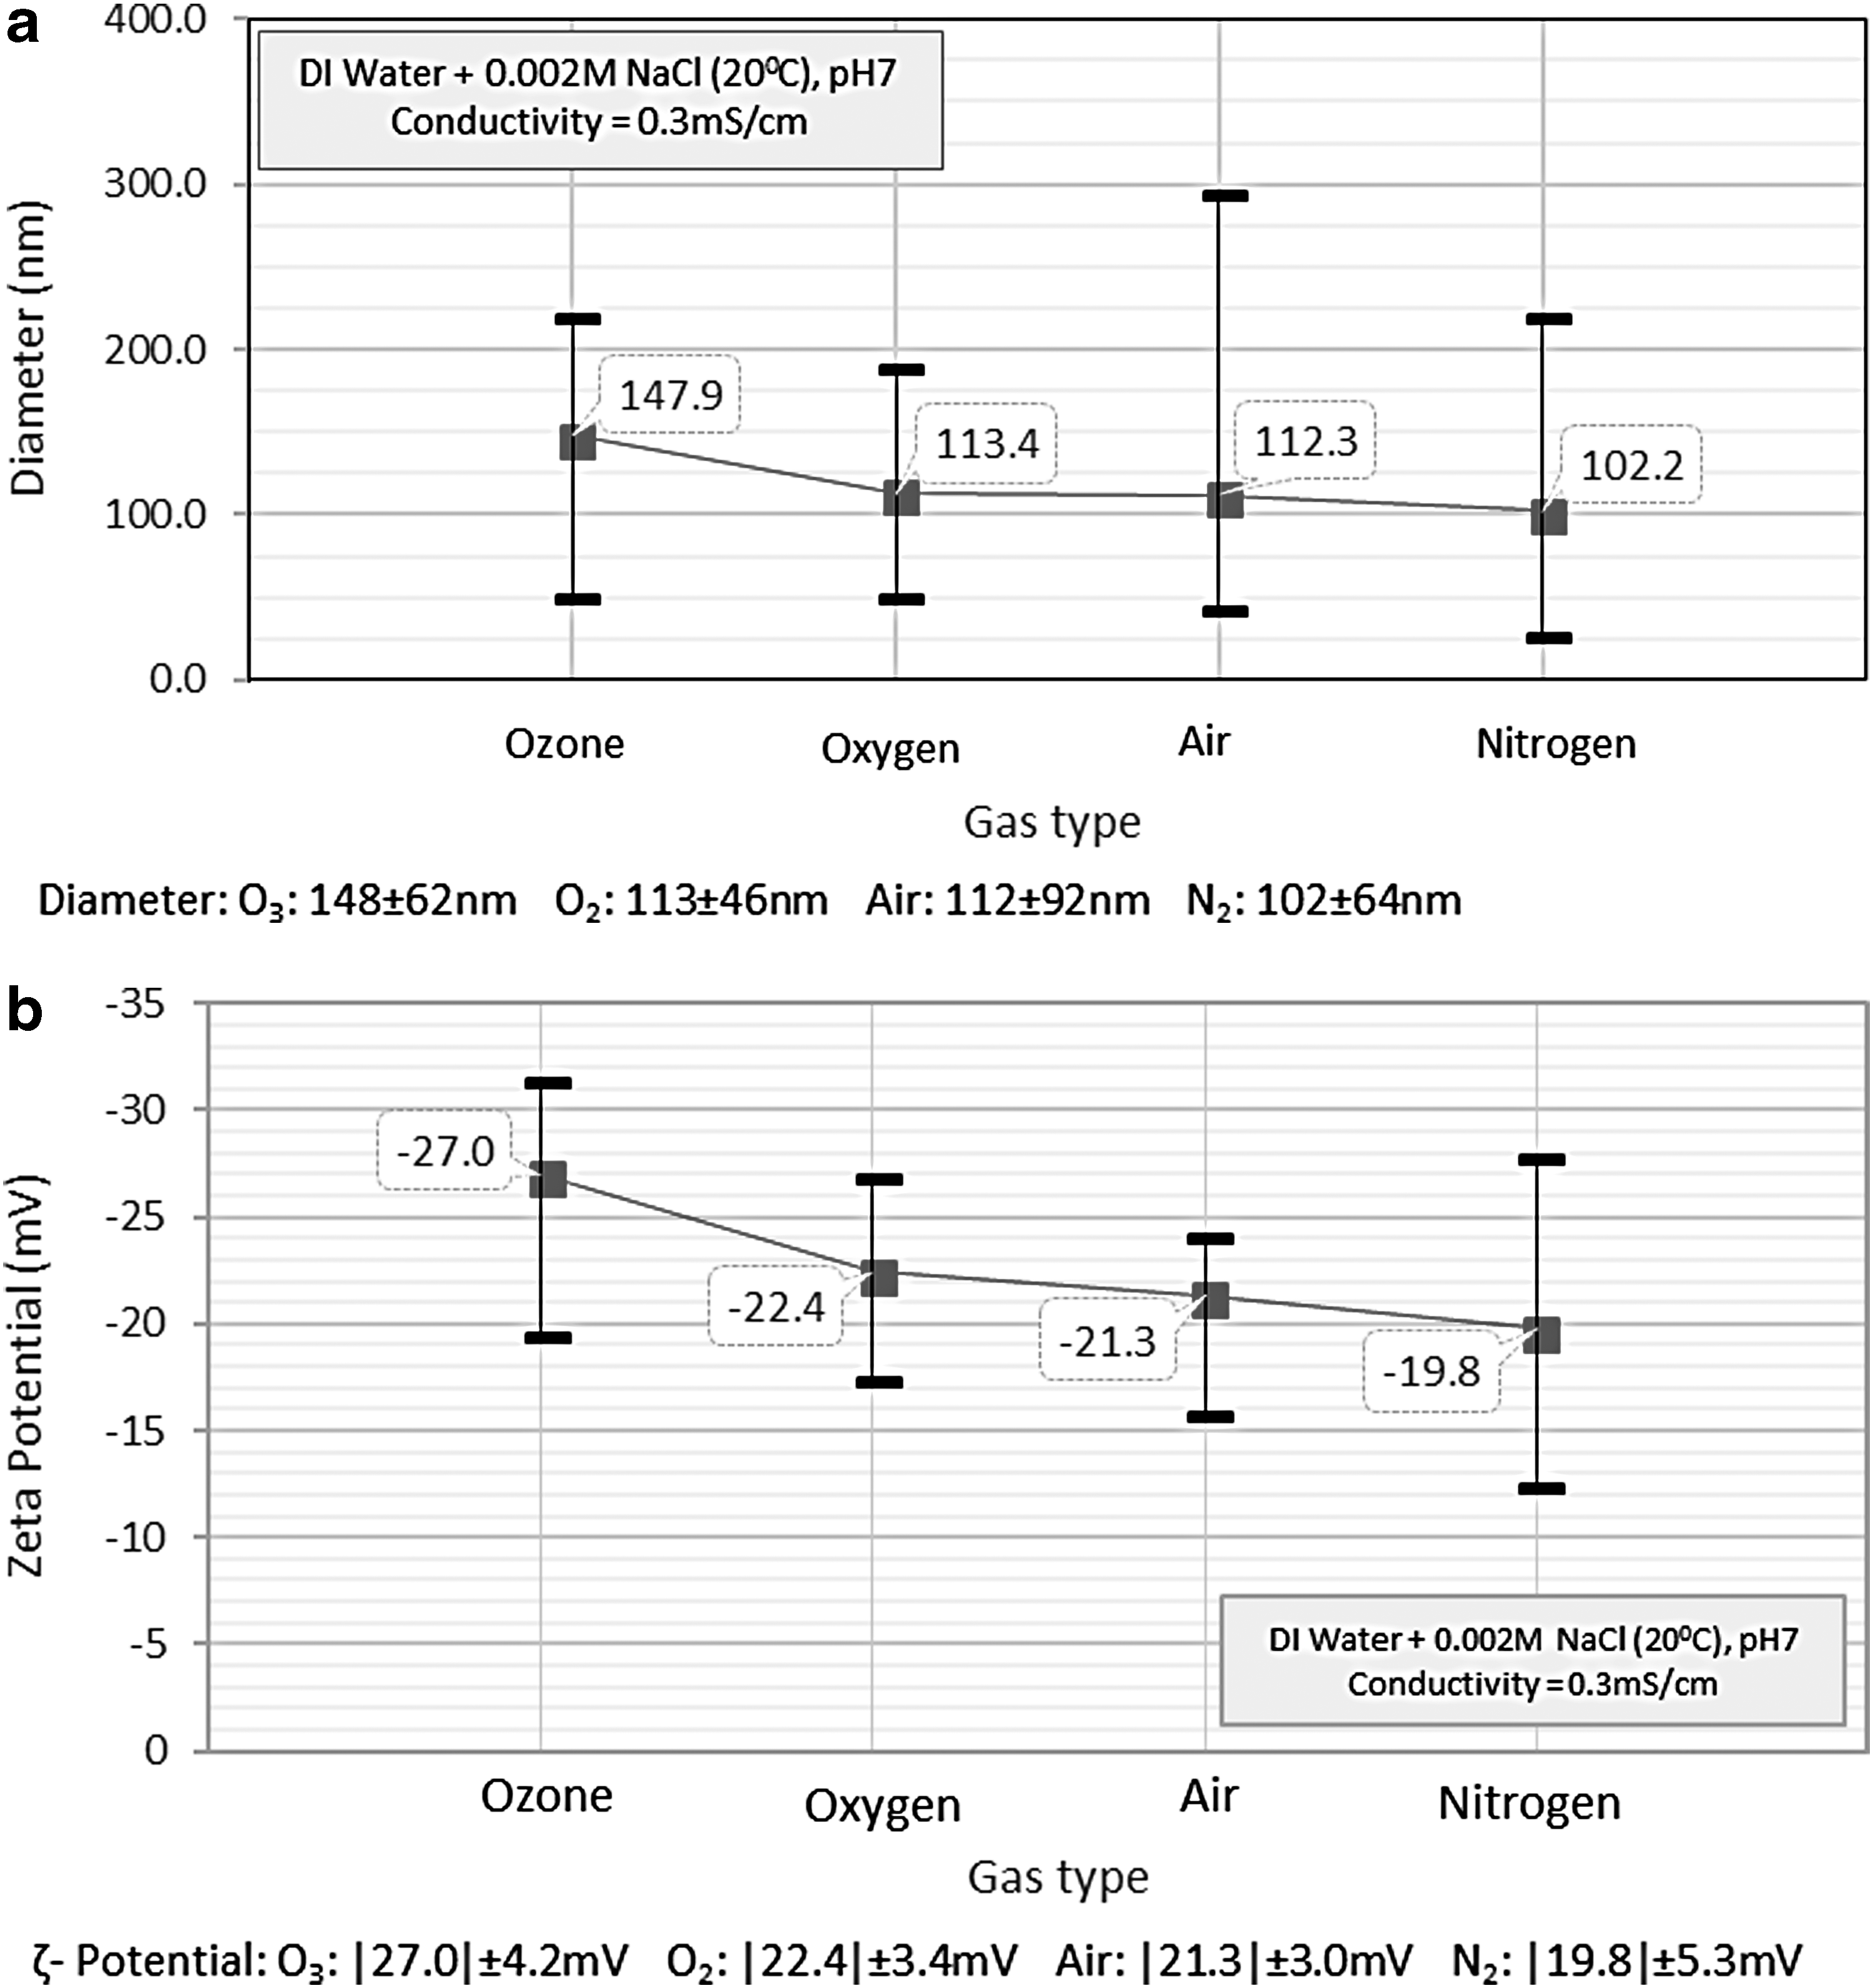
Relationship between
Several researchers reported zeta potential and bubble sizes for ozone, oxygen, air, and nitrogen (Hasegawa et al., 2009; Kim et al., 2000; Ushikubo et al., 2010; Wang et al., 2010; Zheng et al., 2015). Ushikubo et al. (2010) reported mean diameter of 137 nm for oxygen nanobubbles formed in DI water and zeta potential values between −17 and −20 mV for air nanobubbles formed in DI water. Ohgaki et al. (2010) reported mean diameter of 50 nm for nitrogen nanobubbles in DI water. Zheng et al. (2015) reported average zeta potential value of −22 mV for ozone nanobubbles in DI water. Above test results in the literature are within the reported range as shown in Fig. 2.
Bubble size should depend on the supplied gas pressure, energy provided to the system, and the bulk properties of the solution. The gas flow rates and gas pressures are major contributors of the bubble size. Nanobubbles are usually generated using two methods.
First method involves a gas to flow into water and allowing water with gas bubbles to circulate; this will cause bubbles to break into smaller sizes. Maintaining high flow rates or energy will produce smaller bubbles. However, both the bubble breakage and coalescence occur at the same time during the water circulation, producing a range of bubble sizes.
The other method involves injecting a gas under the controlled pressure into water through a specially designed nozzle with nanosized pores. By changing the applied pressure or flow rates, bubble size can vary. To achieve smaller bubble, a higher upstream pressure is required with smaller gas flow rate. However, in practice this is very hard to achieve; with increased internal pressures, bubble sizes tend to increase so that flow rates have to increase or if not maintain the very smaller bubble size causing to create high back pressures, which required powerful compressors, an expensive proposition. So to obtain optimal bubble sizes, one must choose pressures and flow rates.
Literature (Takahashi, 2005; Ohgaki et al., 2010; Jia et al., 2013; Temesgen et al., 2017) showed that under neutral pH values, nanobubble surface is negatively charged, and this negative surface charge is related to the OH− ion concentration on the gas/water interfaces of bubbles. Therefore, the bubble properties depend on the surface charge density on the bubble surface as shown in the Equation 1. Literature suggested that the Young–Laplace equation is still valid at the nanoscale (Liu and Cao, 2016). So that, it can be considered that pressure difference caused due to surface tension
where
Zeta potential depends on many factors; when keeping all the parameters constant except the gas type, the measured difference in zeta potential must be related to the gas type. Which means infilled gas in the bubble should have an influence on the zeta potential. Hence the negative surface charge on the bubble surface is believed to be due to the absorption of OH− ions at the gas–water interface. Four gases used should have different levels of contribution to generate negative charges at the bubble surface. So, the observed differences should be related to the different gas diffusion rates, gas solubility, and the potential contribution to form OH− ions at the bubble–water interface.
Results indicate that the magnitude of zeta potential is highest for O3 and followed by O2, Air, and N2, respectively. Ozone is very soluble, as well as a very reactive gas, and when it dissolves in water tends to generate hydroxyl radicles (OH•), O2, etc. In addition, one indirect illustration of ozone molecules in contact with water (O3 + H2O → O2 + OH− + OH−) results in hydroxide ions (Eagleton, 1999). The decomposition of O3 forms O2, hence, increasing the O2 concentration in water. According to the many authors the H+ ions are more likely hydrated and hence tend to stay in the bulk aqueous side, and less hydrated and more polarized anions attract to the bubble surface (Kim et al., 2000; Takahashi, 2005).
According to the results, O3 and O2 show higher magnitude zeta potential values or show higher negative charges on the bubble surface. As such, the diffused O2 must be responsible to form additional OH− ions at the gas–water interface to make more negatively charged bubbles. Based on the results, the next higher zeta potential is related to the air bubbles, and it can be assumed that Air contains some amount of O2 compared to the N2 and hence it contributed to absorb more OH− ions at the bubble interface to form high magnitude zeta potential compared to N2 gas bubbles.
In addition, without assuming the gas reactivity and solubility, the charge density and bubble size at the time of generation should be the same irrespective of the gas type. However, with the high gas solubility, ozone will diffuse into the bulk solution at much higher mass transfer rate, which will provide the O2 gas to the solution, in other terms, will form OH− ions at the bubble interface.
When looking into the zeta potential values, it seems, in-filled gas type plays a vital role due to both their solubility and reactivity. Based on test results, it is quite clear that the gas type is a major contributor to zeta potential, and gases that can generate much higher concentration of OH− ions at the interface will produce higher negative zeta potential values.
Variations in solution pH
Figure 3a shows the variation in zeta potential values with solution pH values, where with increased solution pH, negativity of zeta potential increases. Figure 3b shows the change in bubble size with solution pH values, where with higher solution pH values, smaller bubbles are formed. High concentrations of OH− ions in the solution created smaller nanobubbles with higher charge density values for a given energy input than that at neutral pH solutions.

Relationship between
Literature review showed that, under wide range of solution pH values, zeta potential of nanobubbles was negative, and negative value increased with increased solution pH values (Takahashi, 2005; Kim et al., 2000; Jia et al., 2013; Calgaroto et al., 2014). Takahashi (2005) reported that, with increasing pH, negative zeta potential increased and reached a plateau of approximately −110 mV at pH ≈10, and for acidic solutions with pH below 4.5, zeta potential values were positive. Calgaroto et al. (2014) reported that zeta potential values of nanobubbles showed a sigmoidal behavior between pH 2 (+26 mV) and pH 8.5 (−28 mV) with isoelectric point (IEP) at pH 4.5 and highest negative zeta potential (−59 mV) at pH 10.
When looking at size variation with solution pH, Calgaroto et al. (2014) showed that bubble size reached the maximum (720 nm) around an IEP value at pH 4.5 where bubbles were practically uncharged (±5 mV). Calgaroto et al. (2014) concluded that the higher the amount of electrical charge on the bubble, it resulted in smaller nanobubbles. In addition, Kim et al. (2000) reported that bubbles created with solution pH of 3 were much larger than those created with solution pH of 12, and effective diameter was reported as 372 nm with a solution of pH 3 and 293.4 nm with a solution of pH 12.
Therefore, increasing the solution pH with high concentration of OH− ions would increase the zeta potential. Moreover, this will increase hydrogen bonds around the bubbles and will help to increase the stability of the bubble as well. The experimental data from this research supported the above conclusion with the highest magnitude of negative zeta potential of −27.3 V for a nano oxygen in a solution pH of 10. Based on experimental results, the smallest zeta potential value was obtained for a solution pH of 4. So, the reduction in negative zeta potential can be easily attributed to high concentration of H+ ions in the solution or a reduction of OH− ion concentration.
Figures 3b and 4b show that nanobubbles tend to be smaller in size with increased solution pH values. In addition, they showed that in a solution with a neutral pH and above, bubble size remained smaller in the nanosize range for 1 week. However, for a solution pH of 4, bubbles were much bigger in the microsize range at the time of generation and very rapidly increased in size, and after a week ZetaSizer could not accurately measure the size (Fig. 4b).

Relationship between
Test results showed that stable bubbles were generated under the neutral solution pH and for solution pH values above 7. Even though nanobubbles in high pH NaOH solutions showed highly negative zeta potential value at the time of generation, it rapidly reduced to values close to zeta potential values of nanobubbles produced with neutral solution pH (Fig. 4a). Also, the results revealed, nanobubbles in acidic solutions were difficult to generate and those zeta potential values tend to be positive. This confirms that the surface charge of nanobubbles is strongly related to the OH− ion concentration.
Hence it can be concluded that stable nanobubbles are generated under less acidic environments. This can be explained as, when nanobubbles are formed in acidic solutions magnitude zeta potential values are always low compared to the neutral or alkaline conditions. Those bubbles with low zeta potential have higher possibility for bubble coalescence and, therefore, creating unstable bubbles.
Impact of salt concentration
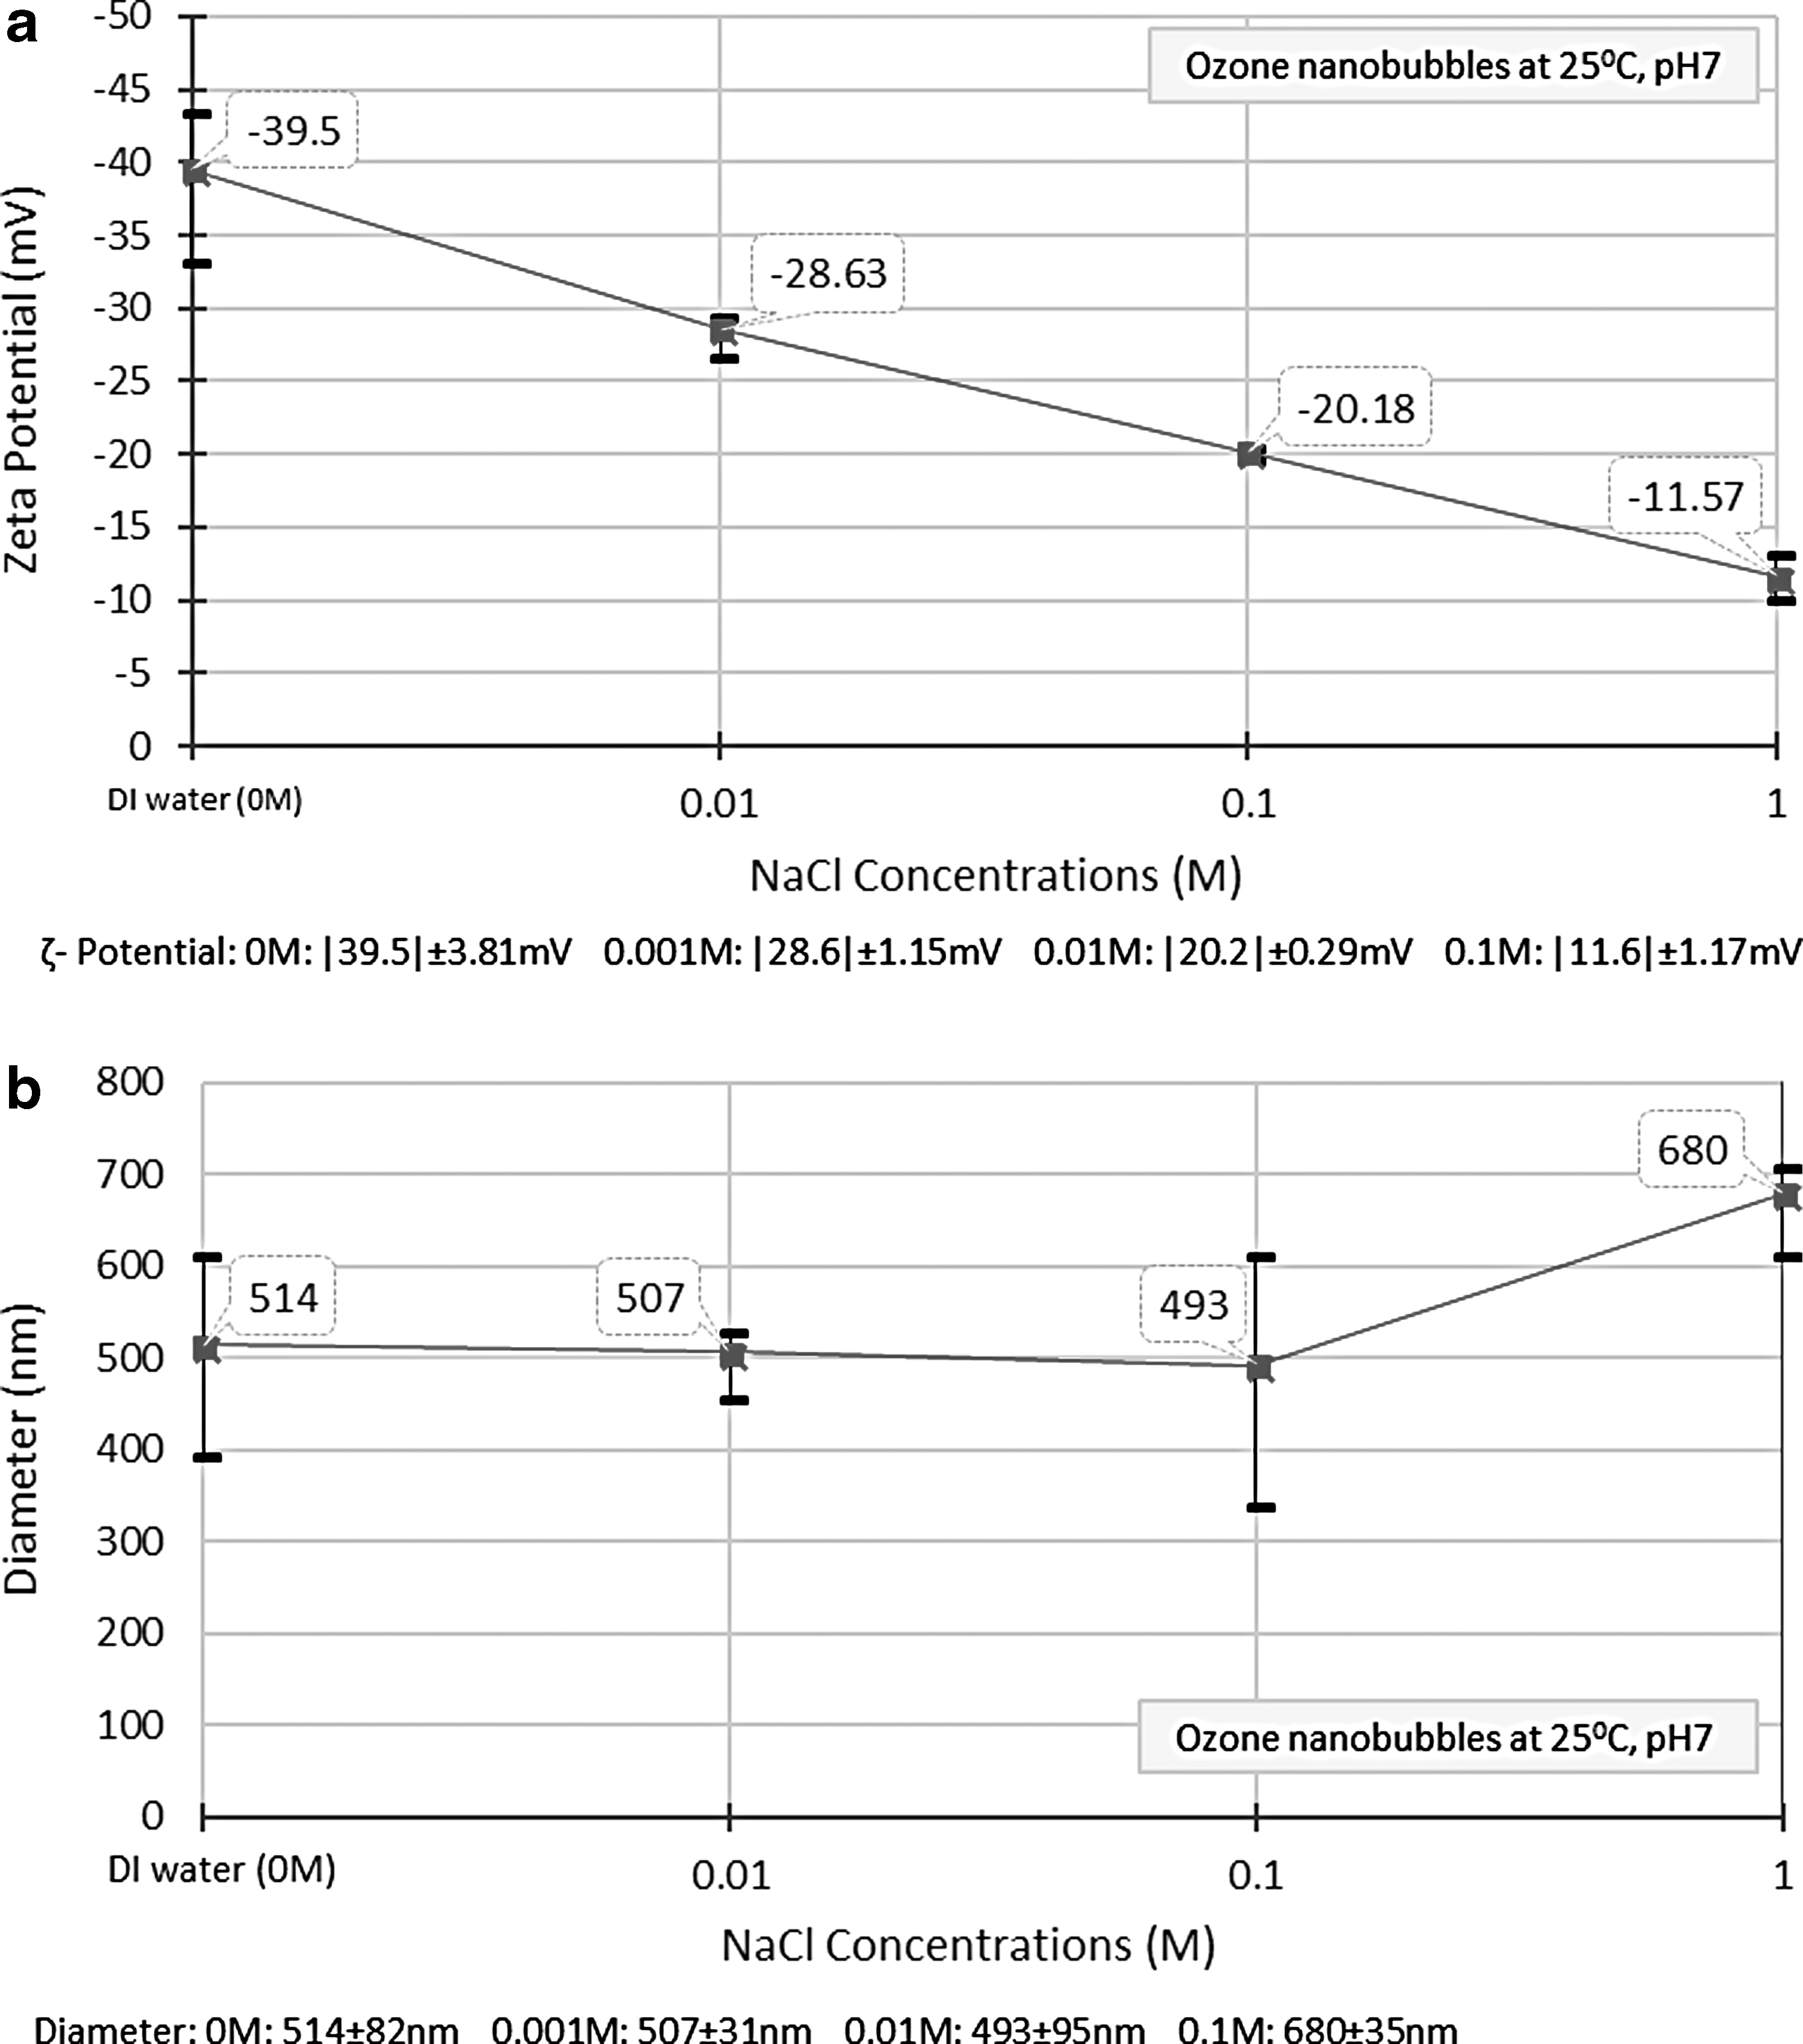
Figures 5a and 6a show the variation of zeta potential values with NaCl concentration for both ozone and oxygen nanobubbles. In both cases, all the zeta potential values were negative and showed an increase in zeta potential value or reduction in magnitude with increased NaCl concentrations. Figures 5b and 6b show the bubble size variation with NaCl concentration for both ozone and oxygen nanobubbles. The bubble diameter slightly increased with increasing NaCl concentration for both ozone and oxygen nanobubbles.
Relationship between

Relationship between
Literature showed similar trend, where for added NaCl concentration caused a reduction in negative zeta potential and increase in effective diameter (Cho et al., 2005; Takahashi, 2005; Hu and Xia, 2018). To explain this behavior requires application of diffuse double layer theory to nanobubbles. Authors are developing such theory and will be presented in a separate future publication.
Impact of solution temperature
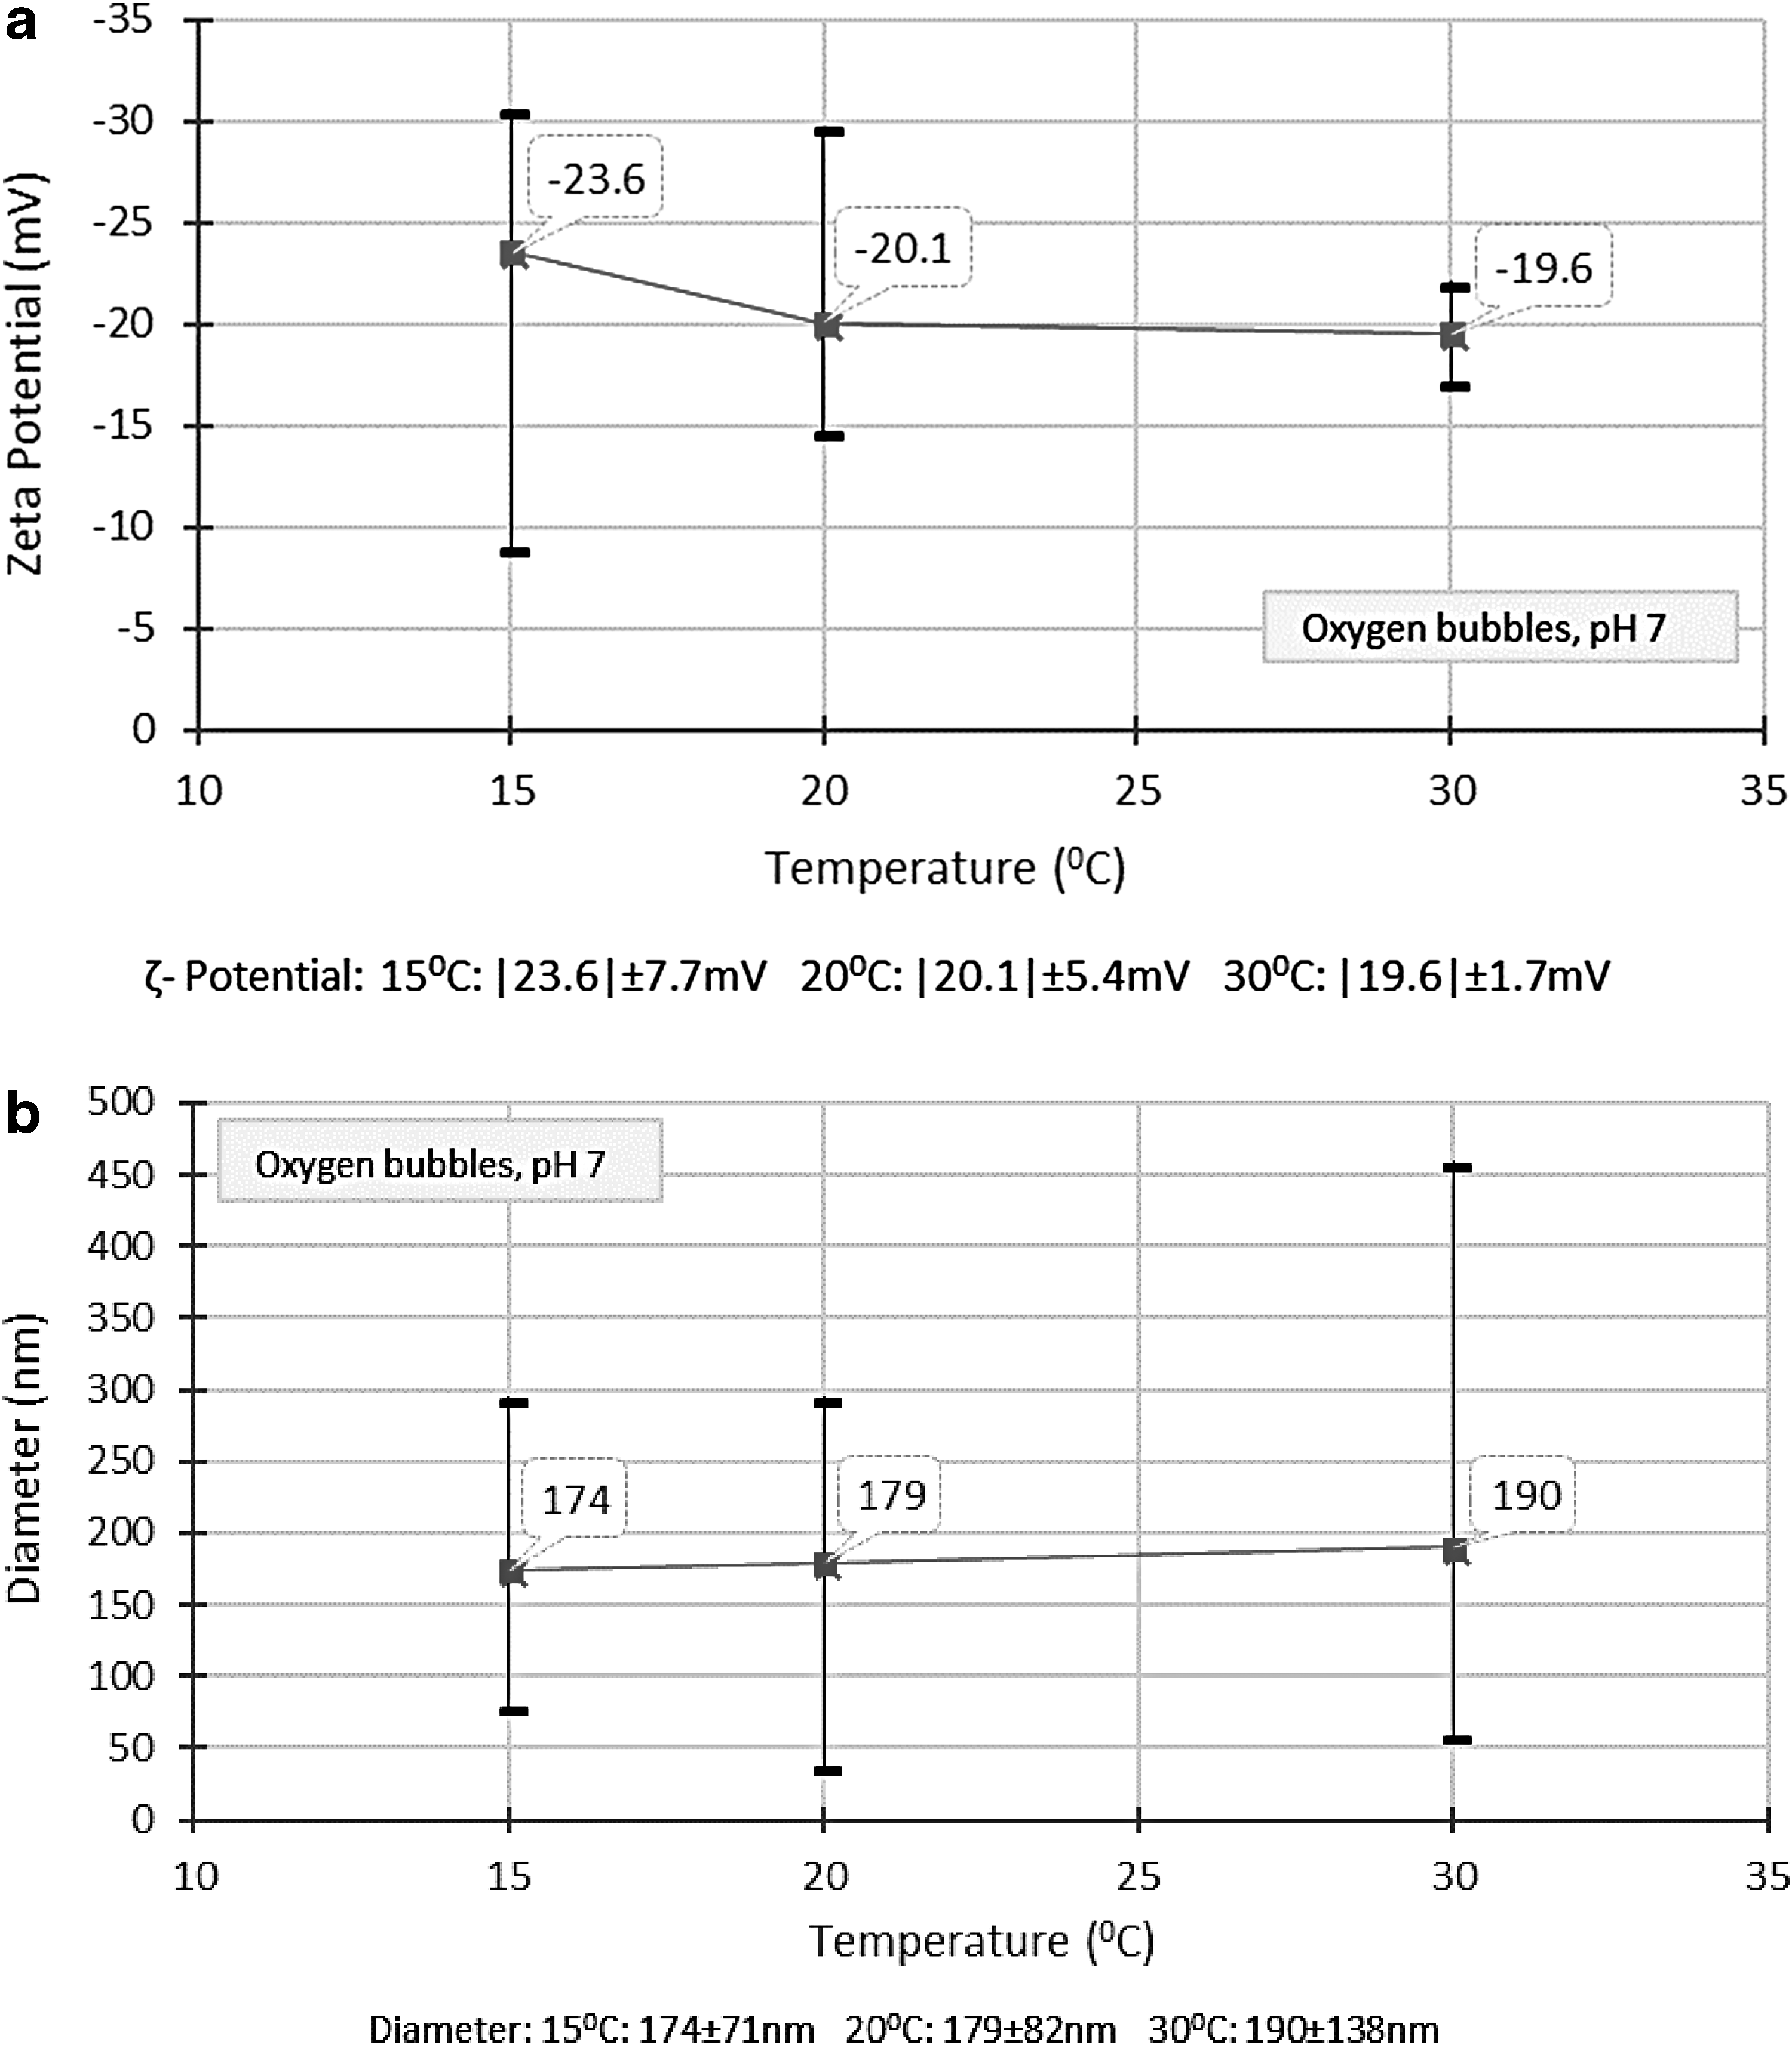
Figure 7a shows the variation of zeta potential values with solution temperature, and Fig. 7b shows the variation of the bubble diameter with solution temperature for oxygen nanobubbles. Based on test results it can be concluded that the negativity or magnitude of the zeta potential increased with decrease in solution temperature. However, the bubble size did not show a considerable variation. The zeta potential depends on the solution temperature and having a low solution temperature produced nanobubbles with higher zeta negative potential values.
Relationship between
The decreased zeta potential or decrease in surface charge density may be due to decreased OH− ion concentration on the bubble surface. With increased temperature, mobility of the ions in the solution is higher and, therefore, decreased OH− ion absorption onto the bubble surface. Jia et al. (2013) reported similar data showing decrease in negative zeta potential values with increasing temperature. Again, accurate explanation of this behavior requires application of diffused double layer theory to nanobubbles.
Stability of nanobubbles
Zeta potential or the surface charge density of nanobubbles would depend on different factors such as viscosity and density of bulk solution, temperature, pH, type and concentration of solution electrolyte, chemical surfactants, and other contributing factors. Irrespective of gas type, bubbles can have high zeta potential values by providing sufficient energy or pressure under controlled gas flow rates. If there is higher gas flow rate with higher bubble concentrations even with high zeta potential values, then there is high possibility for bubbles to merge to produce larger unstable macrobubbles.
The stable nanobubbles are smaller size bubbles having very negligible rising velocity and contain high-magnitude zeta potential values to reduce the possibility of bubble coalescence. To form high zeta potential values, it must contain high surface charge density. As mentioned before, nanobubble surface charge is related to the OH− ions or less hydrated and more polarized anions at the bubble gas–water interface. So that, by adding surfactants, increasing pH, or using other methods, one can create a favorable environment to generate OH− ions/less hydrated and more polarized anions at the gas–water interface and, hence, stable nanobubbles.
Formation of macro- and microbubbles is governed by Young–Laplace equation. Macrobubbles rise to the surface rapidly as shown in Fig. 8 and burst, while microbubbles rise at slower rate than macrobubbles; because of this extra time the gas transfer from bubble to liquid is higher. With the substantial loss of gas mass, microbubbles shrink and disappear after a few hours as shown in Fig. 8.

Fate of macro-, micro-, and nanobubbles in liquids with time. * is to show bubbles shrink & disappear.
Micro- and nanobubbles have different swelling/shrinkage properties from macrobubbles. It is reported that the critical diameter separating bubble swelling and shrinkage is ∼50 to 65 μm (Li et al., 2013). Bubbles larger than this critical value will swell, while smaller bubbles will shrink. Microbubbles tend to gradually decrease in size and subsequently disappear due to long stagnation and dissolution of interior gases into the surrounding water, whereas nanobubbles remain in the solution for weeks (Takahashi, 2005).
Experimental data from this research showed that smaller bubbles with high zeta potential bubbles are much stable with time. Smaller bubbles tend to stay longer in the solution because their motion is governed by both Brownian motion and the buoyancy force. With this random motion, gas inside a bubble continuously diffuses and is supposed to decrease in size and eventually disappear.
However, the recorded data with time showed that measured bubble size increased while the magnitude of zeta potential decreased. This must be due to the bubble merging over time which caused bubble sizes to increase while the surface charge density to decrease, hence the zeta potential. Hence, it is hypnotized that with the loss of charges on the surface due to diffusion, eventually, nanobubbles would shrink and disappear similar to the fate of microbubbles. Figure 8 shows the illustration of the fate of macro-, micro-, and nanobubbles over time. Authors are currently developing a theory to validate the above based on diffused double layer theory and molecular dynamic simulations.
Summary and Conclusions
Different industrial applications of nanobubbles would require the need to understand properties and behavior of these bubbles. A series of laboratory experiments were conducted to understand the behavior of nanobubbles.
Firstly, the impacts of the infilled gas types were investigated. The test results showed that the size and zeta potential values of nano oxygen, nitrogen, air, and ozone bubbles were the function of the properties of the gas type, specifically the gas solubility. The nitrogen gas with the least solubility had the smallest bubble diameter, while ozone with the highest gas solubility produced the largest diameter bubbles. The negative zeta potential value of nanobubbles is due to number of OH− ions on the bubble surface. Since all the parameters are identical except the gas type of nanobubbles, it can be concluded that the zeta potential is a function of the gas diffusion rates and gas solubility and would contribute to the generation of OH− ions on the bubble surface. Based on test results, ozone had highest magnitude negative zeta potential value followed by oxygen, air, and nitrogen.
Then, the bubble properties and behavior under the different bulk properties (pH, temperature, and ion concentration) of the solution were investigated. Test results showed that the negative zeta potential values increased with increased solution pH values. In addition, smaller sized bubbles were generated under high solution pH values, and bubbles were bigger and unstable in acidic solutions. These results also supported the hypothesis that the amount of OH− ions on the surface governed the stability of nanobubbles. Higher pH levels with high concentration of OH− ions generated smaller and stable nanobubbles with higher zeta potential values.
Test results also showed that the zeta potential values decreased with increased solution temperatures. There was no significant change in bubble size with increased solution temperatures. The change in zeta potential value may be due to the change in OH− ion concentration on the bubble surface, and with elevated temperatures and increased ion mobility it reduced the OH− concentration on the bubble surface.
Experimental results also showed that, with increased NaCl concentrations, zeta potential values decreased, while the bubble diameter increased. This behavior is difficult to explain and would require the application of the diffused double layer theory, which will be presented in a separate publication.
A discussion on stability of nanobubbles based on experimental data, as well as information based on literature search, was presented. Irrespective of gas type, stable bubbles can be generated with high magnitude zeta potentials by providing sufficient energy or pressure under controlled gas flow rates. In addition the bubble stability can be increased by providing a favorable environment that can generate higher concentration of OH− ions on the bubble surface.
However, the bubble density or number of bubbles per unit volume should be considered to avoid the possible merging of bubbles, and the bubble clustering needs further investigation to develop a complete picture of the bubble stability. Test results also showed reduced zeta potential of stable nanobubbles with time and hence a reduction in surface charge due to diffusion. Hence it is hypothesized that nanobubbles with reduction in zeta potential and due to the random movement of bubbles are subject to coalescence hence increase in bubble size.
Footnotes
Acknowledgment
This research was sponsored by the US National Science Foundation Award No. 1634857 entitled “Remediation of Contaminated Sediments with Ultrasound and Ozone Nano-bubbles.”
Author Disclosure Statement
No competing financial interests exist.