
Abstract
Abstract
In this work, effects of anionic surfactant on the oxygen transfer is investigated in a cylindrical reactor. For the first time, a systematic study in a wide surfactant concentration range, below and above the critical micellar concentration, is shown. A maximum reduction in the volumetric mass transfer coefficient (KLa) was observed for a surfactant concentration of 0.07 mM, before the CMC. Results are discussed based on the molecular interactions among water, air bubbles, and surfactant molecules. To better understand the experimental findings, a mathematical model was developed based on the estimated volumetric mass transfer coefficient. Predictions agree very well with the experimental results and point to a maximum reduction of 41% in the KLa, regardless of the inlet airflow rate in the reactor. We believe that our model can be used to predict future experimental results. In addition, this work can also be useful to better design an aerobic system.
Introduction
D
Oxygen transfer involves a complex interaction between molecular diffusion and turbulent phenomena at the bubble-liquid interface. This interaction is characterized by the volumetric mass transfer coefficient (KLa), where KL is the interfacial transfer rate and a is the specific interface area (Gillot et al., 2005; Jimenez et al., 2014). Determining the exact value of the KLa is useful to design and model an aerobic system, avoiding the under and overestimation of the required oxygen supply (Jimenez et al., 2014).
Since the last 20th century, several studies have estimated KLa for different aeration conditions (Leu et al., 1998; Gillot et al., 2005; Behkish et al., 2006; Orhan and Dursun, 2016). Based on hydrodynamic studies available in the literature, gas transfer in the bubble-liquid interface is affected by the physicochemical properties of the gas (Kluytmans et al., 2001), operational variables (Deckwer, 1992; Behkish et al., 2006), reactor geometry (Deckwer, 1992), and by how the gas is getting into the reactor system (Thorat and Joshi, 2004).
Despite the current broad knowledge about the mass transfer and hydrodynamics at the bubble-liquid interface, additional studies are needed especially about how surface films, such as the ones formed by surfactant compounds, can affect the gas transfer. According to literature, surfactants tend to reduce the interfacial transfer rate due to the formation of a surface film, which hinders oxygen diffusion (Leu et al., 1998; Painmanakul et al., 2005; Chen et al., 2013; Jimenez et al., 2014). However, it has been also reported that the mass transfer increases in the presence of surfactants, which decreases the size of the gas bubbles and, consequently, enlarges the surface area available for gas exchange (Dai et al., 2004; Gillot et al., 2005; Orhan and Dursun, 2016). According to Dai et al. (2004), these contradictory scenarios (surface film formation and bubble size decrease) depend on their relative magnitude, but the final effect changes according to the surfactant type.
Most commercial detergents have surfactants, such as sodium dodecyl sulfate (SDS), in their composition; therefore, these substances are widespread in wastewater and in polluted aquatic environments. The reported SDS concentration in domestic wastewater goes from 3 to 21 mg/L (0.01–0.07 mM) (Gupta et al., 2003), but it can be even higher in industrial wastewater. Adak et al. (2005) found approximate SDS concentration 8 · 103 mg/L (28 mM) in laundry wastewater.
Based on the exposed above, additional studies must be conducted to better understand how KLa is affected by surfactants. New aeration experiments must be carried out in solutions with surfactant concentration lower and higher than the critical micelle concentration (CMC). Thus, the aim of the current study was to investigate the effect of different SDS concentrations (lower and higher than the CMC) on the volumetric mass transfer coefficient of a cylindrical diffused air reactor and to develop a model to predict the SDS influence on the diffused air aeration process.
Materials and Methods
Apparatus and reagents
Aeration experiments were conducted in an acrylic cylindrical reactor with volume of 1.25 L (Fig. 1).

Schematic view showing diffused aeration system.
An air compressor (Regent 7500, 5 W power, 3.5 L/min capacity) was connected to an orifice at the bottom of the reactor (0.6 cm diameter). The airflow was measured using a rotameter (LZT M4, 0.05 L/min accuracy). A multiparameter probe (model HQ40D; Hach) with an LDO 101 sensor coupled (0.1 mg/L accuracy) was used to measure the DO at a specific temperature.
All the aeration experiments were performed under atmospheric pressure and at room temperature. The surfactant aqueous solutions were added on the top of the reactor, filled previously with deoxygenated tap water (salinity = 80 mg/L). SDS—C12H25SO4Na at 99% purity—was the surfactant used in the current study. The SDS is an anionic surfactant inherent to the formulation of several commercial detergents that have hydrophilic–lipophilic balance (HLB) value equal to 40 (Chen et al., 2013).
CMC determination experiments
CMC is an important characteristic for surfactants and is defined as the concentration above which micelles are formed in a bulk phase.
The CMC value was measured based on the slope changes in the electrical conductivity curve as a function of the surfactant concentration (Bielawska et al., 2013). SDS doses were added to the reactor and the electrical conductivity of the solution after the addition was measured using a 3% accuracy conductivity probe by Vernier (model: COM-BTA).
Oxygen transfer experiments (aeration)
To evaluate how the volumetric mass transfer coefficient (KLa) changes as function of the surfactant concentration, we have used the equilibrium disturbance method, suggested by Barnhart (1995). In this method, before each experiment, the DO concentration in the system was disturbed—reduced to values below 1 mg/L—using nitrogen gas (stripping method). After that, KLa was calculated by measuring the return-to-equilibrium time rate, which is given through Equation (1).
where Cs is the DO concentration of saturation (mg/L), C is the DO concentration (mg/L), and t is time (min).
The analytical solution of the Equation (1) was adjusted to the data and the KLa was estimated, using the nonlinear regression analysis technique presented by ASCE (2007).
It is important to notice that the water temperature variation in each experiment was lower than 0.5°C. We have corrected all KLa values to 20°C using the Arrhenius equation modified by Streeter and Phelps (1925):
where T is the mean water temperature in the aeration experiments (°C) and θ is the temperature correction coefficient, whose value was 1.0241, based on Elmore and West (1961).
In total, 68 aeration experiments were performed, varying the airflow in the reactor (0.2, 0.4, 0.6, and 0.8 L/min) and the SDS concentrations (0.0, 0.02, 0.04, 0.06, 0.12, 0.18, 0.24, 0.30, 0.60, 0.90, 1.20, 1.50, 1.57, 1.70, 2.00, 2.30, and 2.60 mM). These concentrations were chosen to assess the SDS effect on the aeration at concentrations lower and higher than the CMC.
Results and Discussion
CMC determination
The CMC should be evaluated to better understand the surfactant influence on the oxygen mass transfer during an aeration experiment.
Figure 2 shows that the electrical conductivity of the surfactant solution linearly increases as SDS concentration increases until an abrupt drop point. At this drop point, a spontaneous association of molecules makes aggregates called “micelles” and this related SDS concentration is well known as CMC.
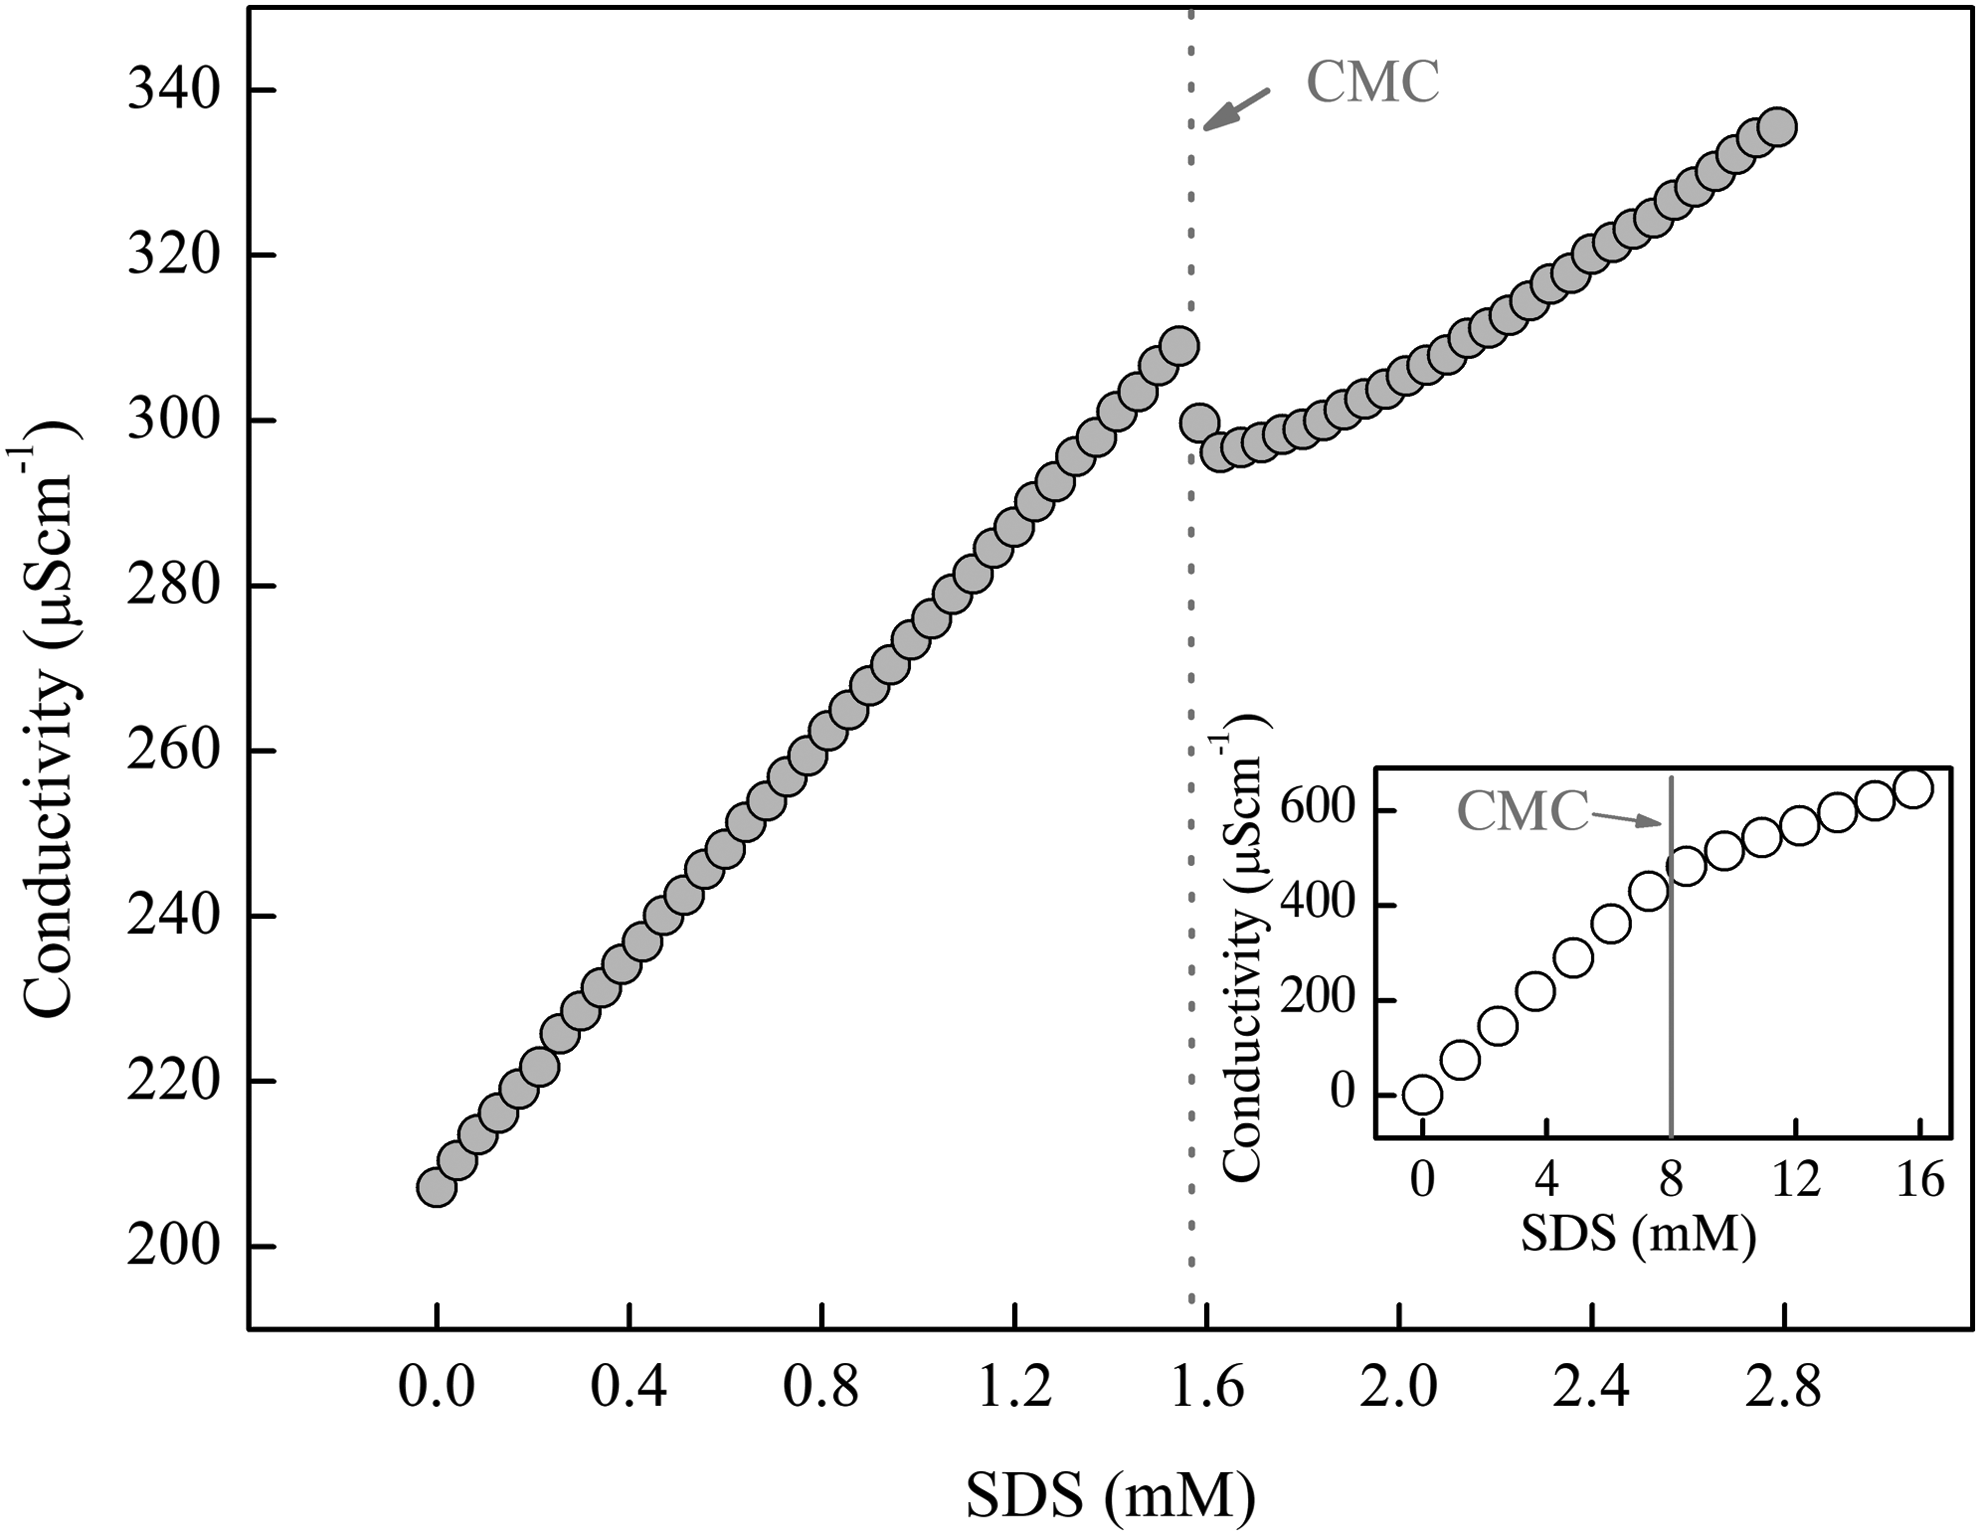
Electrical conductivity as a function of SDS concentration. Inset shows the CMC measured using deionized water. CMC, critical micelle concentration; SDS, sodium dodecyl sulfate.
The CMC value found in the current study was 1.57 mM. This value is relatively lower than that reported for the SDS solution in deionized water, which was ∼8.0 mM (Rizzatti et al., 2009; Alam et al., 2017). The reduced CMC value of 1.57 mM can be attributed to the additional concentration of salts found in the tap water, used in our experiments. To corroborate this statement, we have also estimated the concentration of salts (ions) in the tap water through ionic chromatography. The results are shown in the Table 1. We also have included a figure that shows a CMC value of ∼8.0 mM for a SDS solution using deionized water (see the inset of Fig. 2).
Tap Water Chemical Composition
BQL, below the quantification limit.
In deionized water, hydrophilic groups (heads) of the surfactants are very close to each other during micelle formation and such proximity generated an electrostatic repulsion making the micelles formation difficult. On the contrary, in a salt solution, the counterions coat and shield the colloidal-structure charge and decrease the electric potential. This process attracts the monomer heads to each other, facilitates the micelle formation, and anticipates the CMC (Rizzatti et al., 2009; Zhang et al., 2013).
Aeration experiments
Air-injection compressors are responsible for almost 70% of the total consumed energy in wastewater treatment units (Jimenez et al., 2014). Therefore, researchers in this field are constantly interested in optimizing the oxygen mass transfer to a liquid volume.
Figure 3 shows the aeration curves, without SDS, generated for different airflows. We could observe that the aeration curves reached saturation faster (oxygen saturation concentration approximately of 7.6 mg/L) when we increased the airflow rate. Increases in airflow led to a larger specific interface area (a) and, consequently, to higher KLa values (Painmanakul et al., 2005; Chen et al., 2013; Baker et al., 2016). All our experiments were conducted at 25°C and under atmospheric pressure 938.2 hPa. Figure 3 also shows a good adjustment between the analytical solution of the Equation (1) and the aeration data. We found a good correlation coefficient (R2 > 0.95) for all experiments. Based on this, the Equation (1) can be used to model the aeration process and, consequently, to accurately estimate KLa values.
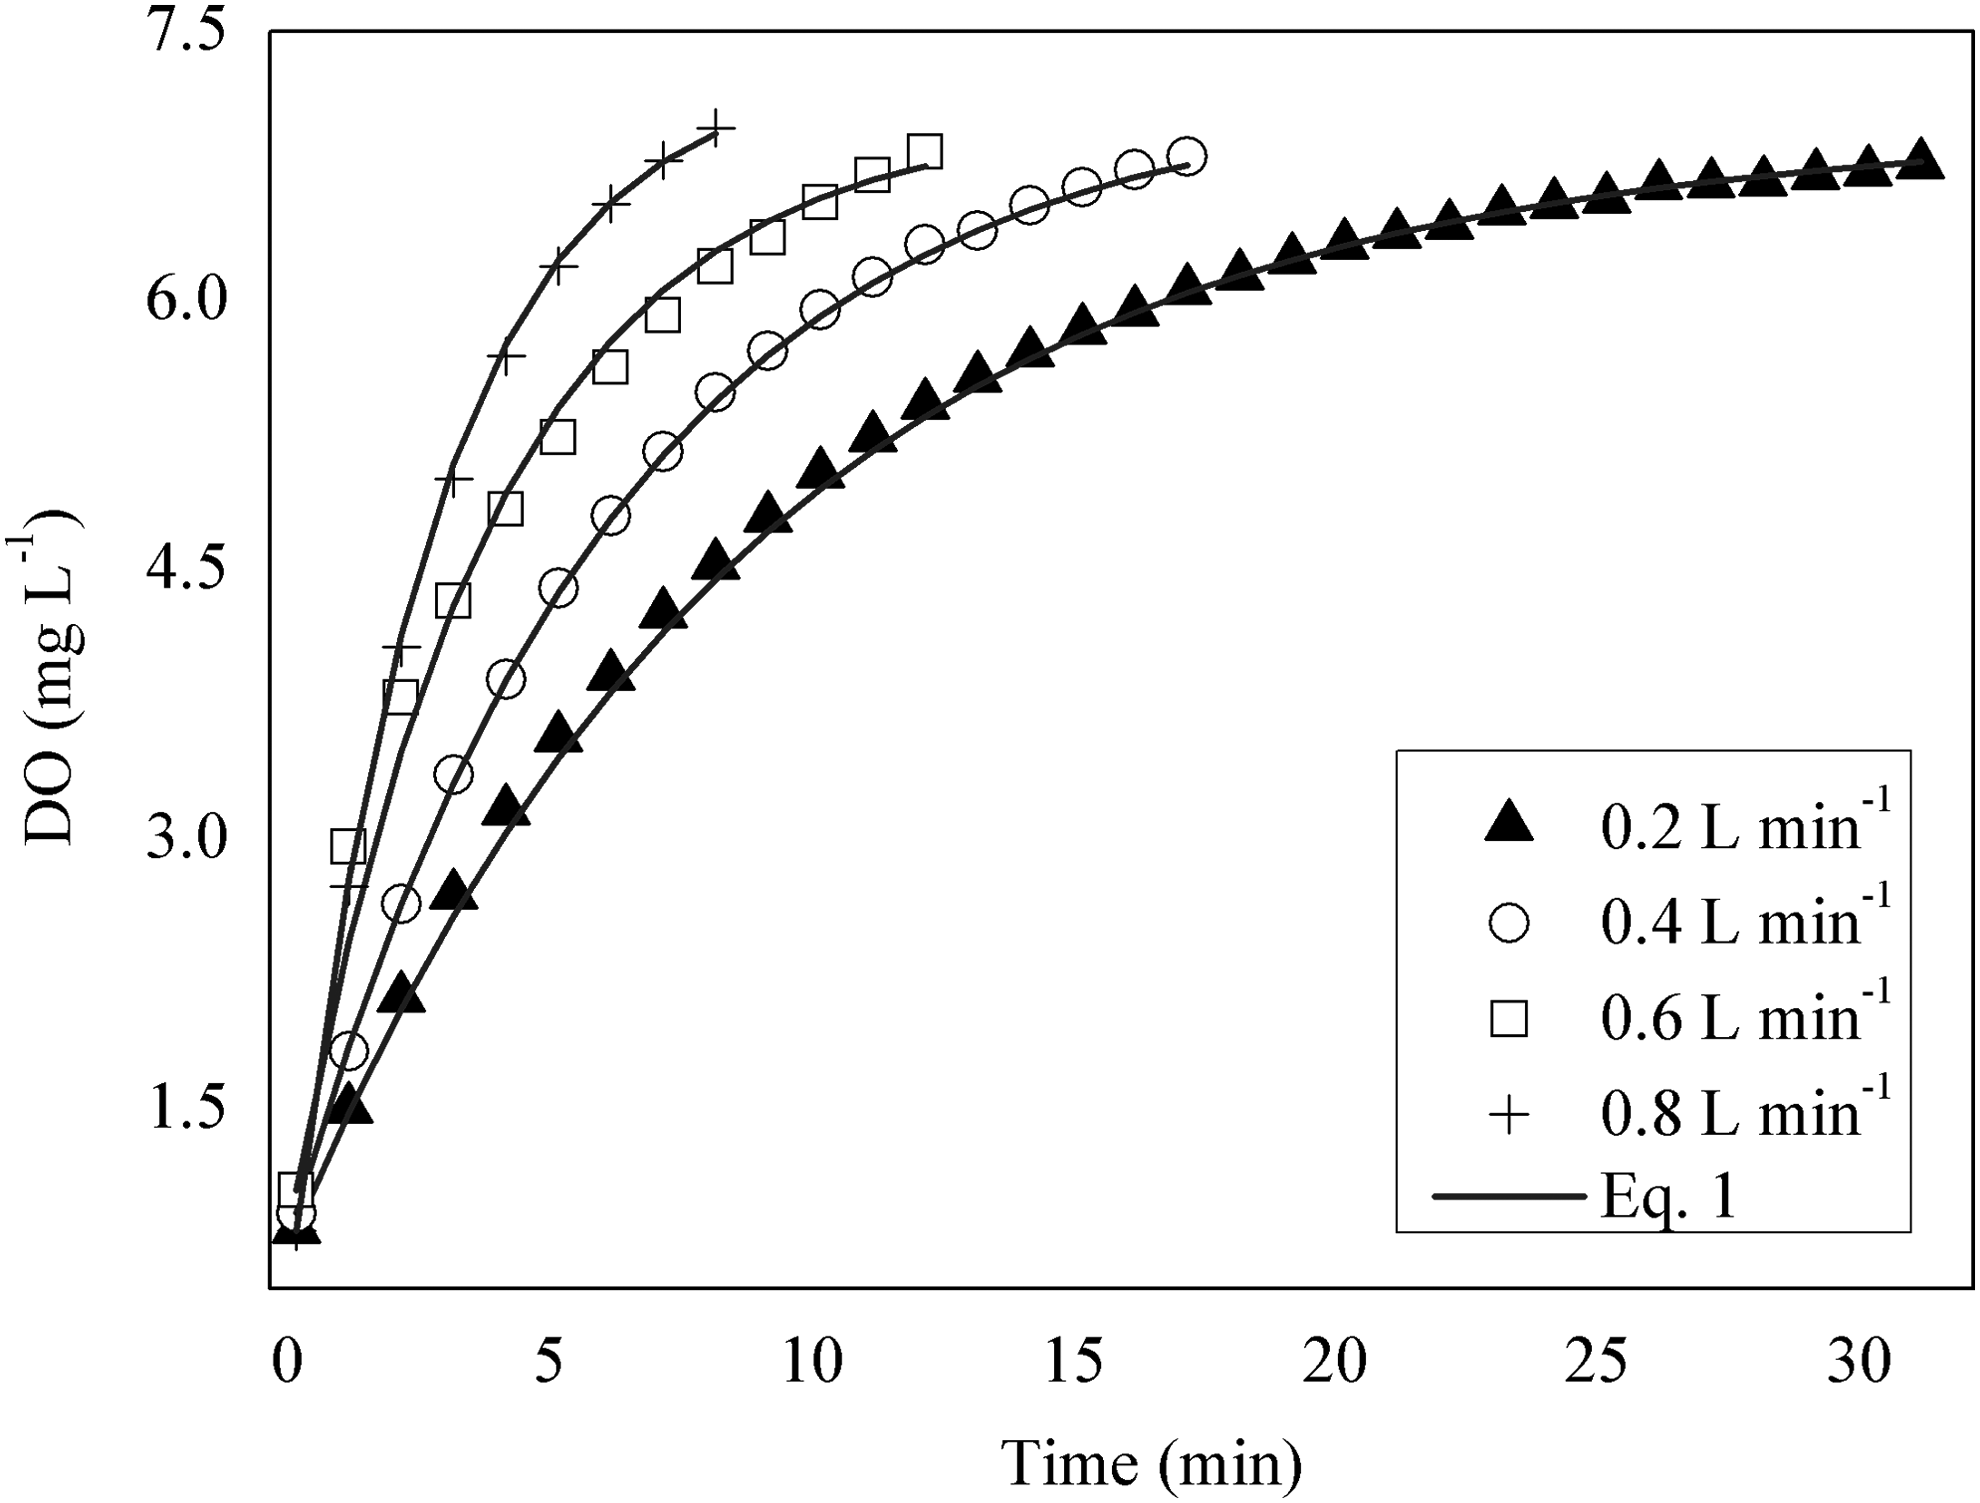
Aeration curves in lack of surfactant, at airflow rates 0.2, 0.4, 0.6, and 0.8 L/min.
Figure 4 shows the KLa behavior, based on different airflows and SDS concentrations.
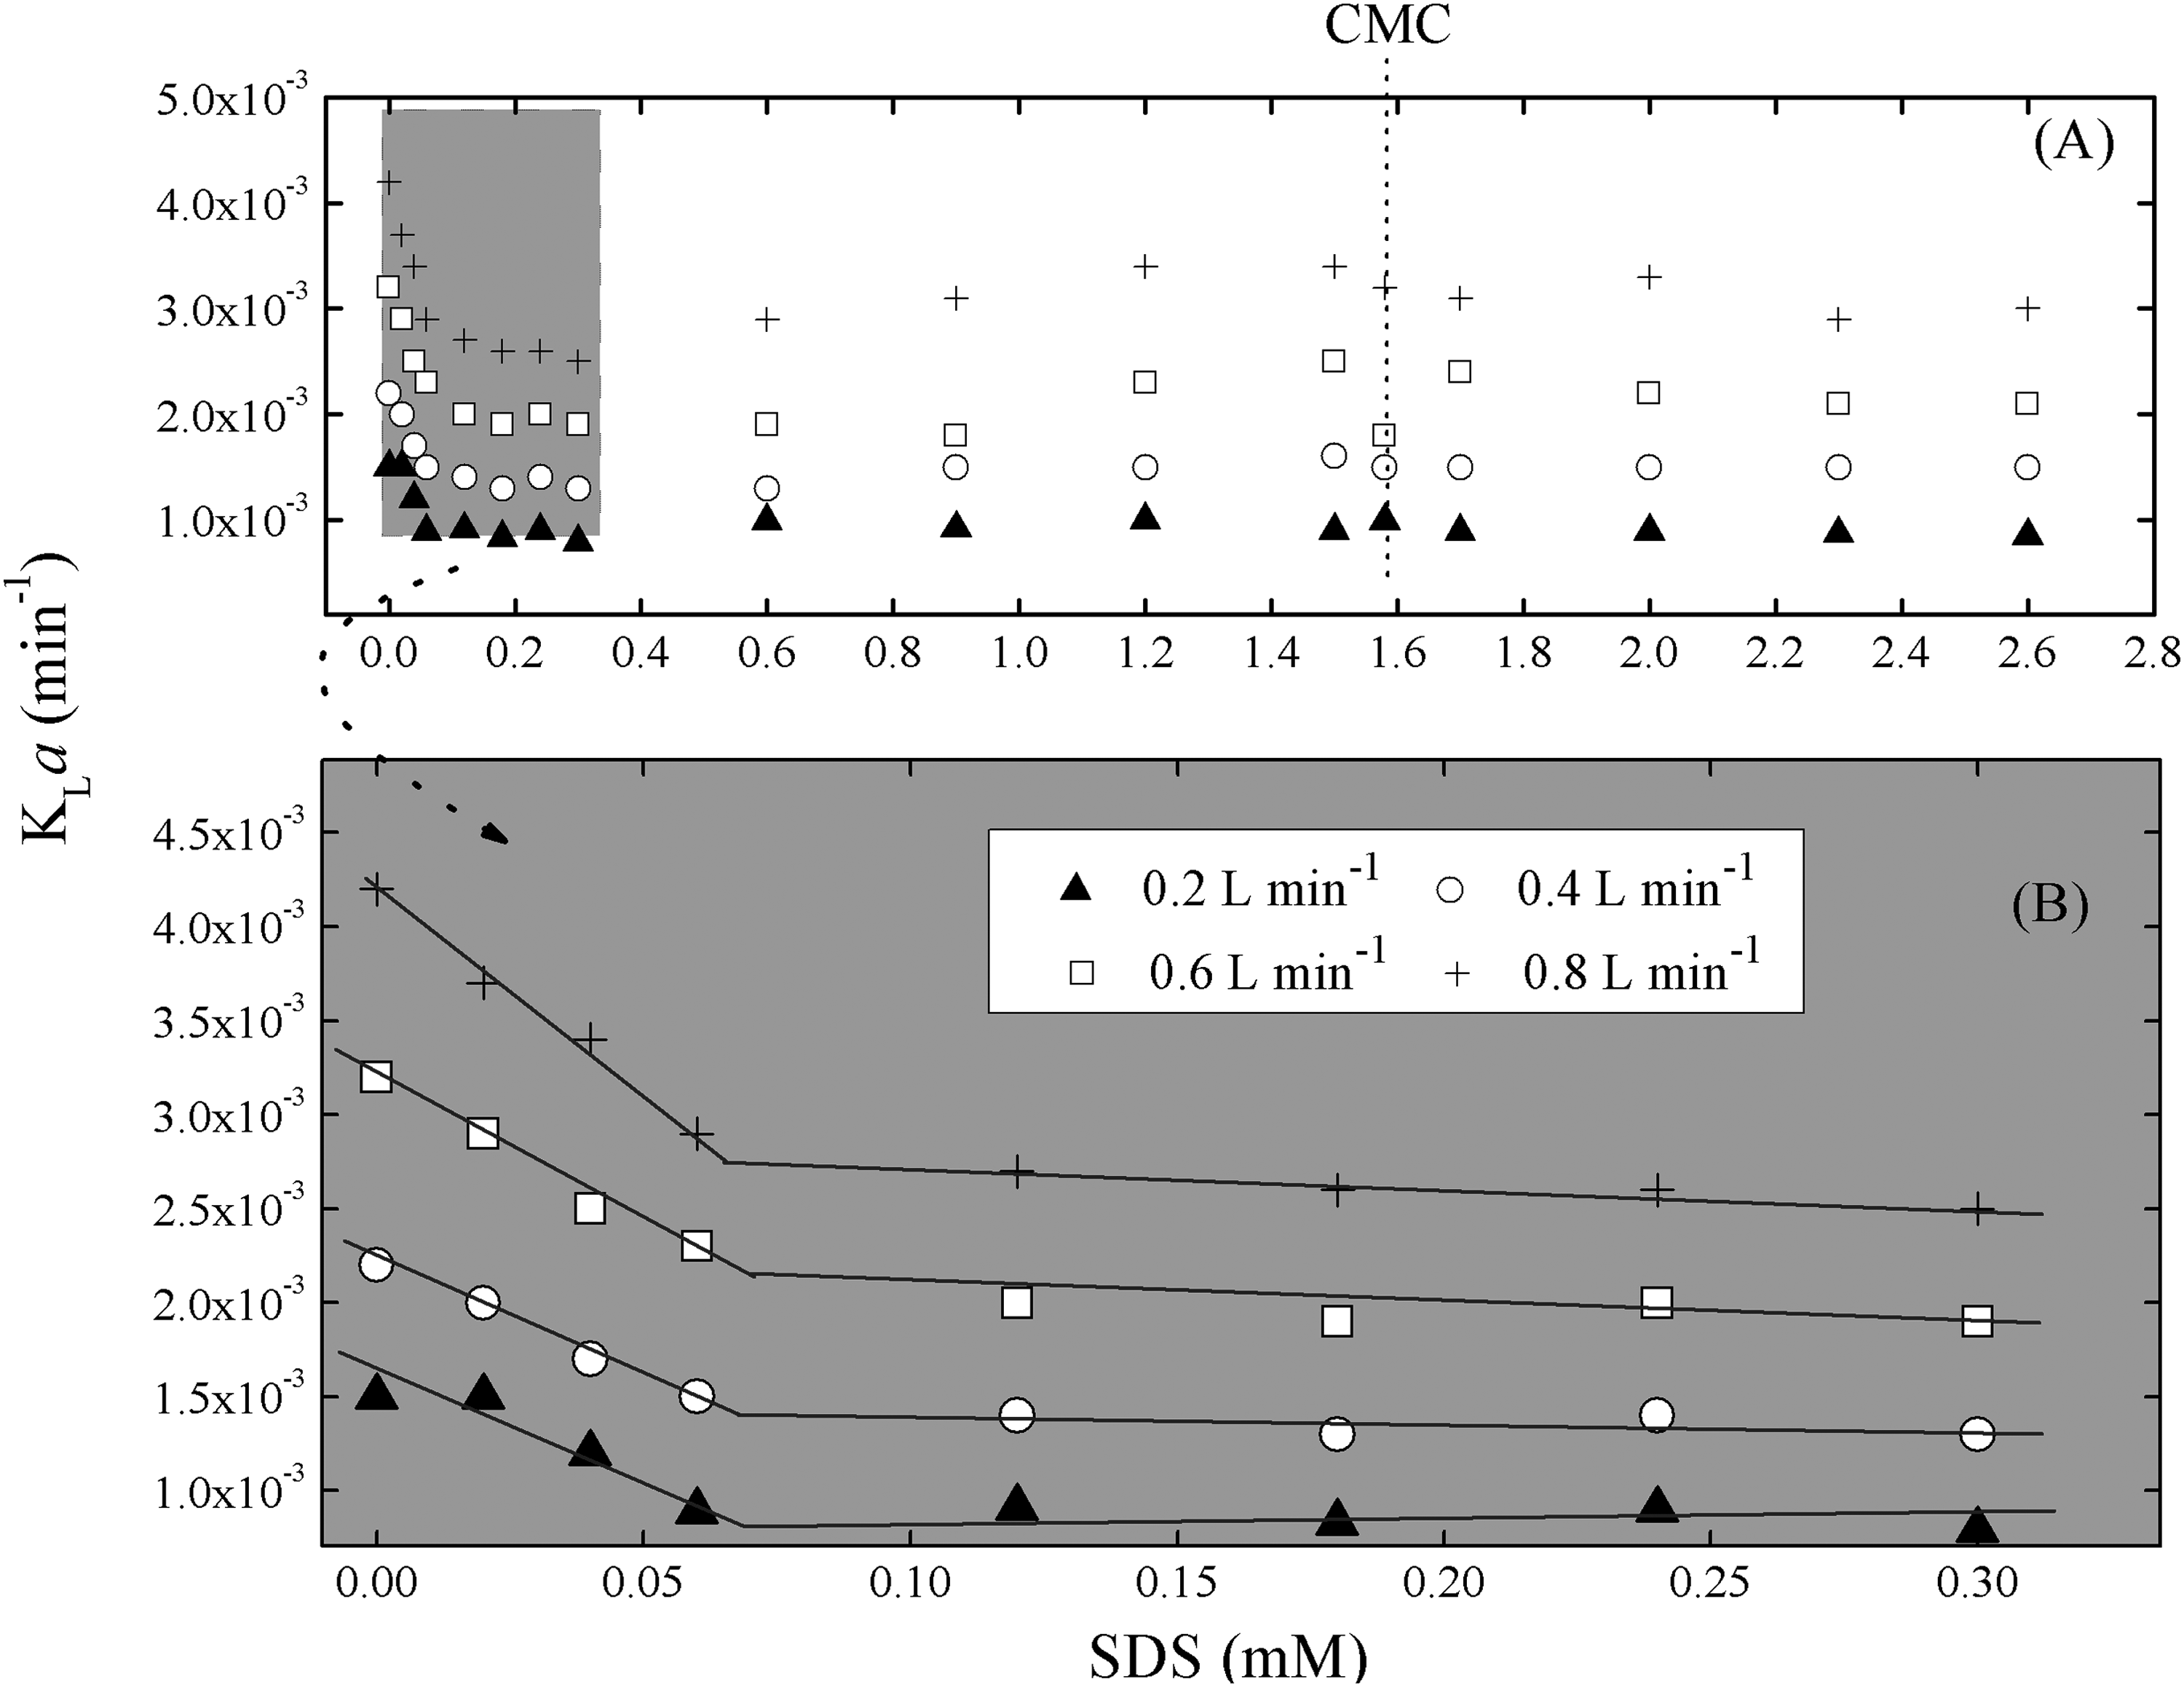
KLa behavior based on SDS concentrations:
KLa curves, based on different anionic surfactant concentrations, showed similar behavior, regardless of the inlet airflow in the reactor (Fig. 4A). The KLa value decreased as surfactant concentration increased. We observed a maximum reduction rate at concentration range 0–0.07 mM. KLa showed minor oscillations after this range (Fig. 4B).
It is believed that the maximum KLa reduction rate at SDS concentration range from 0 to 0.07 mM is due to a more effective barrier effect produced by the anionic surfactant monomers interactions and the surface of air bubbles (see Fig. 5, which shows a hypothetic view of the molecular interactions among air bubbles, SDS, and water molecules, during an aeration process). The barrier effect can be estimated using the Se parameter, which may vary from 0 to 1. The Se value close to 0 represents a surface unoccupied by surfactants; thus, oxygen is able to pass through the surface of the bubble without resistance (Fig. 5A).
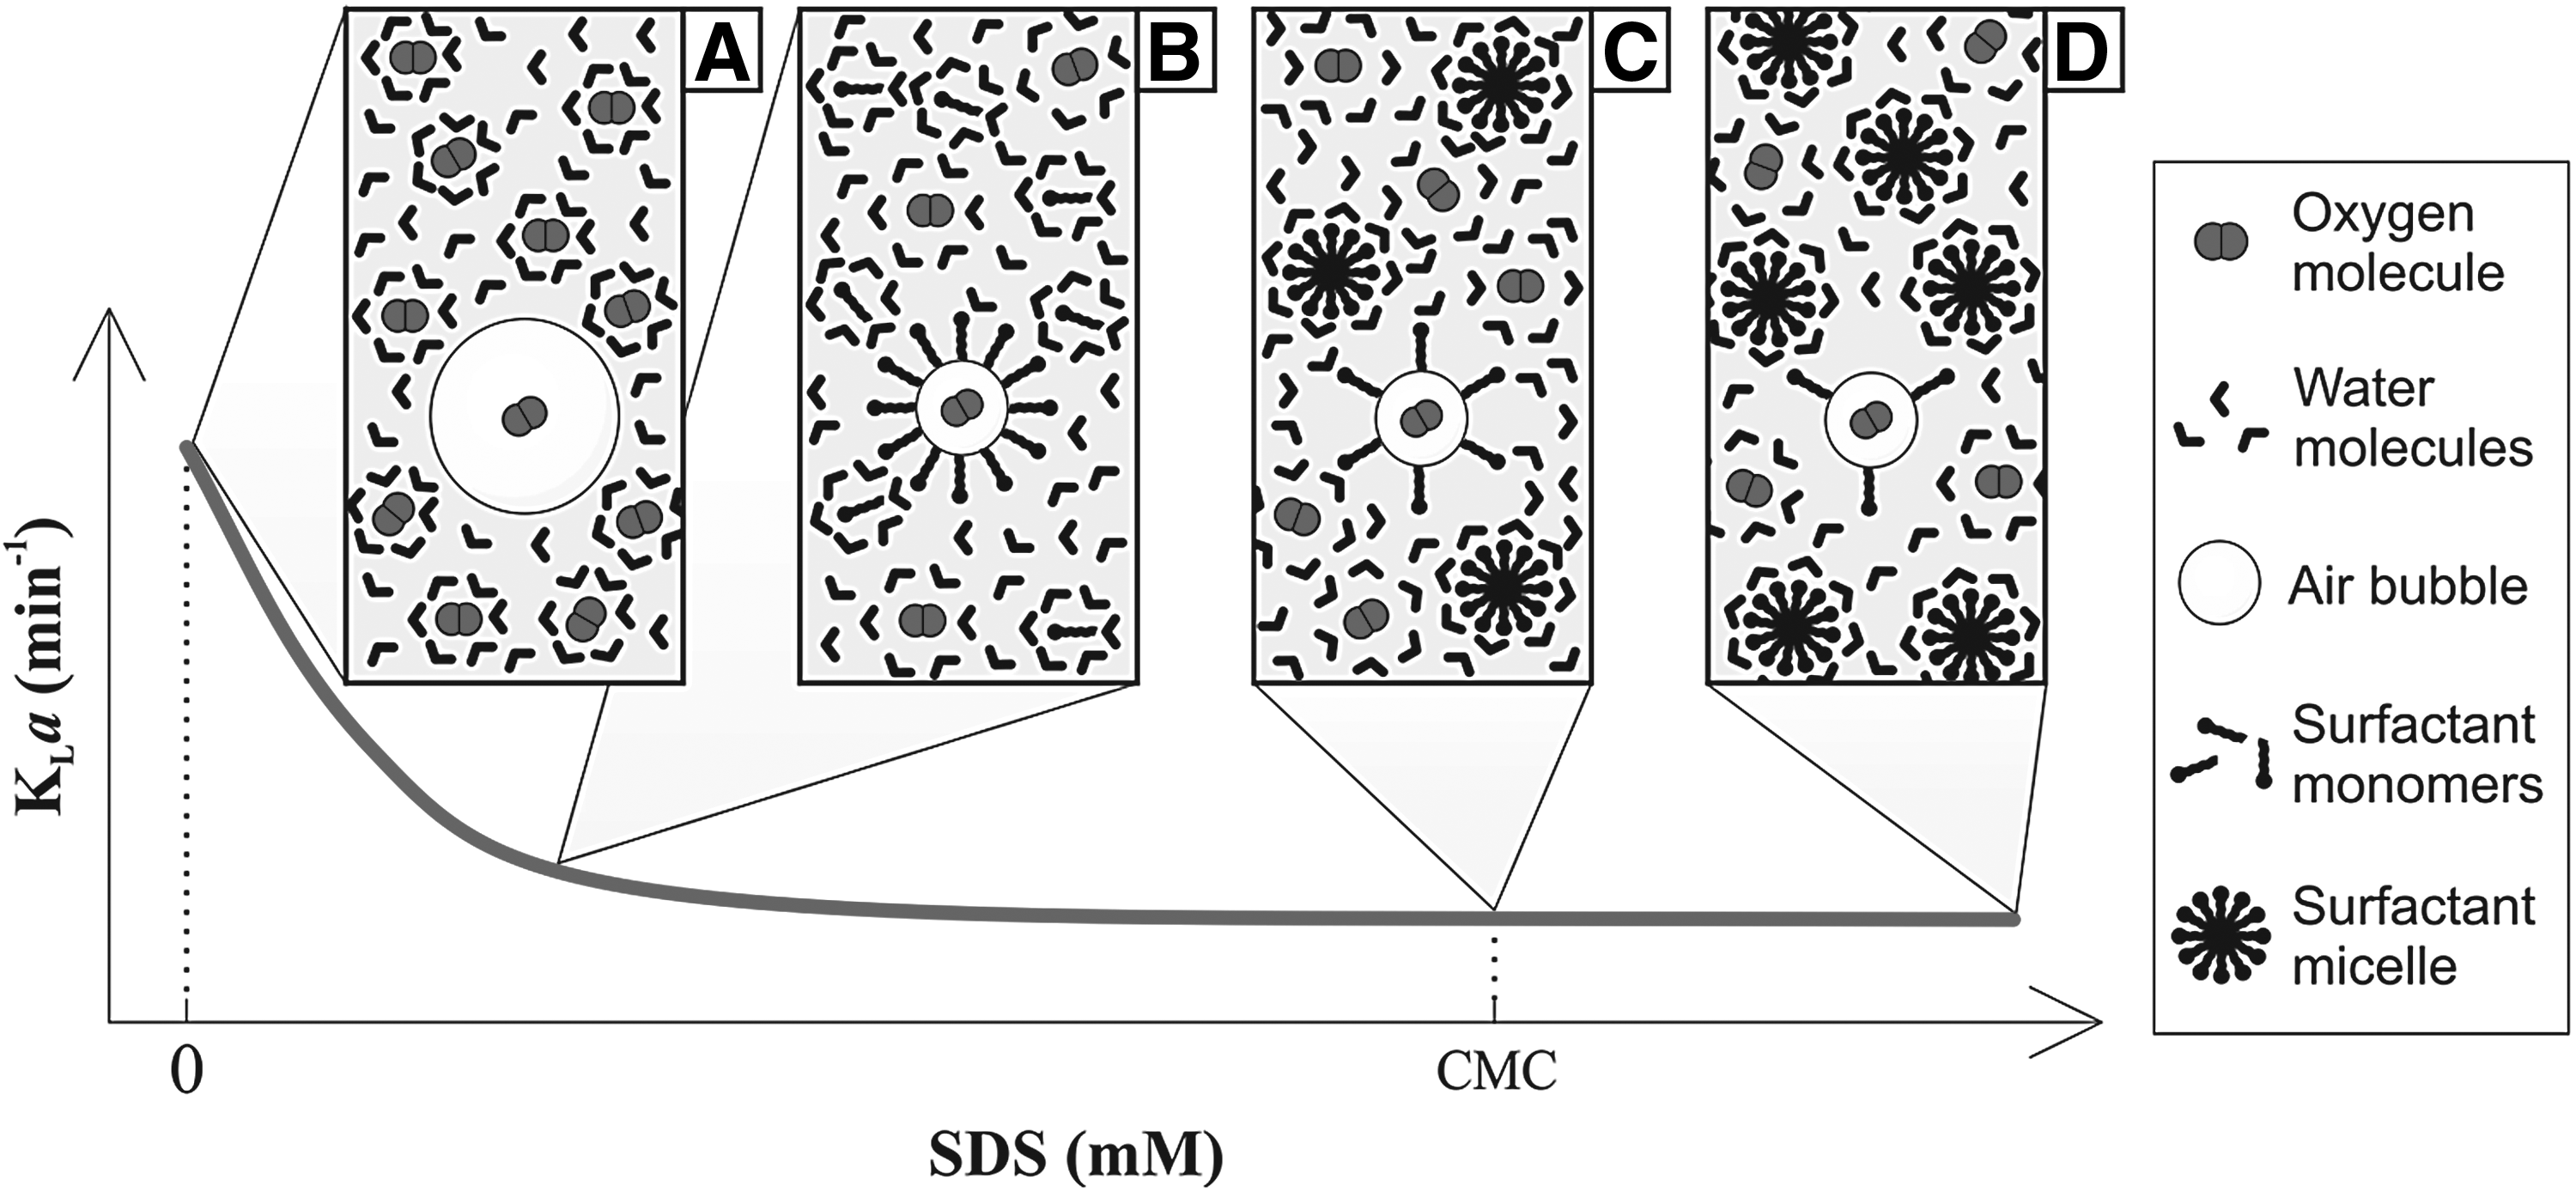
Surfactant behavior at air-water interface and its interaction with water molecules in:
Chen et al. (2013) estimated Se for SDS. They showed that Se rapidly increases at SDS concentration ranging from 0 to 10 mg/L (0–0.035 mM) and keeps on slowly increasing until SDS concentration reaches 20 mg/L (0.07 mM). Results found by Chen et al. (2013) corroborate our findings, since the SDS concentration range leading to the greatest decrease in KLa coincided with the range at which Se was 1 (0–0.07 mM), regardless of airflows.
As the surfactant concentration increases, the air bubble surface becomes occupied by surfactants and Se value gets close to 1, fact that makes it difficult transferring oxygen to the liquid medium (Fig. 5B). This behavior has been nominated as barrier effect. The influence of the barrier effect on the oxygen mass transfer at the air–water interface was also recorded by Dumont and Delmas (2003), Painmanakul et al. (2005), and Jimenez et al. (2014).
Air bubbles tend to be smaller with increasing surfactant concentration due to the decreasing in the surface tension itself (Loubière and Hébrard 2004). Consequently, the air bubble specific interfacial area (a) increases, which is favorable to the oxygen transfer. In addition, when the concentration of surfactants becomes thermodynamically favorable to the formation of soluble aggregates called micelles (Fig. 5C), the barrier effect reduces because the interaction between monomers and air bubbles is thermodynamically unfavorable compared to the interaction between the surfactant monomers themselves to form micelles (Fig. 5D). On the contrary, above CMC, the drag coefficient of the bubbles increases, and the ascending speed of the bubbles is reduced, which leads to an oxygen transfer decreases (Alves et al., 2005). Those phenomena combine keeps the KLa values roughly constant at surfactant concentrations higher than 0.07 mM.
Model adopted to estimate oxygen transfer reduction
We developed a mathematical model based on the experimental results to better understand how KLa depends on the surfactant concentration in a cylindrical reactor. The dimensionless parameter (β) is herein introduced [Eq. (3)] to represent the oxygen transfer reduction resulting from the presence of SDS:
where KLaS is the KLa value recorded in a test performed with SDS (min−1), KLa0 is the KLa value recorded in a test performed without surfactant (min−1).
The β at different SDS concentrations can be estimated using a model built on the hypothesis that the KLa reduction rate based on the SDS concentration (CSDS) is proportional to the product μ × (βmax − β); where μ is a first-order kinetic coefficient (min−1), (βmax − β) represents the KLa reduction potential at a specific SDS concentration, βmax represents the maximum KLa reduction. Thus, the β variation based on the anionic surfactant concentration becomes:
The analytical solution for the Equation (4) may be obtained through the integration of separable differentials [Eq. (5)]:
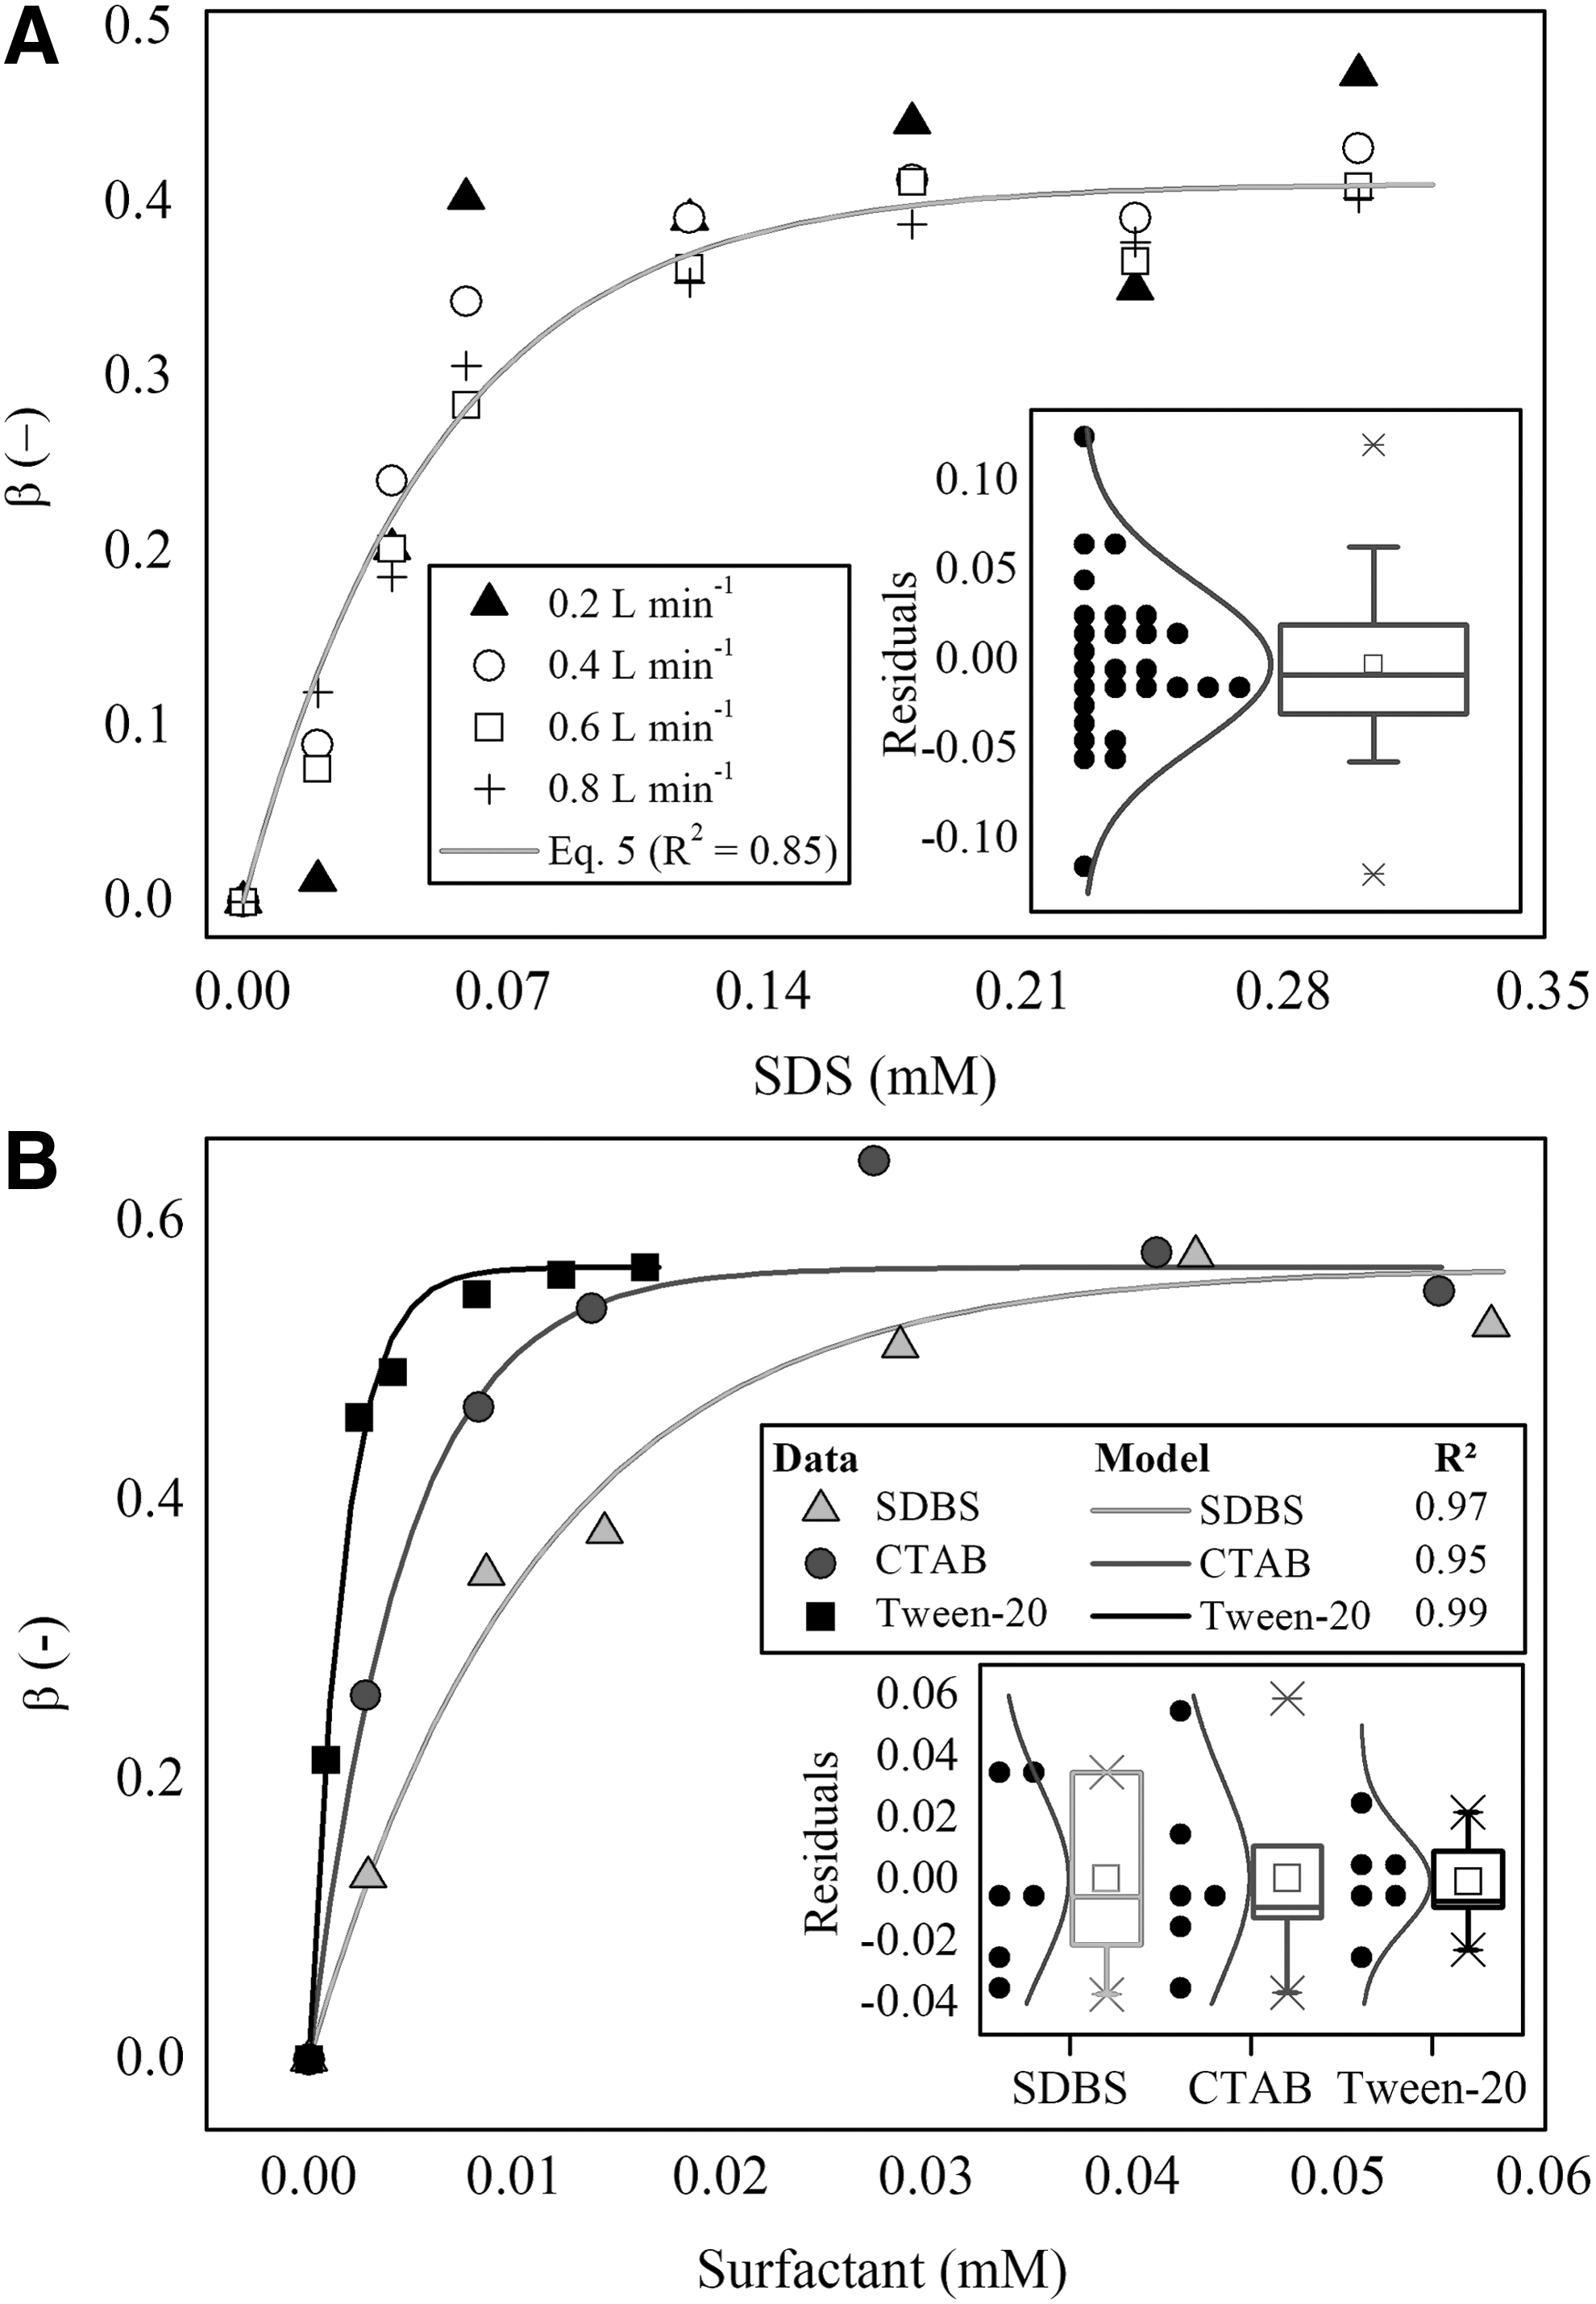
We applied a frequency analysis to the residuals, based on Ghasemi and Zahediasl (2012), to verify how our experimental data adjust to the model (Fig. 6A). The data set was assessed for normality using the Shapiro–Wilk test (5% of significance). The data distribution was not significantly different from normal (W = 0.959, p = 0.324).
Model adjustment
Equation (5) was applied to predict β behavior at the range 0–0.3 mM, since the maximum KLa reduction happens within this range (Fig. 6A). The model adjustment to the experimental data, as well as the βmax and μ estimates, was performed according to the integral method proposed by Chapra (2008).
The oxygen transfer reduction, represented by β, reached a maximum of 41% (βmax = 0.41). The β variation based on the anionic surfactant concentration (dβ/dCSDS) was greater at low SDS concentrations (0–0.07 mM) and close to zero at approximate SDS concentration 0.3 mM, since monomers covered the entire surface of the bubbles.
We found μ equal to 19.3/mM; as the μ value increases, the KLa reduction potential also increases, even at low surfactant concentrations.
Our model can represent other experimental data (Fig. 6B). Equation (5) was used to predict the oxygen transfer reduction observed by Chen et al. (2013), who have assessed the effects of different surfactants on a fine bubble aeration system. Sodium dodecyl benzene sulfonate (SDBS), dodecyl trimethyl ammonium bromide (CTAB), and polyoxyethylene (20) (Tween-20)—which are anionic, cationic, and neutral surfactants, respectively—are among the surfactants used by Chen et al. (2013) in their study.
According to the results in Fig. 6B, βmax tends to a single value, regardless of the surfactant type. However, βmax is reached at different concentrations, depending on the chemical structure of the surfactant. We found the βmax of Tween-20, CTAB, and SDBS at concentrations 0.009, 0.025, and 0.06 mM, respectively; because they have different kinetic coefficients (μ): 600/mM (Tween-20); 220/mM (CTAB); and 90.5/mM (SDBS). The βmax values from ours and Chen et al. (2013) results are quite different. We believe that discrepancy can be related to the different reactor and aeration system used in both works. To better understand this hypothesis, further experiments using different aeration systems need to be done.
We also applied a frequency analysis to the residuals to verify how our model adjust to the data reported in the literature (Fig. 6B) and assessed this data set for normality using the Shapiro–Wilk test (5% of significance). The data distribution was not significantly different from normal for Tween-20 (W = 0.988, p = 0.983), CTAB (W = 0.882, p = 0.281), nor SDBS (W = 0.899, p = 0.368).
Our model is a simpler alternative to other models available in the literature (Painmanakul et al., 2004; Sardeing et al., 2006; García-Albuín et al., 2010; Chen et al., 2013), because these models depend on parameters such as Se and HLB, which are harder to measure.
Conclusions
We investigated the effect of SDS on the volumetric oxygen mass transfer coefficient. We conducted the experiments in a cylindrical reactor aerated by an air compressor. Based on our results:
The SDS in the water reduced the volumetric oxygen mass transfer coefficient. We reported the higher KLa reduction rate at SDS concentration ranging from 0 to 0.07 mM, before the CMC. The air bubble coverage phenomenon caused by SDS monomers was the main factor responsible for hindering oxygen transfer at the bubble-water interface. KLa values remained approximately constant at SDS concentration higher than 0.07 mM. The KLa curves, as a function of the SDS concentration, presented similar behavior for all inlet airflows in the reactor. Our model adjusted well to the experimental data. We found a maximum KLa reduction by 41%, regardless of the inlet airflow rate in the reactor.
Footnotes
Acknowledgments
The authors are grateful to Fundação de Amparo à Pesquisa do Estado de Minas Gerais—FAPEMIG, to Coordenação de Aperfeiçoamento de Pessoal de Nível Superior—CAPES and to Conselho Nacional de Desenvolvimento Científico e Tecnológico—CNPq, for their support.
Author Disclosure Statement
The authors declare no conflict of interest.