
Abstract
Abstract
Plant-based dairy alternatives are purchased by consumers for environmental, nutritional, or health-related reasons. Yet, some plant-based alternatives require large quantities of water and materials to produce. Additionally, these products are transported long distances to retail stores, such as almond products produced in California. A comparative midpoint life cycle assessment (LCA) is presented to evaluate the environmental impacts, and in particular embodied energy, and embodied water of conventional dairy milk with two plant-based alternatives: almond milk and soy milk. The scope of the study considers the life cycle stages of agricultural production, transportation to the processing plant, milk processing, transportation to the retail store in Chicago, and retail. A volumetric functional unit (FU), liter of milk, and nutritional FU, kilogram of protein, were used for comparison. Data were compiled from the LCA literature and U.S. patents, and the TRACI, BEES+, and Cumulative Energy Demand impact assessment methods were used. Monte Carlo simulation was used for uncertainty analysis associated with all inputs in the LCA model. It was found that the dominant life cycle stages for dairy, soy, and almond milk are the production and retail phases from a cradle-to-retail perspective. Dairy milk had the highest impacts in 6 of the 12 impact categories, whereas soy milk had the highest impacts in 4 categories using a volumetric FU. Almond milk has the highest impacts in noncarcinogenics largely from the use of zinc fertilizer and water use from irrigation. Almond milk has the highest impacts in all impact categories with 1 kg of protein, with results at least five times higher than soy milk, and at least two times higher than dairy milk in all impact categories. In nutrition, almond milk provides disadvantages due to its low protein content compared with dairy milk. Yet, protein has only one nutritional benefit, and there are other positive and negative nutritional benefits of these products to consider. The study illustrates that FU choice has a strong influence on the food product LCA results and interpretations and suggests that 2 or more FUs are necessary for food LCA studies. It may be desirable in future work to compare additional nutritional FUs, such as calories, to inform consumer choice and integrate nutritional and environmental assessments of food products.
Introduction
C

2015 milk market (Adams, 2017).
Among the dairy milk alternatives, almond milk and soy milk are the most popular products (Plant-Based Foods Association, 2016). Recently, there has been discussion over prohibiting the use of the word “milk” for nondairy products with respect to the differences in nutritional contents (Ellefson, 2018). For the purposes of this work “milk” will be utilized to refer to a dairy milk or nondairy milk substitute, as is common practice in the United States. From a nutritional standpoint, soy milk contains 80–100 calories and 7 g of protein per cup (Krans, 2017). This is similar in protein and about equal to the calories in 1% or 2% dairy milk. Almond milk is growing in popularity for those desiring soy-free alternatives. It is low in calories, but at the same time, almond milk has a low quantity of protein (∼1 g per cup) (USDA, 2018). From an environmental perspective, large quantities of water are needed to cultivate almonds. Additionally, 80% of almonds are grown in California, relying on long-distance transportation for consumption of almond milk in other U.S. states (Kendall et al., 2015). Weber and Matthews (2008) compared food groups produced and distributed across the United States and concluded that greenhouse gas (GHG) emissions associated with transport of different food groups in the United States, using various transportation modes, are dominated by the production phase despite some food items being transported long distances (Weber and Matthews, 2008). However, nonred meat protein sources (chicken/fish/eggs/nuts) are the exception and have lower production impacts, but higher impacts due to transportation. Weber and Matthews (2008) suggest that dietary shifts from dairy products to nuts are the most effective means of lowering a consumer's environmental footprint as it achieves more GHG reduction than buying all locally sourced food.
Life cycle assessment (LCA) has been used to evaluate the environmental impacts of various food production chains, such as dairy products (Berlin, 2002; Hospido et al., 2003; Berlin et al., 2008; Rotz et al., 2010). Many studies have assessed the environmental impacts of milk production at the farm stage, but several have also included postfarm gate stages (Kim et al., 2013; Thoma et al., 2013). A small selection of the recent dairy milk studies is shown in Table 1, showing a large variability in GHG emissions due to differences in location and functional unit (FU).
Study is a comparative LCA.
Study is a literature review.
ECM, energy-corrected milk; FPCM, fat and protein-corrected milk; GHG, greenhouse gas; LCA, life cycle assessment.
Figure 2 shows a comparison of the eutrophication impacts of several corn production inventories for dairy milk. It is important to emphasize the large variability and uncertainty in cropping inputs and yields, especially due to location and season, which can affect the overall impact results.
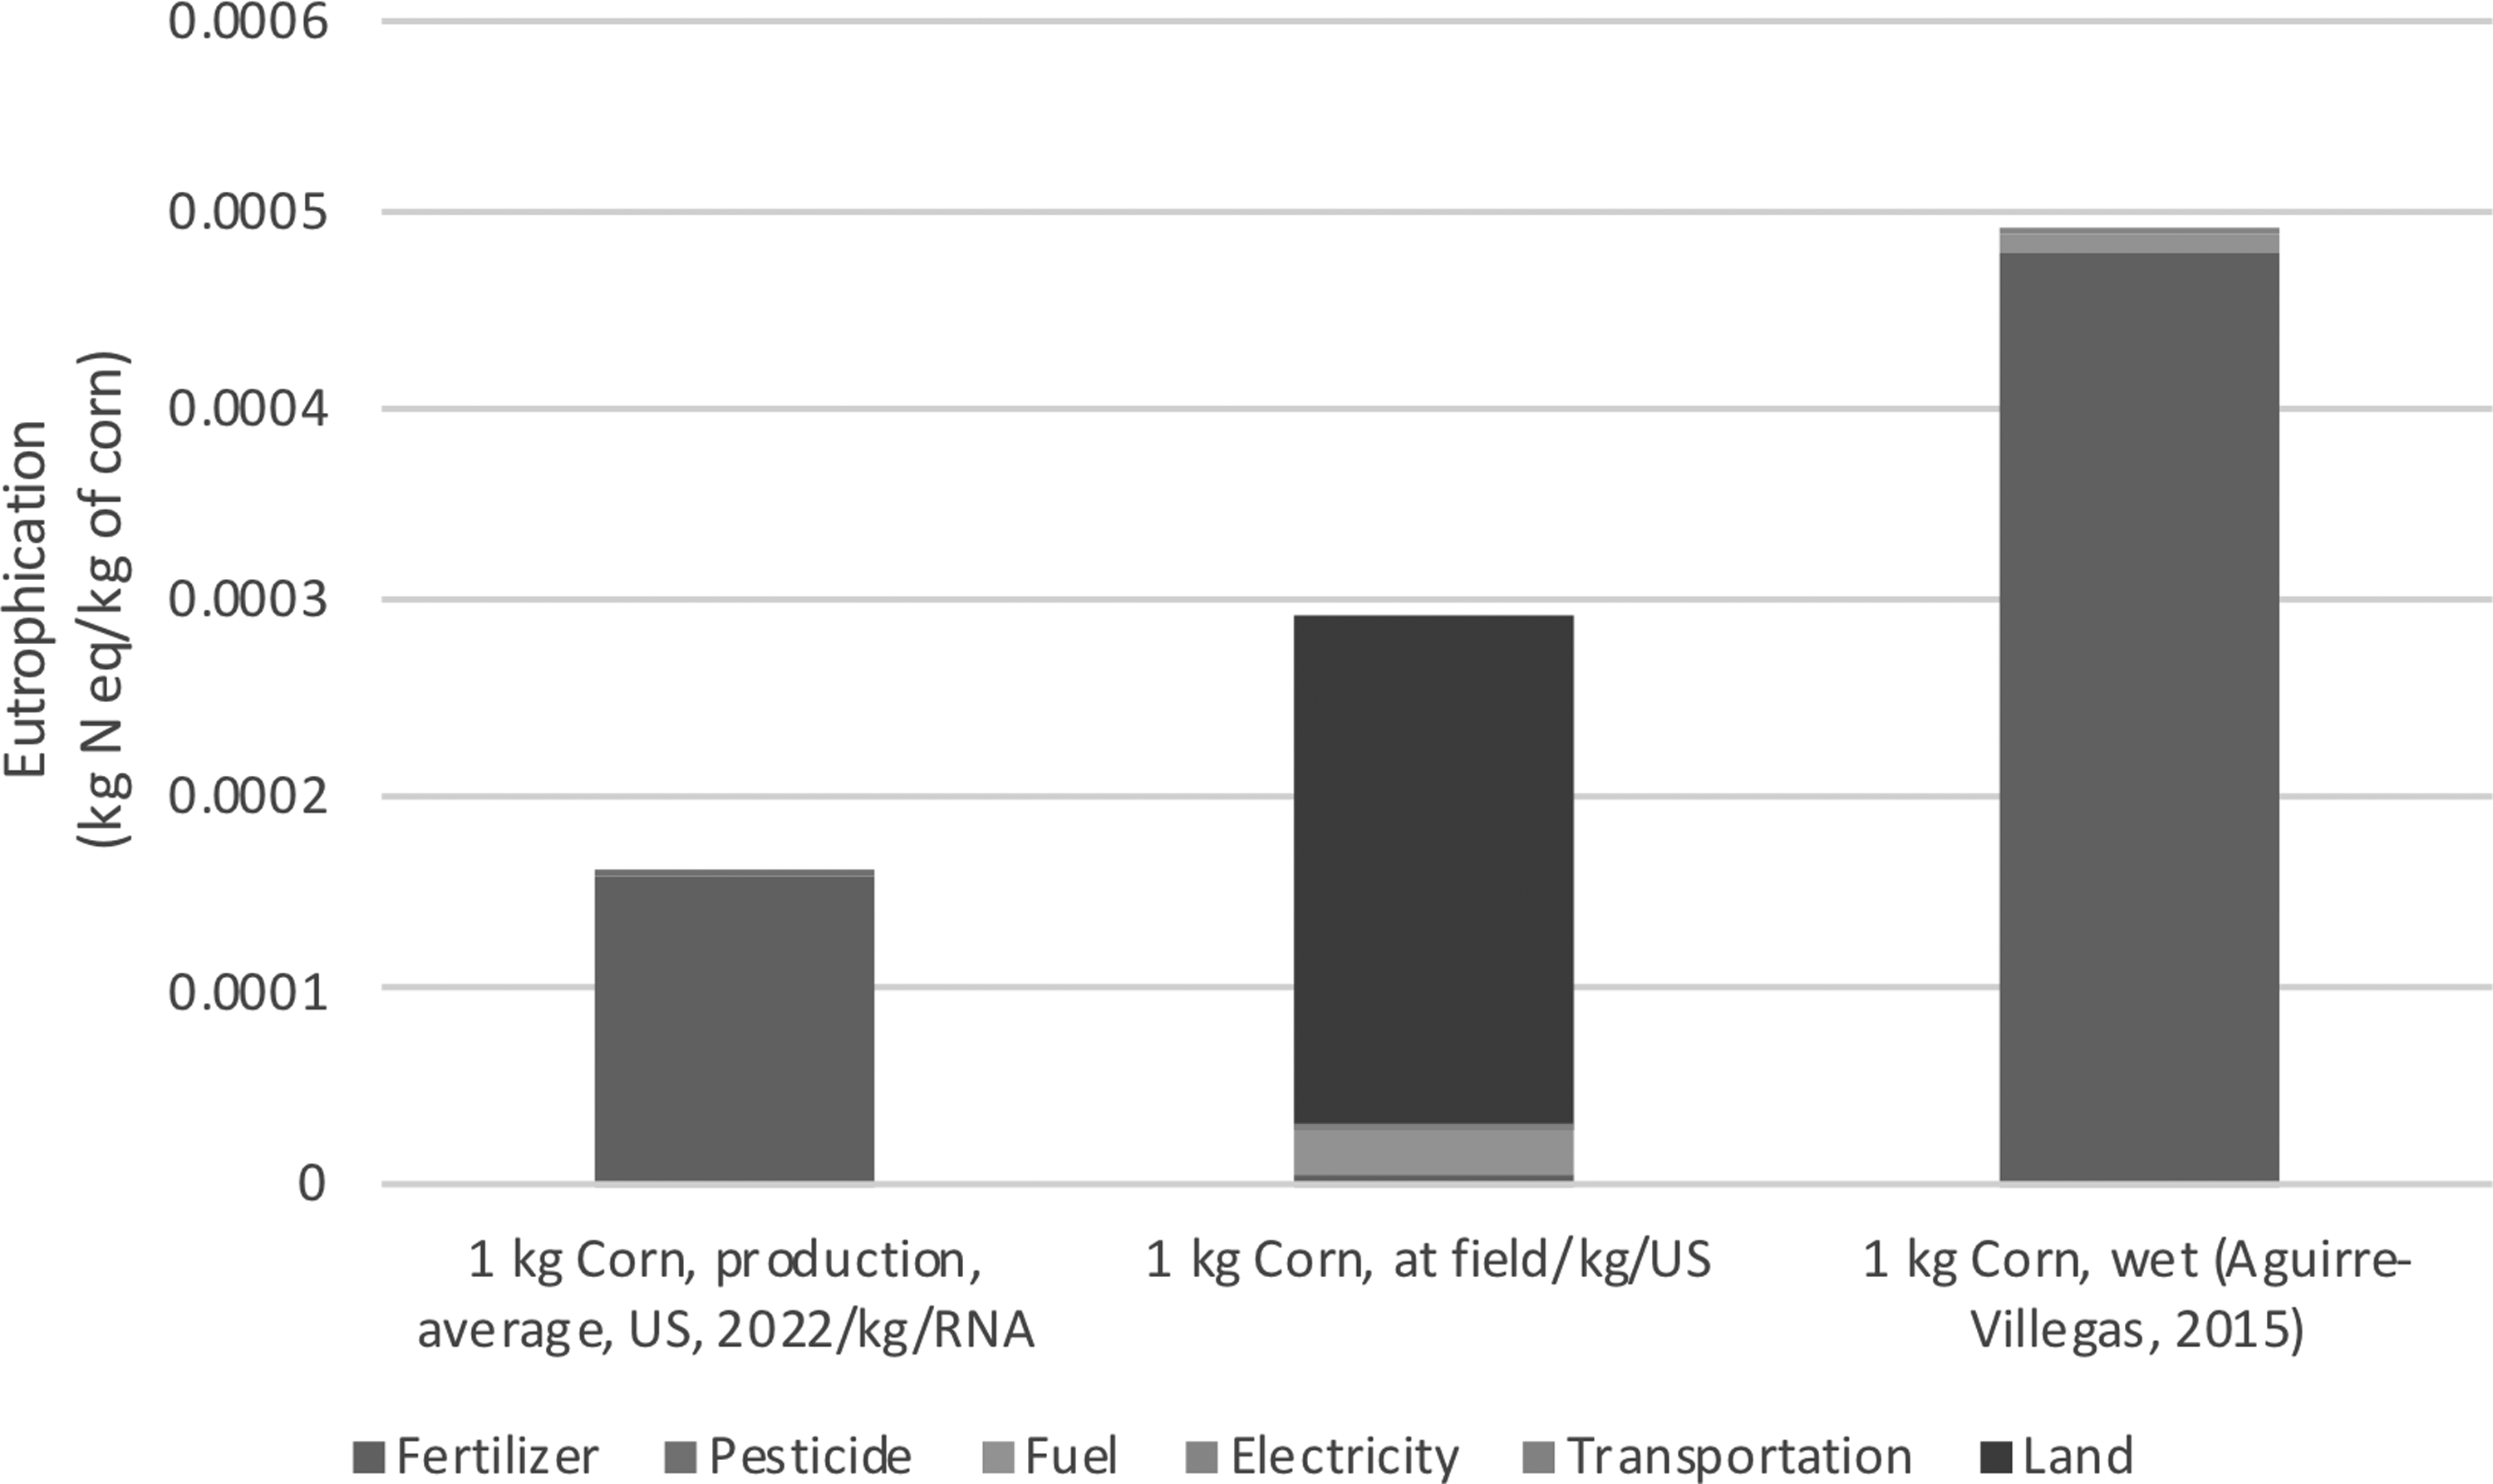
Eutrophication impacts of corn production using various data sources.
Many life cycle assessments have been completed on soybean products. However, these focus primarily on the production of soybean-derived biodiesel, soybean meal, or soybean oil (Kim and Dale, 2005, 2009; Dalgaard et al., 2008; Hu et al., 2008; Huo et al., 2009; Panichelli et al., 2009; Pradhan et al., 2009). Furthermore, there is one comprehensive study on the production of almonds (Kendall et al., 2015). Only two comparative LCAs on dairy milk versus nondairy milk have been performed and results from these studies are also shown in Table 1, showing large ranges in GHG emissions (Birgersson et al., 2009; University of California-Los Angeles [UCLA], 2016). Birgersson et al. (2009) compared the environmental impacts of soy milk and dairy milk. Six environmental impact categories were evaluated, using a FU of 1 L of drink, including land use, energy use, eutrophication, acidification, climate change, and ozone layer depletion. However, the study was European based, with production of soybeans occurring in Brazil, and the study has neglected to include the water footprint. UCLA (2016) compared almond milk with dairy milk using economic input–output LCA (EIO-LCA) in the categories of water use and GHG emissions. While the previous studies suggest that soy milk or almond milk may have significant environmental benefits over dairy milk using a volumetric FU, this current study provides the first of its kind cradle-to-gate LCA that compares the environmental impacts of almond milk and soy milk and dairy milk in a U.S. context. This is a critical research gap to address to provide a comprehensive suite of LCA results relevant for consumer decision making in a U.S. context, enabling guidance on making environmentally responsible choices in food consumption.
Materials and Methods
Goal, scope, and system boundary
Several methodologies exist to perform LCA studies, including the ISO 14040 (ISO, 1997) guidelines for process-based LCA and EIO-LCA. Following the ISO 14040 standards, the first goal is to quantify the environmental impacts, embodied energy, and embodied water of dairy milk as compared with two plant-based alternatives, almond milk and soy milk, from raw material production through transportation to a retail store in Chicago, making this study a partial cradle-to-gate LCA. Chicago was chosen as a major metropolitan area of the United States. The second is to utilize both a volumetric and nutritional FU to compare environmental impacts, discussed further in the Functional Unit section. The scope of the study considers the life cycle stages of agricultural production, transportation to a processing plant, milk processing, transportation to retail store, and refrigeration at a retail store, as illustrated in Fig. 1. More detailed life cycle diagrams of the various life cycle stages can be found in the Supplementary Data (Supplementary Figs. S1–S3).
According to ISO 14040, comparative LCA studies shall perform an analysis of material and energy flows to determine their inclusion in the scope of the study (ISO 14040). Shown by the black arrows in Fig. 3, the system boundaries include the material and energy flows upstream and downstream of each stage. For a consistent comparison across products, agriculture production upstream emissions include the emissions during manufacturing of material and energy inputs (including all nutrients, pesticides, fuels and energy, and water) and transportation fuels. Production of agricultural machinery, capital equipment, and transport vehicles were excluded due to general LCA practice. Machinery manufacturing consumes 45.9 MJ/kg and is unlikely to have a major impact on the results of this analysis (Aguirre-Villegas et al., 2015). Downstream emissions include both fossil and biogenic GHG emissions resulting from production. Biogenic emissions are the result of crop production (for all products), which does not account for soil carbon dioxide (CO2) sequestration, and animal digestion (specific to dairy milk) (Aguirre-Villegas et al., 2015). In the milk processing stage, water, sugar, electricity, and energy/fuel inputs are tracked (however, cleaners and detergents used are assumed to be negligible) and emissions from energy combustion are included.
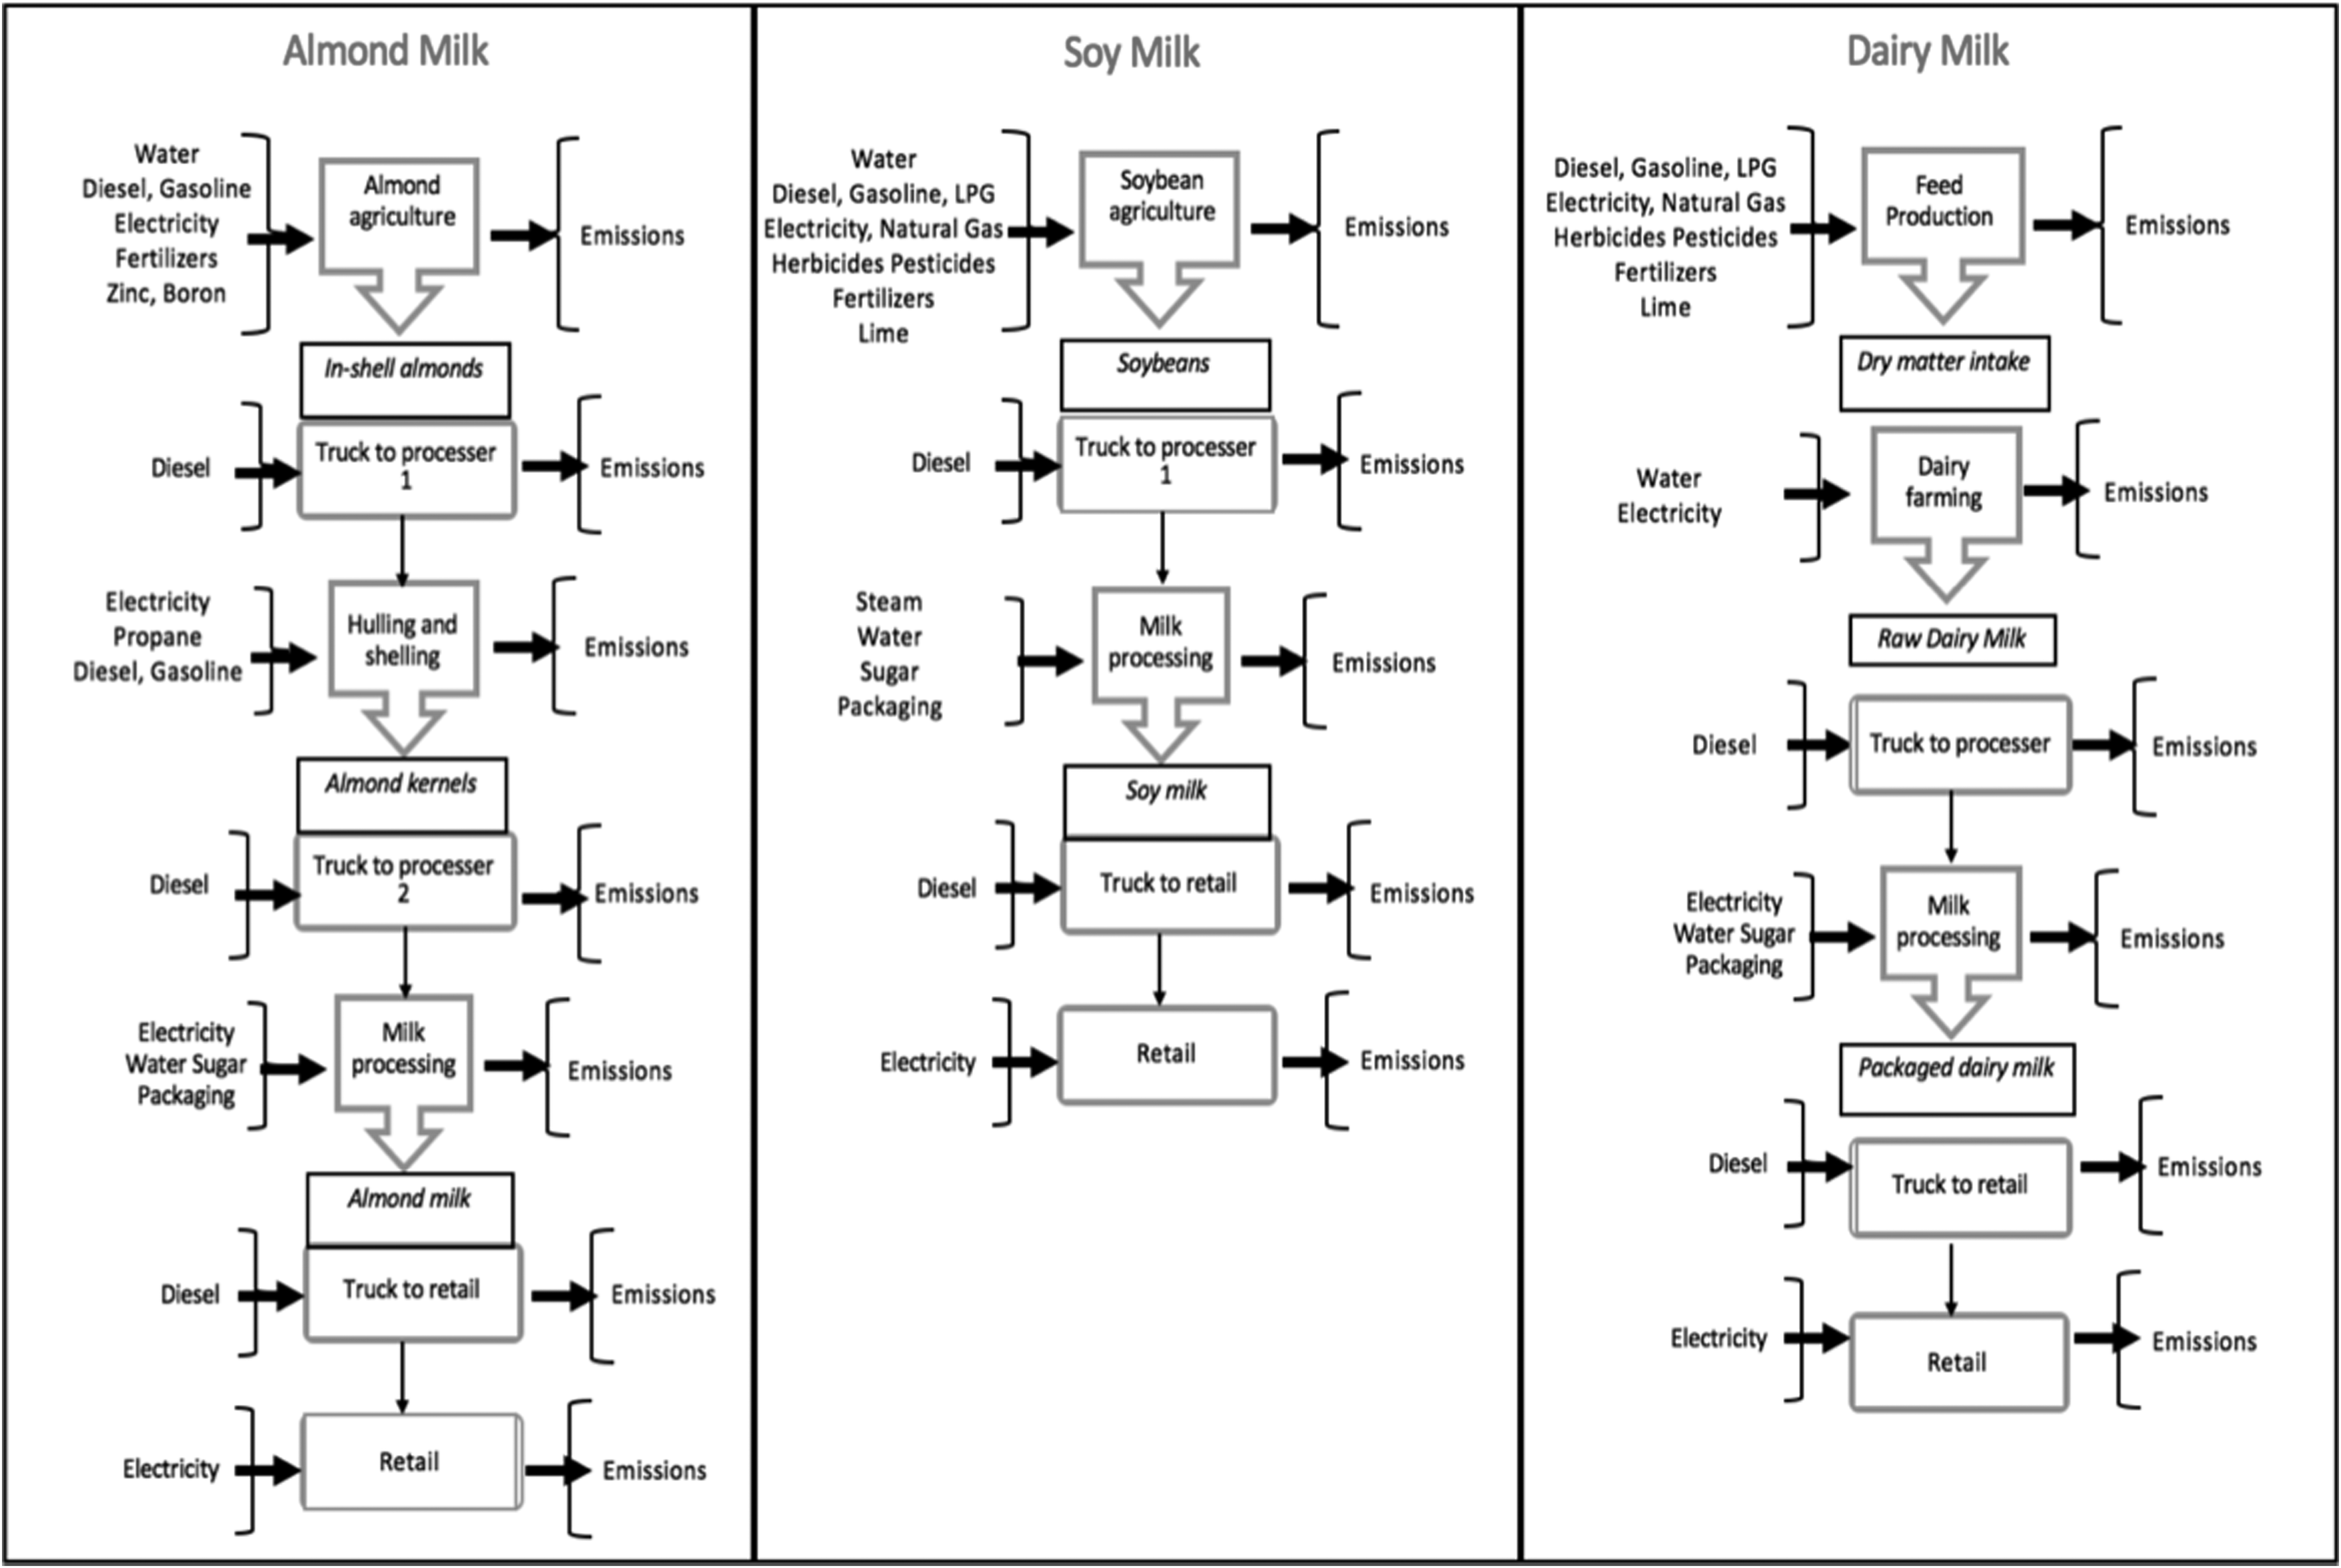
Life cycle diagram of almond, soy, and dairy milk. Green boxes show the life cycle stages with the primary product output from each stage and the orange boxes show transportation between stages. The black arrows show the energy and raw material inputs and emission outputs at each stage.
Consumer use (i.e., use of refrigeration at household and any milk losses) and disposal of milk packaging is considered to be outside of the system boundaries. The scope is limited to assume that the lifetime in the household is similar for each milk type, and that everything is consumed. There have been numerous LCA studies that have focused exclusively on packaging systems for beverages, including milk (Falkenstein et al., 2010; Williams et al., 2011; Meneses et al., 2012). A primary focus of these studies is exploring new packaging designs to extend the shelf life of milk while reducing food waste generated at the household level. The goal of this study was more holistic, and therefore, did not address specifics of packaging and waste disposal. However, packaging was included as a material input in the processing stage.
Functional unit
Various FUs have been used in the literature to compare the environmental impacts of food products and systems. Most have used a mass- or volume-based FU. For example, kilogram was used to compare almonds with other nuts, and was relevant to compare nuts across the productive lifespan of each almond orchard based on yield (Kendall et al., 2015). Several researchers studied the life cycle impacts of dairy milk using volumetric FU (L), quality-corrected FU, which standardizes milk to 4% fat and 3.3% protein (kg of fat and protein-corrected milk [FPCM]), or area FU (hectares) (Haas et al., 2001; Thomassen et al., 2008; Meneses et al., 2012). For a cradle-to-gate scope, a quality-corrected FU is most common to compare milks produced with cows fed different diets to a similar nutritional quality (Thomassen et al., 2008). When meat is included in the dairy life cycle, two mass-based FUs are typically used (FPCM and live weight) (McGeough et al., 2012). However, for a cradle-to-retail or grave scope, a volumetric FU is more appropriate to account for a quantity of milk ready to be consumed (Thoma et al., 2013).
A nutritionally based FU can be used to compare foods based on the nutrition they provide. The Combined Nutritional and Environmental Life Cycle Assessment (CONE-LCA) has been used to compare the effect of nutrients in food products on human health using a FU of disability-adjusted life years. However, it is not yet widely used and has received criticism for being difficult to interpret (Heller et al., 2013). A FU utilizing nutrient density was utilized by Smedman et al. (2010), and is typically used to characterize foods according to their contribution to the overall balance in the diet. Single nutritional indicators are another way to compare specific products. When comparing different types of meats, for example, single nutritional FUs (protein and energy) have been used, and have shown very different results utilizing each FU (McGeough et al., 2012).
A volumetric FU, 1 L of milk, and a single nutritional FU, 1 kg of protein, was used in this study, in accordance with the ISO 14040 standards of a FU being “a measure of the performance of the functional outputs of the product system” (ISO, 1997). Protein has been utilized previously as a metric to compare the environmental impact of plant-based foods to regular foods due to protein being an essential contributor to good nutrition and due to the differences in protein quantity between products (Reinjders and Soret, 2003; de Boer et al., 2006; Gonzalez et al., 2011). It was assumed that 1.03 kg of dairy milk equals 1 L of dairy milk (Wong, 1988). For almond milk, the density was 0.2 kg/L for the nonwater part of the milk (UCLA, 2016). For soy milk, the density was 0.07 kg/L, for the nonwater part of the milk (Ercin et al., 2012). The protein content in each product was estimated as the most common protein content for current products in retail stores, compiled by the USDA National Nutrient Database for Standard Reference. Per 100 g of product, the majority of soy milk, almond milk, and dairy milk products in retail stores contain 2.92, 0.42, and 3.75 g of protein, respectively (USDA, 2018). The range in nutrient profiles for the products was relatively small, including 0.42–0.56 g protein/100 g almond milk, 2.00–3.16 g protein/100 g soy milk, and 3.33–4.17 g protein/100 g 1% and 2% dairy milk.
Data and assumptions
Data and assumptions used to compile the life cycle inventories (LCIs) for each product are described below and are divided by life cycle stage. Detailed inventory tables can be found in the Supplementary Data (Supplementary Tables S1–S19).
Soy milk
Raw material production
Illinois was chosen as the production location for soybeans as it was the top soybean-producing state in the United States in 2016 with around 560 million bushels (Statista, 2014). Data on soybean production inputs and yields in the United States are updated every 4 years in the USDA Economic Research Service (ERS) database with the most recent data being from 2012 (United States Department of Agriculture, 2012). This database is compiled from nationally representative surveys, termed Agricultural Resource Management Surveys (ARMS), distributed to about 5,000 fields each year. The database was chosen for its representativeness of U.S. soybean production, and it compiles the production inputs of nutrients, water, fuels, and energy used on soybean fields with respect to yield in a given year. Energy use data, including diesel, gasoline, liquefied petroleum gas, electricity, and natural gas and lime usage data were not available for 2012, so 2006 survey data were compiled for these inputs instead, using an average of all U.S. states.
In 2012, the average yield per acre of soybeans, in the United States, was 1,077 kg. Soybean pesticide use, most of which are herbicides, was ∼4.2 kg/acre in 2012. Unlike other crops, soybeans can fix their own nitrogen and require less nitrogen fertilizer than other crops (e.g., corn, cotton, almonds). In addition to nitrogen, phosphorus, potassium, and lime are also applied as crop nutrients. Emissions (N2O, NOx, NH3) from fertilizer application and CO2 emissions from lime application were calculated based on emission factors from Aguirre-Villegas et al. (2015). The majority of domestic movement of soybeans is by truck (85%), followed by rail (13%), and barge (3%) (Denicoff et al., 2014). Soybeans are assumed to be transported ∼602 km to American Soy Products in Michigan by a diesel-powered truck. This processing plant was identified as the closest soybean processing plant to Illinois.
Processing
Soybeans go through a steaming process to remove the hulls, are boiled under high-pressure and high-temperature conditions, and ground with water to produce soy milk. The remaining processes include sterilization, homogenization, and cooling of the soy milk before packaging (SunOpta, 2015). Although coproducts were not included in this study, consistent with other soy milk LCA studies, 1 L of soy milk yields ∼0.10 L of okara, a coproduct used as a source of protein in animal feed (CooksInfo.com, 2018). Similar to almond milk, flavorings and vitamins can be added to the soy milk, but were omitted due to their assumed small impact. This LCA is being conducted on sweetened nondairy milks, which includes sugar as an input. Sweetened milks were chosen because there are more popular than original or unsweetened varieties (Nutritionix, 2018). Inventory data for materials and water to produce 1 L of soy milk were compiled from a soy milk LCA study, which looked at the water footprint of soy milk and soy burgers produced by a single processor in Belgium (Ercin et al., 2012). Since no data were available from the Belgium producer regarding steam use, the value of 0.3 kg/L was used. These data came from a separate dataset in SimaPro, for ProSoya Inc.'s soy milk process, which follows a similar process. Soy milk is transported ∼396 km by truck to retail for 0.9 kg of milk.
Almond milk
Raw material production
As most of the world's almond supply is grown in California, LCI data comes from a comprehensive life cycle assessment study on California almond production (Kendall et al., 2015). This most recent dataset was also used by UCLA (2016) in comparing almond milk and soy milk. The authors analyzed the GHG emissions, energy use, and air pollutant emissions from a typical almond orchard. Environmental impacts were assessed with and without almond coproducts of hulls, shells, and orchard waste. Almond kernels are responsible for 94% of environmental flows, hulls used for dairy feed is ∼5%, and biomass and shells used for electricity is ∼1%. Production of an almond orchard occurred over a 25-year lifespan and included nitrogen, potassium, boron, and zinc inputs, and energy and water use for electric-powered irrigation pumps over this lifespan on a per-kg of almond basis, a weighted average over the orchard lifespan. Quantities of water, fertilizer, and energy inputs generally increased over time until the almond orchard reached maturity. Microsprinkler irrigation was used as the basis for water use, as it is the most common irrigation technology used in California. Additional California-specific data sources, including the University of California, Davis (UCD), cost and return studies, were used to compile inventory data not readily available from Kendall et al. (2015). Cost and return studies for almond orchards document crop production costs by inventorying typical inputs on a regional basis up to the farm gate (Kendall et al., 2015). Inputs for diesel and gasoline used for operating on-farm machinery, pesticides, and phosphorus fertilizer use were obtained from these studies (CA Department of Pesticide Regulation, 2012; Ducan et al., 2016). To model emissions from fertilizer application, emission rates from Kendall et al. (2015) were used.
After production, in-shell almonds are transported to a hulling and shelling facility in California an average distance of 26.7 km in a diesel-powered truck. At this facility, both electricity and various fuels (diesel, gasoline, and propane) are used to dehull and deshell the almonds, leaving just the almond kernels. Electricity and fuel use at the hulling and shelling facility was assumed to be the same as was presented in Kendall et al. (2015). Almond kernels are further transported ∼95 km by diesel-powered truck to the closest yet largest almond processing plant, located in Sacramento, CA (Blue Diamond, 2018).
Processing
After the almonds are dehulled and deshelled, they are ground in a roll mill to almond paste. The paste requires 9 kg of almonds and 2,000 g of sugar and the roll mill consumes 39,683 J/kg of almonds. Producing almond milk from almond paste requires mixing a few ingredients, typically water and sugar for sweetened varieties of almond milk. An equal quantity of water to desired volume of almond product is assumed. Other additives, such as surfactants, thickeners, vitamins, or flavorings, can be added to make the final product; however, these were not included as they are assumed to comprise a very small impact and data were unavailable. Homogenization and pasteurization are the final steps in producing a pasteurized almond milk product. The quantities of sugar, water, and energy to produce almond paste and almond milk were obtained from a patent for almond processing equipment specifications, due to an absence of an LCI dataset (Sunrise Machinery, 2018; Matsunobu et al., 1987). The true impacts of processing far exceed simple estimates of machine-level energy use; however, complete data were unavailable for this stage. Almond milk is transported ∼3,387 km by truck to retail for 0.9 kg of milk.
Dairy milk
Raw material production
Wisconsin (WI) is one of the top milk-producing states in the United States with the dairy sector being a 43 billion industry for the state (Wisconsin Milk Marketing Board, 2017). In 2016, it had more than 9,500 dairy farms, with 1.28 million cows producing an average of 10,683 kg of milk per cow per year. Therefore, a previously completed LCA study at the University of Wisconsin, representative of a dairy farm in WI, was used for inventory data (Aguirre-Villegas et al., 2015). The processes of crop production, energy, and electricity for milking, and manure management are included. Direct and indirect GHG emissions from enteric fermentation, crop production, and manure management are accounted for.
The modeled dairy farm produces 10,000 kg of whole milk per day at 3% protein, 3.5% fat, and 4.85% lactose concentrations, which is typical of WI. The energy requirements for milking were assumed to be 0.062 MJ/kg milk (Aguirre-Villegas et al., 2015). The farm has 286 lactating cows, 173 growing heifers, 41 mature heifers and dry cows, and 9 calves up to 1 month old. It was assumed that the cows were fed a dairy diet typical of WI, which includes a dry matter intake (DMI) of alfalfa silage, cotton seed, corn silage, corn grain, dry distiller's grains with solubles, and soybean meal (SBM). SBM is a coproduct from the extraction of soy oil. It was assumed that soybeans are transported in 20-ton diesel trucks an average distance of 125 km to a soy oil processing plant based on the national SBM transportation distance average in the United States (Aguirre-Villegas et al., 2015). The quantities of nutritional intake vary for lactating cows (22.4 kg DMI/cow per day), young heifers 1–10 months old (5.05 kg DMI/cow per day), heifers 11–21 months old (11.91 kg DMI/cow per day), and dry cows (7.25 kg DMI/cow per day). The nutrient, pesticide, energy/fuel, and electricity inputs per ton of DMI comes from Aguirre-Villegas et al. (2015), which has compiled average data, from the years 2000 to 2012, specific to WI (or the United States if WI data were unavailable). Input requirements per ton of DMI were converted to a wet basis to include water using information on the moisture content of each crop (Supplementary Table S20).
Land application is the most common manure management practice in WI, and is typically prioritized over applying purchased fertilizers. Manure excretion and N, P, and K nutrients were calculated for each cow type according to Aguirre-Villegas et al. (2014). Manure is collected daily using an alley scraper, consuming 1,785 J/kg of collected manure. After collection, manure is transported to an uncovered pond, consuming 873 J/kg of transported manure. Agitation is done before emptying the manure storage with an electrical pump at 873 J/kg of manure. Manure is then land applied at rates of 4.74E-04 L diesel/kg of applied manure. Direct emissions were quantified for fertilizer/manure application (N2O, NH3, NOX), enteric fermentation (CH4), and manure management (NH3, CH4, N2O, CO2, CH4) according to emission factors from Aguirre-Villegas et al. (2015). Indirect N2O emissions from leaching and ammonia volatilization are quantified according to factors from the same study.
Raw milk, the primary output of this stage, is transported ∼294 km to the nearest processing plant in IL owned by Prairie Farms, a primary distributor of milk products in the Midwest (PrairieFarms.com, 2018). The coproduct of meat is produced during production of raw milk. However, milk is the primary product in WI by volume and economic importance, which makes dairy the main driver of the environmental impacts. Although coproduct allocation was omitted in this study, nutritional coproduct allocation was used in a previous LCA in a WI context, and have found that this method allocates 98.99% of the system inputs and outputs to milk and 1.01% to meat (Aguirre-Villegas et al., 2015).
Processing
During the dairy milk processing phase, the raw milk is separated into the skim milk and cream portions, standardized to blend these portions into the desired product, homogenized to prevent the cream portion from surfacing and pasteurized (ProCon.org, 2018). The most common method to pasteurize milk is to heat the milk to 161°F for at least 15 s (Institute of Food Technologists, 2018). The milk is then immediately cooled to below 40° before being packaged. An inventory for pasteurized and standardized milk at a processing facility in the United States was used from the USDA LCA Digital Commons. The inventory was formed using data from 2005 to 2009 compiled from USDA statistics, literature, and surveys to dairy plants, and includes electricity, fuel, and water usage inputs. Dairy milk is transported ∼269 km by truck to retail for 0.9 kg of milk.
Packaging
All milks are assumed to be packaged in a liquid packaging board container, the most common type of packaging for milk containers (Packaging World, 2018). Liquid packaging board container is a combination of paperboard and low-density polyethylene (LPDE), as the waterproof layer surrounding the paperboard. The total amount of materials needed to produce the packaging, including paperboard, cap, and LPDE, was assumed to be 0.0385 kg/L of milk (Ercin et al., 2012).
Retail
Milk, particularly nondairy milks, comes in both refrigerated and shelf-stable varieties. Although shelf-stable nondairy milks have a longer shelf life and would reduce impacts from refrigeration needed during the retail phase, it also requires an additional ultrahigh temperature (UHT) treatment for ultrapasteurization during the processing phase (Robb, 2014). Although UHT milk is common in Europe and South America, most milk sold in the United States goes through standard pasteurization processes. Given the U.S. context of this study, it is assumed that the dairy and nondairy milk are refrigerated varieties. Dairy milk is assumed to be in a retail store for 2.6 days, and almond milk and soy milk are assumed to be in the store for 5.9 and 7.8, respectively (Adams, 2017). Refrigerators are assumed to be closed-door display cases consuming 20.2 MJ/(m·day) (Fricke and Becker, 2010). Data on wastage rates for all products were omitted due to unavailable data, but incorporating wastage rates may create differences in retail-phase environmental impacts for each product.
Life cycle assessment modeling
Each LCI developed for this study was matched with an appropriate unit process from the USLCI database, the ecoinvent database or the agri-footprint database, with details provided in the Supplementary Data. The water footprint and embodied energy for the milk products are assessed using BEES+ and Cumulative Energy Demand (CED), respectively, using SimaPro (version 8.0.1) as the life cycle modeling platform. The environmental impacts are evaluated using SimaPro and the U.S. EPA's Tool for Reduction and Assessment of Chemical and Other Environmental Impacts (TRACI) 2.1 impact assessment method. TRACI considers the following midpoint impact categories and units: ozone depletion (OD) = kg CFC−11 equivalent (eq), global warming potential (GWP) = kg CO2 eq, smog formation (SM) = kg O3 eq, acidification (AD) = kg SO2 eq, eutrophication (EP) = kg N eq, carcinogenics (C) = CTUh, noncarcinogenics (NC) = CTUh, respiratory effects (Resp) = kg PM2.5 eq, ecotoxicity (Eco) = CTUe, and fossil fuel depletion (FFD) = MJ surplus. TRACI was chosen because it is developed for the U.S. context and all 10 impact categories were considered to compare impacts for a variety of environmental issues as well as understand the trade-offs.
Uncertainty and sensitivity analysis
Monte Carlo simulation was used for uncertainty analysis associated with all inputs used in the LCA model for the volumetric FU. However, Monte Carlo analysis with a protein FU in SimaPro was not explored. Triangle probability distributions, using nonskewed uncertainty ranges, were used for all inputs, due to the limited data available to make an informed choice on the distribution, and simulations were performed over 10,000 iterations using SimaPro. Summary statistics were extracted and are discussed in the Results and Discussion section, and can be found in the Supplementary Data (Supplementary Tables S21–S23). The 97.5% maximum and 2.5% minimum values are displayed on the graphs for positive and negative error values, respectively, in the Results and Discussion section. A sensitivity analysis was performed on the suite of milk products modeled to quantify the potential influence of the inputs and assumptions utilized on the impacts quantified. Scenarios are posited, such as changes in transportation to retail, days in retail store, and processing water use. In each instance, the initial value utilized in the analysis has been increased by 10%. The sensitivity analysis is presented for almond milk, and the other milks are presented in the Supplementary Data.
Results and Discussion
Results of this study have been organized to address the goals of the study as posed in the Introduction section, namely comparison of the environmental impacts of the products using a volumetric FU (Environmental Impacts Using a Volumetric FU section) and comparison of environmental impacts using a nutritional FU (protein as a FU section).
Environmental impacts using a volumetric FU
Environmental impacts from cradle-to-retail for GWP, eutrophication ecotoxicity, FFD, water intake, and CED are shown in Fig. 4a–f. These categories are illustrative of the main results using the TRACI impact categories, and results for other categories can be found in the Supplementary Data (Supplementary Figs. S4–S14). Overall, dairy milk has the highest impacts in OD, eutrophication, smog, ecotoxicity, FFD, and carcinogenics, whereas almond milk has the highest impacts in noncarcinogenics largely from the use of zinc fertilizer. Almond milk is about two times higher than dairy milk and soy milk in noncarcinogenics. Soy milk has the highest impact in the remaining categories: GWP, respiratory effects, and acidification, as soy milk has the longest number of days in a retail store out of all products.
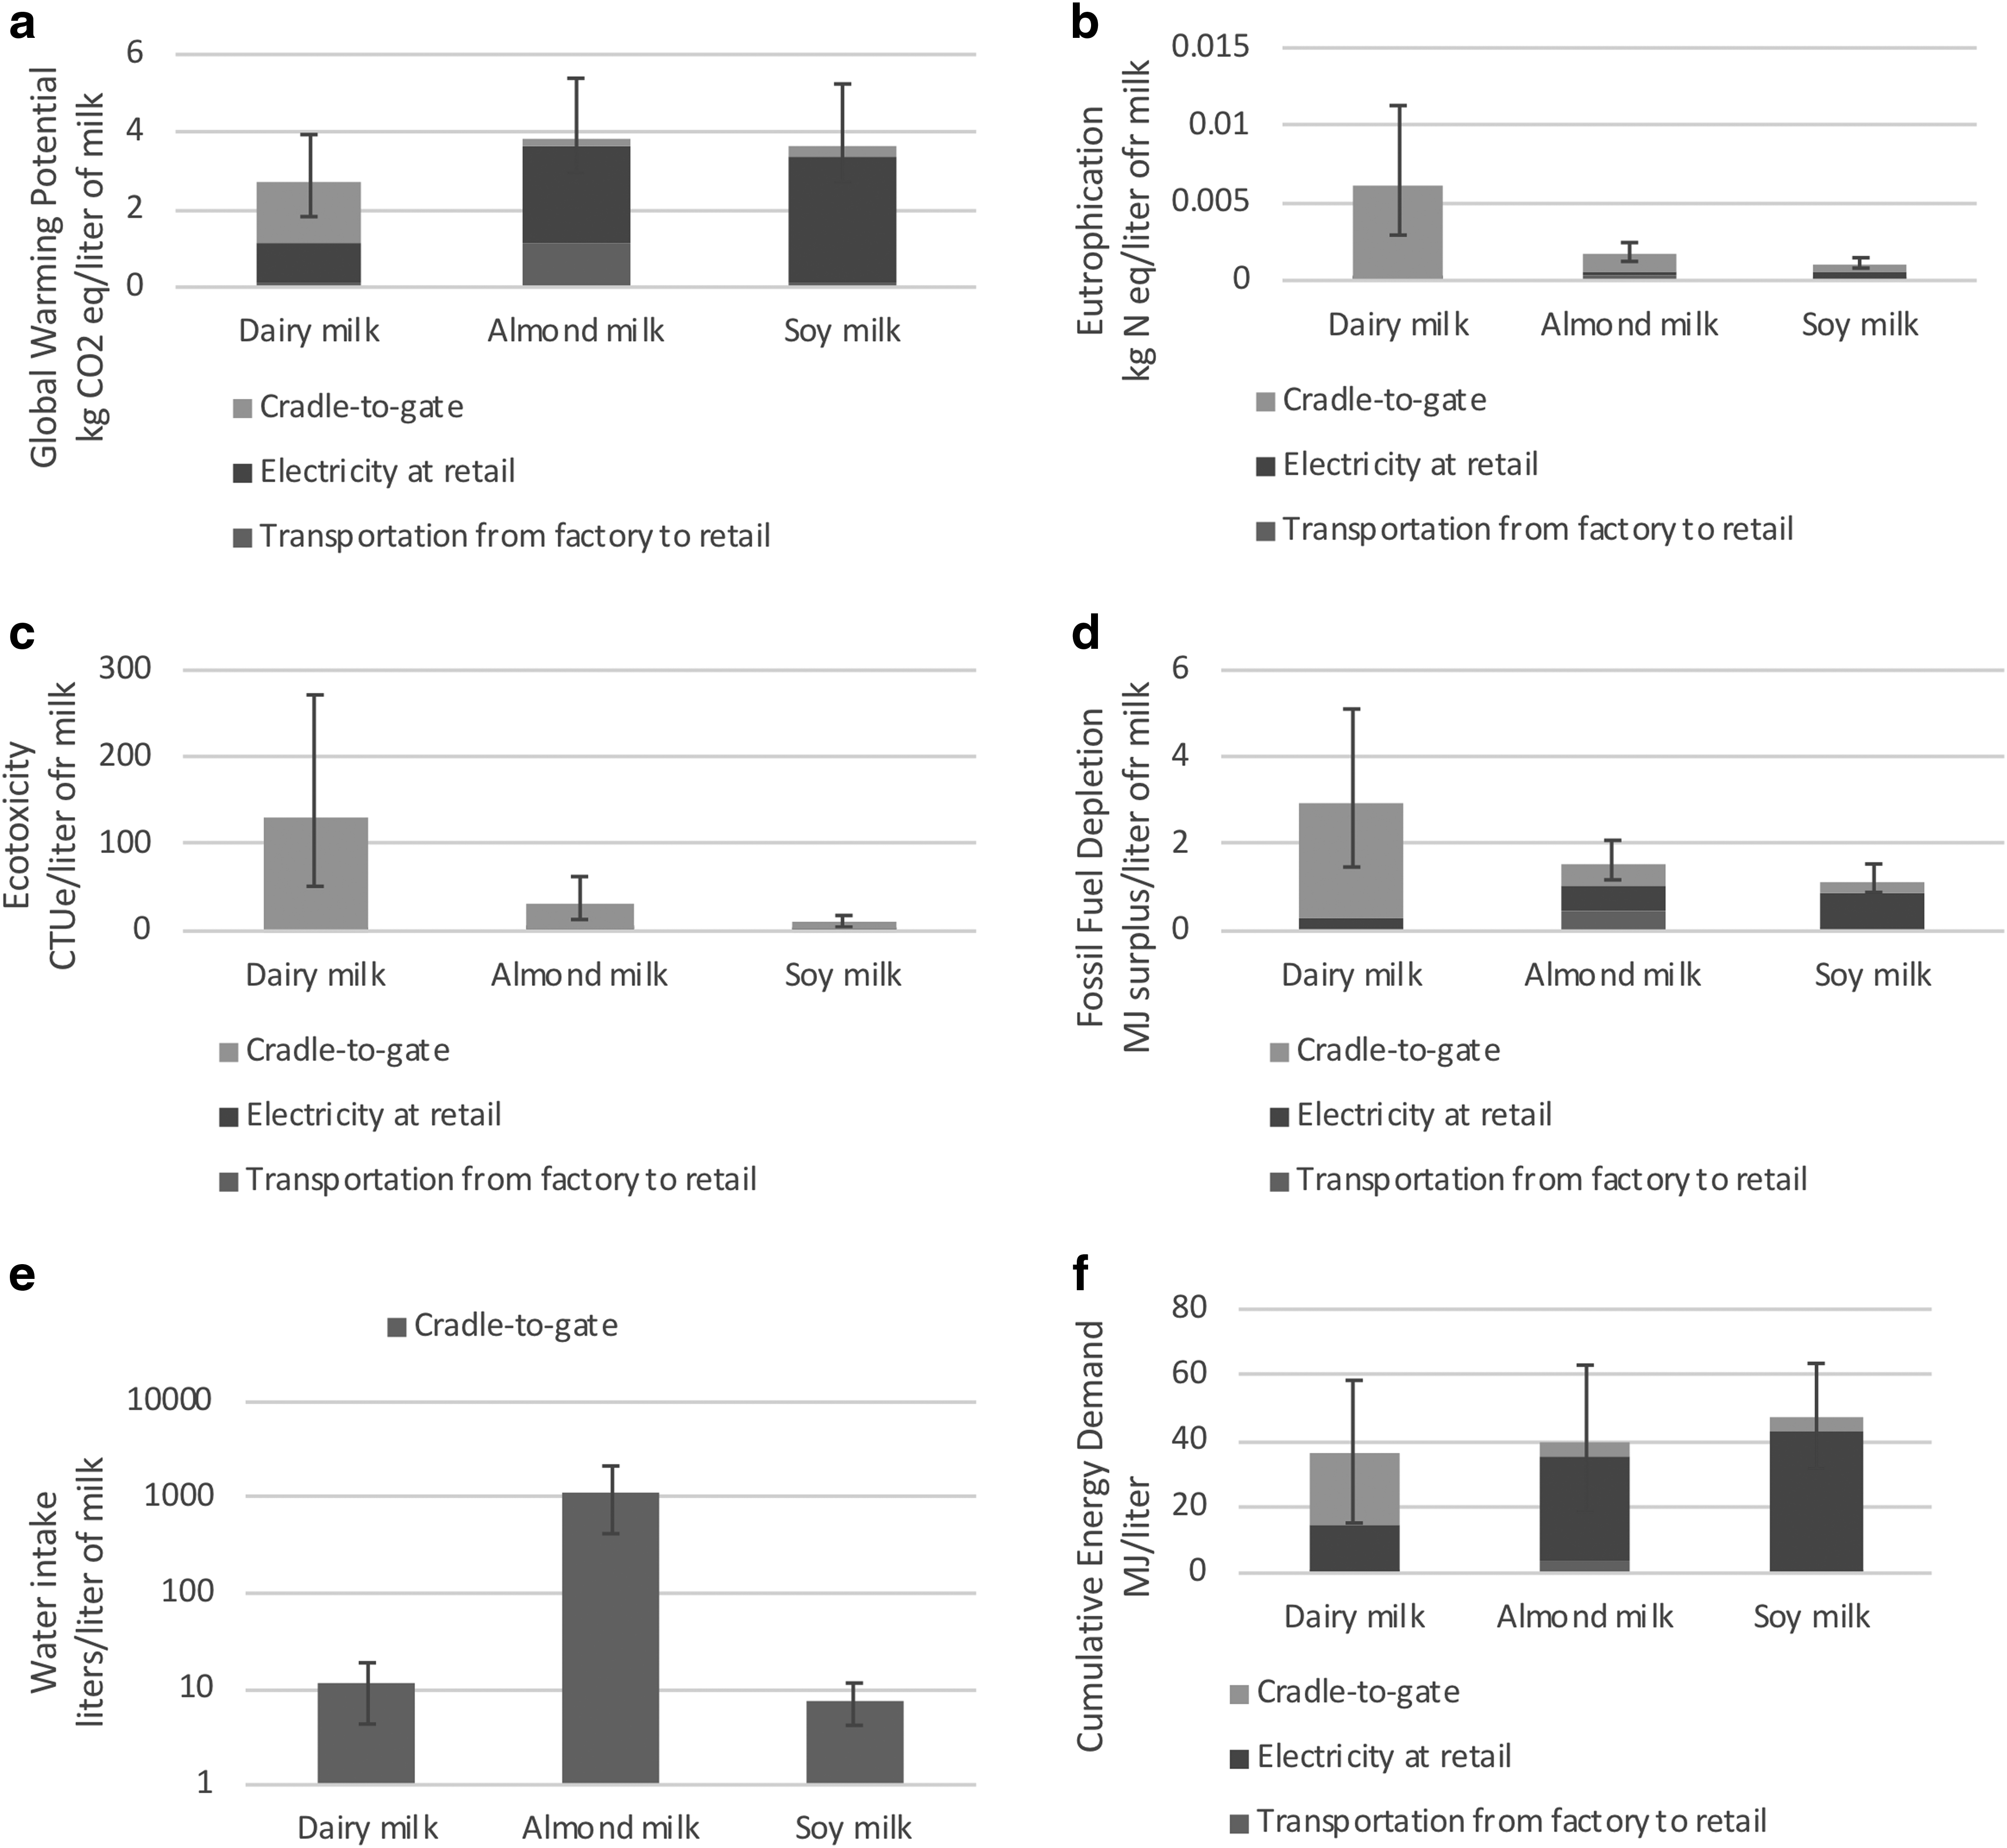
TRACI impact assessment results using a functional unit of 1 L. The error bars represent the 97.5% and 2.5% results from uncertainty analysis,
For dairy milk, raw material production is the dominant phase for all impact categories. The dominant life cycle phase varied as a function of the impact category considered for almond and soy milk. The retail phase being dominant in some impact categories, including GWP, smog, FFD, respiratory effects, and acidification, was due to electricity use at retail. The electricity from the 2014 eGRID Midwest electricity mix was used, which is 74% coal and 20% nuclear. For other impact categories, the processing phase is dominant over raw material production because of steam used during processing. However, this value was taken from a producer in Belgium, due to unavailable U.S. data, which could lower the accuracy of the results. Sugar for the nondairy milks was a minimal contributor to overall life cycle impacts.
Agricultural production, particularly feed production for dairy milk, contributes to eutrophication impacts for dairy milk. A contribution analysis for feed production can be found in the Supplementary Data (Supplementary Fig. S15). Ecotoxicity impacts for all products are driven by pesticide use during raw material production. For almond milk, energy use during irrigation and nitrogen fertilizer production are the dominant contributing processes to GWP and FFD from cradle-to-gate, which is also a finding of Kendall et al. (2015) (see contribution analysis in Fig. S16 for soymilk and Fig. S17 for almond milk). However, transportation from factory to a retail store creates additional impacts, compared with the other two products, because of the longer transportation distance to retail. The transportation assumptions, however, are a source of variability within the analysis. Weber and Matthews (2008) similarly found transportation to not be the dominant life cycle for dairy milk. However, almonds, in particular, have a large transportation footprint from California to a consumer in Chicago.
Total GWP impact results are 2.75 kg CO2 eq/L of dairy milk, 3.85 kg CO2 eq/L of almond milk, and 3.27 kg CO2 eq/L of soy milk. These results, for dairy, soy, and almond milk, are higher than those found in other LCA studies (Thoma et al., 2013; Meneses et al., 2012; UCLA, 2016; Birgersson et al., 2009; Hospido et al., 2003; Eide, 2002). Even though all of these results come from cradle-to-farm gate LCA studies, there are differences in methodology and assumptions that need to be considered, such as allocation, FU, and system boundaries. Overall, Birgersson et al. (2009) found comparable results with respect to soy milk having less environmental impacts than dairy milk in many of the same impact categories. However, soy milk had larger impacts than dairy milk in ozone layer depletion because the authors considered different packaging materials for soy and regular milk in Sweden. In a report by the UCLA (2016), the authors found that almond milk had less GHG emissions than dairy milk but the system boundaries were different, specifically as transportation impacts to the processing plant and retail store were left out.
The error bars on the graphs represent the 97.5% and 2.5% results from the uncertainty analysis. As shown in the figures, there is a large range in the possible environmental impact values, particularly for dairy milk and almond milk. In GWP, the range of impacts, 1.82–3.93 kg CO2 eq/L of dairy milk, overlap with almond milk, at 2.95–5.38 kg CO2 eq/L of almond milk. Thus, the superiority of dairy milk over almond milk or soy milk in terms of a GWP may look different using other LCI inputs. Similar overlaps are seen for FFD and ecotoxicity for almond milk and dairy milk, showing that one is not significantly better than another.
In this study, there was a shortage of U.S. datasets, particularly for pesticides, fertilizers, and diesel, for the crop production inventory. Therefore, Ecoinvent and Agri-footprint databases were used with global or European data. These data substitution could obviously lower the accuracy of the results. Geographical representativeness of the crop production process should be a significant data element affecting overall impacts. For instance, other studies have found that manufacturing the inputs for crops account for 12% of total GHG emissions of dairy milk production (Aguirre-Villegas et al., 2015). For almonds, pesticides, and fertilizers contribute to 51% of GHG emissions, and irrigation contributes to 24% of GHG emissions (Kendall et al., 2015). As such, crop production methods and inputs are a source of variability.
With respect to water use impacts, almond milk was shown to have the highest water use at 1,093 L per liter of milk, shown in Fig. 4e. Cradle-to-gate impacts are only shown as the other life cycle stages had very small water use impacts. The main driver of water use for almond milk is from irrigation. Dairy milk has 11.7 L per liter of milk and soy milk has 7.54 L per liter of milk. The dominant life cycle stage for water use for all products is the crop production phase.
UCLA reported a water use of 6,098 L per liter for almond milk, which is slightly higher. However, EIO-LCA was used to calculate water use, rather than a process-based LCA, leading to the differences in results. Another study that compared water footprints of food products produced in various locations, including California, found that food produced in California had a water footprint several orders of magnitude higher than other locations (Huang et al., 2014). Opportunities to reduce water use for food products, like almonds, may include shifting the sourcing of products to different locations or to farms with higher irrigation water use efficiency.
Protein as a FU
Figure 5a–f shows the same impact categories as in the Environmental Impacts Using a Volumetric FU section, but results are for the FU of kg of protein. Remaining impact categories are in the Supplementary Data (Supplementary Figs. S18–S28). Using this alternative FU, almond milk has the highest impacts in all impact categories. This is not surprising given the low quantity of protein in almond milk. Almond milk impacts are at least five times higher than soy milk in all impact categories, and at least two times higher than dairy milk. Dairy milk had the lowest impacts in OD, global warming, smog, acidification, noncarcinogenics, respiratory effects, and water intake, whereas soy milk had the lowest impacts in all other categories (eutrophication, carcinogenics, ecotoxicity, FFD, and CED). As shown in Fig. 4a, results for dairy milk and soy milk are very similar in many impact categories, like GWP. For example, results are 0.12 kg CO2 eq/kg of soy protein and 0.07 kg CO2 eq/kg of dairy protein. Almond milk has at least seven times these results at 0.92 kg CO2 eq/kg of almond protein.
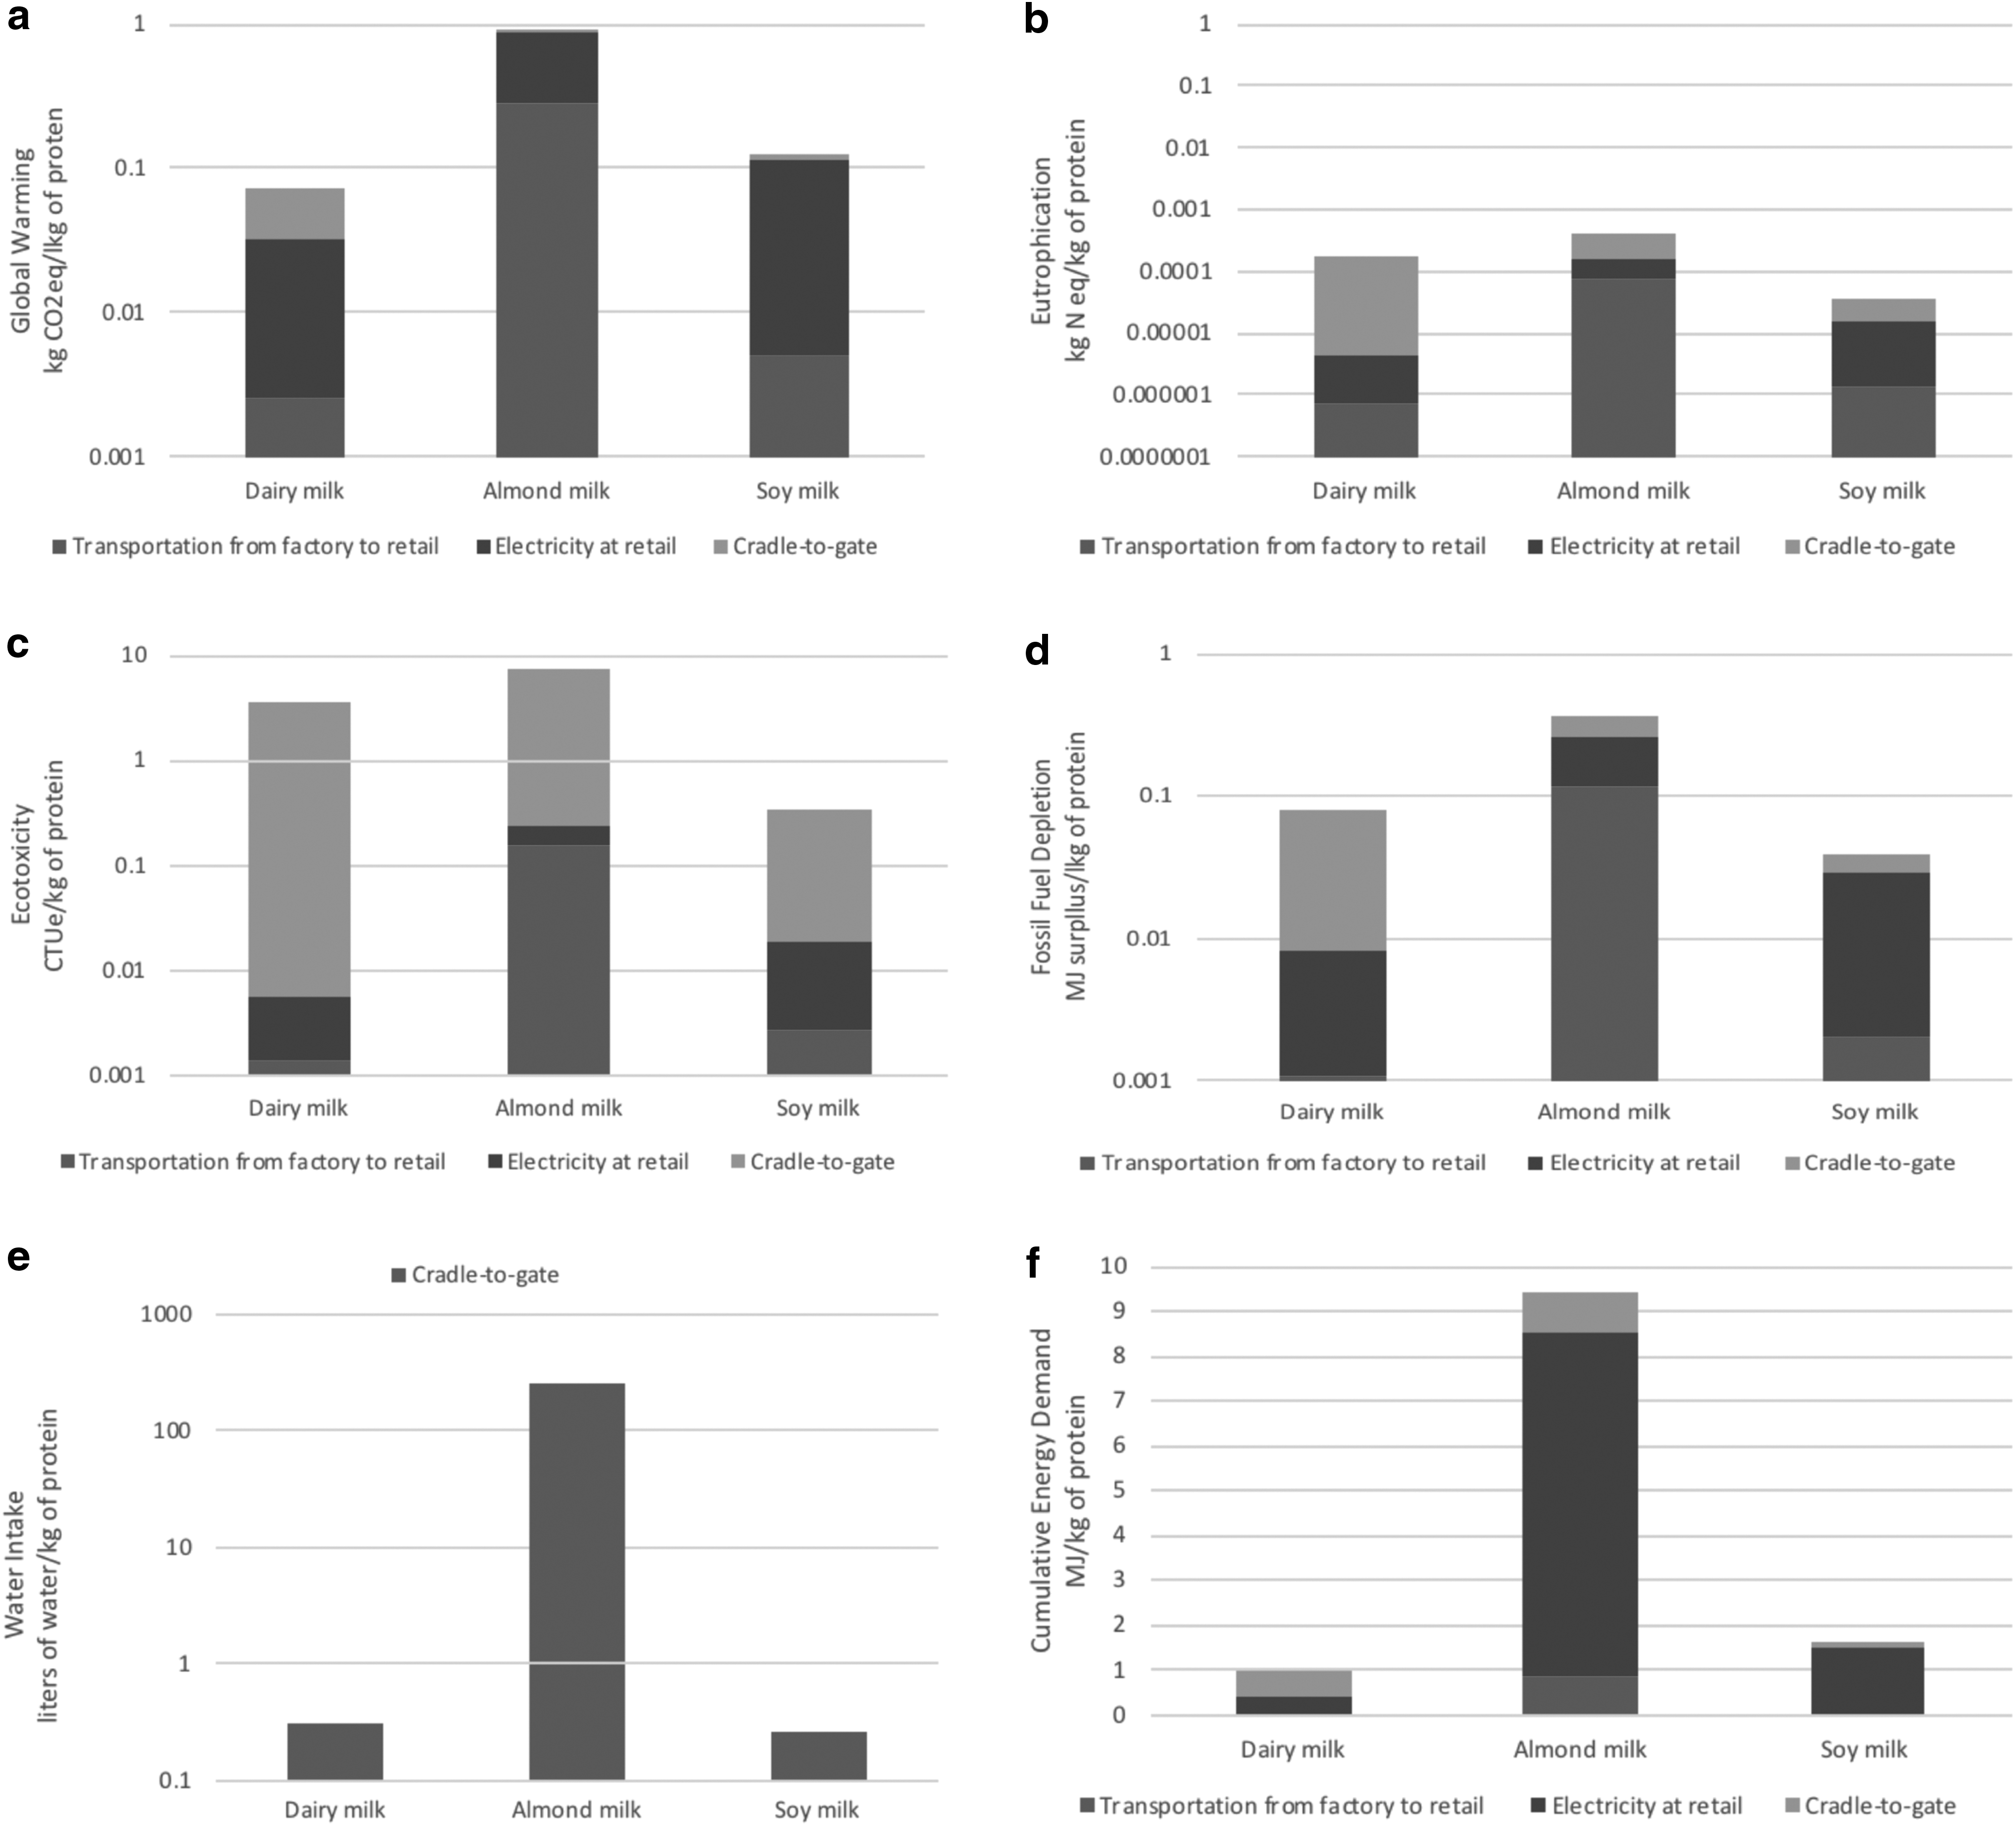
Environmental impact results using a functional unit of 1 kg of protein,
In nutrition, almond milk provides disadvantages due to its low protein content compared with dairy milk. Protein is only one nutritional benefit, and there are other positive and negative nutritional benefits of these products to consider, such as vitamin D, calcium, saturated fat, or cholesterol. For example, the calorie content for almond milk is 38 kcal/100 g and soy milk is 54 kcal/100 g. Depending on dairy milk type, the calorie content varies from 37 to 51 kcal/100 g (USDA, 2018). A weighted nutrient density score may provide a more balanced view of nutrition for future work. Protein quality could also be considered in future work, using an indicator, such as protein digestibility-corrected amino acid score (PDCAAS), used by the World Health Organization (WHO) (Schaafsma, 2000). For example, the protein digestibility score for dairy proteins is 1.00/1.00 and the almond protein score can be as low as 0.12, illustrating that additional disadvantages might be seen when normalizing a FU to protein quality due to both the low protein content and low protein quality of almond milk compared with dairy milk (Ahrens et al., 2005). However, this is a new area that has not yet been considered in LCA studies, but could be an avenue for future work.
Sensitivity analysis
Sensitivity of the impacts to a 10% increase in the inventory data is presented in Fig. 6 for almond milk, a percentage change of each impact category. The inventory item with the most influence is the number of days at retail and the transportation distance from factory to retail. This suggests that a shorter transportation distance or time at retail would noticeably decrease the environmental impact of almond milk. The smallest percentage of change was seen for processing water use, suggesting that the environmental impacts are least sensitive to these inputs. Similar results were found for the other two products and these results are presented in the Supplementary Data (Supplementary Figs. S29–S30). The days at retail and transportation to retail, both assumptions in the retail phase, were found to be most influential, with processing water use found to be less sensitive.
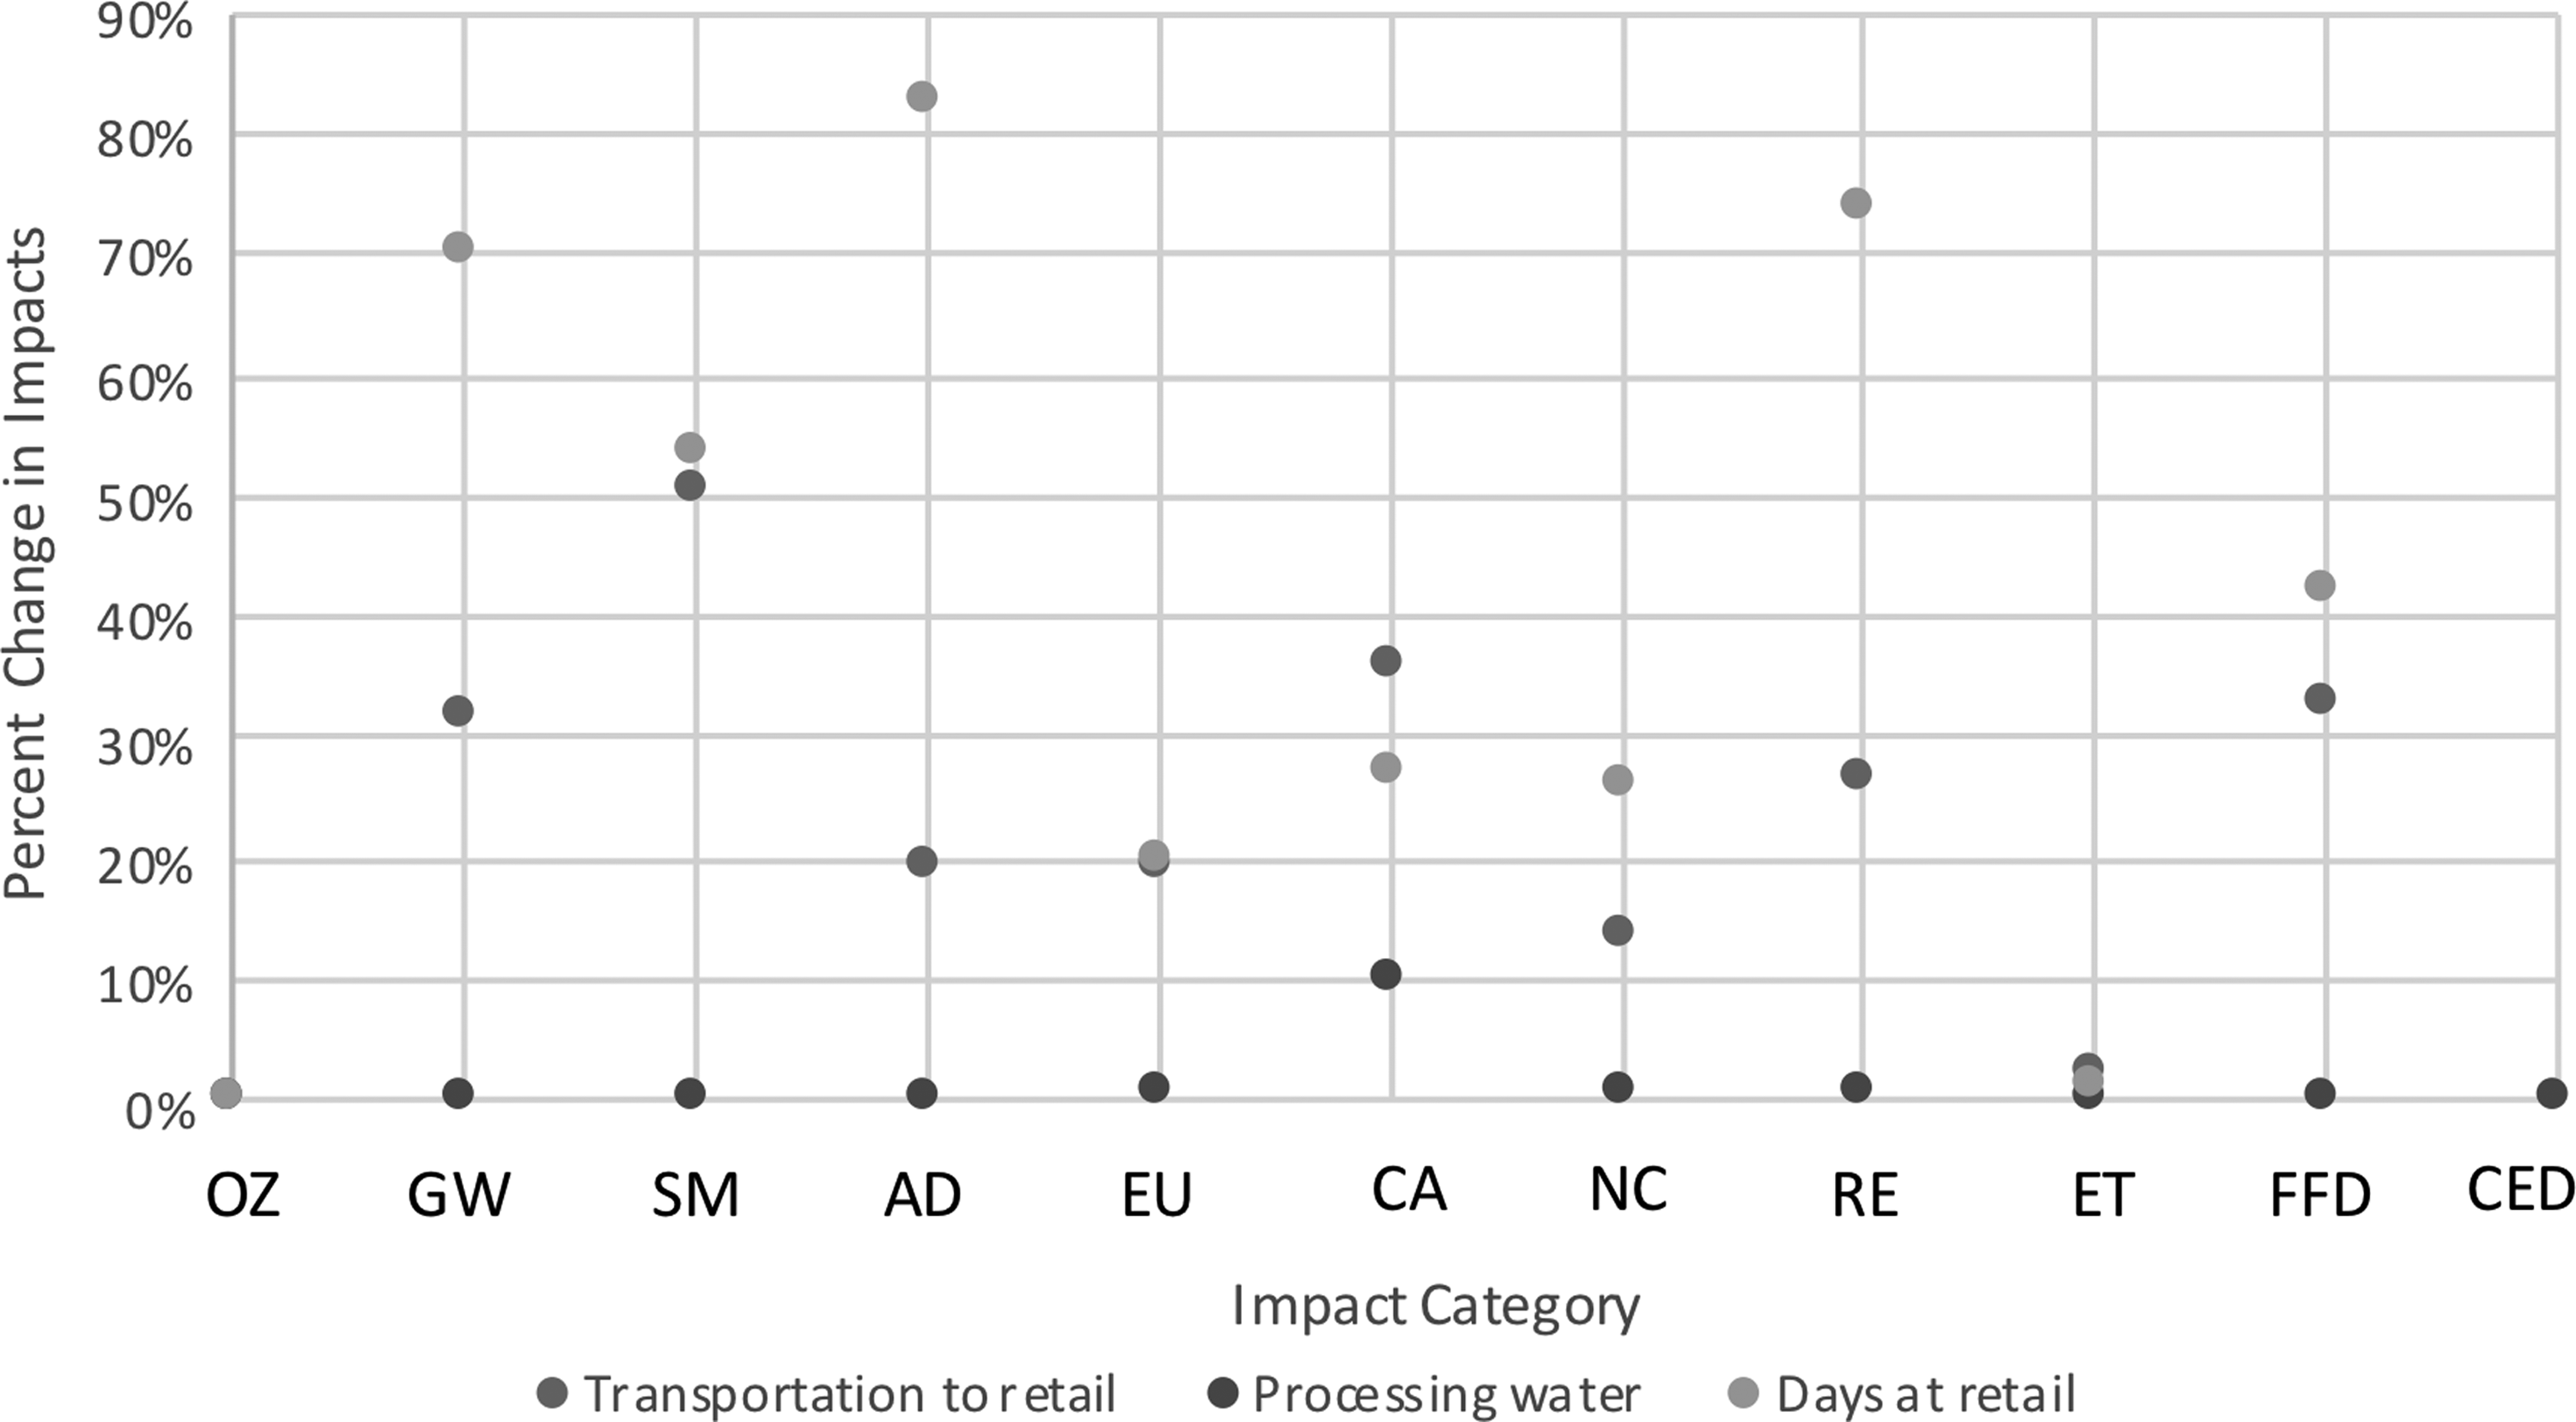
Sensitivity of impacts to inventory inputs. AD, acidification; CA, carcinogenics; ET, ecotoxicity; EU, eutrophication; GW, global warming; NC, noncarcinogenics; OZ, ozone depletion; RE, respiratory effects; SM, smog.
Conclusions
This study was the first comprehensive scientific study performed that compares the environmental impacts of dairy milk to two plant-based alternatives, soy milk and almond milk. The results show that the choice of FU plays an important role in LCA results and interpretations for food products. Traditionally, food products have been expressed in terms of volume or mass FUs. However, as this study has shown, there are many functions of milk, beyond filling an empty stomach, such as nutritional aspects (e.g., protein, calories, etc.). The method presented in this work is valuable for adding an important aspect of nutrition (i.e., protein quantity). Incorporating a protein FU may not be necessary for all foods, especially those that mainly provide other nutrients. However, the comparison of plant-based alternatives, in particular, should consider using 2 or more FUs to capture more of the nutritional properties of foods.
Overall, almond milk and soy milk have environmental advantages over dairy milk. However, trade-offs were seen between the three products in the 12 impact categories considered. The sensitivity analysis emphasizes the findings, highlighting the relevance of transportation to retail and electricity consumption at retail upon the environmental profile of milk consumption. In the case of almond milk, transportation between producers and consumers caused the largest impact. This suggests that transportation is a critical component as well as the consideration of where food is produced to LCA results. In the case of soy milk, electricity consumption at retail caused the largest impact, suggesting that a shift to all shelf-stable milk had the potential to reduce impacts, although it would require additional processing.
Footnotes
Acknowledgments
The authors acknowledge the generous support of PI Andrea Hick's start-up funding. The authors thank the reviewers for their assistance in improving the article.
Author Disclosure Statement
No competing financial interests exist.
References
Supplementary Material
Please find the following supplemental material available below.
For Open Access articles published under a Creative Commons License, all supplemental material carries the same license as the article it is associated with.
For non-Open Access articles published, all supplemental material carries a non-exclusive license, and permission requests for re-use of supplemental material or any part of supplemental material shall be sent directly to the copyright owner as specified in the copyright notice associated with the article.