
Abstract
Abstract
Mercury (Hg) intake through rice has been proved as the main pathway for Hg exposure to inland Chinese residents. To evaluate the risk of Hg exposure through rice consumption, 49 rice samples were collected in three provinces of China. Total mercury (THg) concentration in rice samples ranged from 1.9 to 15.3 μg/kg (mean 4.4 ± 2.3 μg/kg), which was lower than the Chinese national standard. In vitro experiments were applied to obtain bioaccessibility of THg in rice and results showed that the range of bioaccessibility was 1.0–11.4%, which was much lower than the data reported in fish studies. Estimated daily intake (EDI) was calculated to assess the potential health risk. When considering bioaccessibility, the EDIbio was far below the reference dose. Overall, our results suggest that consuming rice planted in non-Hg contaminated sites might not cause severe Hg poisoning for inhabitants in their daily diet.
Introduction
M
As in the fish species, high Hg concentration was found in rice planted in some Hg mining areas of China; thus rice was considered as the main MeHg exposure pathway to inhabitants of inland China (Feng and Qiu 2008; Feng et al., 2008; Zhang et al., 2010). Consequently, scholars have investigated Hg ingestion through rice consumption; for example, Li et al. (2008) investigated different Hg exposure pathways to populations from Hg mining areas and results showed that rice intake was the major MeHg exposure pathway. Meng et al. (2010) showed that rice seed can accumulate high MeHg than other plant tissues. Li et al. (2017) and Rothenberg et al. (2017) also found that Hg isotopes in human hair are different in rice and fish consumption. Consequently, calculating Hg ingestion from rice consumption would be helpful to assess the potential health risk for rice-consuming inhabitants in China. While calculating the Hg ingestion amount, applying the bioaccessibility data would be more accurate than simply using Hg concentration in rice.
In this research, rice samples were collected in non-Hg contaminated sites in three provinces of China. Previous studies mainly focused on Hg mining area, and in vitro experiment was applied to obtain Hg bioaccessibility data. The potential health risk was preliminarily assessed using the bioaccessibility data to explore the safety of Hg ingestion through rice consumption of the inhabitants living in non-Hg contaminated sites.
Materials and Methods
Sample
Forty-nine rice samples were collected in this study, of which 19 samples were from Hubei province (HB), 10 from Anhui province (AH), and 20 from Guangxi province (GX). Whole rice plants were collected directly from rice paddy, and only rice grain was used in this study. Rice grain was treated into white rice, milled into 100 mesh, and then kept in polyethylene bags.
For determining total Hg (THg), 0.5 g of rice samples was weighed into 15 mL centrifuge tubes, 1 mL deionized water was added to total volume, and this was placed in a 100°C water bath for 30 min to simulate the cooking process. For in vitro experiment, 2 g of rice samples was weighed into 50 mL centrifuge tubes, 5 mL deionized water was added to total volume, and this was placed in a 100°C water bath for 30 min.
Hg determination
For determining THg concentration in rice, 5 mL nitric acid was added to the cooked sample, and then placed in a 95°C water bath for 3 h to digest the sample. After the sample was cooled to room temperature, 15 mL deionized water was added. Cold vapor atomic fluorescence system (CVAFS; Model III detector; Brooks Rand Instruments) was applied to determine THg in digested samples. The determination procedure followed the USEPA method 1631 (The U.S. Environmental Protection Agency [USEPA], 2002).
In vitro experiment
The Deutshe Institut für Normung (DIN) in vitro method was applied to obtain the THg bioaccessibility data in rice. The ingredients, pH, and extraction time of simulated gastric and intestinal juice are given in Table 1 (Ng et al., 2013). In brief, 50 mL simulated gastric juice was added to cooked samples and shaken at 120 rpm at 37°C for 2 h. Then, the mixtures were centrifuged at 3000 rpm for 20 min. The supernatant was collected into another 50 mL centrifuge tube, and 50 mL simulated intestinal juice was added to the residue. Similar to the gastric phase, after being shaken for 6 h and centrifuged, the supernatant of the intestinal phase was collected. The collected supernatant samples were stored at −18°C until analysis.
CaCl2, calcium chloride; KCl, potassium chloride; KH2PO4, monopotassium phosphate; MgCl2, magnesium chloride; NaCl, sodium chloride.
Calculation method
Bioaccessibilities (%) of THg were calculated using Equation (1) according to USEPA (2012):
where Cext (ng/mL) is THg concentration in extraction solution of in vitro experiment, Vext (mL) is volume of extraction solution, Csample (ng/g) is THg concentration in samples, and Msample (g) is mass of samples.
Estimated daily intake (EDI) (USEPA, 2000) was calculated for the potential risk assessment of THg ingestion from rice consumption. The EDI was calculated using Equation (2).
where EDI is expressed as ng/kg·BW·day, C (ng/g) is the THg concentration in rice, IR (g) is the ingestion rate of rice, and BW (kg) is body weight.
Quality control/quality assurance
The limit of detection (LOD) of THg in CVAFS was 0.03 ng/L. The LODs were determined using USEPA method 1631 (USEPA, 2002). Duplicate samples were applied in the experiment, for which relative standard deviation was <10%.
The tangerine leaf (GBW-10020) produced by The National Research Center of Certified Reference Material was applied as certified reference material to calculate the recovery of THg, which ranged from 98% to 103%.
Results and Discussion
THg concentration in rice
A national standard of contaminant concentration in food (GB2762-2017) was revised by the National Health and Family Planning Commission and Food and Drug Administration of China in 2017 (The National Health and Family Planning Commission of People's Republic of China [NHFPC], 2017). All the THg concentrations in rice samples met the national standard of 20 μg/kg. The range of THg concentrations in rice samples of Hubei was 1.7–5.3 μg/kg, with a mean of 4.6 ± 3.0 μg/kg. For Guangxi and Anhui province, the data were 1.9–7.7 μg/kg (mean = 4.9 ± 1.9 μg/kg) and 2.7–8.8 μg/kg (mean = 3.9 ± 1.6 μg/kg), respectively (Figs. 1–3).

THg concentration in rice samples of Hubei province. THg, total mercury.
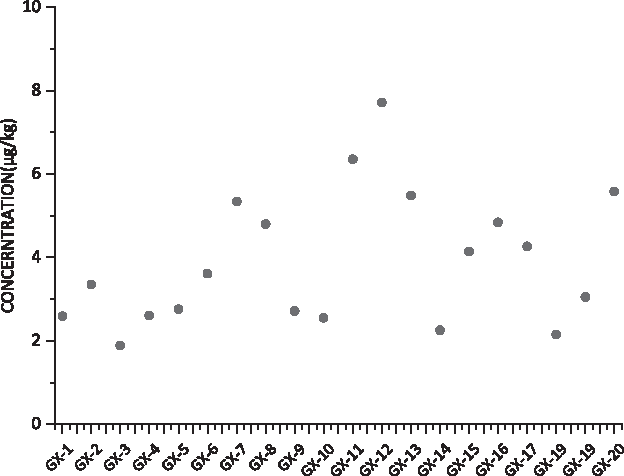
THg concentration in rice samples of Guangxi province.
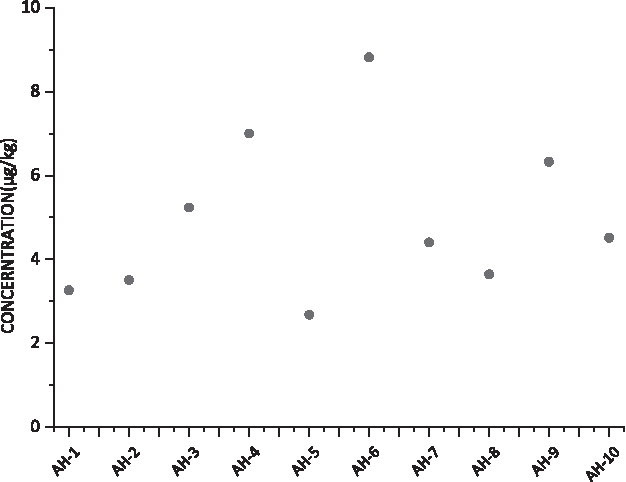
THg concentration in rice samples of Anhui province.
Compared with the reported data of THg concentration in rice of Wanshan Hg mining area of 4.9–214.7 μg/kg (Feng et al., 2008) and 6.0–113 μg/kg (Li et al., 2008), the data obtained from this study was much lower. Because the sampling sites of this study were mainly non-Hg contaminated area, the crops planted in these sites were not severely polluted as in the Hg mining area of Wanshan.
THg bioaccessibility in rice
Bioaccessibility of THg in rice was obtained through the DIN in vitro experiment. The THg bioaccessibility in gastric phase ranged from 0.8% to 4.8%, 0.4–2.8%, and 0.8–2.7% for samples from Hubei, Guangxi, and Anhui province, respectively. The THg bioaccessibility was elevated after being treated by simulated intestinal juice. The range of THg bioaccessibility of samples from these three provinces was 1.5–11.4%, 1.0–4.7%, and 1.3–5.3%, respectively (Figs. 4–6).
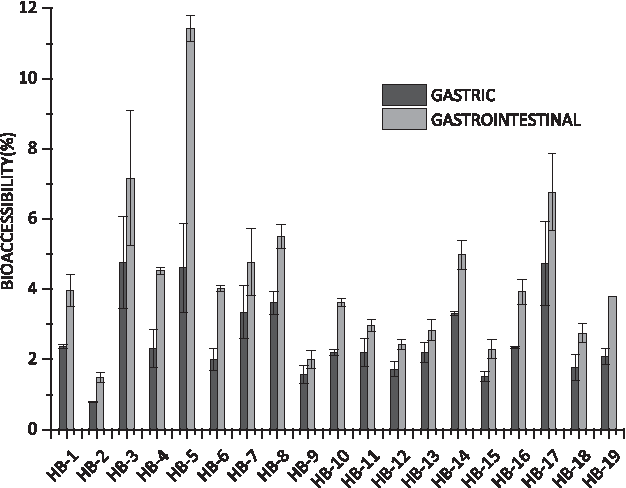
THg bioaccessibility in rice samples of Hubei province.
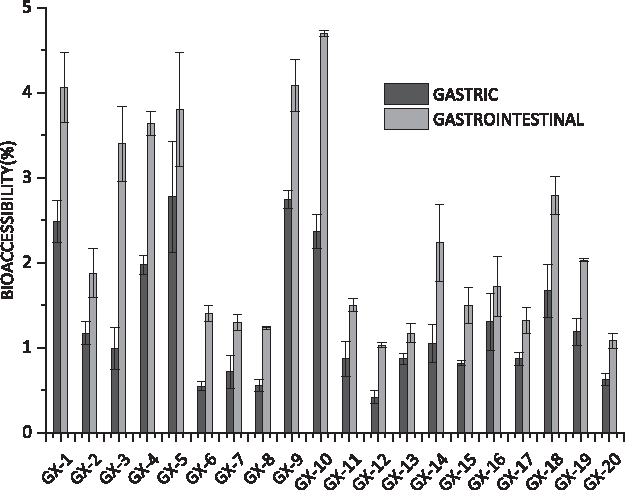
THg bioaccessibility in rice samples of Guangxi province.
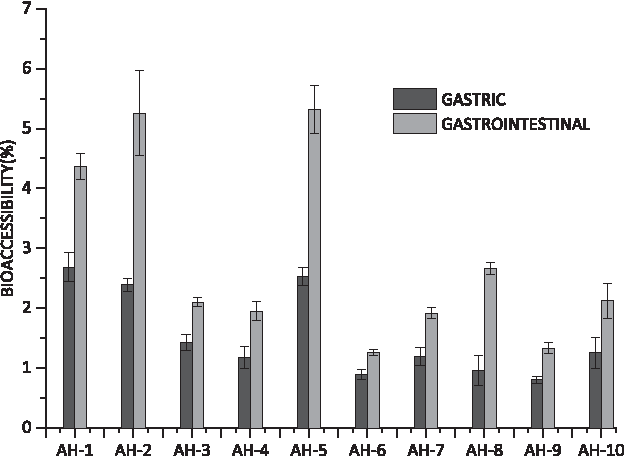
THg bioaccessibility in rice samples of Anhui province.
Compared with other pollutants in rice, Yang et al. (2012) investigated cadmium (Cd) in rice samples collected in Hunan province, and the result showed that the range of Cd bioaccessibility in rice was 15.24–18.87%. Wang et al. (2014) reported 74% of Cd bioaccessibility in cooked long-grain rice. Arsenic (As) was reported to have >50% of bioaccessibility in rice (Castor et al., 2016; Zhuang et al., 2016). The results in this study showed that THg bioaccessibility in rice was relatively lower than that reported for Cd and As. The high bioaccessibility of Cd was explained by the fact that Cd was found to accumulate in vacuoles of plant cells and thus Cd was easily released to simulated gastric juice (Hall and Davis, 2002; Fu and Cui, 2013). Arsenic in rice was mainly bound to proteins, so when simulated intestinal juice was added, the enzymes broke down the proteins into amino acid and the As in the protein was released (Sun et al., 2012). Hg in rice was proposed to bind to cysteine; IHg was associated with phytochelatins and MeHg was associated with proteins (Meng et al., 2014). It is speculated that differences of binding material and solubility may lead to the difference in bioaccessibility.
THg bioaccessibility in rice in this study was lower than the data reported for fish. In raw and grilled salmon, the THg bioaccessibility was 89.8% ± 0.1% and 32.2% ± 9.4%, respectively (Costa et al., 2015). The range of THg bioaccessibility in 20 fish species from Hong Kong was reported to be 10.9–33.0% (Wang et al., 2013), and 17% ± 2% to 77% ± 6% of THg bioaccessibility in 10 fish and seafood species in Catalonia (Spain) was also reported (Cano-Sancho et al., 2015). Relatively, the THg bioaccessibility of rice in this study was lower than that in fish. This phenomenon can be explained by the different THg concentrations in two research objects; most fish samples reported contained higher THg concentration than the rice samples in this study. Moreover, Hg in fish muscle mainly existed as MeHg cysteine complexes (Kuwabara et al., 2007) that were easily released with the breakdown of proteins during in vitro gastrointestinal digestion experiment. In addition, rice samples used in this study were all cooked, and the cooking process was proved to be able to decrease the Hg bioaccessibility (Afonso et al., 2015a, 2015b; Matos et al., 2015).
THg ingestion through rice
THg ingestion was expressed in both EDI and EDIbio, which were calculated, respectively, by THg concentration in rice and bioaccessible THg concentration obtained in the DIN in vitro experiment. The average body weights of male and female adults were 66.2 and 57.3 kg, respectively, which were investigated by NHFPC (2015). The rice intake rate was 326.09 g/day, which was reported as an average rice intake amount of south China (Jin, 2008). The data are given in Table 2.
AH, Anhui province; EDI, estimated daily intake; GX, Guangxi province; HB, Hubei province; SD, standard deviation.
EFSA (2012) suggested that the TWI of Hg is 1.3 μg/kg·BW, that is, 185 ng/kg·BW·day. In addition, the PTWI given by WHO (2010) of IHg is 4 μg/kg·BW, that is, 571 ng/kg·BW·day. In this study, both EDI and EDIbio were well below the reference dose (RfD) suggested by EFSA and WHO. A daily exposure dose exceeding the RfD indicates that people might suffer harmful effects over a lifetime or may be at risk for deleterious noncancer effects from chronic exposure through the diet (Chien et al., 2007; Wang et al., 2013). Thus consuming rice from the three provinces introduced in this study might not cause severe Hg poisoning to inhabitants through daily diet. In contrast, Hg ingestion through fish consumption, for example, tuna and blue shark, was reported to be highly possible to exceed the PTWI and TWI (Afonso et al., 2015b; Matos et al., 2015) because of high THg and MeHg concentration. For fish (or seafood) species with relatively lower THg concentration, despite the possibility of exceeding RfD to be very low, it still exists. Therefore, sensitive groups of inhabitants (i.e., pregnant women and children) should be warned about the potential negative health impact of fish consumption (Wang et al., 2013; Cano-Sancho et al., 2015). The EDIbio in this study is far lower than the RfD, which is very different from the data reported for fish.
Conclusion
This study showed the condition of THg in rice planted in three provinces in south China. The range of THg concentration in rice samples of this study was 1.7–15.3 μg/kg, with a mean of 4.4 ± 2.3 μg/kg. The concentration met the Chinese national standard of 20 μg/kg, which means the rice samples might be safe to eat. For further improvement, the DIN in vitro digestion experiment was applied to obtain bioaccessibility data. The results showed that the percentages of THg bioaccessibility were all <12%, which were much lower than the data reported in fish studies. After THg concentration and bioaccessibility data were obtained, EDI and EDIbio were calculated to preliminarily assess the potential health risk rice consumption may cause. Both EDI and EDIbio were far below the RfD recommended by the ESFA and WHO, which also reveals a relatively low risk of THg ingestion caused by rice consumption. The results of this study showed the possibility of safety for inhabitants to consume the rice planted in non-Hg contaminated sites in their daily diet.
Footnotes
Author Disclosure Statement
No competing financial interests exist.