
Abstract
Abstract
Environmental impacts of electrical transformer manufacturing vary according to transformer power distribution capacity and metal type used in coil manufacture. 75 Kilovolt-ampere (kVA) transformers are widely used in light poles, residential buildings, and other locations, and copper and aluminum are the main metals used for coil manufacturing. Life cycle assessment (LCA) methodology was used to evaluate the environmental impact of copper and aluminum use in the 75 kVA transformer manufacturing process. Cradle-to-gate LCA was considered, and a distribution capacity of 75 kVA was adopted as functional unit. Results were obtained through SimaPro® software and three environmental impact methods: Eco-indicator 99, CML 2, and ReCiPe. Coil type showed significant influence on environmental impacts due to the metal used in its production. Results of the comparison between coil types showed that the copper coil has more adverse effects on the environment. The main environmental impact attributed to aluminum coil is associated with its global warming potential due to a high energy requirement in aluminum production (75.7 MJ/kg) in comparison with copper (22.8 MJ/kg). Greenhouse gas emissions (in terms of carbon dioxide emissions, CO2) from 75 kVA manufacturing with copper coil were, in average, 888.71 kg carbon dioxide equivalent (CO2eq) and 1,226.27 kg CO2eq with aluminum coil. Copper coils have a major contamination potential on terrestrial and marine environments. Some harmful effects on human health associated with copper mining and production are caused by the toxicity of heavy metals such as antimony, arsenic, cadmium, chromium, zinc, nickel, and mercury. Final results showed that copper has higher environmental impacts due to the production and emissions of heavy metals in its manufacturing process that cause more adverse effects on the environment in comparison with greenhouse gas emissions.
Introduction
I
Future copper availability has stimulated the use of different materials for coil construction, since copper mining already accounts for 40% of metal depletion (Arvesen et al., 2014). The increase in aluminum use for coil construction is mainly due to its abundance and lower price (Cardoso et al., 2011), in addition to its interesting characteristics such as conduciveness, being easily paintable, malleability, corrosion resistance, and structural strength with weight reduction (Tsakiridis et al., 2013; Hao et al., 2016; Mahinroosta and Allahverdi, 2018). Aluminum use to replace copper shows that a change in raw material can significantly affect environmental impact (Debusschere et al., 2007).
Inclusion of environmental assessments in industrial production and equipment selection has assisted in environmental impact mitigation (Goh and Yang, 2014; Rehberger and Hiete 2015; Rosa et al., 2015; Švajlenka et al., 2017; Hegab et al., 2018). The knowledge about adverse effects associated with the use of copper and aluminum, along with the analysis of transformer manufacturing processes, contributes to the manufacturer's decision-making and for environmental impact mitigation. However, few studies were made about transformers and transformer coil type comparison.
Studies of Asea Brown Boveri (ABB, 2003a, 2003b, 2003c) evaluated transformers with copper coils with power distribution capacities between 315 kilovolt-amperes (kVA) and 500 megavolt-amperes (MVA). Carlen et al. (2011) performed the life cycle assessment (LCA) of standard transformers and amorphous metal transformers evaluating dry and oil-immersed core conditions. Olivares-Galván et al. (2010) evaluated transformers up to 190 kVA with aluminum coils.
Based in cited studies, the quantity of raw materials and, therefore, environmental impacts of transformer manufacture change according to transformer power distribution capacity and coil type used. At the moment, there is no study on the environmental impact of the 75 kVA transformer manufacturing process.
This study aims to analyze the environmental effects of copper and aluminum use in the manufacturing process of 75 kVA transformers and to indicate the metal most suitable for use in coil manufacturing. In addition, the results obtained seek to provide additional information for decision-making and environmental impact mitigation to manufacturers and energy concessionaires of 75 kVA transformers since these transformers are widely produced for use on light poles, residential buildings, and other locations.
Materials and Methods
Life cycle assessment
LCA is a methodology widely used in environmental assessment (ISO 14040, 2006). LCA is used to assess, compare, and calculate the environmental impact of products and/or processes, acting as a support tool for their choice (Chehebe, 1998; Ferrão, 1998; ISO 14040, 2006; Greening and Azapagic, 2013; Bull and Kozak, 2014; Kurczewski, 2014; Toniolo et al., 2017; Salieri et al., 2018) and assisting in the selection and accreditation of suppliers and products (Seiffert, 2011; Liu et al., 2018).
LCA is standardized by the International Organization for Standardization (ISO) and main publications about LCA are ISO 14040 (Principles and Framework), ISO 14041 (Goal and Scope Definition and Inventory Analysis), ISO 14042 (Life Cycle Impact Assessment [LCIA]), ISO 14043 (Life Cycle Interpretation), and ISO 14044 (Requirements and Guidelines). LCA application includes four phases (Fig. 1).
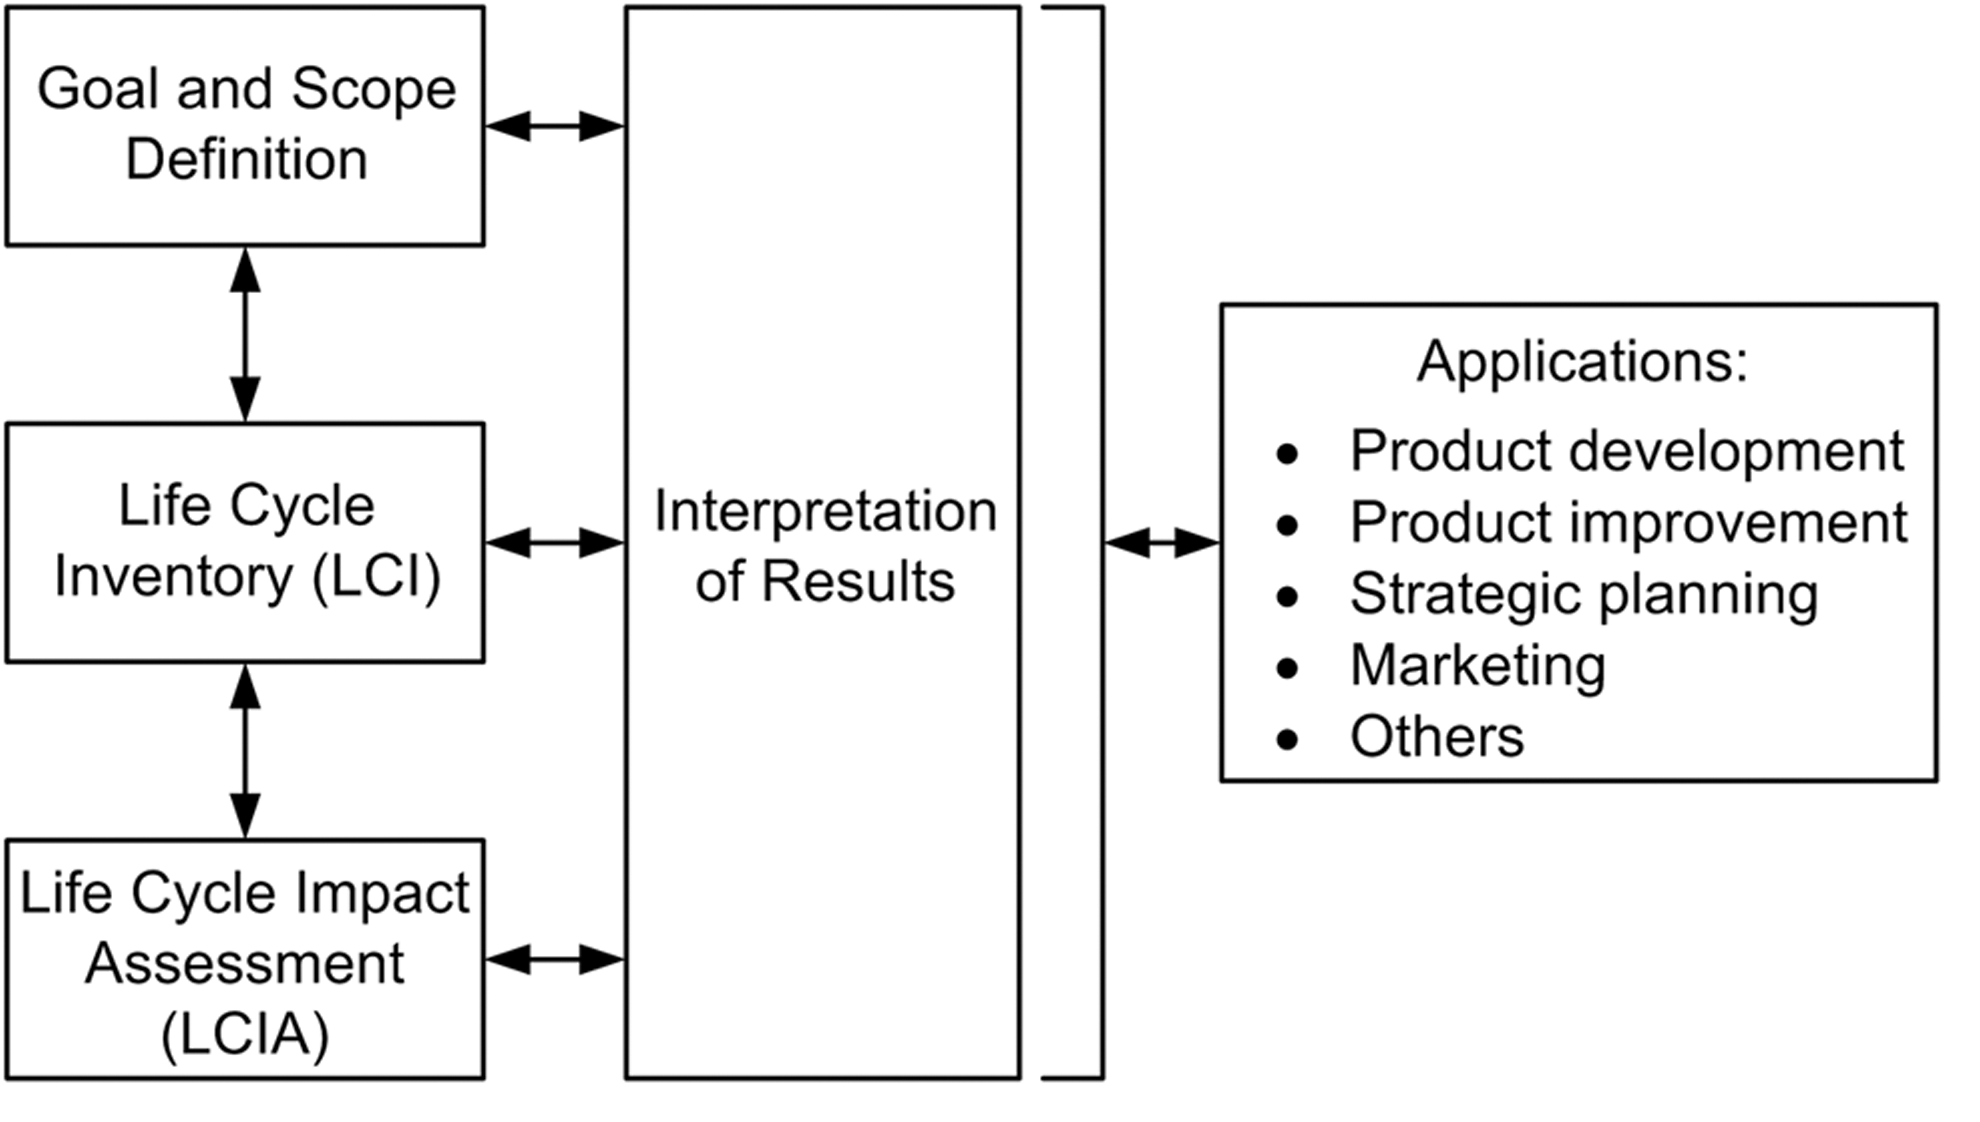
Life cycle assessment phases (adapted from ISO 14040, 2006).
In Goal and Scope is described the reason for LCA application, the product/process definition, its life cycle, and the indication of the system boundaries. It is important to define a functional unit for quantification of the inputs and outputs. In LCIA, the input and output flows, collected and qualified in the Life Cycle Inventory (LCI), are converted into environmental impacts. In the last step (Interpretation), it is necessary to evaluate if the Goal and Scope were attended and if the results are reliable. Afterward, conclusions can be made and information can be used according to the intended initial goal (Chehebe, 1998; ISO 14040, 2006; Seiffert, 2011).
Results of an LCA can be made available in midpoint or endpoint terms. Classical assessments (called midpoint) directly show LCI flow conversion for impact categories, while the damage assessments (called endpoint) express the causes and effects to estimate general damages to human health, ecosystem quality, and resources (Goedkoop and Spriensma, 2001; Pfister et al., 2009; PRé Consultants, 2018). The difference between impact (midpoint) and damage (endpoint) is the distance between process unit and its effect (Fig. 2). In general, indicators that are close to the inventory have fewer uncertainties involved than indicators that go beyond the intermediaries (Paraskevas et al., 2016). Results are generally expressed in midpoint terms to reduce LCA uncertainties, however, damage indicators are easier to interpret than intermediate indicators.
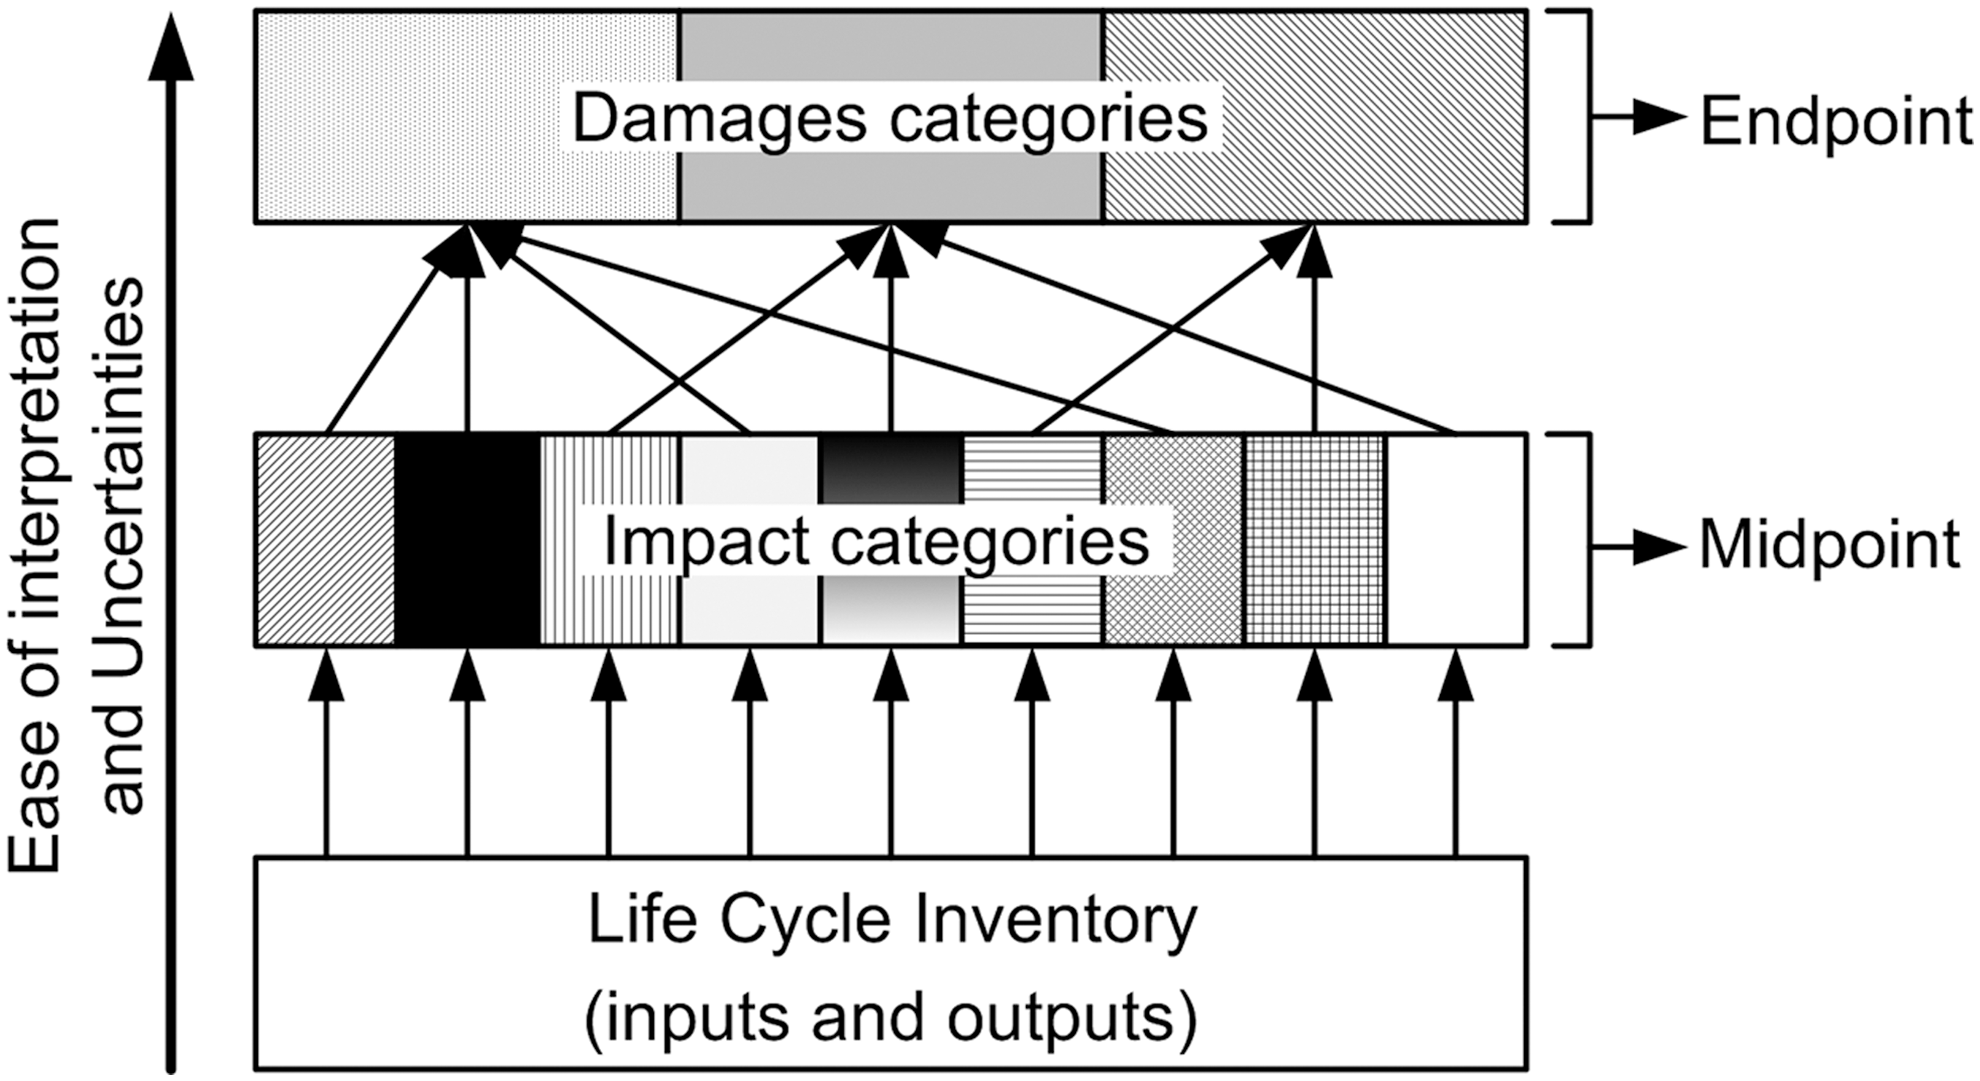
General structure of impact assessment method (adapted from Goedkoop et al. 2010).
Goal and scope
Goal and scope definition
The goal of this study is to evaluate and compare life cycle environmental impact of electrical distribution transformer manufacturing with different coil types—copper and aluminum—and to indicate the better coil type to be used in terms of environmental impact reduction. As for the scope, this research intends to provide knowledge about the environmental impacts associated with the production process of 75 kVA transformers and to assist manufacturers in choosing the coil type to be produced and used.
Functional unity
The power distribution capacity of the transformer was the functional unit adopted. A 75 kVA power distribution capacity was chosen and all raw materials, energy consumption, transportation, emissions, effluents, and waste disposal were based on this functional unit.
Scenario setting and system boundary
Two scenarios were included according to the coil type used. Scenarios representing the transformer manufacturing process using copper and aluminum coil were identified as 75 kVA transformer—copper coil and 75 kVA transformer—aluminum coil.
Transformer production line occurs basically in three steps: coil winding, active part assembly, and final assembly. Winding is the coil manufacturing step. Active part assembly is related to the junction of magnetic core and coils. Magnetic core is made of siliceous or amorphous steel plates and coils are mounted on the core, while the assembly is fixed by armatures and shims. Final assembly occurs when the active part is placed in the tank and immersed in mineral or vegetable oil that has dielectric and cooling functions.
System boundaries are shown in Fig. 3, based on the main steps of the transformer manufacturing process. Boundaries were set using a cradle-to-gate approach, considering from the extraction of raw materials to transformer production.
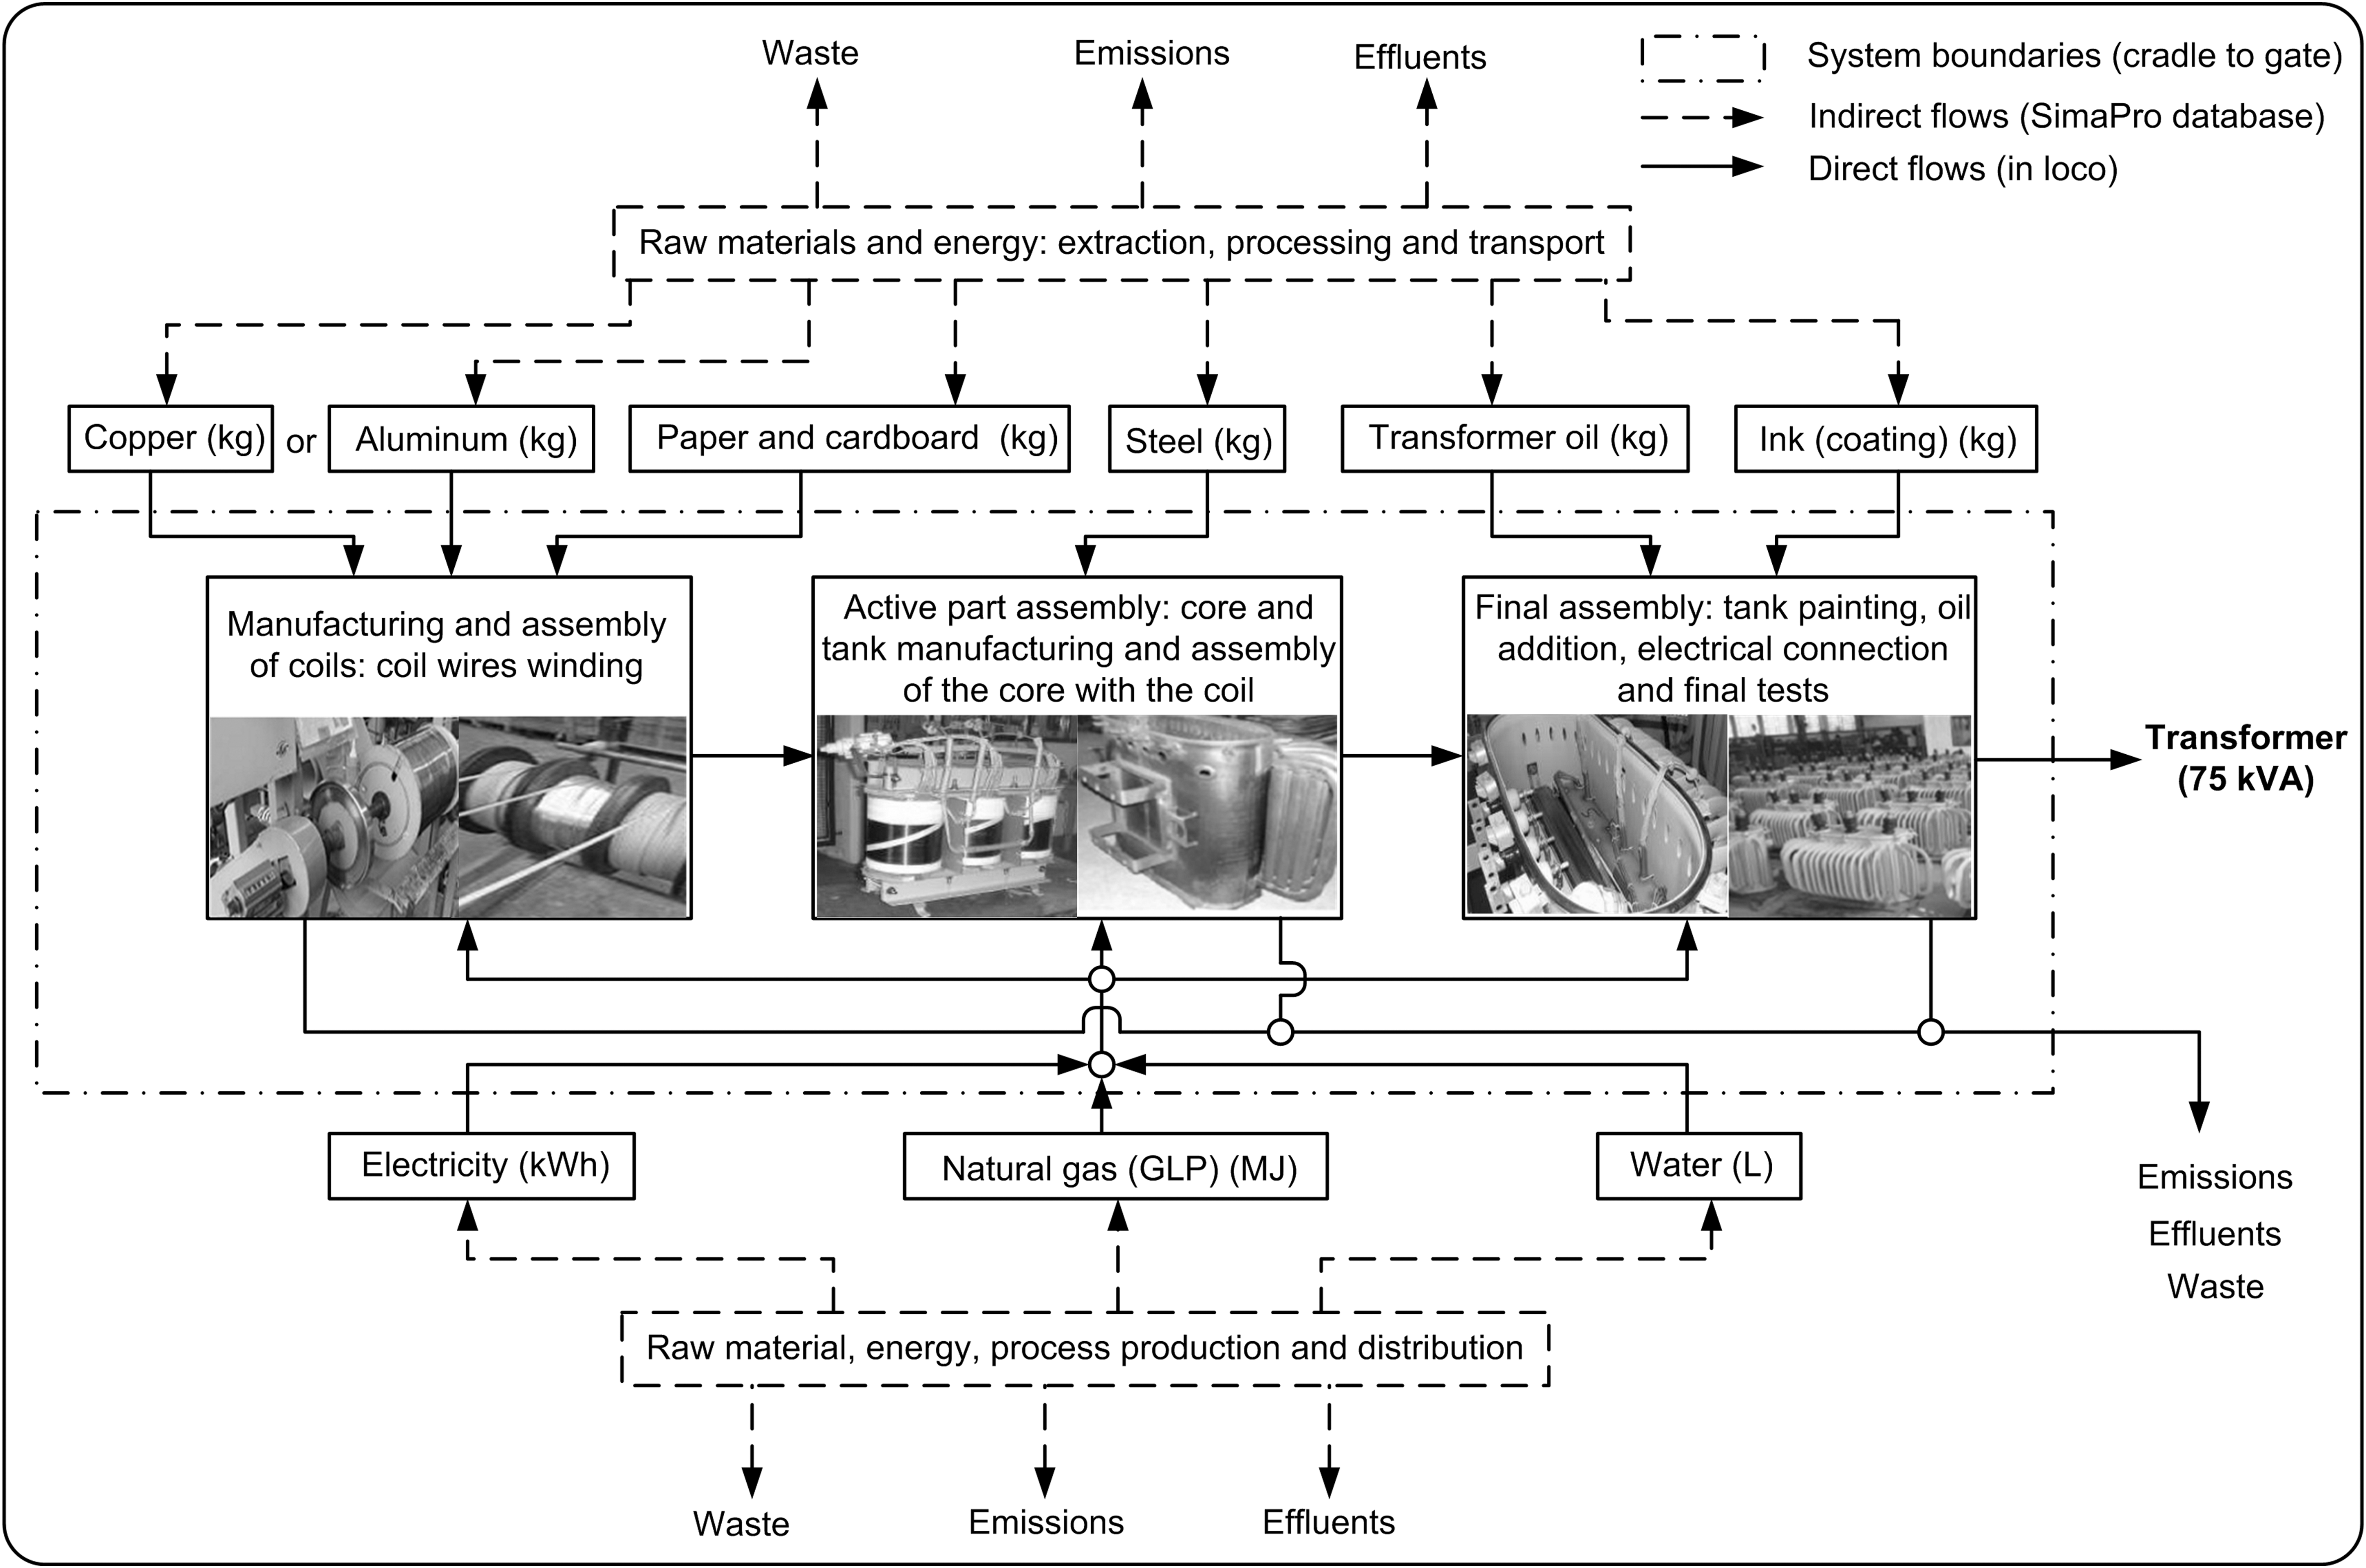
System boundaries and transformers simplified manufacturing.
Life cycle inventory
Data sources
Data collection of the transformer manufacturing process was performed in loco. Main flow identification and the measurement were carried out in the Polo Electro transformer manufacture company, located in Santa Maria—RS (Brazil). The company produces an average of 250 transformers per month using copper and aluminum coils. According to the owners, aluminum is more used because of its lower cost.
Transformer inventory data related to manufacturing were collected through engineering reports (internal company data) and measurements during transformer manufacture in the production line (direct flows). Indirect flow data such as extraction, processing, and transportation related to direct flows were obtained from database ecoinvent in SimaPro® software (Fig. 3).
Equipment used in the manufacturing process of transformers and coils (steel cutting machines, soldering machines, calender, press, bending machines, hoists, and screwdrivers) was not considered input because all the parts are a common use for both processes. In addition, hand labor was not included in the environmental assessment due to difficulties in collecting these data, methodological assumptions, and insignificant influence on input energy and environmental impact (Pradhan et al., 2008; Kamahara et al., 2010).
Inventory data
Performance characteristics considered for both transformers are shown in Table 1.
Transformer Performance Characteristics
ABNT, Brazilian Association of Technical Standards; kVA, kilovolt Amperes. NBR, Brazilian Regulatory Standard.
According to the coil type, a different number of inputs are needed for the manufacturing process. Transformer total weight with copper and aluminum coils is 384 and 396 kg, respectively. The LCI data for both scenarios are shown in Table 2.
Life Cycle Inventory of 75 kVA Transformer Production
Constructive raw materials with the same mass quantity were disregarded.
Hand labor was not considered.
Solid waste is sent for recycling process and effluents are sent to sewage treatment plant.
Table 2 contains the flows collected in loco, that is, a data collection done during company operation. Outputs are the 75 kVA transformers produced, process wastes, effluents, and emissions. Solid waste majority is generated from leftovers of raw materials such as metal, paper, and cardboard, while emissions are generated by steel cutting machines and soldering machines. The amount of effluents generated, composed by process losses when oil is added to the transformer, is much lower than emissions and waste. Liquid and solid wastes are sent for sewage treatment and recycling, respectively. Emissions are released directly to the atmosphere. The final disposal of effluent and waste was destined and carried out by an outsourced company.
Only the production inventory data for copper and aluminum were evaluated, since other direct inputs are satisfactorily similar. Inventory data used for copper and aluminum production are available in Appendices 1 and 2, respectively.
Life cycle impact assessment
To obtain environmental results, SimaPro software was used along with ecoinvent, a database with a great variety of raw materials and processes (Goedkoop et al., 2010, 2016), and several impact assessment methods of LCI data (Kalakul et al., 2014). LCIA results were calculated at midpoint using three different environmental assessment methods—Eco-indicator 99, CML 2, and ReCiPe—with 11, 10, and 18 midpoint impact categories, respectively (Table 3).
Impact Categories: Eco-Indicator 99, CML 2, and ReCiPe Methods (Midpoint)
Database information SimaPro® and based on Yellishetty et al. (2009); Klinglmair et al. (2014); Koffler (2014); Thibodeau et al. (2014); Vázquez-Rowe et al. (2014); Woon and Lo (2014); Vargas et al. (2015).
Database information SimaPro and PRé Consultants (2018).
GWP, global warming potential.
Eco-indicator 99 has been widely used in LCA studies (Contreras et al., 2009; Cherubini and Strømman, 2011; Foteinis et al., 2011; Brondani et al., 2015; Mayer et al., 2015). Mendes et al. (2016) stated that, in addition to Eco-indicator 99, CML 2 is globally used. Also, the CML 2 method has a global warming potential (GWP) impact category, which is widely used to account for carbon dioxide (CO2) emissions. ReCiPe is used for the environmental analysis of products when a higher consistency in midpoint and endpoint method application is needed, since it was created as an updated version of CML 2 and Eco-indicator 99 (Lamnatou and Chemisana, 2017; Vilches et al., 2017; Muñoz et al., 2018; PRé Consultants, 2018).
Eco-indicator 99 and ReCiPe methods involve characterization of environmental effects, assessment of environmental damage on human health, ecosystem quality and natural resource degradation, standardization, and evaluation of environmental impacts (VROM (Ministry of Housing, Spatial Planning and the Environment), 2000; Goedkoop and Spriensma, 2001; PRé Consultants, 2018). Eco-indicator 99 and ReCiPe allow results to be expressed in terms of midpoint (impact categories) and endpoint (damage categories). The CML 2 method focuses on the midpoints of the cause/effect chain and does not assess endpoints.
Results were expressed in terms of characterization (environmental impact percentage, %) and midpoint as indicated by ISO 14040. Characterization considers that all impact categories have the same potential of environmental impact. Results were also evaluated in terms of normalization, considering the real magnitude and the main environmental impacts associated with the process. Ultimately, results obtained were compared with environmental studies about copper and aluminum use in product manufacturing.
Results and Discussion
Results are presented as follows: the LCIA Results and LCA of Copper and Aluminum Production sections. The Individual Environmental Assessment of the 75 kVA Transformer Manufacture section shows the results of each process individual environmental analysis, while the Environmental Impact Comparison: Copper Coil Transformer × Aluminum Coil Transformer section presents results of the two manufacturing processes' comparison. Individual Environmental Assessment of the 75 kVA Transformer Manufacture and Environmental Impact Comparison: Copper Coil Transformer × Aluminum Coil Transformer section analysis identifies the flows of each manufacturing process having a greater potential to cause environmental impact and to indicate the process that causes less environmental impact, respectively. Finally, in the LCA of Copper and Aluminum Production section, the results of the LCIA Results section are associated with aluminum and copper production through the cycle inventory analysis of both metals.
LCIA results
Individual environmental assessment of the 75 kVA transformer manufacture
Tables 4–6 show the flows with greatest impact potential in 75 kVA transformer—copper coil and 75 kVA transformer—aluminum coil according to Eco-indicator 99, CML 2, and ReCiPe impact evaluation.
Main Inputs with Potential Impact in Individual Environmental Assessment According to Eco-Indicator 99
Main Inputs with Potential Impact in Individual Environmental Assessment According to CML 2
Main Inputs with Potential Impact in Individual Environmental Assessment According to ReCiPe
Table 4 results show that, in individual assessment of transformer manufacturing, copper use has a higher impact potential in comparison with aluminum use. Copper was the input that presented the highest impact percentages in 7 of 11 impact categories—carcinogens, respiratory organics, respiratory inorganics, ecotoxicity, acidification/eutrophication, land use, and minerals. In case of aluminum manufacturing, the main impact is attributed to the associated use of steel. Aluminum use did not present a high percentage of impact in any impact category and had a significant impact potential in only three—carcinogens, climate change, and radiation. According to Table 4, steel has considerable impact percentages, mainly in the transformer production process with aluminum coils (high impact percentages in nine categories). It is important to notice that steel is used in both processes, but its impact potential is greater with aluminum than with copper.
When using the CML 2 method, results of which are shown in Table 5, copper was, again, the input that presented the highest impact percentages, with values above 80%, in copper coil transformer manufacturing for 7 of 10 impact categories—acidification, eutrophication, human toxicity, marine aquatic ecotoxicity, freshwater aquatic ecotoxicity, terrestrial ecotoxicity, and photochemical oxidation. In aluminum coil process, aluminum did not present a higher percentage of impact in any impact category except one—photochemical oxidation. On the contrary, steel has a considerable impact potential in the production process of aluminum coil transformers, showing high percentages in 9 of 10 impact categories.
Table 6 results are similar to the ones in Tables 4 and 5, according to the ReCiPe method. Copper use was the input that presented high impact percentages in 13 of 18 impact categories. In transformer manufacture using aluminum coil, steel presented high impact percentages in most impact categories (15 of 18). Results from Tables 5 and 6 show that for GWP and climate change impact categories, impact potential is higher for steel, followed by aluminum.
In general, Tables 4–6 results indicate that copper use has greater environmental impact potential than aluminum since copper metal had higher impact potential in 75 kVA transformer—copper coil, than aluminum metal had in 75 kVA transformer—aluminum coil.
Environmental impact comparison: copper coil transformer × aluminum coil transformer
Figures 4, 5, and 6 show the environmental comparison between electrical distribution transformer manufacturing with different coils according to the environmental impact methods Eco-indicator 99, CML 2, and ReCiPe, respectively.
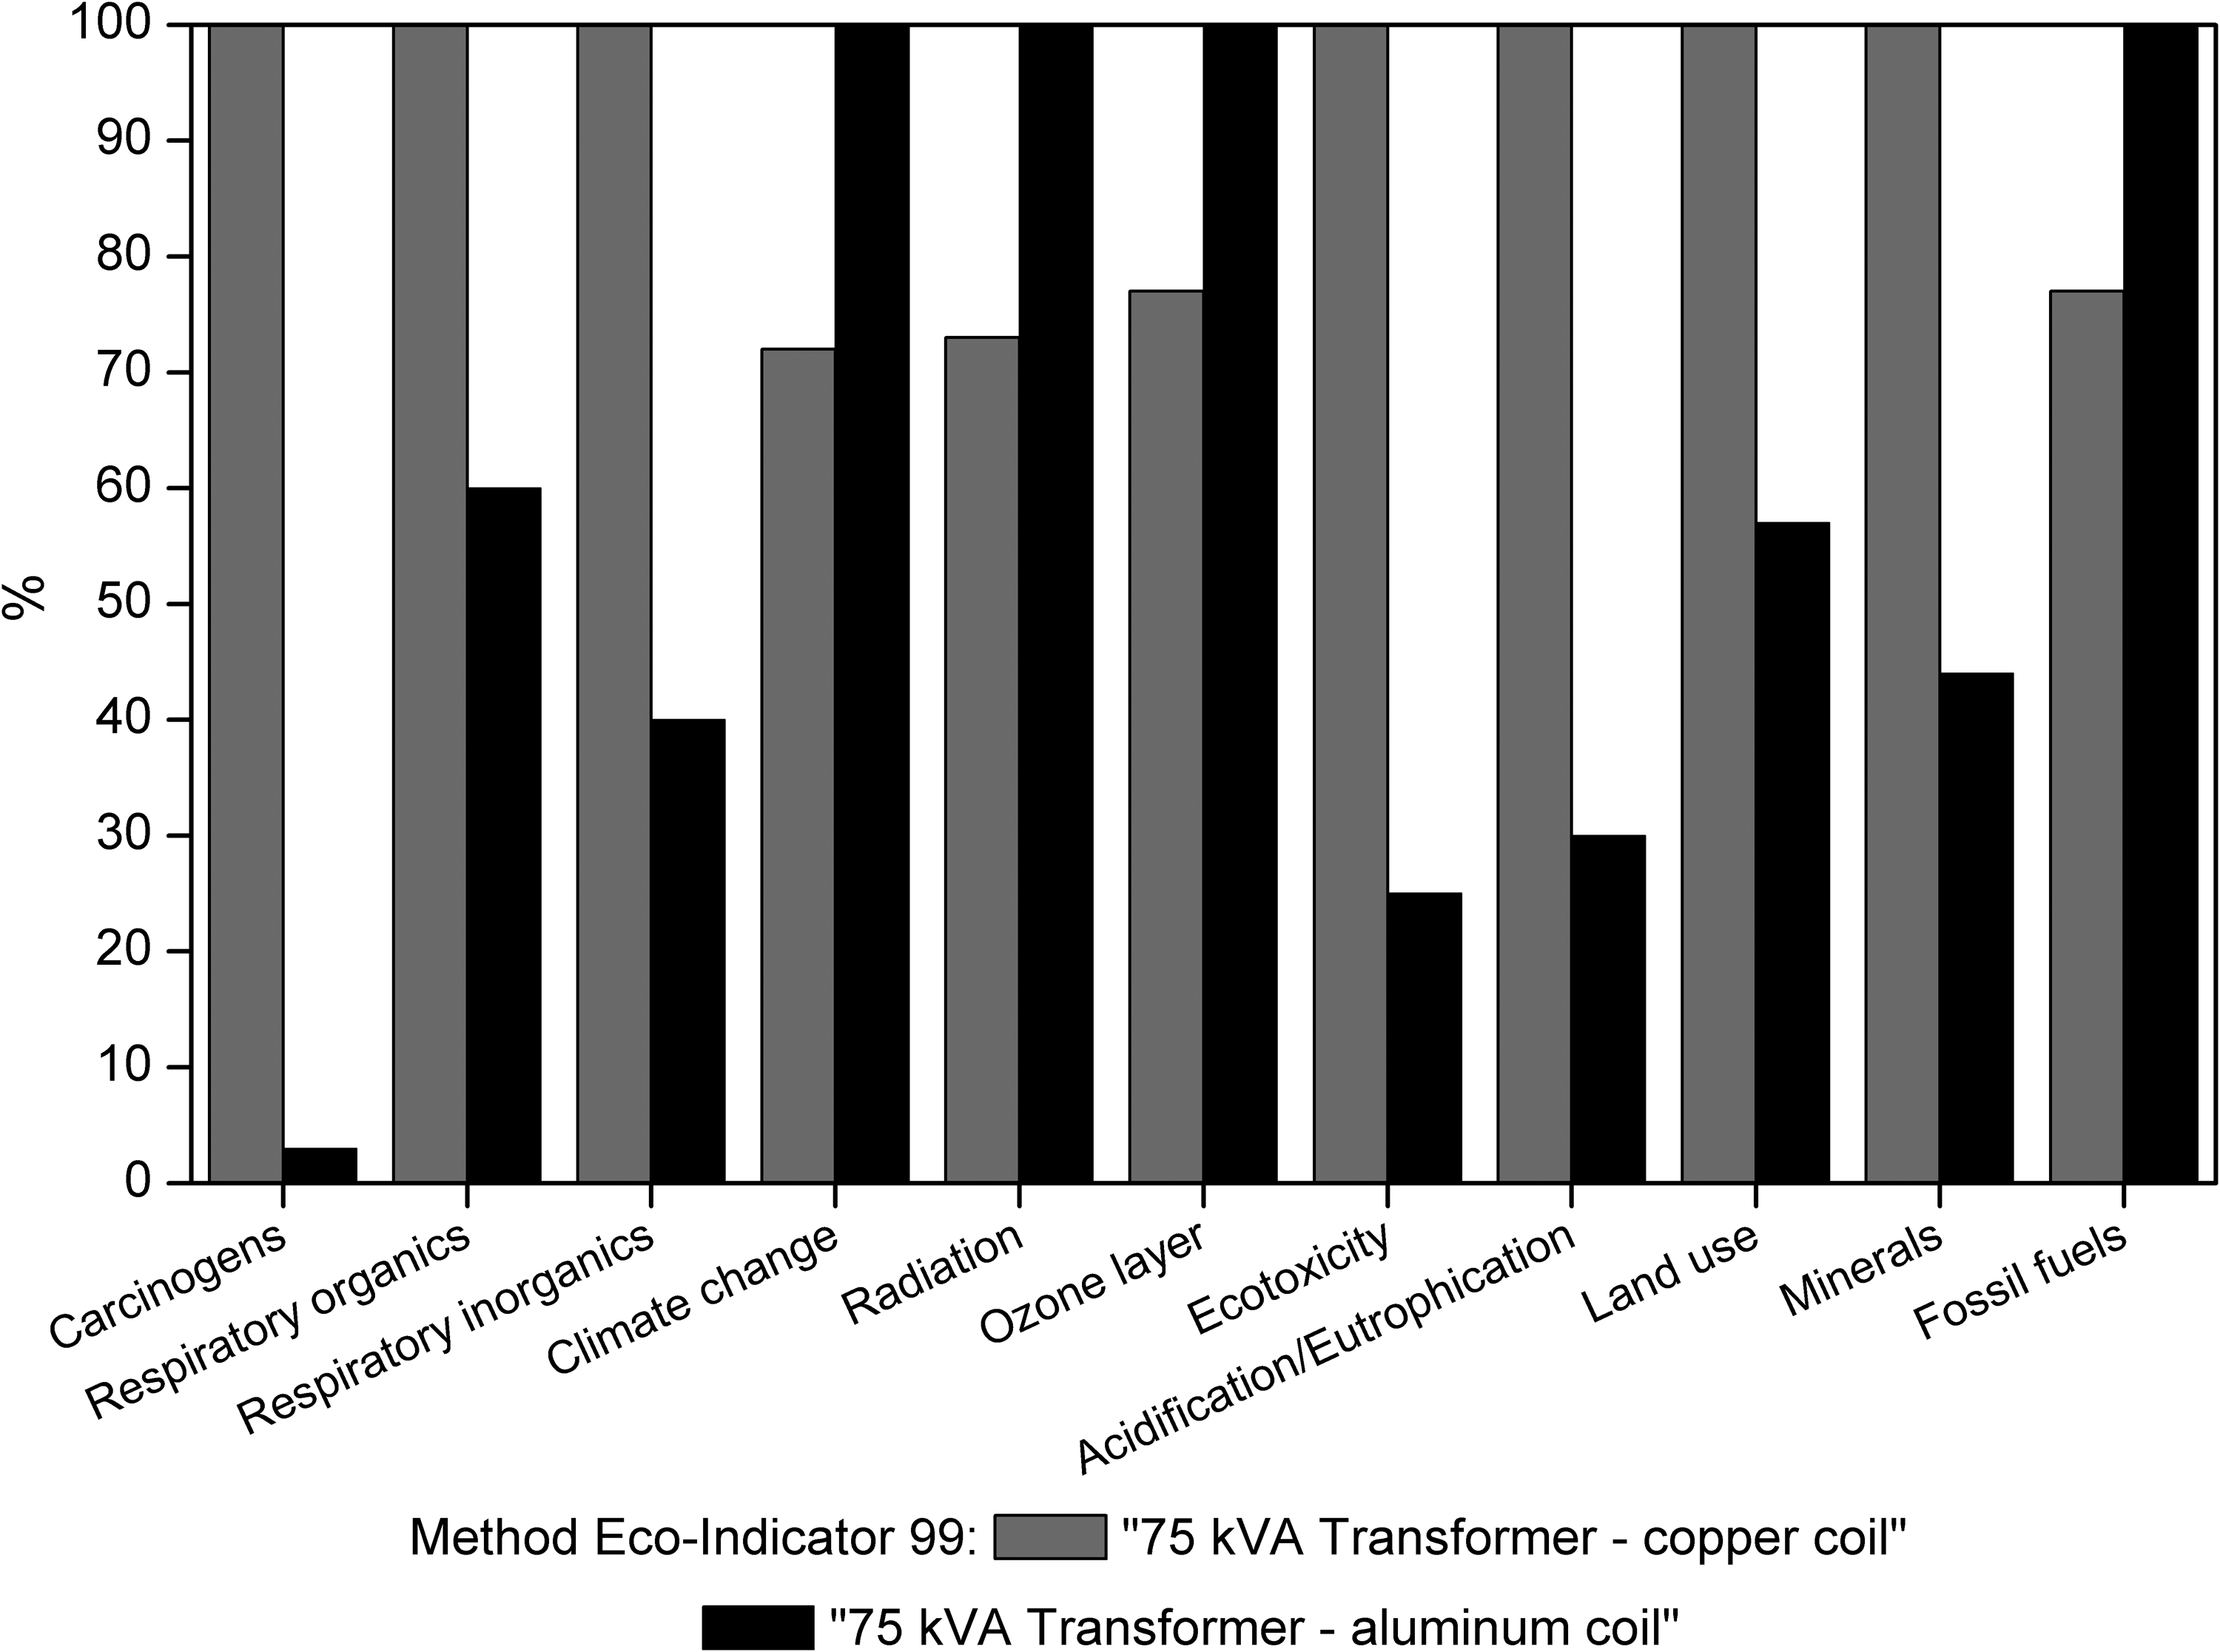
Environmental impact comparison between 75 kVA transformer—copper coil and 75 kVA transformer—aluminum coil: Eco-indicator 99 (midpoint). kVA, kilovolt amperes.

Environmental impact comparison between 75 kVA transformer—copper coil and 75 kVA transformer—aluminum coil: CML 2 (midpoint).
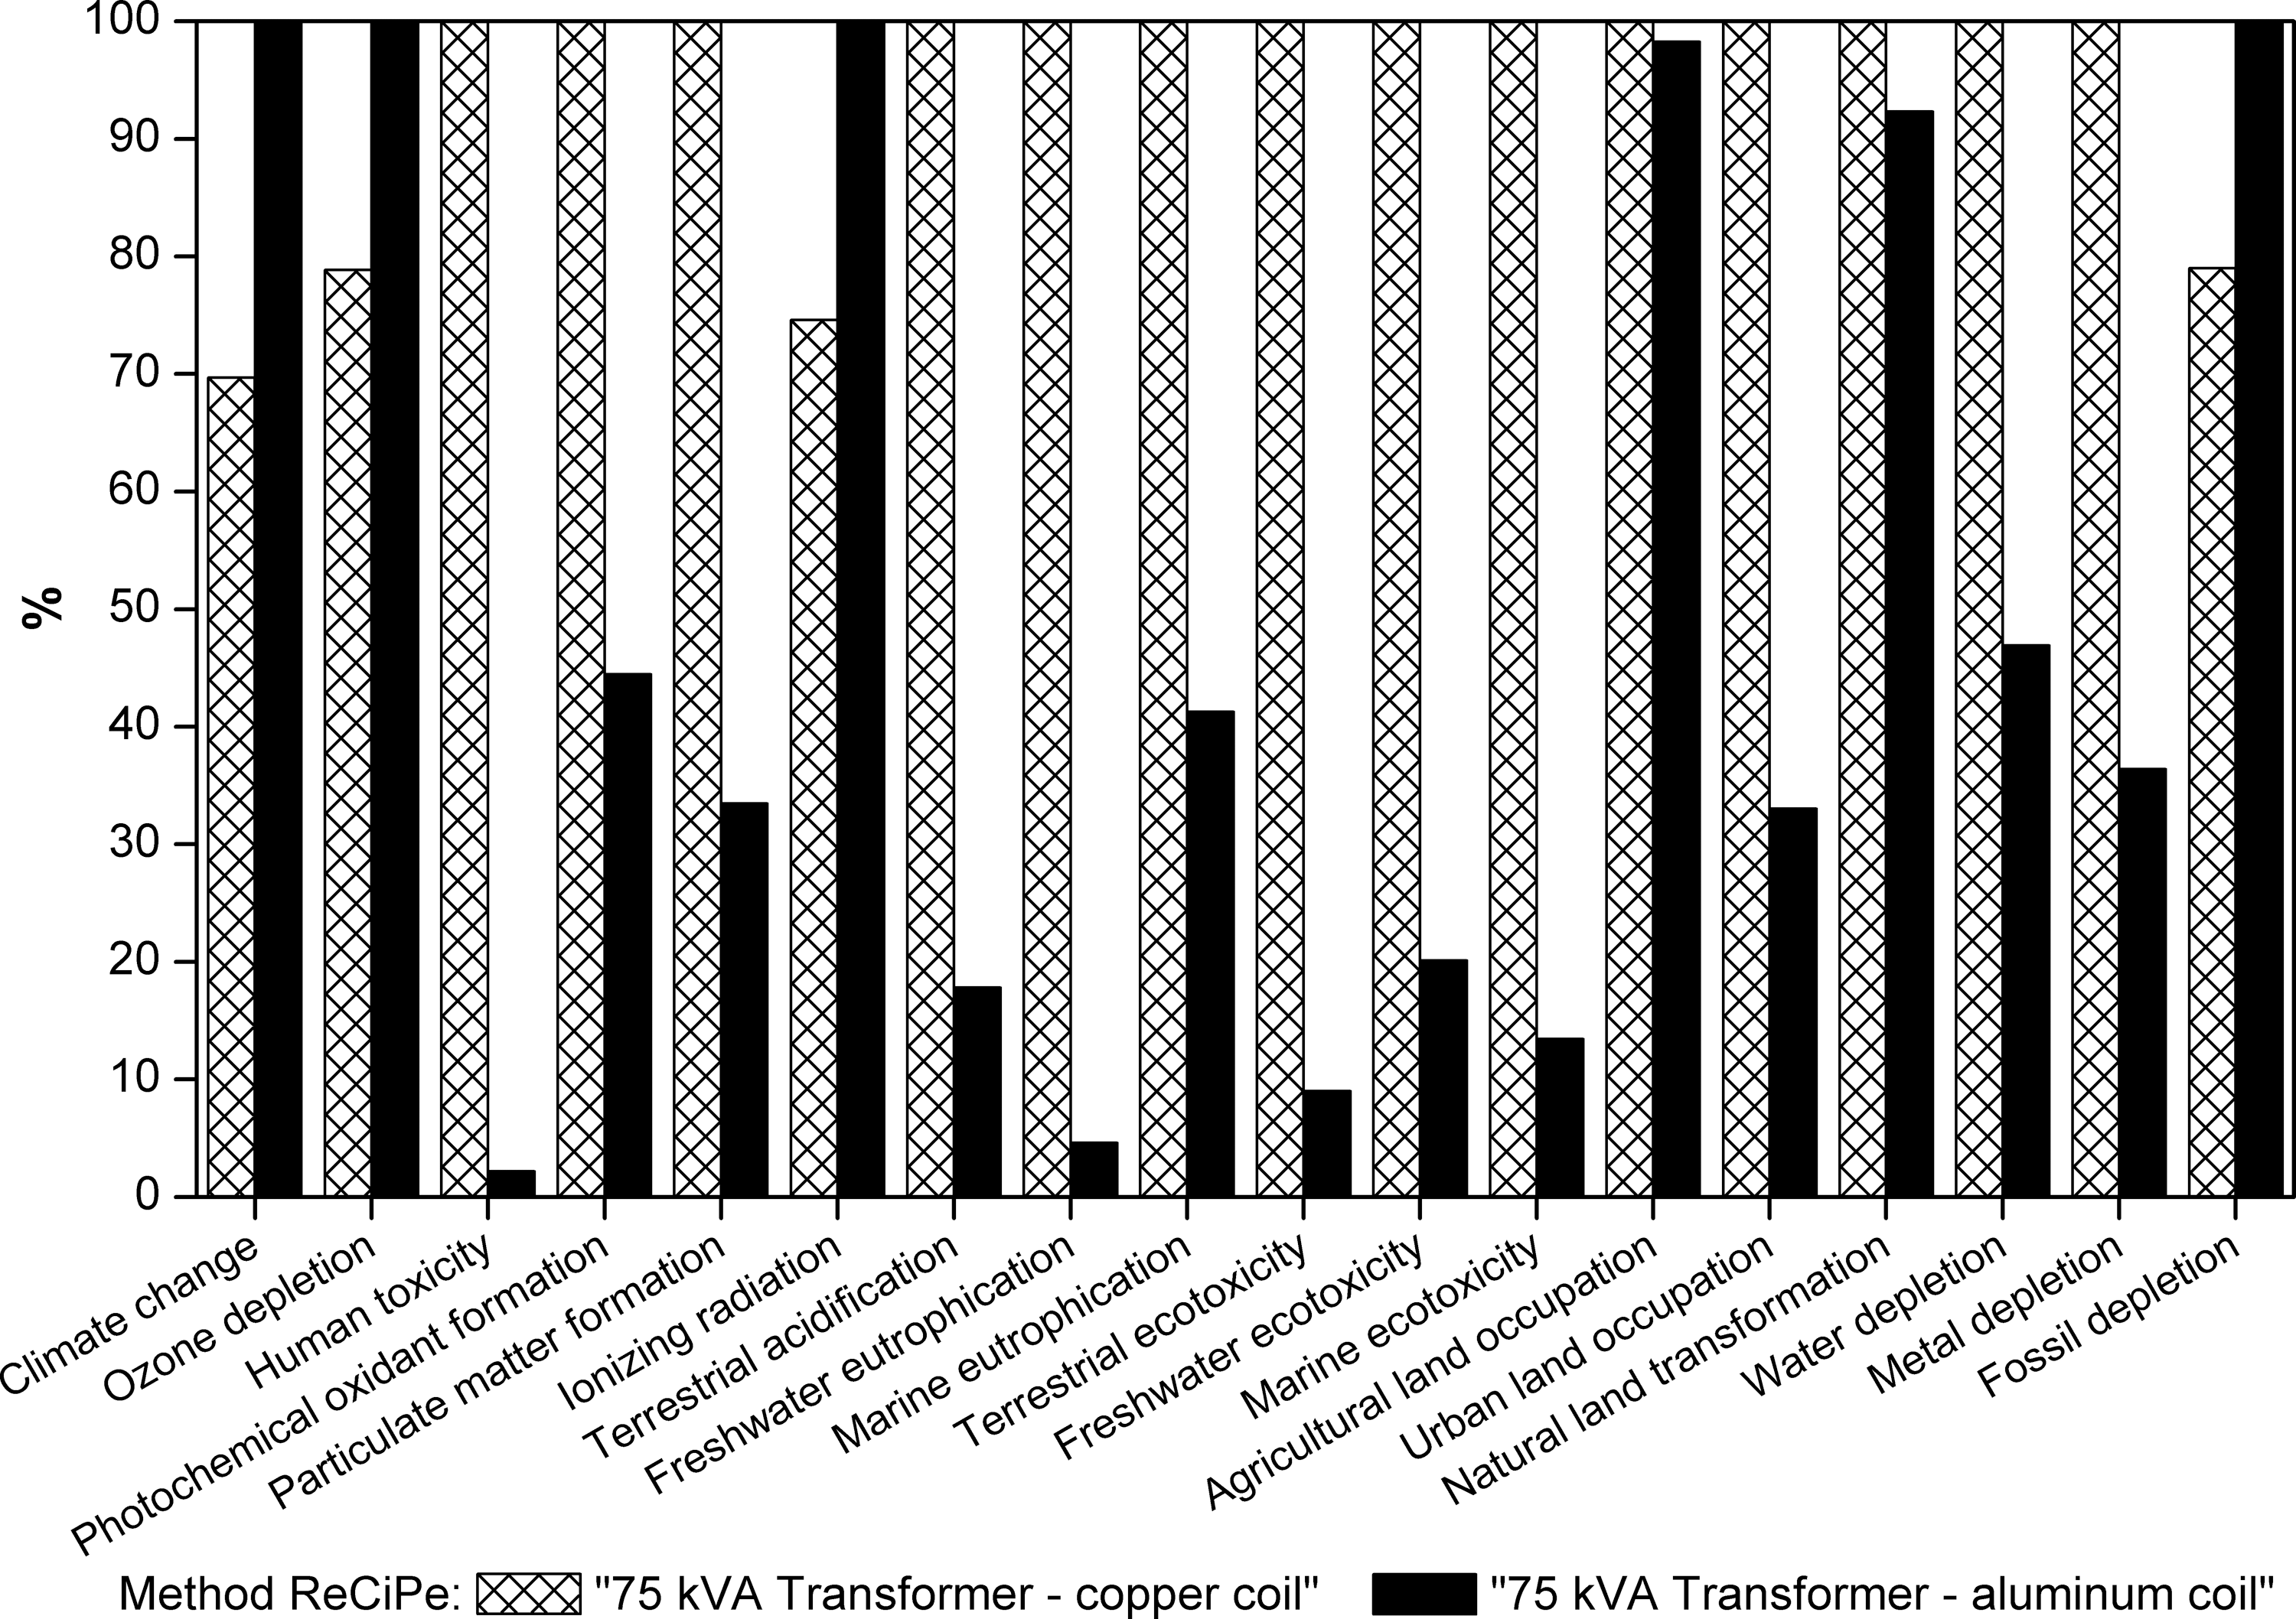
Environmental impact comparison between 75 kVA transformer—copper coil and 75 kVA transformer—aluminum coil: ReCiPe (midpoint).
Figure 4 shows that copper coil use has a higher impact contribution in most impact categories (7 of 11) in Eco-indicator 99. Aluminum coil transformer presented a higher percentage of environmental impact in climate change categories, radiation, ozone layer depletion, and fossil fuels. In those categories, copper coil transformers have an average of 26% lower impact. In other categories, aluminum coil transformer average percentage of environmental impact is ∼63% lower than copper coil transformers.
Aluminum use in coil production implies greater impacts on the emissions of greenhouse gases (climate change category). In terms of carbon dioxide equivalent (kg CO2eq), aluminum coils generated emissions in the order of 1,287.23 kg CO2eq while copper coils had emissions around 951.67 kg CO2eq, representing 26.01% more CO2 emissions for the aluminum ones.
Figure 5 shows that copper coil has a higher impact contribution in most impact categories (7 of 10) of CML 2 method. Aluminum coil transformer presented a lower impact percentage in comparison with the copper coil in all categories (around 27% less), with the exception of three, where its impact was higher—abiotic depletion, GWP, and ozone depletion potential. However, copper coil transformer has also a considerably high impact percentage in those three categories, with an average of 77.71%.
From Fig. 5, it is possible to notice that 75 kVA transformer—aluminum coil has a higher GWP compared with 75 kVA transformer—copper coil. GWP impact is 26.31% lower for copper coil transformers. However, the input that has the highest GWP in both evaluated processes is steel (Table 5). In 75 kVA transformer—copper coil, steel has 67.98% and copper 23.60% of GWP, and in 75 kVA transformer—aluminum coil, steel has 55.37% while aluminum has 37.59% impact potential. Nevertheless, the use of aluminum presents a higher percentage of greenhouse emission gases than copper, since emissions resulting from the use of steel decreased due to an increase in emissions related to aluminum.
Carbon dioxide emissions (GWP category) associated with 75 kVA transformer—aluminum coil, had a value of 1,192.53 kg CO2eq, while 878.80 kg CO2eq was emitted for the 75 kVA transformer—copper coil, resulting in 26.31% less CO2 emissions for the copper coil (Fig. 5).
Figure 6 shows that the 75 kVA transformer—copper coil, has a high impact contribution in almost all impact categories (14 of 18), according to the ReCiPe method. Aluminum coil transformers presented satisfactorily low impact percentages (<46%) in 12 impact categories when compared with the 75 kVA transformer—copper coil. Carbon dioxide emissions were similar to those obtained in the other two impact assessment methods. CO2 emissions from climate change category showed that 1,199.04 kg CO2eq and 835, 67 kg CO2eq were emitted for 75 kVA transformer—aluminum coil, and 75 kVA transformer—copper coil, respectively, resulting in 30.31% less CO2 emitted for the copper coils (Fig. 6).
Results of greenhouse gas emissions (CO2) had satisfactorily similar values in the three environmental impact methods tested (Eco-indicator 99, CML 2, and ReCiPe). High emissions of greenhouse gases attributed to aluminum coil transformers are related to the production of primary aluminum, which has a significant influence on the carbon footprint and higher emission values compared with the copper production process. However, copper presents itself as a metal with a high toxic potential due to its extraction and processing. In the LCA of Copper and Aluminum Production section, more information on the environmental impacts associated with production and use of copper and aluminum and with GWP and toxicity categories is presented.
Table 7 shows the three methods' normalized results and ratifies the potential for copper toxicity. In all impact categories, copper coils presented greater environmental impacts, mostly associated with toxicological effects.
Main Results Based on Eco-Indicator, CML 2, and ReCiPe Methods (Midpoint Approach with Normalization)
DALY, disability-adjusted life years.
Analyzing Figs. 4–6, it is possible to calculate the mean percentage increase in the environmental impact of copper use in relation to aluminum according to Eco-indicator 99, CML 2, and ReCiPe methods, respectively. The results showed that this increase is 30.91%, 50.74%, and 44.94%, respectively, and the overall mean between the three methods is 44.20%.
LCA of copper and aluminum production
All impact assessment methods have shown that copper coil transformers have high toxicological impact potential, while aluminum coil transformers have high greenhouse gas emissions. These results are directly related to the coil metal production process. The main steps considered in copper production are metal accumulation (copper concentrate), solvent extraction/electrowinning (SX-EW) process, and copper primary production; the main steps considered in aluminum production are bauxite mining, aluminum hydroxide production, aluminum oxide production, aluminum fluoride production, liquid aluminum production, and aluminum primary production. Copper and aluminum production inventory data were obtained through the SimaPro® database and are available in Appendices 1 and 2, respectively.
Table 8 shows the energy requirement for each step of copper and aluminum production according to the metal mass needed. Aluminum oxide, aluminum hydroxide, and liquid aluminum production are the most important factors related to energy requirement by the aluminum industry due to the different forms of energy used, such as natural gas, hard coal, fuel oil and, mainly, electricity.
Energy Consumption in Each Step of Copper and Aluminum Production
1.0 kWh = 3.6 MJ.
SX-EW, solvent extraction/electrowinning.
Total energy requirement for aluminum production is significantly higher than for copper production. In addition, the levels of greenhouse gases emitted by aluminum production are very high due to the energy consumption involved in its production. These results are similar to the ones obtained by Guan et al. (2013) and Abdulkadir et al. (2015). Alumina (aluminum oxide) conversion into primary aluminum (liquid) is an energy-intensive process, especially due to high electricity consumption, which is ∼74% of the total energy required (Table 8), as also stated by Tsakiridis et al. (2013) and Rebitzer and Buxmann (2005).
Green (2007) reported that the energy requirement for aluminum primary production is about 174–186 and 10–20 MJ/kg for secondary production. Primary copper production requires between 30 and 90 MJ/kg (Ren et al., 2011), while for secondary production is between 4.2 and 12.6 MJ/kg, with an average value of 8.4 MJ/kg (Elshkaki et al., 2016). In this study, the energy requirement per kilogram of primary copper and primary aluminum was 22.8 and 75.7 MJ/kg, respectively. Decreases in energy requirement were associated with better operational practices such as renewable energy use for energy production (e.g., electricity generation), waste energy reuse, and lower energy demand during processes. According to Sheng-Qiang et al. (2012), Ciacci et al. (2014), and Paraskevas et al. (2016), substitution of conventional energies by alternative energies in copper production and, mainly, in aluminum production process is an alternative for the reduction of energy requirement and greenhouse effect gases.
High toxicological potential associated with the use of copper is due to the significant presence of heavy metals in emissions and effluents. Copper extraction considered is the one where the metal is extracted from oxide ores through a hydrometallurgical process referred to as an SX-EW. This extraction process is increasing its use due to environmentally friendly aspects (Wang et al., 2015), while, on the contrary, it requires a relatively high amount of energy when compared with the other two technologies available (Kuipers et al., 2018).
Figure 7 shows the total emissions of heavy metals for production of 71.5 kg of copper. Heavy metals emitted are antimony, arsenic, cadmium, chromium, nickel, zinc, and mercury, mainly in the steps of copper accumulation (copper concentrate) and copper primary production. The copper accumulation step during production emits considerable amounts of zinc and chromium into the atmosphere (Fig. 7A). In addition, zinc, nickel, arsenic, and, in smaller amounts, mercury are discarded as liquid effluent. The copper primary production step also generates emissions of heavy metals such as nickel, arsenic, zinc, cadmium, and antimony (Fig. 7B). The presence of heavy metals in the aquatic environment and on the atmosphere showed high toxicological potential, even if in small amounts. This result is in accordance with Theophanides and Anastassapoulou (2002), Beylot and Villeneuve (2017), and Woon and Lo (2014), which found out that the leaching procedure into groundwater during copper production has great potential for releasing carcinogenic substances that cause serious damage to human health.

Total heavy metal emission:
Potential impacts related to copper accumulation and tailing disposal mainly depend on the actual conditions of tailing management, and specifically on the parameters determining the leaching of heavy metals. In this context, improving the recovery rate of metals from the initial ore, and potentially from the tailings, is a fundamental issue for the toxicity-related environmental performances of copper production in a life cycle perspective.
Several studies proved the great toxicological impact of using copper. Copper use is treated as an input with high toxicological potential in several production processes, from wind turbine construction (Martinez et al., 2009) and electric vehicles (Nordelöf et al., 2014) to underground cables (Jones and McManus, 2010). The environmental assessment methods used in this study obtained similar results, showing a higher toxicity potential for copper in comparison with aluminum. Based on the previously mentioned literature and the results obtained, it may be possible to reduce environmental impacts associated with transformer manufacturing by replacing the use of copper with aluminum.
Conclusion
An LCA was performed to analyze copper and aluminum coil transformer manufacturing, using SimaPro software and Eco-indicator 99, CML 2, and ReCiPe methods for environmental assessment.
Major impacts associated with aluminum coils are related to GWP due to its production process, requiring more energy in comparison with copper coils. Nevertheless, copper coils have a major potential for terrestrial and marine environment contamination, along with harmful effects on human health due to toxicological substances released in their production. Copper coil use in transformer manufacturing has shown greater environmental impact in all impact assessment methods, with an average percentage increase of 42.20% in most impact categories when compared with aluminum. Ultimately, production of 75 kVA aluminum coil transformers is more appropriate due to environmental impact mitigation.
In addition, this study creates a database about process manufacturing of electric distribution transformers according to their power distribution capacity and the type of coil used, making it possible for transformer manufacturers and energy concessionaires to use the results obtained as an auxiliary tool for decision-making.
Footnotes
Acknowledgment
The authors thank the Coordination for the Improvement of Higher Education Personnel (CAPES) for the research incentive and financial support.
Author Disclosure Statement
No competing financial interests exist.
Appendix
Inventory data are from the SimaPro® software database.