
Abstract
Abstract
Hydraulic fracturing has become a well-established and widespread technology for the extraction of oil and natural gas. Hydraulic fracturing fluids (HFFs) are widely varied and contain many chemicals that are toxic to human and ecological health. HFFs are often spilled on surface soils where their fate and transport is uncertain. In this study, six representative mixtures of HFFs were incubated with a surface soil in bench-scale microcosms, and the microbial community was analyzed over 78 days. Chemical oxygen demand decreased over time, although a significant recalcitrant fraction was found for four of the six amended fluids. With Illumina MiSeq sequencing of a 16S ribosomal RNA (rRNA) gene amplification and follow-through quantitative polymerase chain reaction (qPCR) assays, 24 bacterial taxa closely related to known species were identified to be enriched by at least one of the representative HFFs. These taxa are mostly closely related to well-known xenobiotic degraders, however, the composition of the enrichment was highly unique for each representative HFF. Results indicate that the complex mixtures of biocides and other components elicit unique bacterial community responses in the same soil, thus suggesting that the bioremediation pathways of HFF constituents in soils may differ based on exact HFF composition.
Introduction
E
Unique environmental concerns exist with hydraulic fracturing. HFFs have the potential to contaminate soil and shallow aquifers from spills, leaky well casings, and migration of chemicals from the extraction reservoir into shallow groundwater (United States Environmental Protection Agency [USEPA], 2012; Vengosh et al., 2014; Wilson et al., 2017). After the hydraulic fracturing and well completion process, the handling, transportation, and storage of flowback waters, which contains a mixture of HFFs and formation waters (i.e., Orem et al., 2014), can also lead to contamination of surface soils and groundwater resources (Shrestha et al., 2017). Surface contamination of HFFs and flowback waters is a large concern and is common (United States Environmental Protection Agency [USEPA], 2012; Torres et al., 2016). A database in North Dakota documented almost 8,000 spills of oil, brine, and other chemicals between 2000 and 2013 from oil and gas production activities (Cwiak et al., 2015). Similarly, the Colorado Oil and Gas Conservation Commission (COGCC, 2018) has documented 618 spills and releases related to oil and gas production in 2017 alone.
Assessing the environmental impacts of hydraulic fracturing is complicated by the fact that compositions of HFFs are often not disclosed, and even when disclosure is practiced (i.e., FracFocus; Groundwater Protection Council [GWPC], 2014) many proprietary ingredients are still withheld. The compositions of HFFs generally consists of a mixture of biocides, surfactants, friction reducers, corrosion control additives, crosslinking agents, breakers, and other additives to assist in the extraction process (Groundwater Protection Council [GWPC], 2014). HFFs contain a significant number of chemicals of known toxicity and/or carcinogenicity, posing threats to the health and safety of oil field workers and the public (Colborn et al., 2011; Stringfellow et al., 2014; Elliot et al., 2017). The toxicity of individual components is also likely amplified due to synergistic effects with other chemicals; for example, the cytotoxicity of 2,2-dibromo-3-nitrilopropionamide, a common biocide used in HFFs, is amplified under the copresence of ethanol, which is also commonly used in HFFs (Ishikawa et al., 2016).
In the cases of spills and other accidental releases, degradation of HFFs is important to protect human health. The biodegradation of HFFs are not well studied, and the diverse formulations of unique HFFs used in the industry poses challenges to establish any baseline understanding for how biodegradable HFFs are in the environment. In a study of the biodegradation of the HFF components, glutaraldehyde, poly(ethylene glycol), and polyacrylamide in an agricultural soil, glutaraldehyde and poly(ethylene glycol), but not polyacrylamide, were degraded (McLaughlin et al., 2016). The aforementioned study was limited in that components were studied in combinations of each other, but not in more complex fluid mixtures. A study has also found that the amount of the biocide glutaraldehyde adversely affects the degradation of a representative HFF consisting of 2-propanol, ethylene glycol, propargyl alcohol, 2-butoxyethanol, and 2-ethylhexanol (Rogers et al., 2017). The microbial community was not analyzed in those studies.
Identifying the specific bacterial community members that are enriched in soils from HFF exposures is important to understand the biodegradability of these complex mixtures. Furthermore, bacterial community members enriched upon contamination by HFFs could be targets for biomarker assays to detect HFF contamination in the environment. Such biomarker taxa are being evaluated to quantify the impact from hydraulic fracturing activities on streams (Ulrich et al., 2018) and in groundwater systems (Santos et al., 2017). A few studies have started identifying key taxa that are associated with HFF degradation. One study found that the common HFF surfactants alkyl ethoxylates, nonylphenol ethoxylates, and, to a lesser degree, polypropylene glycols degraded in soils anaerobically with an increase of the diol dehydratase gene cluster in Firmicutes (Heyob et al., 2017). The biodegradation of a synthetic HFF representative of those used in Marcellus shale wells in Pennsylvania was investigated using an activated sludge from a municipal wastewater treatment plant and found substantial organic carbon degradation within 4 days with a dominance of Pseudomonadaceae (Kekacs et al., 2015). Another study investigated the degradation of the same HFF in soils and found an enrichment primarily of Pseudomonas, Cellvibrio, and Clostridiales under aerobic conditions, and found an enrichment of Desulfovibrio under anaerobic conditions (Mouser et al., 2016). It is not clear, however, how commonly these organisms are enriched among the diversity of HFF formulations used.
In this study, the effect of six representative HFFs on a surface soil microbial community was studied in bench-scale microcosms at average concentrations reportedly used for hydraulic fracturing operations. The primary focus of this study was to identify and compare the bacterial community enriched upon the degradation of HFFs to better understand the degradation of these complex and widely varied mixtures of chemicals.
Methods
Preparation and sampling of microcosms
Public reports of HFF compositions that were used at 73 wells in Payne County, OK from January 2013 to May 2014 were obtained from FracFocus (Groundwater Protection Council [GWPC], 2014). Although a wide variation of compositions existed well to well, six major compositional types were found to recur. The average concentrations and standard deviations of the commonly used constituents within each HFF type are reported in Supplementary Tables S1–S6. These concentrations refer to the injection concentrations used at the well. For microcosm studies, representative HFF mixtures, referred herein as Fluids A–F, were prepared based on the average concentrations of the common constituents as tabulated in Table 1. HFF constituents were added to a standard basal salts medium similar to that described in Löffler et al. (2005) with the exception that reductants were not added. The basal salts medium contained (per L) 1,000 mg NaCl, 500 mg MgCl2*6H2O, 200 mg KH2PO4, 300 mg NH4Cl, 300 mg KCl, 15 mg CaCl2*2H2O, and 1 mL of trace element solutions “A” and “B” (Löffler et al., 2005). The pH was adjusted to 7.2 with HCl or NaOH.
Constituents of Six Representative Hydraulic Fracturing Fluids Used in This Study (Concentrations in mg/L)
Amended for listings of chlorine dioxide.
Amended for listings of poly(oxy-1,2-ethanediyl, alpha-(4-nonylphenol)-omega-hydroxy, branched.
Amended for listings of secondary ethoxylated alcohols.
Amended for listings of poly(oxy-1,2-ethanediyl) alpha-isotridecyl-w-hydroxy.
Amended for listings of polyalkylene glycol.
In Fluid E, methanol is listed explicitly as the biocide.
Acidizing agents, friction reducers, gelling agents, iron control, crosslinking agents, and miscellaneous additives.
Amended for listings of petroleum distillates and related crude oil derived products.
Amended for listing of sorbitan monoleate.
Pure chemicals were used for most constituents. Some added constituents in Fluids A–F have differences to the HFFs used in the field. 10W-30 motor oil was used as a substitute for items listed as “petroleum distillates,” “heavy aromatic petroleum,” “tar bases,” and closely related terms. Tergitol® NP-7 was used for nonylphenol ethoxylates, Tergitol 15-S-40 was used for secondary ethoxylated alcohols, and Genapol® X-080 was used for Poly(oxy-1,2-ethanediyl),alpha-isotridecyl-w-hydroxy. Items listed as proprietary ingredients were not added as their identities are not known, sand was not added which is used as a proppant, and the high concentrations of hydrochloric acid reported were not added. Hydrochloric acid is typically used during discrete stages of a multistage hydraulic fracturing operation and not typically directly mixed with the other HFF constituents (Arthur et al., 2009). The compositions are thus not exact HFFs but do represent different mixtures of biocides, surfactants, corrosion inhibitors, and other components used in the hydraulic fracturing process.
Microcosms composed of 250-mL Erlenmeyer flasks with glass wool stoppers. Each flask was filled with 100 cm3 of homogenized soil (120 g by dry weight; soil moisture content of 28%) collected from the top 5 cm of a sandy clay loam soil (O- and A-horizons) from an undeveloped oak-pecan forest in Payne County, OK. Fluids were added up to the 150 mL mark of the flask. Microcosms were incubated statically in the dark at room temperature and deionized (DI) water was added weekly to the 150 mL mark of each flask to replace evaporative losses before sampling. Microcosms with the six fluids and the control, amended with the basal salts solution only, were operated in triplicate.
Samples for chemical and microbial analysis were collected on days 0, 6, 13, 20, 30, 41, 52, 64, and 78. Dissolved oxygen (DO) was measured with a YSI 5100 DO meter (Cole-Parmer, Vernon Hills, IL) and the pH was measured with a SevenCompact pH probe (Mettler Toledo, Columbus, OH). For chemical oxygen demand (COD) analysis, 1 mL of supernatant was collected with glass Pasteur pipettes and analyzed with the Hach COD Test Kit and DR 5000 spectrophotometer (HACH, Loveland, CO). For DNA extraction, ∼0.5 g of stirred sediment was sampled with a scoopula, weighed, and extracted with the PowerSoil DNA Isolation Kit (MoBio Laboratories, Carlsbad, CA). Concentrations of extracted DNA were determined with the QuantiFluor double-stranded DNA (dsDNA) System (Promega, Madison, WI).
Microbial community analysis
For Automated Ribosomal Intergenic Spacer Analysis (ARISA), the interspacer region between the 16S and 23S regions of the ribosomal RNA (rRNA) genes were amplified with polymerase chain reaction (PCR). Each PCR reaction (25 μL) contained 1 μL of DNA extract, 1.0 mM of MgCl2, 1 × DNA GoTaq buffer (Promega), 1 μg of bovine serum albumin (BSA), 1.6 mM of dNTPs, 0.25 μM each of 6-FAM-ITSF and ITS-ReubR primers (Cardinale et al., 2004), and 0.625 U of GoTaq DNA polymerase (Promega). PCR was performed in a T100 Thermal Cycler (Bio-Rad Laboratories, Hercules, CA) with thermocycling conditions described previously (McNamara and Krzmarzick, 2013). Each DNA extract was amplified in triplicate, and triplicate amplifications were combined in equal volumes. Combined amplifications were mixed with MapMarker1000 (with ROX) fragment size standard (BioVentures, Boston, MA), denatured with HiDi Formamide (Life Technologies, Grand Island, NY), and submitted to the DNA/Protein Core Facility at Oklahoma State University for fragment size analysis on an ABI Model 3730 DNA Analyzer (Applied Biosystems, Foster City, CA). ARISA fragment data were analyzed with Peak Scanner v1.0 software (Life Technologies). The bp sizes and the peak areas were transferred to an Excel worksheet. Fragment sizes that were smaller than 50 bp and larger than 1,000 bp were discarded, as were peaks with areas <0.5% of the total peak area of the sample. Non-metric multidimensional scaling (NMDS) analysis of the ARISA dataset was performed using the VEGAN package in R (Oksanen et al., 2014).
DNA extracts from day 30 and 64 were also analyzed through Illumina sequencing of 16S rRNA gene amplicons as described previously (Lim et al., 2018). Portions of the DNA extracts from triplicate microcosms were combined into single composite DNA samples for each set of triplicate microcosms. These composite extracts and the DNA extract of the original soil inoculum were submitted to Molecular Research LP (i.e., MR DNA, Shallowater, TX) for PCR amplification of 16S rRNA genes with primers 27F (5′-AGAGTTTGATCMTGGCTCAG-3′) and 519R (5′-GWATTACCGCGGCKGCTG-3′) and bTEFAP© Illumina MiSeq 2 × 300 bp barcoded amplicon sequencing (Dowd et al., 2008). Sequence data were analyzed with the MR DNA analysis pipeline consisting of the joining of sequences, depletion of barcodes, and quality control steps, including the removal of sequences with ambiguous base calls, removal of sequences less than 150 bp long, and removal of chimera sequences detected with UCHIME (Edgar et al., 2011). Sequences were denoised and operational taxonomical units (OTUs) were delineated at a 97% identity level with UCLUST (Edgar, 2010). Taxonomical classification was performed using BLASTn against the Ribosomal Database Project (RDP) and NCBI databases. The total number of final reads varied from 16,931 to 105,497 per sample.
Dendrogram and heatmap analysis was performed with the HEATMAP3 function in R (Zhao et al., 2015). The heatmap analysis was performed for the top 32 Orders in the dataset, representing 92.7–99.6% of the reads for each sample. Relative read depths were log-normalized and subtracted from the log-transformed relative read depth of the original soil inoculum. This calculated value, used in dendrogram and heatmap analysis, is thus the log unit difference of the relative read depth of each Order between the sample and the original soil inoculum. Heatmap plotting was not rescaled in R, and thus the plot and scale bar represent this log-scale difference.
Because the Illumina sequencing was performed on composite DNA samples, the dataset did not indicate reproducibility between triplicate microcosms. Additionally, because the method sequenced a PCR amplification of 16S rRNA genes with universal primers, strong PCR biases were likely introduced, which obscure true taxa quantification, as observed previously (i.e., Lim et al., 2018). Thus, quantitative PCR (qPCR) assays were used to determine quantification of specific bacteria groups, primarily at the genus level, from each DNA sample. The Illumina sequencing data were used to identify the enriched OTUs from the fluid-amended microcosms compared with the control microcosms at days 30 and 64. OTUs were identified that were at least 0.1% of the relative read depth and which were greater than 50 × higher in relative read depth in a fluid-amended microcosm sample compared with the control microcosm sample at each date, similarly to that described previously (Lim et al., 2018). Illumina sequencing results are detailed in the Supplementary Data (Supplementary Tables S7–S12 and Supplementary Fig. S3). These OTUs were analyzed phylogenetically, and further analysis with qPCR assays were limited to the OTUs that were closely related to bacteria strains (>97% identity) previously isolated by others (additional information on qPCR assay development is provided in the Supplementary Data; Supplementary Figs. S4 and S5).
The phylogenetic targets, primers used, amplicon lengths, and standard curve information (efficiency, R2, and linear range) for qPCR methodologies are reported in Supplementary Table S13. Novel primer sets were designed for the qPCR assays, except the primers targeting Comamonadaceae (Jiang et al., 2015) and Azospirillum (Lin et al., 2011). Each qPCR reaction (10 μL) consisted of 1 × iTaq SyberGreen Supermix with ROX (Bio-Rad Laboratories), 10 μg BSA, 300 nM of each forward and reverse primer, and 0.5 ng of DNA extract. Analysis was performed on a CFX Connect Real-Time System (Bio-Rad Laboratories) with a thermal cycling protocol of 95°C for 3 min followed by 40 cycles of 95°C for 15 s and an annealing temperature of 59°C for 30 s. Quantitative standards were produced from cloned amplicons from each respective qPCR assay as previously described (Lim et al., 2018). DNA extracts from each sampling date and microcosm were analyzed by each qPCR assay in duplicate. Duplicate qPCR analysis was averaged for each sample, and averages and standard deviations between triplicate microcosms are reported. For each qPCR assay, data are shown for microcosms showing a statistically significant enrichment over the control microcosms for at least one time point (Student t-test, p < 0.05).
Accession numbers
Illumina MiSeq data are available from NCBI under Bioproject PRJNA326398.
Results
Compositions of HFFs
Six major types of HFFs were identified from FracFocus data that represented 68 of 73 wells analyzed. The remaining five wells each had unique formulations. The compositions of these HFFs (Supplementary Tables S1–S6) and the representative HFFs used in this study (Table 1) contained unique combinations of surfactants, corrosion inhibitors, crosslinking agents, biocides, and other additives.
HFFs usually contain one or more biocides to control bacteria-caused corrosion and the production of hydrogen sulfide gas (Kahrilas et al., 2014). Fluids A, B, and F contained the listed biocide chlorine dioxide; Fluids C and D contained the biocide 2,2-dibromo-3-nitrilopropionamide with a polyethylene glycol additive; and Fluid E simply used methanol for the listed biocide. The chemicals 2,2-dibromo-3-nitrilopropionamide and chlorine dioxide have been identified as the second and fifth most used biocides reported on FracFocus (Kahrilas et al., 2014). Many other chemicals in the mixtures also act as biocides, although their stated purpose may be otherwise (i.e., glutaraldehyde, surfactants) (Song and Bielefeldt, 2012).
Fluids A, B, and C also contained high amounts of surfactants. Fluid A used nonylphenol ethoxylates, secondary ethoxylated alcohols, ethanol, 1,2,4-trimethylbenzene, and naphthalene. Fluid B also contained nonylphenol ethoxylates, but also used polyethylene glycol ether, 2-ethylhexanol, and dodecylbenzenesulfonic acid. Similarly, Fluid C contained 2-ethylhexanol, dodecylbenzenesulfonic acid, and polyethylene glycol ether, but did not contain nonylphenol ethoxylates and did contain polyalkylene glycol. Fluids A, B, D, and F all contained various alcohols for corrosion inhibitors. Fluids A, D, E, and F contained petroleum distillates (amended as motor oil) for various stated purposes. Fluids A, B, D, and F contained various organic acids, such as formic and/or citric acid, and Fluid A contained the crosslinking agent perborate tetrahydrate.
COD, pH, and DO of microcosms
The bulk characteristics of COD, pH, DO were monitored over 78 days. The change in the bulk COD of the water column for the microcosms is shown in Fig. 1. The highest initial COD was found in Fluids A and B, whereas the least initial COD values were found in Fluids D, E, and F. The microcosms amended with Fluids A and F degraded on average 67% and 48%, respectively, of the initial COD within the first 6 days, after which only an additional 7% and 11%, respectively, degraded by day 78. The COD in the other fluids and in the control was degraded more evenly over time. For Fluids B, C, D, and E, total COD degradation by day 78 was on average 89, 39, 51 and 54%, respectively. In all cases, significant further degradation was not observed after day 52. The control, containing only COD from the basal salts medium (specifically ammonia) and soil, contained an average COD of 660 mg/L on day 0 and 412 mg/L on day 78. Microcosms with Fluids A, C, D, and E still contained a statistically significant higher COD compared with control microcosms on day 78 (p < 0.05, Student t-test). Variations in the COD analysis may have been introduced due to imprecise methods to account for evaporative losses.

COD measurements of microcosms over the course of the experiment. Shown is average and standard deviations of triplicate microcosms amended with Fluid A (triangles, yellow), B (circles, brown), C (dashes, gray), D (squares, purple), E (diamonds, blue), F (stars, red), and the control (open squares, green). COD, chemical oxygen demand.
The DO in the water column in the microcosms remained at aerobic levels (DO >2.0 mg/L) with the exception of the microcosms amended with Fluid F, which had DO dip to an average of 1.42 mg/L at day 20 (Supplementary Fig. S1). For all but the microcosms amended with Fluid B, the pH increased from a starting pH of 7.2 to a peak of 8.0 ± 0.1 by day 41, and then decreased to a final pH of 7.6 ± 0.1 (Supplementary Fig. S2). Two of the three microcosms amended with Fluid B contained a lower pH (a range of 6.7–7.4) during the first 20 days compared with the rest of the microcosms, and all three microcosms amended with Fluid B finished with a significantly higher pH (8.1 ± 0.1) compared with the rest of the microcosms.
Differences in bacterial community structure
Overall microbial community structure was analyzed with ARISA. The NMDS analysis of the ARISA data is shown in Fig. 2. This analysis indicates that the microbial communities amended with Fluids A, B, and C diverged prominently and uniquely at 30 days of incubation. The microbial community from Fluid D-amended microcosms differed from the control only after day 30, whereas the microbial communities from Fluid E- and F-amended microcosms did not clearly show a delineation from the control throughout the experiment in this analysis.
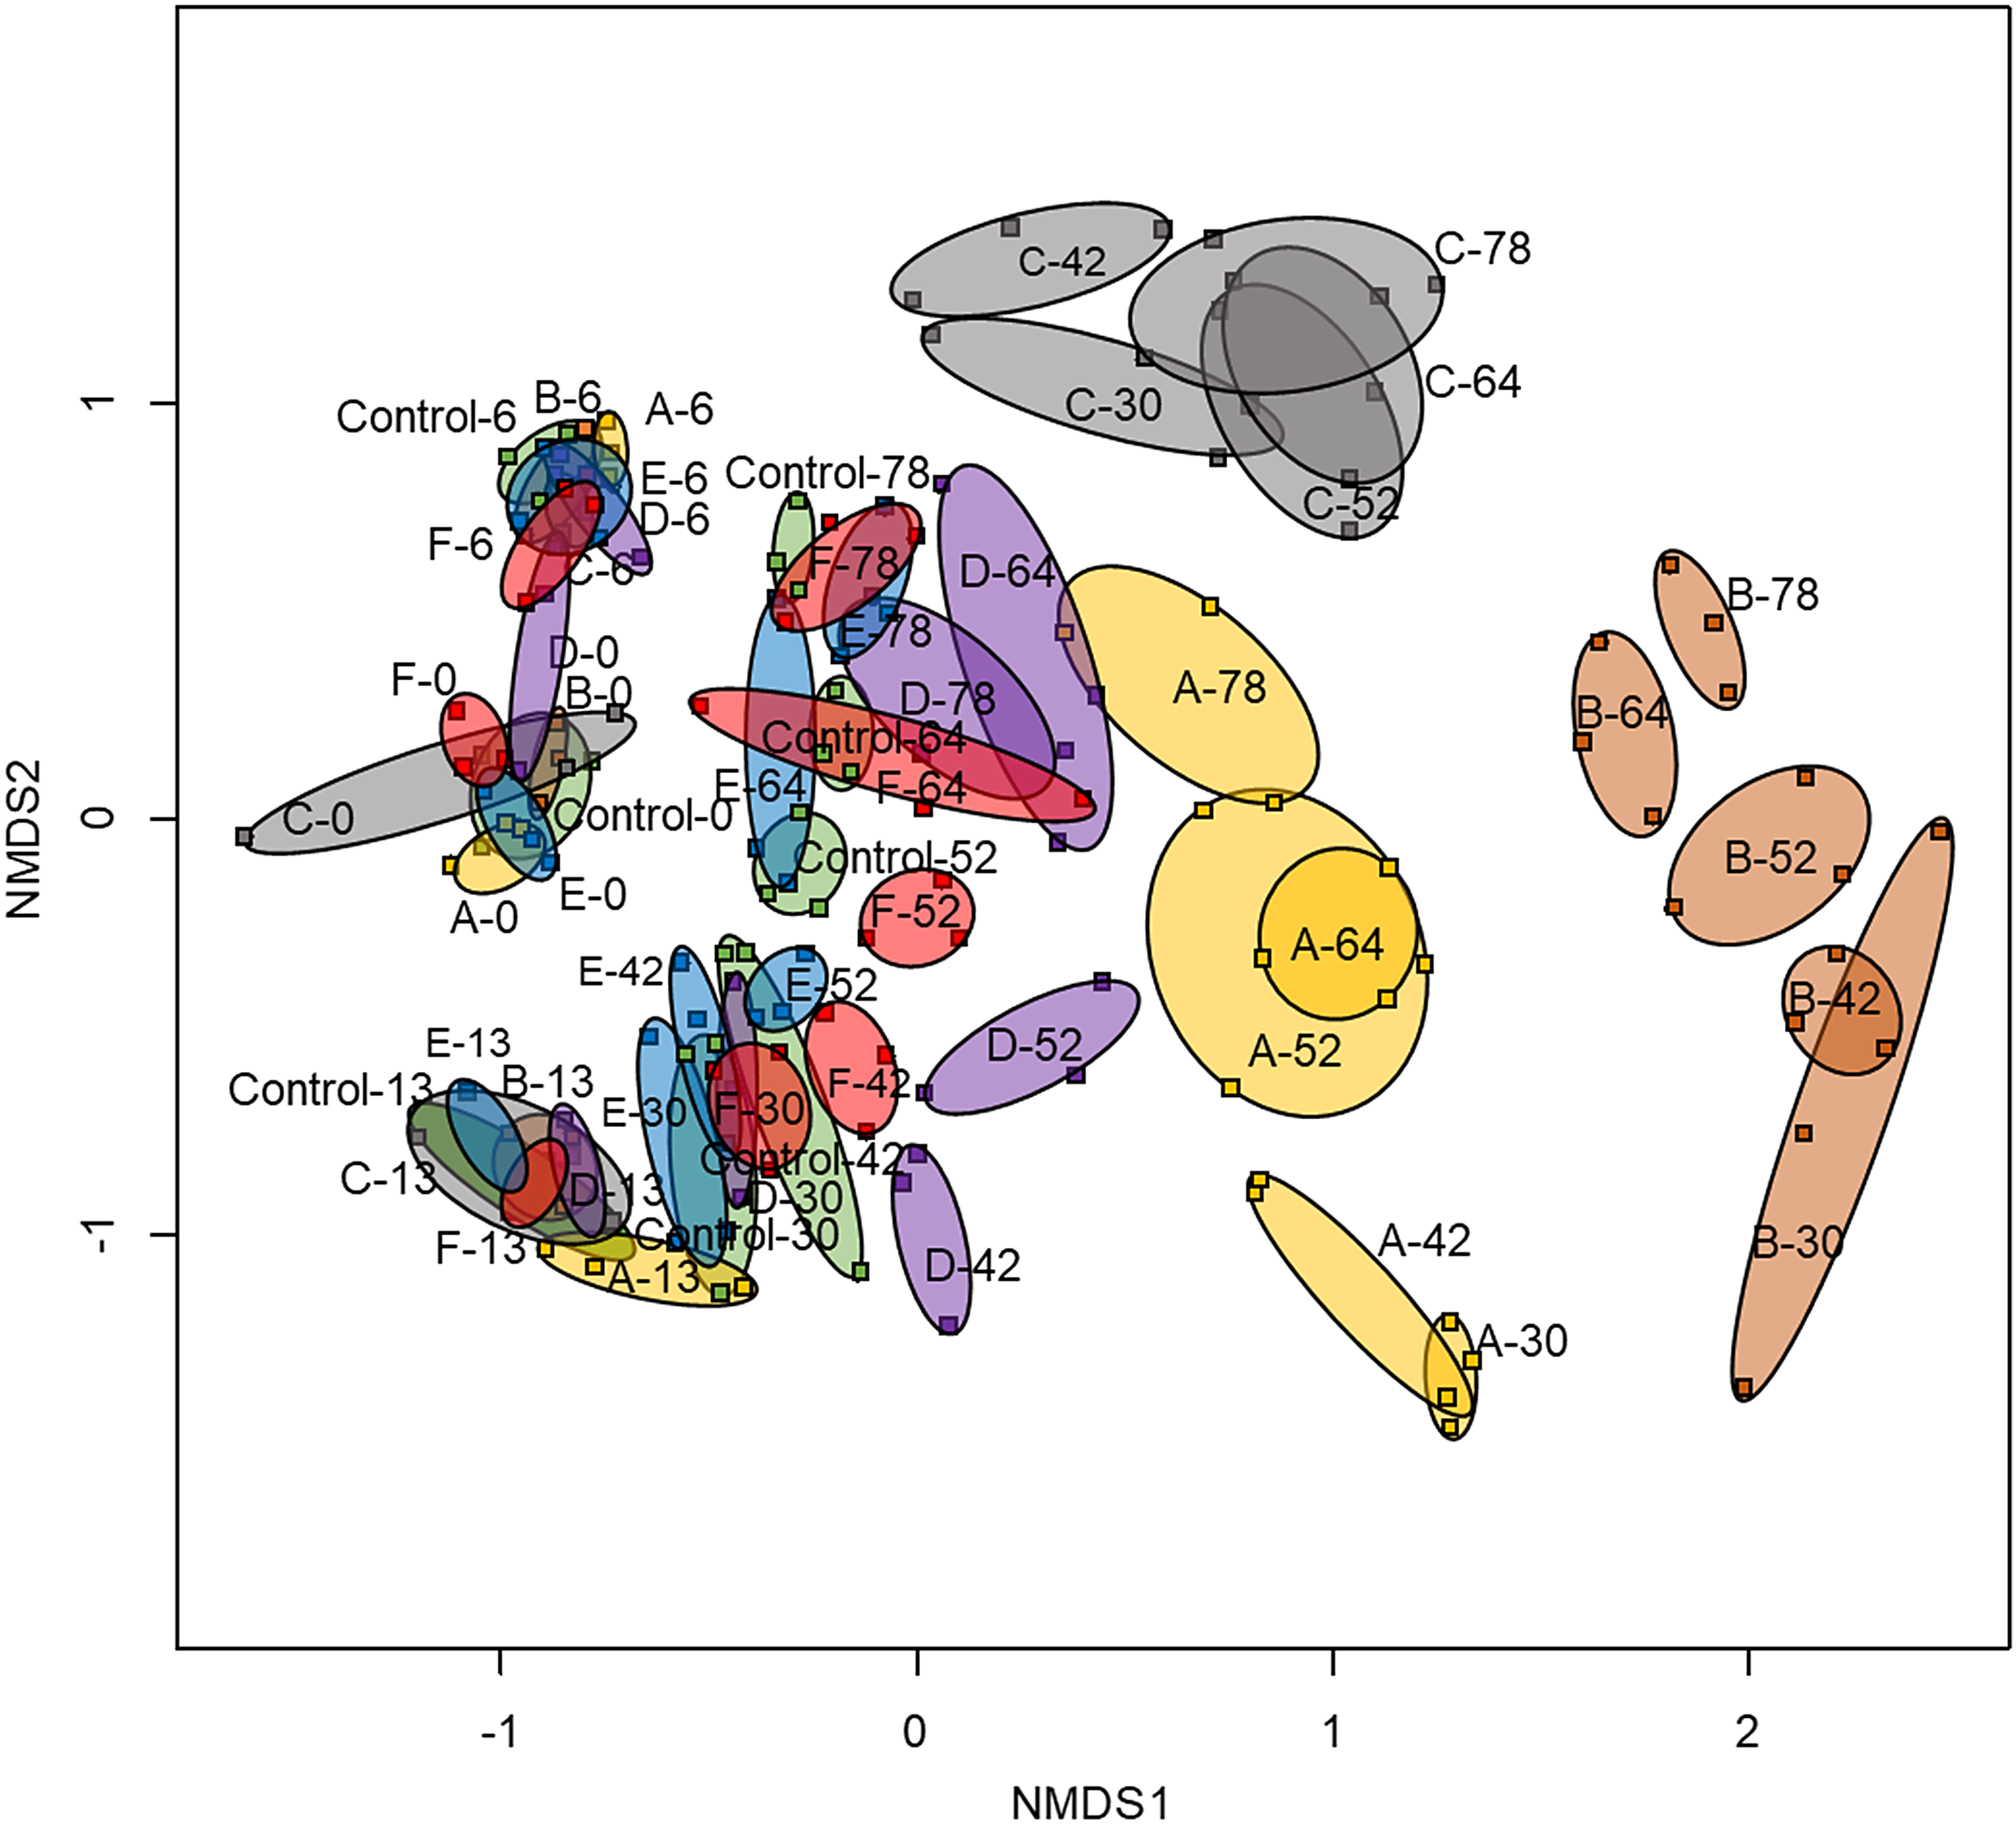
The NMDS analysis of the ARISA data set. Labels refer to fluid amended and sampling date. Each sample is indicated with a small square and samples from triplicate microcosms for each fluid and sample date are connected by colored ovals and labeled (Fluid A [yellow], B [brown], C [gray], D [purple], E [blue], F [red], and the control [green]). ARISA, Automated Ribosomal Intergenic Spacer Analysis.
The original soil sample and composite DNA samples derived from the triplicate microcosms on days 30 and 64 were analyzed through Illumina sequencing of 16S rRNA gene amplifications. From this sequencing, a dendrogram and heatmap analysis at the phylogenetic Order level is shown in Fig. 3. As can be seen from the control microcosms, the community shifted largely from background conditions. On day 30, the dendrogram indicates that the microbial community amended with Fluids B and C differed the most, whereas the Fluid E-amended microcosm was most similar to the control. By day 64, microcosms with Fluids A, D, E, and F were more similar to each other than the control; however, altogether, these samples clustered distinctly from the day 30 samples. The Fluid B- and C-amended microcosms on day 64 clustered with their respective day 30 samples.
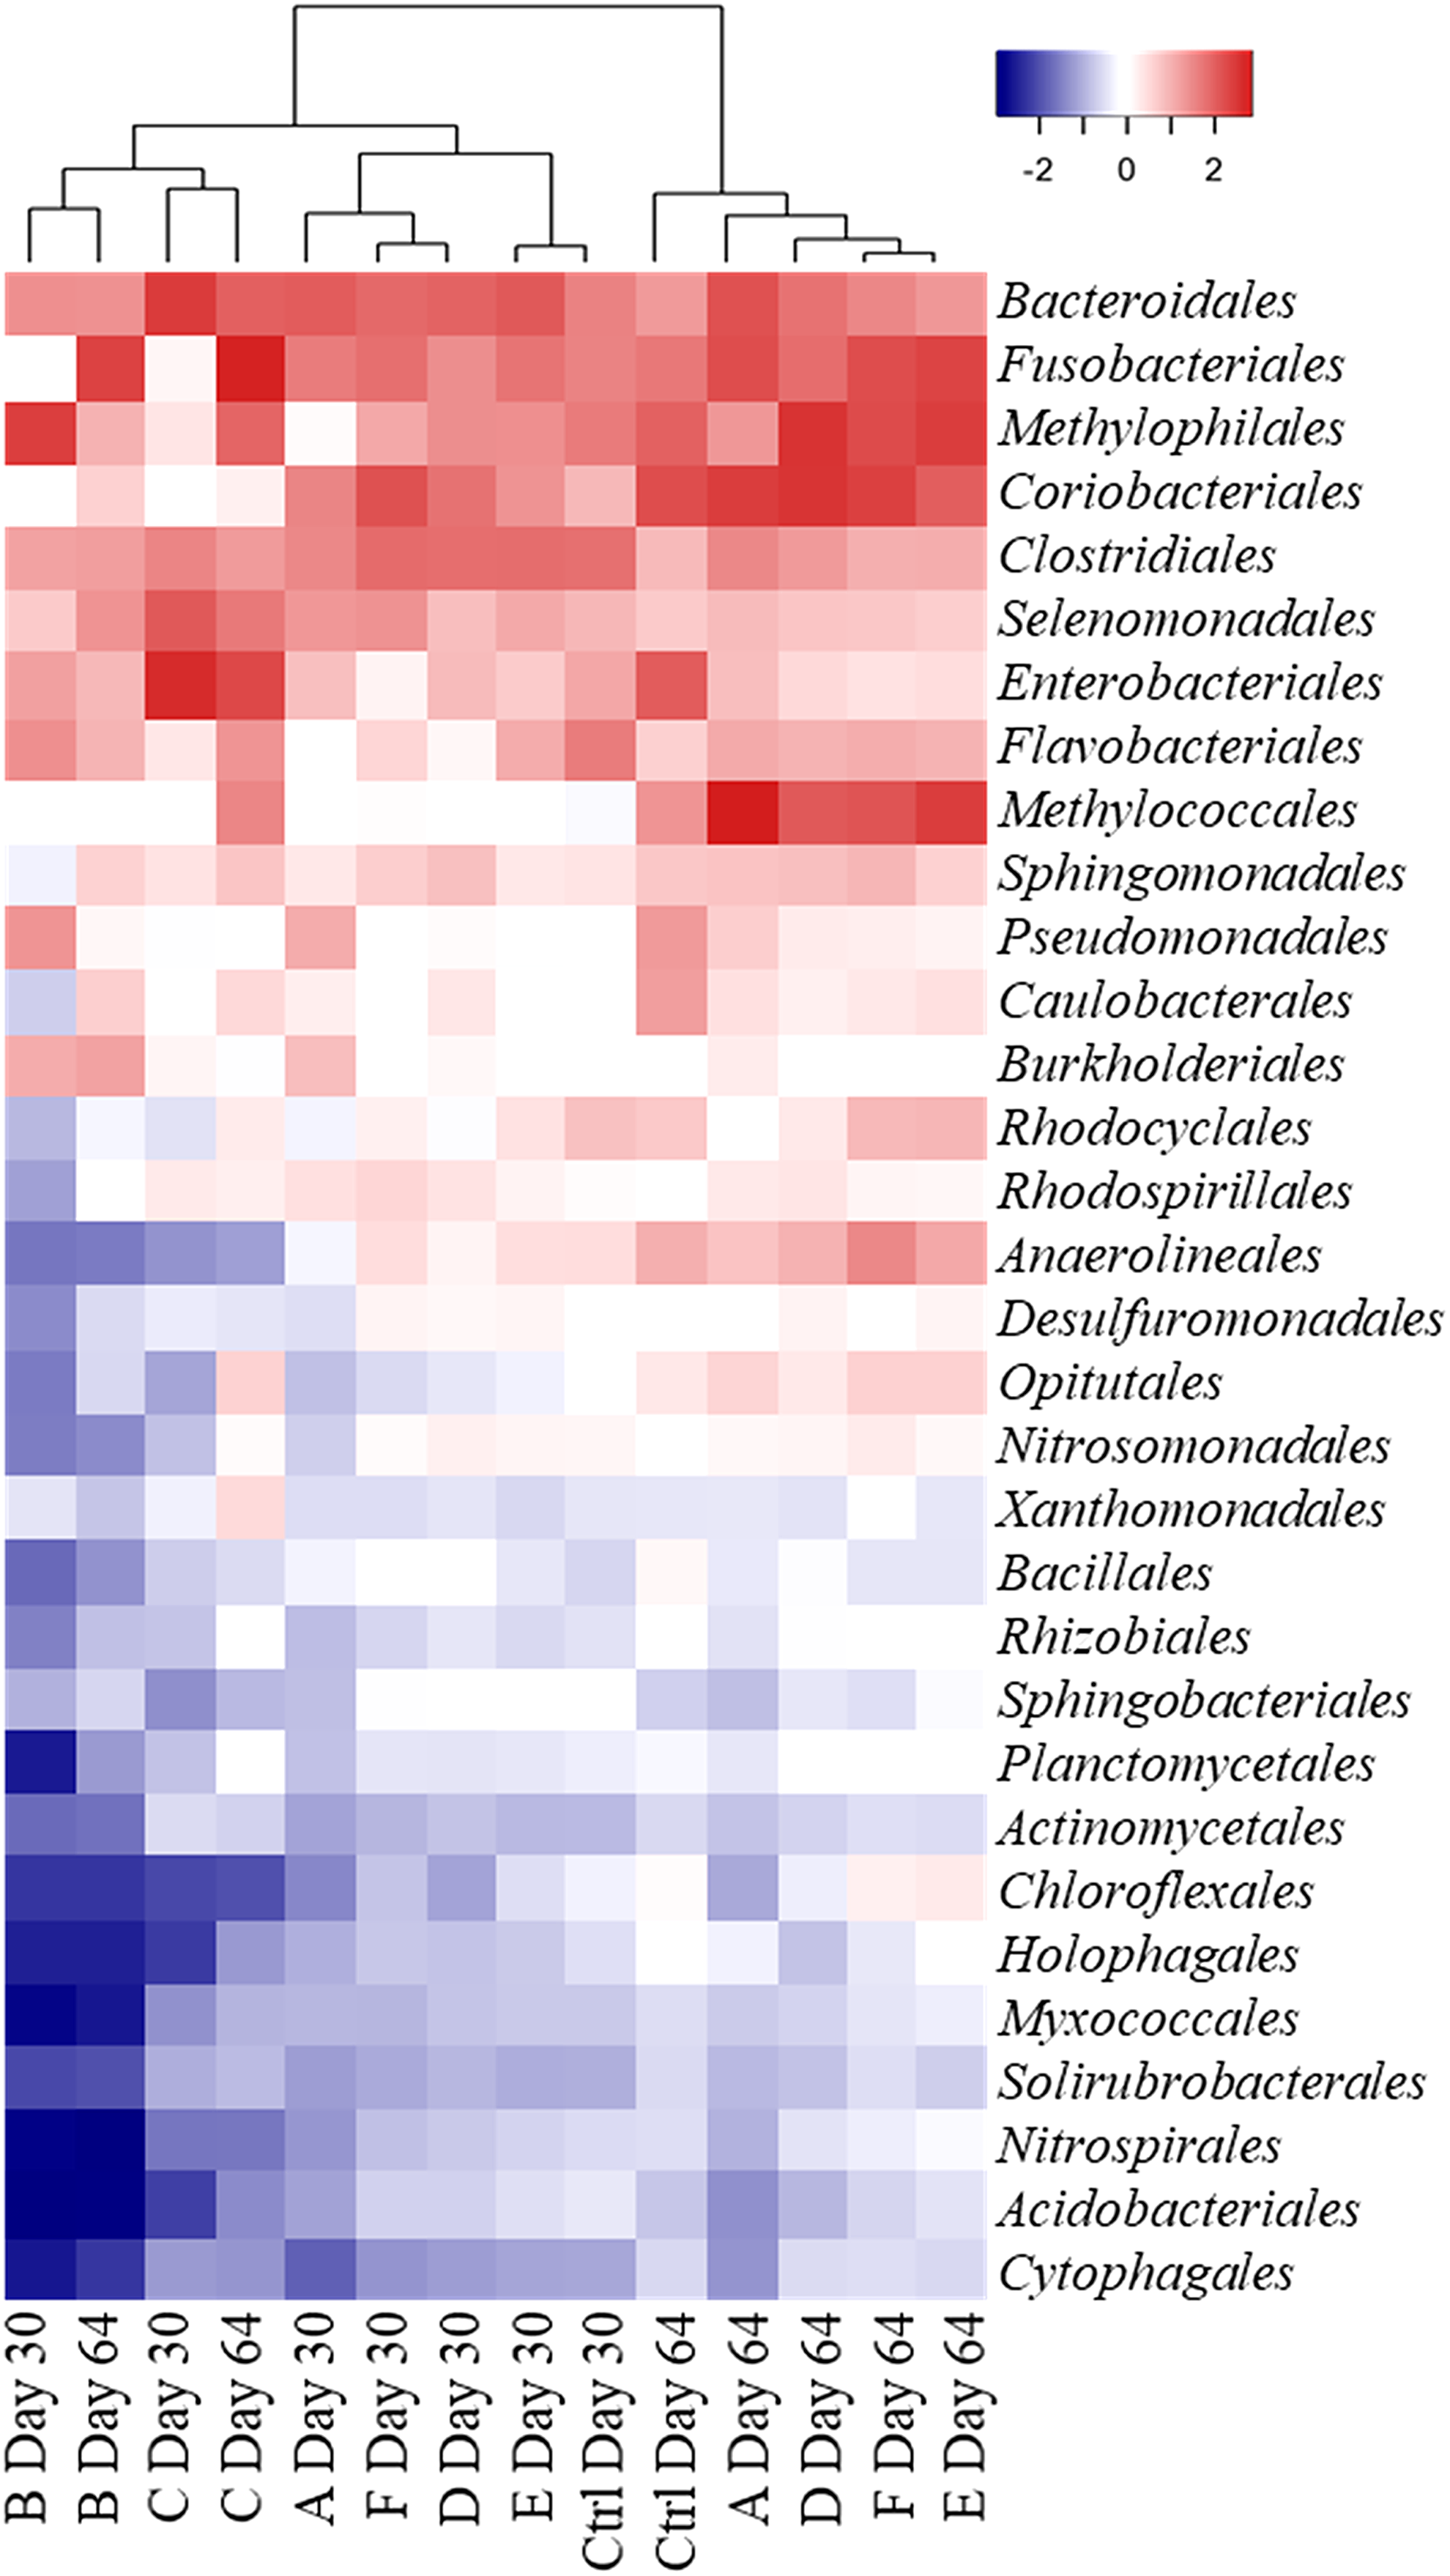
Dendrogram and heatmap analysis of the 32 most abundant phylogenetic Orders in the Illumina 16S rRNA gene sequencing dataset. Dendrogram analysis was performed for sample relatedness only, and phylogenetic Orders are ordered top to bottom from the highest overall enrichment to the lowest enrichment. The scale bar and heatmap indicates the log-unit increase or decrease for each order in the sample compared with the original soil inoculum. rRNA, ribosomal RNA.
Growth of bacteria from fluid amendments
With qPCR assays, 24 bacterial groups phylogenetically related to known species were found reproducibly enriched in triplicate microcosms by at least one of the representative HFFs (Fig. 4). In the microcosms amended with Fluid A, a total of 10 groups of bacteria were found enriched: Sedimentibacter, Pelosinus, Azospirillum, Acinetobacter, Methylococcaceae, Pusillimonas, Azohydromonas, Comamonadaceae, Pedobacter, and Dysgonomonas. The Sedimentibacter, Pelosinus, Azospirillum, Acinetobacter, Comamonadaceae, Azohydromonas, and Dysgonomonas were enriched most significantly within the first 7 days. Of these, the Acinetobacter was most enriched, with an increase in abundance from 5.6 ± 1.0 to 11.8 ± 0.5 copies of 16S rRNA genes/g. The Methylococcaceae and Pusillimonas enriched more slowly, peaking in abundance on day 30 before decreasing, whereas the Methylococcaceae enriched over the length of the experiment. Fluid B enriched 15 groups of bacteria, including Sedimentibacter, Pelosinus, Lachnospiraceae, Azospirillum, Acinetobacteria, Pseudomonas, Stenotrophomonas, Methylophilaceae, the Ralstonia and Cupriavidus group, Achromobacter, Pusillimonas, Comamonadaceae, Pedobacter, Parapedobacter, and Dysgonomonas. Enrichment for these bacteria generally peaked by days 30 or 42, with the exception of Pusillimonas and Dysgonomonas, which peaked a little later on day 52 and Parapedobacter, which only became enriched after day 42, peaking on day 64. Fluid C enriched 11 groups: Pelosinus, Anaerospora, Terrisporobacter, Lachnospiraceae, Clostridium, Rhodococcus, Azospirillum Magnetospirillum, Achromobacter, Pusillimonas, and Dysgonomonas. The Pelosinus spp. and Lachnospiraceae were enriched heavily within the first 7 days, Anaerospora peaked on day 14, and the other eight groups were enriched more slowly. Fluids D, E, and F each enriched fewer groups. Fluid D was found to only significantly enrich Methylococcaceae among these assays. The abundance of Dysgonomonas increased to 7.4 ± 0.2 copies 16S rRNA genes/g on day 13 in the Fluid D-amended microcosms as well, although this was not statistically significantly more than the abundance in the control at 6.6 ± 0.2 copies 16S rRNA genes (data not shown, Student t-test, p = 0.054). Fluid E enriched Magnetospirillum, Noviherbaspirillum, and Dysgonomonas, and in all cases the enrichment was only observed in the first 30 days. Fluid F enriched Bacillus, Azospirillum, Pusillimonas, and Dysgonomonas, which in all cases was less than two orders of magnitude greater than the control.

The qPCR results for each bacteria group found enriched by at least one fluid are shown for microcosms in which statistically significant enrichment over the control was found for at least 1 sampling day (Student t-test, p < 0.05). Shown are averages and standard deviations between triplicate microcosms amended with Fluid A (triangles, yellow), B (circles, brown), C (dash symbols, gray), D (squares, purple), E (diamonds, blue), F (stars, red), and the control (open squares and dashed lines, green). qPCR, quantitative polymerase chain reaction.
Enriched bacteria largely varied between representative HFF amendments. Fluids A and B shared the highest number of commonly enriched groups at eight, four of which were not shared with any other HFF-amended microcosms (Sedimentibacter, Acinetobacter, Comamonadaceae, and Pedobacter). Of the other four groups enriched in common by A and B, one was enriched also by Fluids C, E, and F (Dysgonomonas), two were also enriched by both Fluids C and F (Azospirillum and Pusillimonas), and one was also enriched by just Fluid C (Pelosinus). One group was enriched commonly by Fluids C and E (Magnetospirillum), one group was enriched by both Fluids A and D (Methylococcaceae), and two were enriched by Fluids B and C (Lachnospiraceae and Achromobacter). The presence of any given enrichment cannot be connected to the presence of any given chemical constituent with confidence; any given chemical constituent is generally present in only one or two fluids used.
Discussion
At the end of the experiment, both the changes in the microbial community, with the exception of a few taxa, and the COD degradation had stalled indicating that labile contaminants were degraded. Volatility losses were not accounted for in this experiment and may have been responsible for some loss of COD; however, most chemicals in HFFs have low or no volatility (Stringfellow et al., 2014). The COD in microcosms amended with Fluids A, C, D, and E were still significantly greater than the controls, indicating a nonlabile fraction remained and should thus warrant concern of nonbiodegradability in cases of spills. Similarly, Mouser et al. (2016) found 70–92% biodegradation of a HFF within 39 days, also indicating a recalcitrant fraction. The reason that Fluids A, C, D, and E contained a recalcitrant fraction is not clear, however, both Fluids C and D uniquely contained the biocide 2,2-dibromo-3-nitrilopropionamide and Fluid A contained unique recalcitrant and/or toxic compounds not added to the other HFFs (i.e., naphthalene, acetic anhydride). Although the analytical methodologies to track individual compounds in these mixtures is complex (Oetjen et al., 2017), such methods in further experiments can help determine the specific recalcitrant constituents. The recalcitrance indicates that HFFs can lead to long-term contamination in soils after leaks and spills.
Although the water phase of these microcosms was measured to maintain aerobic conditions, some of the enriched bacteria groups are closely related to obligate anaerobes (i.e., Sedimentibacter (Obst et al., 2005), Anaerospora (Woo et al., 2005), and Terrisporobacter (Deng et al., 2015)) indicating that the sediment likely contained zones of anaerobic redox conditions as well. Sediment redox levels were not a controlled variable in this experiment but could potentially explain some disparity between microcosms. The unique pH changes in Fluid B-amended microcosms may also partially explain its unique microbial community. In all cases, the nutrients (phosphate and ammonia) introduced with the basal salts medium may have allowed for a greater and/or faster microbial growths than what may be found in spill events.
Many of the bacterial taxa found enriched in this study were also found in previous studies on HFF degradation. Kekacs et al. (2015) found that Pseudomonas and other Pseudomonadaceae were primarily enriched in the degradation of their synthetic HFF using a standardized biodegradability procedure using municipal wastewater-activated sludge. This HFF differed most notably from the HFFs used in this study by the use of a biocide containing glutaraldehyde and quaternary ammonium compounds (Kekacs et al., 2015). The HFF did contain many similar components to those used in this study, such as citric acid, nonylphenol and alcohol ethoxylates, petroleum distillates, glutaraldehyde, and ethylene glycol (Kekacs et al., 2015). In another study using the same HFF, but with a range of concentrations and using soil and groundwater inocula, Acinetobacter, Magnetospirillum, Azospirillum, Achromobacter, and Pseudomonas were among the enriched bacteria using pyrosequencing analysis (Mouser et al., 2016). In groundwater around hydraulically fractured wells in the Barnett oil play in north Texas, Pseudomonas and Acinetobacter were found along with contaminants from the hydraulic fracturing process and two isolated strains of these genera were capable of degrading toluene and chloroform (Santos et al., 2017). Pseudomonas is well known to degrade aliphatic and aromatic hydrocarbons (White et al., 2011; Bücker et al., 2014), and strains in the genus Acinetobacter are well known to degrade benzene, toluene, and other petrochemicals (Abdel-El-Haleem, 2003). Pseudomonas and Acinetobacter are thus connected to HFFs with laboratory-based and field-based studies and are connected to hydrocarbon degradation; however, they were only enriched from Fluid A and/or B in this study even though all Fluids contained high levels of organics. A biomarker based on these genera, therefore, are not likely to be universal for HFF contamination detection.
Indeed, many of the enriched bacteria taxa found in this study are phylogenetically related to strains found to biodegrade chemical constituents found in HFFs. Sedimentibacter has been found as a part of a bacterial community enriched in a fluidized bed reactor degrading the alcohol ethoxylate mixture Genapol-C100 (Motteran et al., 2014), and is often associated with hydrocarbon degrading consortia (Grabowski et al., 2005). Acinetobacter calcoaceticus has been found to degrade linear alkylbenzosulfonate and sodium dodecyl sulfate in coculture with a Pantoea strain (Abboud et al., 2007). Strains of Bacillus and Acinetobacter have been found to degrade nonylphenols (Chang et al., 2005) and molecular methodologies have suggested that Clostridium can as well (Wang et al., 2015). Acinetobacter spp. are also known to outcompete other soil microbes and become enriched on acetate media (Baumann, 1968); acetate was amended at 185 and 105 mg/L in Fluids A and B, respectively, which are the only two Fluids that enriched Acinetobacter. Dysgonomonas was one the most commonly enriched bacteria in this study, and has been found pervasive in biodegrading communities, including synthetic dyes (Xie et al., 2016), biodiesel (Bücker et al., 2014), and antibiotics (Alexandrino et al., 2017). In addition, Pelosinus (Mikkelson et al., 2015), Bacillus (White et al., 2011), Terrisporobacter (Deng et al., 2015), Clostridium (Grabowski et al., 2005), Rhodococcus (Larkin et al., 2005), Azospirillum (Liu et al., 2009), Magnetospirillum (Shinoda et al., 2005), Stenotrophomonas (Arulazhagan et al., 2017), Ralstonia and Cupriavidus (Kuppusamy et al., 2016), Noviherbaspirillum (Lin et al., 2013) Achromobacter (White et al., 2011), Pusillimonas (Peng et al., 2016), Comamonadaceae (Lladó et al., 2009; Bücker et al., 2014; Jiang et al., 2015), Azohydromonas (Lladó et al., 2009), Pedobacter (Chang et al., 2017), and Parapedobacter (Kumar et al., 2015) have all been previously associated with aromatic and/or aliphatic hydrocarbon degradation. Lastly, Bacillus was enriched by Fluid F, which was the only HFF in this study to contain the popular biocide glutaraldehyde (Kahrilas et al., 2014). A recently published study found that Bacillus was one of several bacteria enriched in microcosms upon degradation of glutaraldehyde (Campa et al., 2018). The study was not clear if this enrichment was from degradation of glutaraldehyde or an adaptation to it.
The reason for the enrichment of some bacteria is unknown. Methylophilaceae are obligate or restrictive facultative methylotrophs (Doronina et al., 2014), but they were restricted to enrichment from Fluid B, which contained no direct methyl-amendments, whereas Fluids A, D, E, and F contained a suitable substrate (methanol). Similarly, the methanotrophic Methanococcaceae (Bowman, 2014) were enriched only in Fluids A and D; the methanol amendment in these microcosms may have been used directly or the microbial communities produced C1 substrates as degradation products. The Lachnospiraceae are thus far primarily known for inhabiting digestive tracts (Stackebrandt, 2014), although one study found them to be a component of a minor metabolic network of unknown function in communities degrading hexadecane and octadecane (Fowler et al., 2016). Additionally, Anaerospora was isolated from a blood infection (Woo et al., 2005) and has been found in environmental samples (Elshahed et al., 2005), but its link to biodegradation is not known.
Bioremediation of flowback and production waters would likely require unique bacterial communities to that of HFF surface spills. Many chemicals in HFFs undergo transformations during the hydraulic fracturing and underground (Gordalla et al., 2013). Upon dilution in water, the biocide 2,2-dibromo-3-nitrilopropionamide is known to undergo rapid hydrolysis to dibromoacetic acid and dibromoacetonitrile (United States Environmental Protection Agency [USEPA], 1994). Salt also has been found to impede biodegradability of HFFs in other studies (Kekacs et al., 2015; McLaughlin et al., 2016), and thus brinier flowback and production waters may be more difficult to remediate. Still, one study has found Rhodococcus, Ralstonia, Acinetobacter, and Pseudomonas among the bacterial community degrading significant COD in reactors treating oil production wastewater, suggesting that some bacterial communities may be well suited for both surface spills of unused HFFs and flowback wastewaters (Shpiner et al., 2009).
This study has identified 24 taxa closely related to strains of various degradative capabilities that were enriched on at least 1 of 6 representative HFF amendments. The diverse combinations of enriched microbial community members are generally not clearly linked to the presence of individual HFF constituents, suggesting that HFFs contain complex, synergistic effects on microbial communities. With the complex nature of the compositions and the microbial toxicity associated with many of the components, chemical interactions in any given mixture may have contributed to the selection of unique degradative communities, and unique degradative communities may thus be required for bioremediation of unique HFFs. Such “tailored” treatments for bioremediation have been proposed for the treatment of flowback waters as well (Lester et al., 2015). Further research is needed to determine the specific chemical fates of these mixtures, and determine the bioremediation interventions that can reduce and eliminate recalcitrant fractions in cases of spills.
Footnotes
Acknowledgments
Funding for this study was provided by the Oklahoma State University start-up funding to M.J.K. A.L.M. was supported by an Oklahoma State University Wentz Research Scholarship.
Author Disclosure Statement
No competing financial interests exist.
References
Supplementary Material
Please find the following supplemental material available below.
For Open Access articles published under a Creative Commons License, all supplemental material carries the same license as the article it is associated with.
For non-Open Access articles published, all supplemental material carries a non-exclusive license, and permission requests for re-use of supplemental material or any part of supplemental material shall be sent directly to the copyright owner as specified in the copyright notice associated with the article.