
Abstract
Abstract
Carbon label, which is also known as the carbon footprint label or carbon emission label, is the sum of carbon dioxide emissions generated from each stage in the life cycle of a product. Reports show that human activities increase greenhouse gas concentrations and cause global warming. Carbon-labeling schemes could fill the gap in climate policies by influencing the behavior of consumers toward the purchasing of green products. This finding indicates the significance of developing an internally applicable carbon-labeling policy before releasing international standards. Therefore, this study intends to provide an analytic network process and strength–weakness–opportunity–threat analysis approach to prioritize the carbon-labeling policy in Taiwan. Results indicate that the best policies for implementing carbon labeling in Taiwan include promotion through multiple approaches, aggressive utilization of government resources, intensive participation in international events, and extensive launch of international knowledge. In addition, this article provides guidelines and systemic decision patterns for carbon-labeling implementation to help governments and firms to develop and adjust their strategy for future carbon label implementation.
Introduction
Carbon label, which is also known as carbon footprint label or carbon emission label, is the sum of carbon dioxide (CO2) emissions generated from each stage in the life cycle of a product. These stages include the processing of raw materials, manufacturing, distribution, delivery, user consumption, waste disposal, and recycling. Greenhouse gas (GHG) emissions at each period are converted into the total volume of CO2. Carbon label is classified into two modes, namely, CO2 measured label and CO2 reduction label, based on the different demands (Carbon Trust, 2007; Liu et al., 2016). Carbon labeling is useful in increasing the consumer awareness of the carbon footprint and influences the purchasing of low carbon products. Thus, carbon labeling boosts the sustainable consumption and production patterns (Tan et al., 2014; Li et al., 2017).
Human activities increase GHG concentration and primarily cause global warming. Carbon-labeling schemes could fill the gap in climate policies by influencing the behavior of consumers toward the purchasing of green products. Companies and their supply chains should reinforce initiatives to reduce emissions (Girod, 2016; Mostafa, 2016). Carbon labeling aims to guide consumers toward better consumption patterns and to reduce carbon consumption (Li et al., 2017). A carbon-labeled product could bring additional benefits for companies. These benefits include increased opportunities to reduce emissions as a result of consumer comparison and concentration on public information, product differentiation, and enhanced brand and reputation (Kortelainen et al., 2016). A society will become a low-carbon society when its economy, daily life, and culture have achieved low carbon. In the process of low-carbon development, carbon label and carbon certification can serve the purpose well (Yuan et al., 2011).
Other studies have indicated that governments usually develop policies to motivate companies to create sustainable products and achieve sustainable performance (Choi, 2015). Zhao et al. (2016) showed that the implementation of carbon-labeling policy remains limited, because previous studies focused on the design of carbon labeling scheme to improve the transparency of current standards, enhance consumer perceptions, and eliminate a nontariff barrier in international trade. Numerous individual carbon-labeling systems have been developed, and several public or nongovernmental carbon labels are currently applied. However, these individual bodies lack the integration and extensive promotion of functional organizations (Shuai et al., 2014).
The Taiwan Environmental Protection Administration (EPA) started the thrust for a carbon footprint labeling system in 2010 and promoted the carbon reduction label in 2013. The label's purpose is to encourage the production and consumption of products with low carbon emissions to move toward a low-carbon environmentally friendly society. Since the evolving empirical relationship between innovation and legislation keeping the existing regulatory framework up to date has significant implications (Kaal and Farris, 2017), the objective of this study is to provide guidelines and systemic decision patterns for carbon labeling implementation to help governments and firms to implement of a carbon labeling policy and continuously optimized.
This study collects the carbon labels and presents the current developments in carbon labeling. The analytic network process and strength–weakness–opportunity–threat (ANP–SWOT) analysis approach is used to study the factors that affect the development of Taiwan's carbon-labeling program. Moreover, guidelines to facilitate the carbon implementation for Taiwan are proposed. We first performed SWOT analysis to assess the internal and external factors that affect Taiwan's carbon-labeling program. Then, we confirmed 14 subfactors and combined the effect of four different aspects of development strategies through an expert group meeting using the tools of Fuzzy Delphi Method (FDM) and Decision Making Trail and Evaluation Laboratory (DEMATEL). SWOT analysis cannot rank factors and strategies. Thus, ANP was used to prioritize strategies. The best strategy that could be implemented in Taiwan is the advancement of carbon labeling. This policy development program will provide decision makers with design concepts that will facilitate the selection of the best strategy for implementing carbon labeling.
Literature Review
Carbon footprint and carbon labeling
The carbon footprint originated from an ecological footprint (Wackernagel and Rees, 1997). This concept explains the environmental effects of human activities. The carbon footprint is also accumulated through the life cycle of a product (Wiedmann and Minx, 2008). This parameter is an effective measure to ensure emission reduction and the development of a low-carbon economy (Gomi et al., 2010). The carbon footprint expressed as kg CO2-e by multiplying the amount of the GHG and its global warming potential (British Standard Institute [BSI], 2008; Brander and Davis, 2012; Patra, 2017) is a significant indicator of environmental effect and refers to the total amount of CO2 or equivalent GHG emissions directly or indirectly emitted by specific activities, such as manufacturing and delivery (Röös et al., 2013; Fang et al., 2014).
Carbon label provides information on the GHG emission of a product. This label is associated with production and used as a tool to relieve GHG emissions and promote climate change education (Young et al., 2010; Upham et al., 2011). These policies generate diverse effects. For instance, consumers can select low-carbon products according to pertinent information. Organizations can commit to reduce carbon in their products, whereas retailers can sell low-carbon products. Carbon labeling provides an innovative path toward sustainable consumption and production by imparting environmental information to stakeholders (Shewmake et al., 2015; Li et al., 2016).
Overview of international carbon labeling
Carbon Trust in the United Kingdom pioneered on-shelf carbon labeling in 2006. The first batch of carbon-labeled products was introduced in March 2007. Several carbon labels from each country have been developed. In this study, 11 carbon-labeling systems from 11 countries were surveyed, and the results are listed in Table 1.
Comparison of Carbon-Labeling Systems in Selected Countries
CFP, carbon footprint; HGCA, Home Grown Cereals Authority; PIK, Potsdam-Instituts für Klimafolgenforschung; METI, Ministry of Economy, Trade, and Industry; KEITI, Korea Environment Industry and Technology Institute; TGO, Thailand Greenhouse Gas Management Organization; WWF, World Wildlife Fund; MRA, Mutual Recognition Agreement; EPA, Environmental Protection Administration; PSA, Publically Available Specification.
The United Kingdom: Carbon Trust
Carbon Trust aims to develop a low-carbon economy, reduce carbon emissions, and develop low-carbon technology in business. Carbon Trust established the Carbon Label Company in 2007. In the same year, Carbon Trust cooperated with Defra and BSI to develop the Publically Available Specification (PAS), which is referred to as PAS 2050. PAS 2050 is a free specification material used in assessing carbon emissions in the life cycle of a product or service.
United States of America: carbon-free label
Carbon Fund is a nonprofit organization (NPO) in the United States of America. This organization runs the carbon footprint calculation and carbon credit offset using an easy and affordable approach to help individuals or organizations achieve carbon-neutral targets. Carbon footprint calculation involves the assessment of the life cycle of a product to achieve zero-carbon targets.
Japan: carbon footprint
The Ministry of Economy, Trade, and Industry (METI) implemented relevant regulations on carbon labeling in August 2008. METI developed a cooperative link with the National Institute of Advanced Industrial Science and Technology, Ministry of Environment, and Ministry of Agriculture, Forestry, and Fisheries of Japan to promote this policy. METI introduced the guidelines on the carbon footprint system in 2009 and formulated the standards for establishing rules for product category.
South Korea: CooL (CO2 low) label
The Korea Environment Industry and Technology Institute, which is a quasi-government organization affiliated with the Ministry of Environment, initiated a carbon-labeling scheme in 2009. This system used the GHG agreement of PAS 2050. At present, the nonmandatory scheme issues two types of certificates, namely, a carbon footprint certificate and a low-carbon product certificate.
Thailand: carbon footprint
The Thailand Greenhouse Gas Management Organization (TGO) established an expert advisory committee in August 2008 to verify the application of carbon-labeling implementation. TGO cooperates with the Thailand Environment Institute to establish a scheme called carbon reduction label. TGO anticipates that carbon labeling will encourage and provide manufacturers the opportunity to reduce GHG emissions.
Canada: CarbonCounted
CarbonCounted is an NPO in Canada that developed and launched a carbon-labeling scheme in January 2007. The system used the GHG agreement of PAS 2050 and World Resources Institute–World Business Council for Sustainable Development in calculating the amount of GHG emissions. This amount was verified by third-party auditors accredited by CarbonCounted to determine the accuracy of the submitted emission amount.
Switzerland: Climatop
Climatop was founded in November 2008, but the organization created its label in early 2008. Climatop-guided products are transformed into environment-friendly goods. Each product should specify an emission limit against climatic change during sourcing, manufacturing, delivery, and consumption until waste disposal. Every product should be identified with at least 20% CO2.
Germany: Product Carbon Footprint
The Product Carbon Footprint Label scheme was supported by the German government and implemented in April 2008. This scheme was developed by World Wildlife Fund, Oko-Institute, Potsdam-Instituts für Klimafolgenforschung, and THEMA1. These organizations define the carbon footprint of a product as its specific application process and the accumulated amount of GHG emissions from its entire life cycle.
European Union: Carbon Labels
The carbon-label scheme was supported by the WIP-Renewable Energies and the European Union. Germany, England, Netherlands, Poland, and Malta are partners in this scheme. This scheme was proposed to encourage the use of biofuel, and it focuses on reducing CO2 emissions as set by the European Department of Transportation.
Australia: carbon reduction label scheme
The carbon reduction label is an international certification scheme managed by Planet Ark, an environment management foundation in Australia. The label discloses the carbon footprint of a product and is currently adopted in 19 countries with labeled products having annual sales of approximately AU$4.5 billion. The label captures the CO2 and all other GHG emissions generated from the production to the disposal of packing of a product through a life cycle assessment approach. The carbon footprint of a product is assessed by a consultant, and the result is independently certified by Carbon Trust, the United Kingdom-based organization that developed the scheme. The product footprint is recalculated every 2 years, and the carbon footprint of a product should be reduced to remain in the scheme.
Taiwan: carbon footprint labeling
The Taiwan EPA officially started the thrust for carbon footprint label in 2010 and then developed the carbon reduction labeling system on the carbon footprint in 2013. The system assists enterprises to determine the carbon footprint of their products and explore for possible methods to reduce carbon emissions. Moreover, the administration anticipates to contribute to lowering the earth's temperature. Five steps are followed to apply for the carbon footprint label, namely, inventory calculation, certification, certification application, application review, and approval of labels for use.
Hence, diverse developments in the carbon labeling system can be observed (Wu et al., 2014). Table 1 gives the distinct organizational structures and calculation standards of different countries on the implementation of carbon labeling. Therefore, global standards are started to be harmonized. The Asia Carbon Footprint Network, which was initiated in 2013, focused on the product category rules (PCRs), uncertainty analysis, carbon emission factors, and life cycle inventory database of information, knowledge exchange, and collaborative research.
Besides the discrepancies on calculation standards, the organization structures on the implementation of carbon labeling are also different. Most of European and American enterprises and Australia are operating carbon labeling through NPO; however, Asian countries, such as South Korea, Taiwan, Japan, and Thailand are operating by the government organizations or quasi-government organization directly. This may also present the issue of environmental protection differences on the culture between Western and Eastern countries, and indicate that the development and promotion of carbon label through government directly in Asia will be more helpful. This literature review summarizes the features of the carbon-labeling schemes in different countries (Table 1). This information could be applied by decision makers when formulating carbon-labeling programs.
Fuzzy Delphi Method/Decision Making Trail and Evaluation Laboratory
The Delphi method was introduced in 1962 by Dalkey and Helmer at RAND Corporation (Landeta, 2006; Hsu et al., 2011). This method is extensively recognized and applied to formulate assumptions and decisions. The traditional Delphi method has several limitations, such as difficulty in reaching a convergence and necessity of excessive time and costs to generate valuable results. Applying Fuzzy theory to the Delphi method could reduce time and costs in obtaining valuable outcomes (Shen et al., 2010; Ma et al., 2011).
DEMATEL is a comprehensive tool for building and analyzing a structural model and involves causal relationships between complex factors (Wu and Lee, 2007). DEMATEL was developed by the Science and Human Affairs Program of the Battelle Memorial Institute of Geneva between 1972 and 1976. This approach was deployed to examine and solve a group of complex and difficult problems. The DEMATEL method is extensively applied in the analysis of problematic decision-making in industrial planning (Huang et al., 2007; Lee et al., 2008). The tool has been successfully employed in numerous areas, such as energy, marketing strategy, e-learning evaluation, control systems, and safety issues (Liou et al., 2007). In most cases, the DEMATEL method is used in prioritizing alternatives in combination with other techniques (Shen et al., 2011; Altuntas et al., 2012). Tavakoli et al. (2016) demonstrated that, in determining the complex environmental factor, the SWOT and DEMATEL integrated tool could efficiently draw out strategies and indicate the importance and effect of the factor on the strategies that could help organizations be more successful.
Combining SWOT and ANP
SWOT analysis is used to improve the management strategies of companies or institutions/organizations. A simple model is developed by evaluating the strengths (what an organization can do), weaknesses (what an organization cannot do), opportunities (potential favorable conditions), and threats (potential unfavorable conditions) of an organization. This method was developed at the Harvard Business School in the 1960s (Hilla and Westbrook, 1997). SWOT analysis is an important support tool for decision-making, because it methodically analyzes the internal and external environments of an organization (Kangas et al., 2003; Yuksel and Dagdeviren, 2007). This method is a powerful strategic and environmental analysis tool to identify key internal and external strategic factors (Babaesmailli et al., 2012).
SWOT analysis can perform several strategy classifications for follow-up, such as conjunction of strengths and opportunities (SO strategies), combination of weaknesses and opportunities (WO strategies), common attention on the aggregation of strengths and threats (ST strategies), and evaluated assessments of comparison of weaknesses and threats (WT strategies). For instance, strengths are useful for enhancing external opportunities for SO strategies, whereas WO strategies focus on seeking external opportunities to reduce weaknesses. ST strategies focus on current potential internal strengths to reduce effects of external threats. By contrast, WT strategies focus on actions to decrease influences from internal weaknesses and external threats (Sevkli et al., 2012). Despite the extensive application of SWOT analysis, this method has several restrictions, such as the difficulty of ranking criteria and strategies (Mendoza and Prabhu, 2005). Moreover, the major defect of SWOT analysis is that it merely provides qualitative evaluations for identified factors. SWOT analysis cannot quantify factors and objectively rank alternatives (Menga et al., 2015). This problem can be resolved by combining SWOT with ANP.
Saaty (1990) developed the analytic hierarchy process (AHP). In the past 20 years, this method has been extensively investigated and used in almost all applications related to multiple criteria decision-making (MCDM) (William, 2008; Chen et al., 2012). The most notable deficiency of AHP is that it neglects the dependence among strategic factors. AHP method ceases to be functional once dependence becomes interactive or one component affects another (Saaty, 1990). To address this problem, Saaty (1990) presented ANP, which considers the relationships among criteria, subcriteria, and clusters. ANP can solve the problem of AHP and handle dependent relationships within the MCDM model (Yuksel and Dagdeviren, 2007; Chen et al., 2012; Sevkli et al., 2012).
ANP involves the following four major steps (Chung et al., 2005):
Construction of the model and structuring the problem Establishment of pairwise comparison matrices and priority vectors Formation of the super matrix Selection of the best alternatives.
SWOT–AHP is an efficient and useful tool. However, this tool exhibits major restriction on the presumption that each factor within its hierarchical framework operates independently from one to another (William, 2008). ANP provides a method for measuring dependence among factors and evaluating their relative importance (Yuksel and Dagdeviren, 2007).
Integration of ANP with the SWOT framework is suitable for MCDM on industrial policy development. This method has recently been adopted by most researchers on the strategy prioritization, leading to the creation of a complete research method and achievement of reliable results as given in Table 2. In this study, we also adopted ANP–SWOT. The mathematical formula derivation is not our research point. We will focus on providing valuable information on the framework creation process for systemic strategy development. We will attempt to determine the most suitable important factor and rank for the implementation of carbon labeling in Taiwan.
Combined Analytic Network Process and SWOT Approach and Its Applications
SWOT, strength–weakness–opportunity–threat.
Application of Proposed Model
ANP is an MCDM tool but not a statistical method that depends on the adoption of proper samples from population parameters (Cheng and Li, 2006). Powell (2003) also declared that a representative assessment involves the quality of the expert group rather than the quantity. According to Saaty (2005), an expert group composed of 5 and no more than 15 members is the best group. To optimize the carbon-labeling program continually, Taiwan EPA carried out the optimizing strategy research of the carbon-labeling program in 2010 and organized an expert group composed of six members, including the technician and section chief of Taiwan EPA, general manager of BSI Taiwan branch, manager of the Green Energy and Environment Laboratories of Industrial Technology Research Institute, and the professor and associate professor in the academic field. They all possessed the best knowledge on carbon labeling. An extensive review of the literature was performed to establish the 12 SWOT factor frameworks for implementing carbon-labeling policy in Taiwan. In the first phase, FDM was employed to confirm the factors. There are 11 factors been confirmed, 1 factor been amended and 4 factors have been added at first time. And then, 16 factors have been reviewed and 1 factor has been deleted and 2 factors have been integrated. Finally, there are 14 factors been confirmed at second time. In the second phase, DEMATEL was used to confirm the relationships among factors. In the third phase, ANP was utilized to determine priorities and relative importance of factors. The results could be used as reference for decision-makers in formulating strategies.
First, numerous publications were reviewed to define strengths, weaknesses, opportunities, and threats for the implementation of carbon labeling in Taiwan. For strengths, the benefits are often commended, and more and more consumers are willing to be head for more sustainable consumption and production life style to avoid global warming. The government contribution is helpful in the integration of planning and implementing for carbon labeling. For weaknesses, no unifying system exists for carbon labeling. Thus, each country develops its own system. Data from international product supply chains are difficult to verify. Furthermore, the emission factors of carbon footprint should rapidly forge agreements. For opportunities, most studies have indicated that carbon labeling is the focal developing point for most countries because of the sustainable GHG reduction. This process will also help encourage green production and consumption and improve the consumers' consumption patterns to force the emission reduction of enterprises to satisfy global trends. For threats, the internal research of EPA (Taiwan) showed that commodity knowledge on carbon labeling for Taiwanese people still needs to be enhanced. Given the lack of a complete and consistent International Reference Life Cycle Database, the calculation of carbon inventory is an international concern.
An expert questionnaire was subsequently used, and experts were invited to evaluate and provide comments on key factors using the FDM technique. The first evaluation did not converge, but a second questionnaire was designed and evaluated. A consensus was reached, and 14 key factors were identified (Table 3).
Combined Analytic Network Process and SWOT Approach and Its Applications
Second, DEMATEL was used to create a system to measure the impact relationship among factors in SWOT to implement carbon labeling in Taiwan. X-axis represents the importance level of the factors; Y-axis represents the effect level of the factors. Negative values represent the factors were effected. The results were used to create the impact relationship map of SWOT subfactors (Fig. 1). “O5,” “O3,” and “O4” from the opportunities category in the SWOT analysis show the importance and effect on the implementation of carbon labeling. The market feature of Taiwan is reflected as export oriented. Therefore, strengthening the exchange and transmission of international information and technique could affect and improve the difficult situations of “T1,” “W5,” and “W1” to increase the speed of implementation of the carbon-labeling system in Taiwan.
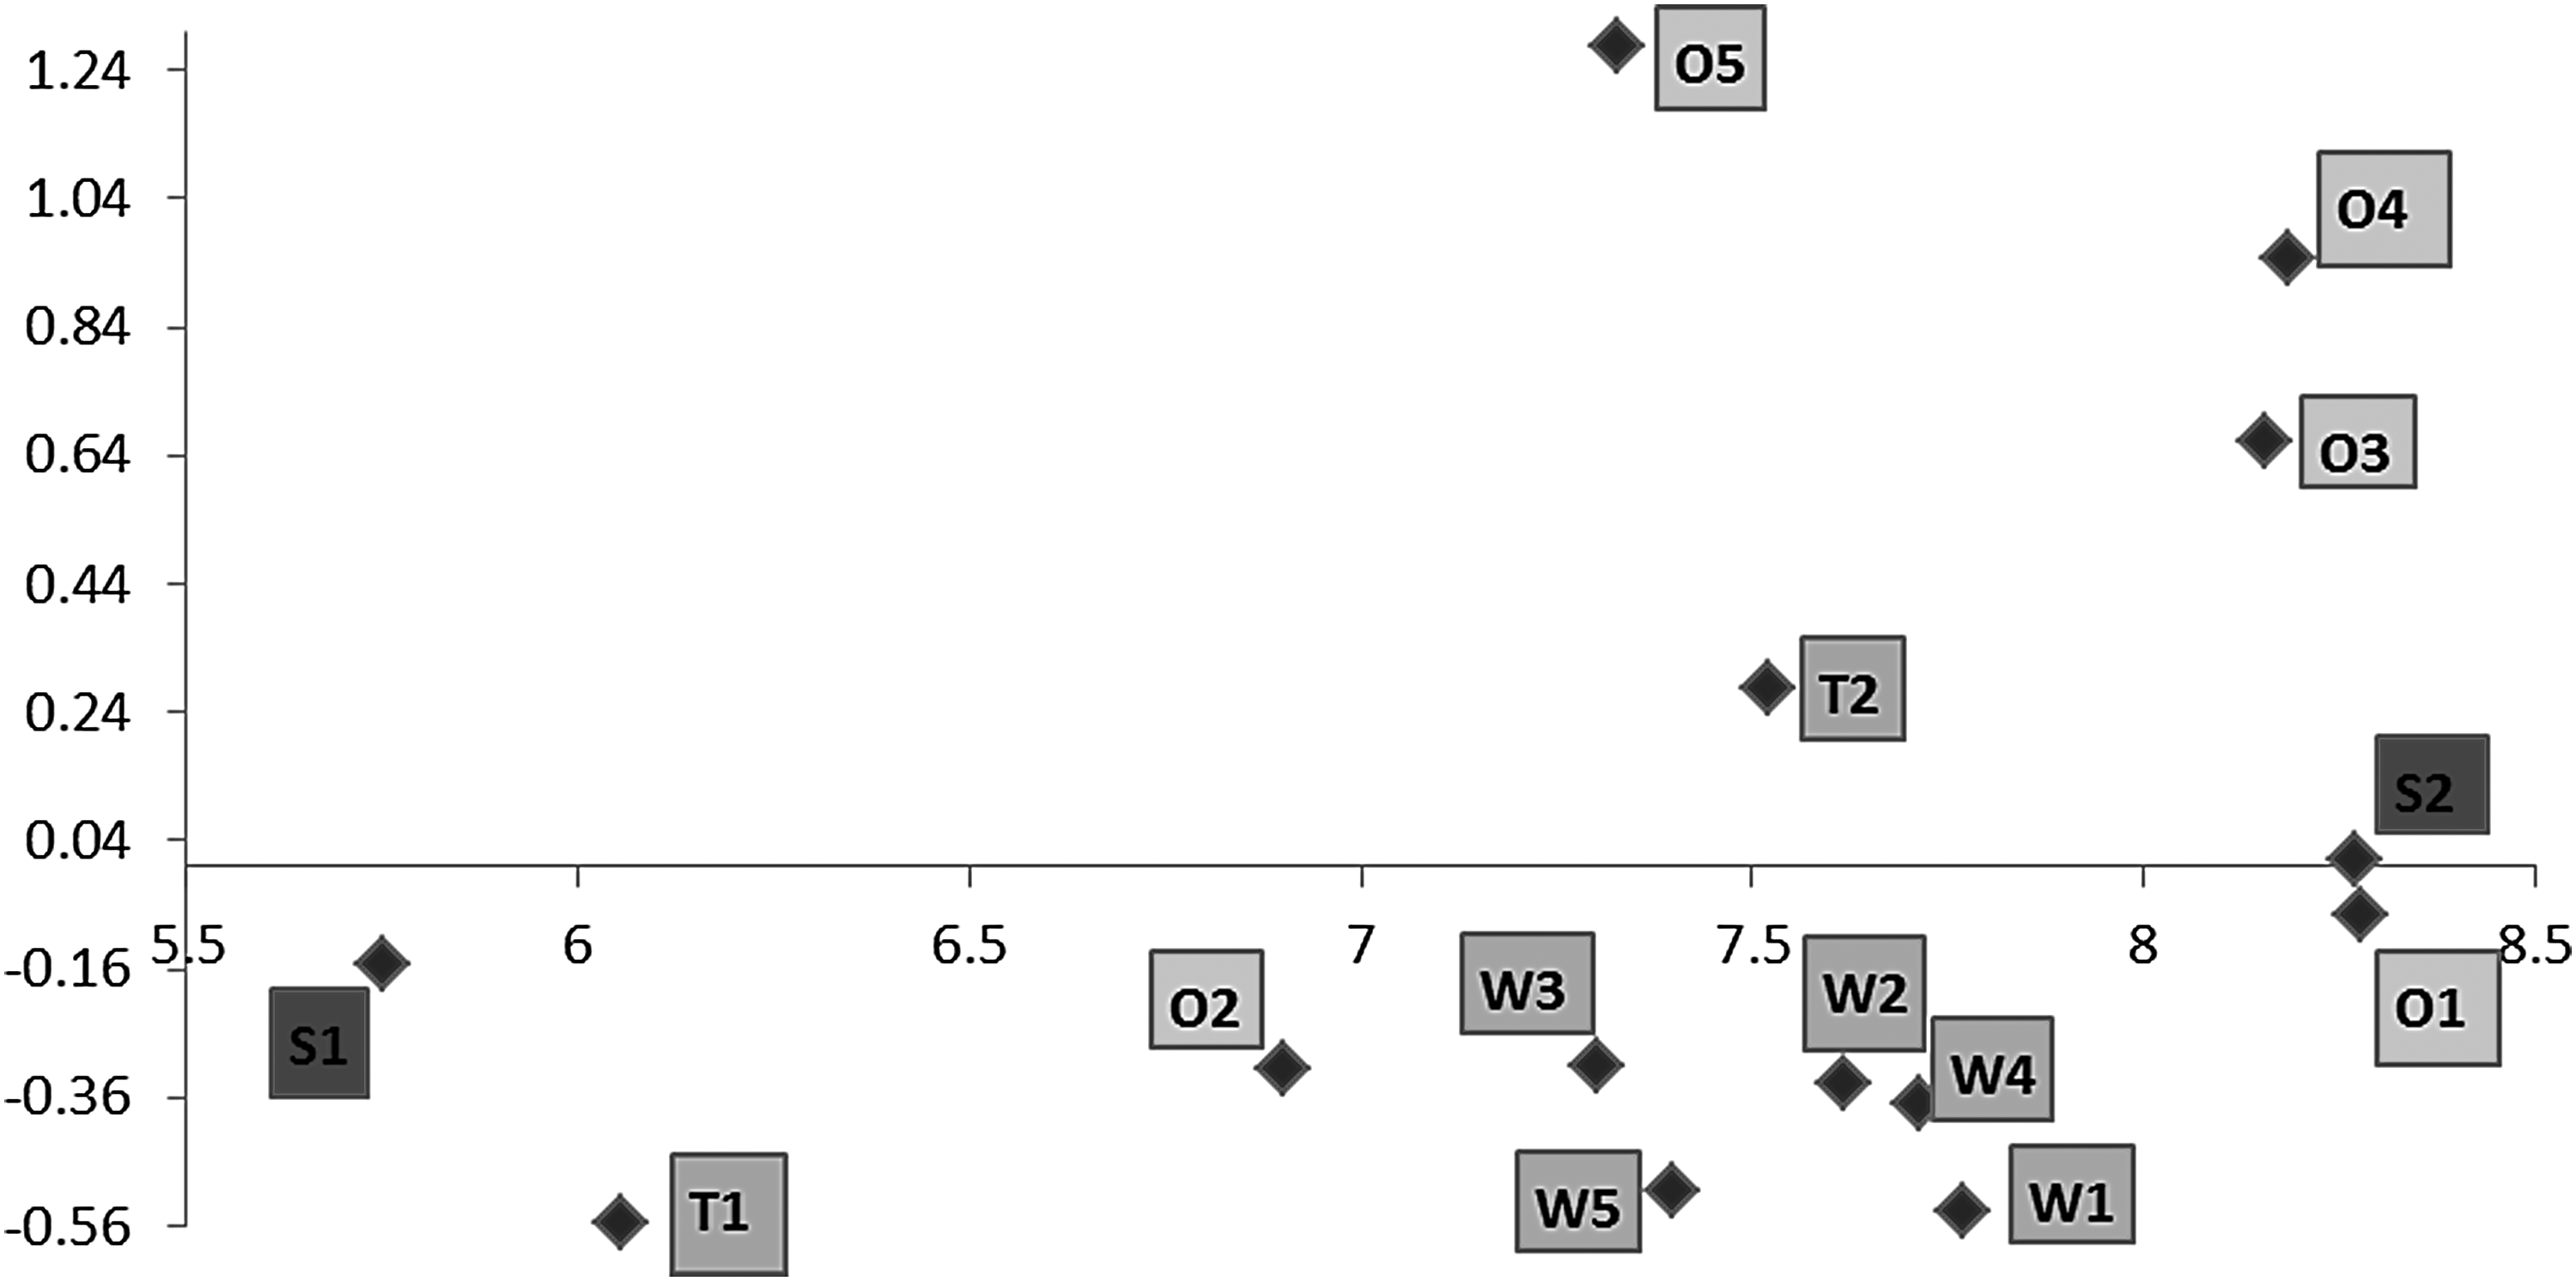
Impact relationship map of SWOT subfactors. SWOT, strength–weakness–opportunity–threat.
The impact of the SWOT subfactors was evaluated after determining the SWOT subfactors. Based on the outcome, experts were reinvited according to the structure of SWOT analysis to construct a strategic framework for implementing carbon labeling in Taiwan. The established strategic framework included 1 target, 4 strategies, and 14 subfactors. ANP questionnaires were drafted and executed by experts. The comments of experts were collected and calculated using Excel. The total weight is 1, respectively, for 4 strategies and 14 subfactors, the value of the weight could be regarded as the impact level (Fig. 2).
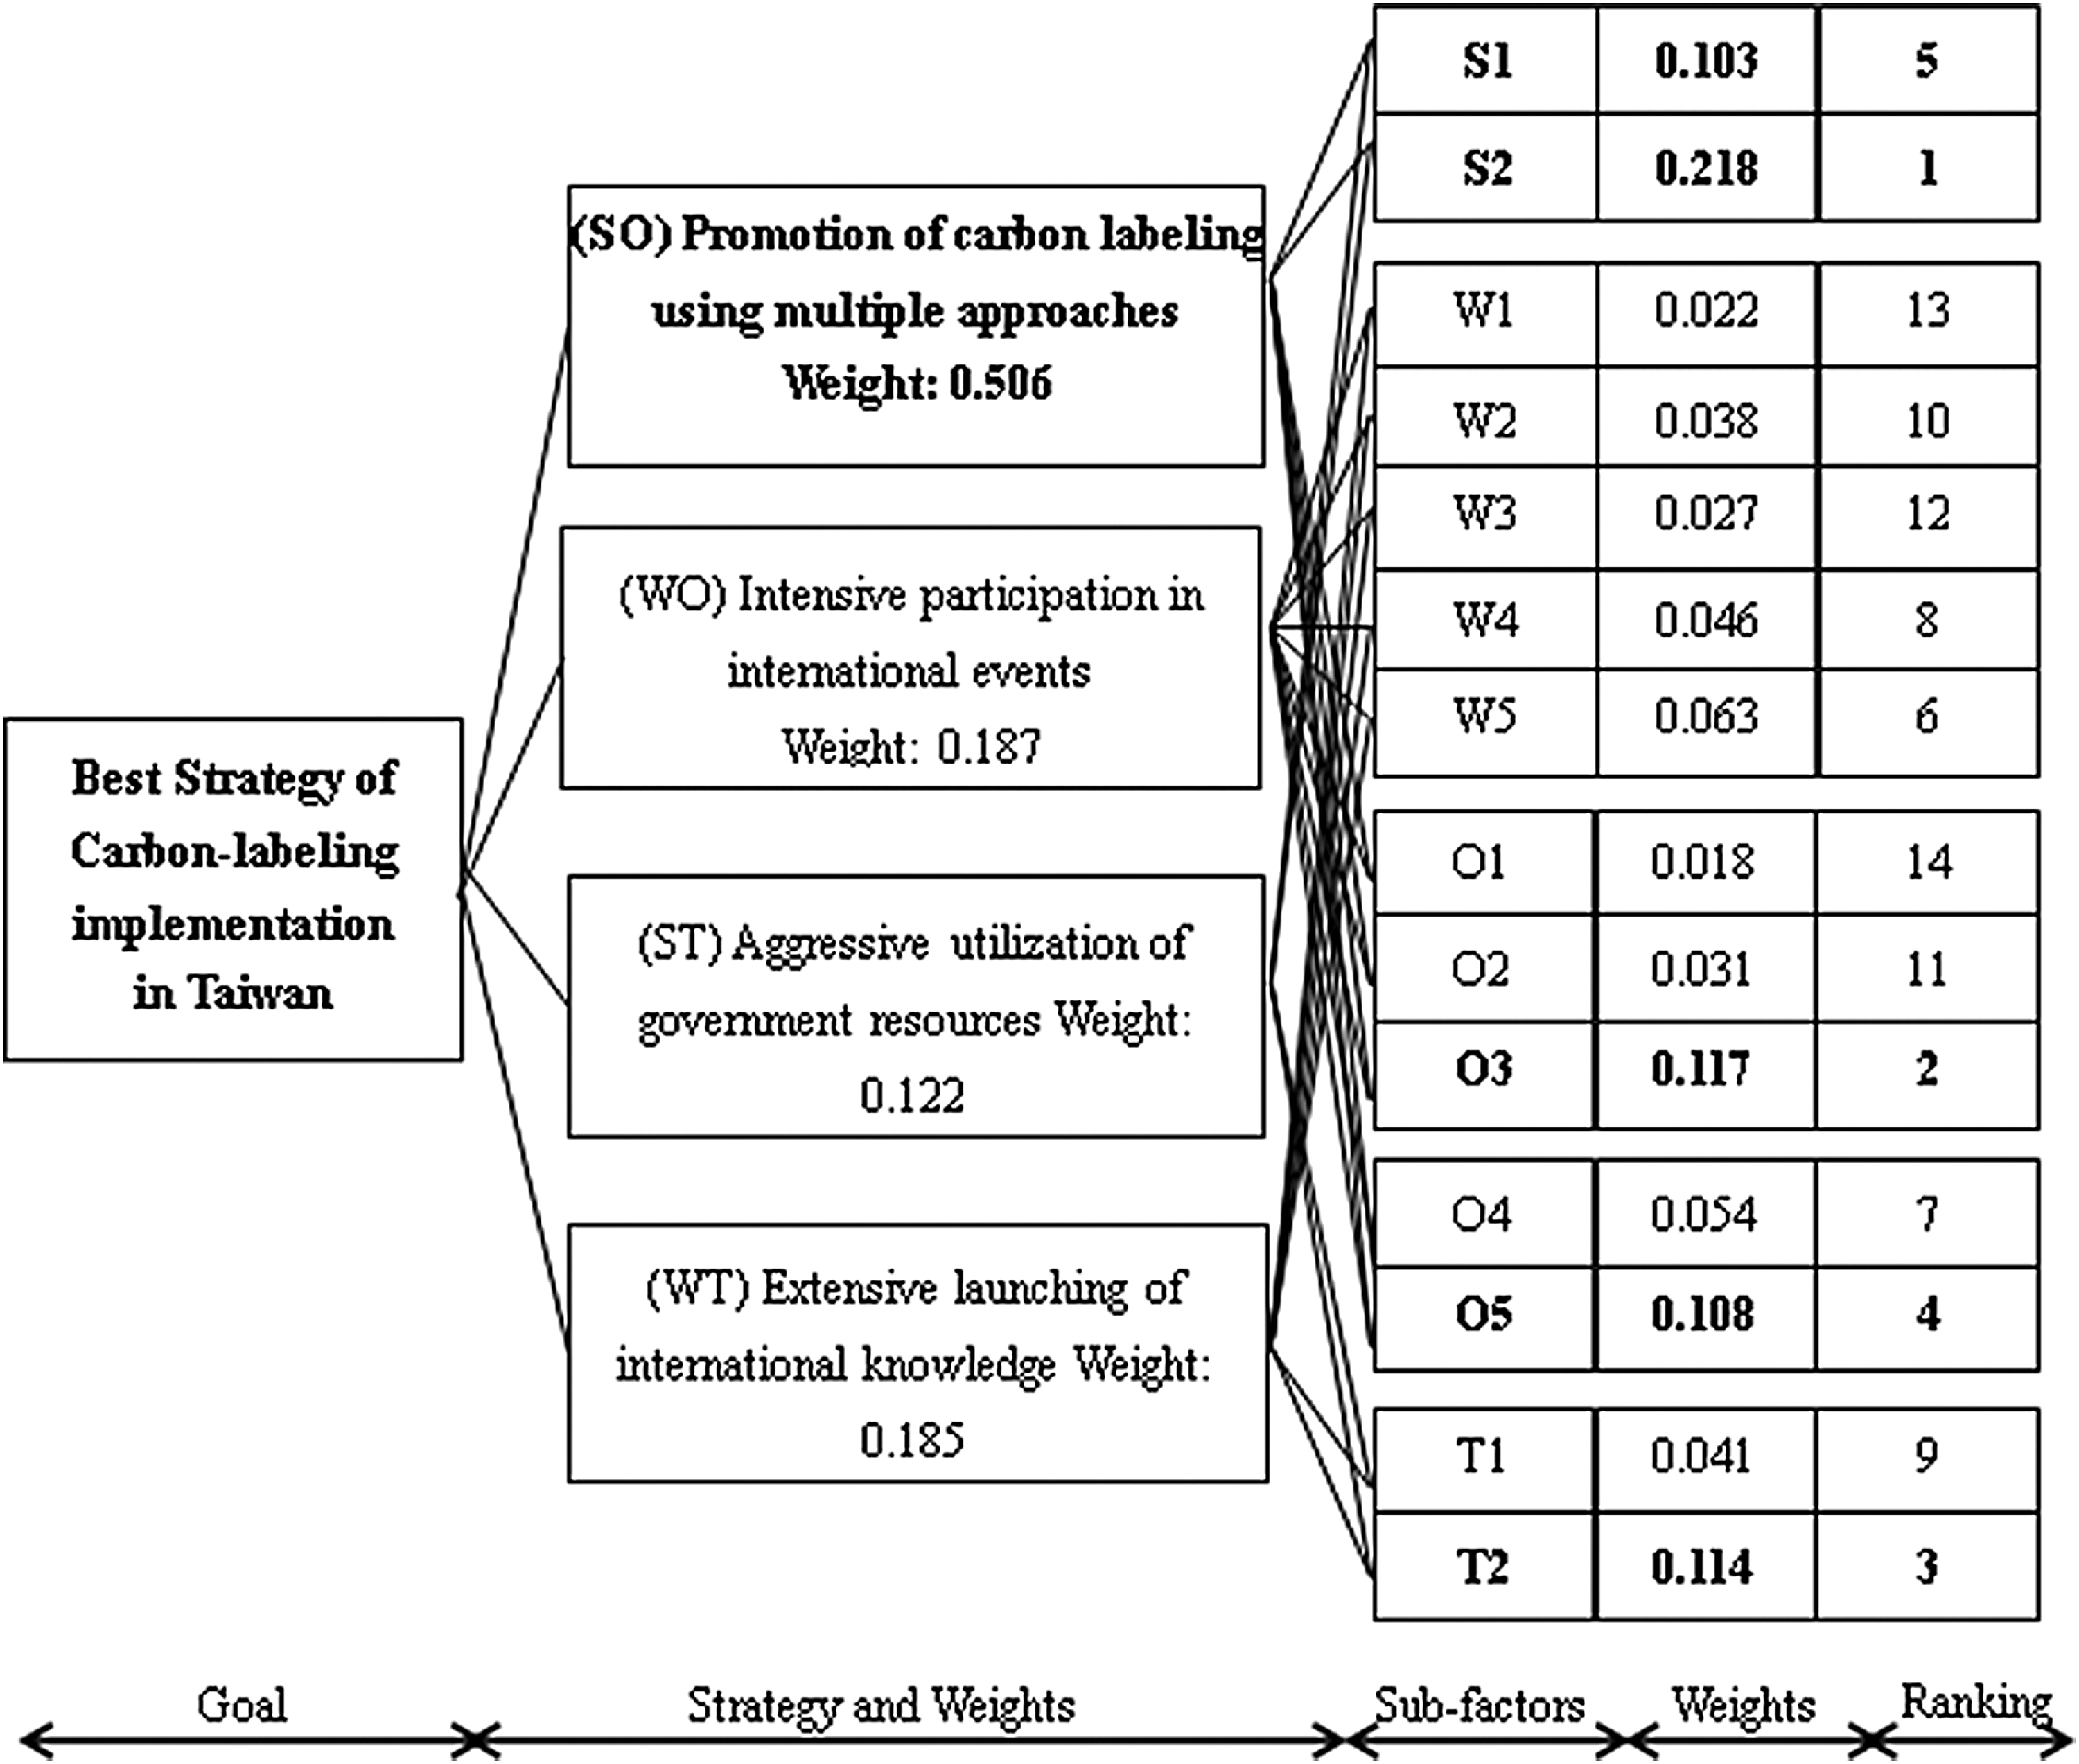
SWOT results of carbon-labeling implementation in Taiwan.
Results and Discussion
The weight of strengths in the SWOT strategies for implementing carbon labeling in Taiwan is 0.402. Hence, this factor is the top priority. The second priority is opportunities because of its weight of 0.285. When conducting strategies of carbon labeling in Taiwan, seizing external opportunities and cultivating internal strengths are foremost priorities. The niches of strengths and opportunities can be used to advance carbon-labeling policies.
The highest weight among the 14 subfactors is 0.218 of factor S2 (aggressive government promotion). This result signifies that government influence on spearheading this action is the most important source of motivational power to implement carbon labeling in Taiwan. The Legislative Yuan in Taiwan passed the “Greenhouse Gas Emission Reduction and Management Act” on June 15, 2015 (Tsai, 2017). This legislation demonstrates the commitment of Taiwan to protect the environment in line with the global trend of reducing CO2 emissions. Therefore, carbon-labeling implementation is no longer a slogan in Taiwan.
The weight (0.117) of factor O3 (buyer, customer, and government requests) is the second priority for the implementation of carbon labeling. According to global trends, foreign supplier or customer requests constitute an important driving force to implement carbon labeling. For example, the scheme of carbon emission disclosure of WalMart requires all its supply chains to disclose related data of carbon footprint. Delta Electronics Taiwan was ranked with the highest A-level in the Climate Performance Leadership Index of the 2014 carbon disclosure project. Delta is the only company in mainland China that was included in the index from nearly 2,000 listed companies. The weight (0.114) of T2 (difficulty in carbon-labeling inventory technique) is the third priority. Although 11 certification institutes are accredited by the Taiwanese government, carbon-labeling inventory experiences of the country's industries remain insufficient. The proficient training system on carbon footprint is similarly inadequate. Continuous government support to industries in terms of providing training and developing proficiency significantly contributes to the implementation of carbon labeling in Taiwan.
Based on ANP, the weights of four strategies, namely, promotion of carbon labeling using multiple approaches, aggressive utilization of government resources, intensive participation in international events, and extensive launching of international knowledge are 0.506, 0.187, 0.122, and 0.185, respectively. The SO strategy (promotion of carbon labeling using multiple approaches) with the weight of 0.506 is the best strategy. In Taiwan, the carbon-labeling system is conducted by the EPA. This system was under consultation beginning in 2009. The application for using product carbon footprint labeling (briefly called carbon labeling) was opened in May 2010.
The purpose of PCR is to establish environmental product declarations (EPD) of certain product categories under the same rule. PCR also facilitates fair comparison. EPD is created based on the quantitative assessments of environmental effects. Therefore, the carbon footprint calculation of products can be fairly compared based on the rule of PCR. Taiwan widely implements two kinds of PCRs, namely, EPD-PCR and carbon footprint of a product-PCR (CF-PCR). EPD-PCR is based on ISO 14025 and used to declare the environmental performance of products by companies (EPD). CF-PCR is a guide developed by The EPA Executive Yuan for implementing carbon-labeling policy in Taiwan.
Taiwan EPA drew up the incentives program for carbon-labeling products and involving the carbon reduction labeling into the Green Procurement of government agencies in 2017. It echoed with our research result. In addition, Taiwan EPA continues to be involved in international programs actively and making ongoing dialogue concerning Carbon Labeling Mutual Recognition Agreement (MRA) with Korea and Thailand under the framework of Asia Carbon Footprint Network. MRA will contribute to reduce the time and cost on certification and facilitate the economy and trade activities (Devereaux et al., 2006) to attain to the goal of environmentally sustainable development and share the fruits of economic prosperity.
Domestic research found that once a product obtained the carbon reduction labeling, its marketing share, profit, and revenue have shown a growth. It indicates that carbon labeling may bring the positive effect on a firm's operation. But the applicants have to go through a complicated carbon-labeling application process, streamlining the application process will help advance the development of carbon labeling (Wang, 2017). Approximately 324 products were given permission to use carbon labeling, whereas 14 products were given permission to use carbon reduction labeling, and there are 166 carbon emission factor database registrations until January 2018.
Conclusions and Perspectives
In this study, based on the SWOT structure, a quantitative method for drafting strategies was established, and the factors for carbon-labeling implementation in Taiwan were determined. The factors were confirmed using FDM decision-making tool. The relationships among factors were confirmed through DEMATEL, which facilitated the development of corresponding strategies. Finally, the SWOT–ANP method was employed in measuring the weights of strategies. Fourteen subfactors and four major implementation policies emerged from the expert questionnaires. The four major implementation policies were promotion of carbon labeling using multiple approaches (SO), intensive participation in international events, aggressive utilization of government resources, and extensive launching of international knowledge. The weight of SO was 0.506, which was the best weight among all strategies.
Results show that SO was the important policy and useful method to promote carbon labeling in Taiwan. The highest weight was the weight of factor S2, which signifies that government influence on spearheading this action was the most important motivational power. Hence, for EPA Taiwan, several work programs could be executed as follows: regular enhancement of publicity and organization of international large-scale seminars; strengthening the training and counseling and providing appropriate incentives to enterprises on application; frequent reinforcement of public knowledge on carbon labeling; and constant integration and public announcement of emission factors of carbon footprint. Thus, SO is the best strategy for promoting and implementing carbon labeling in Taiwan. This strategy could contribute to the reduction of global GHG emissions and the establishment of an efficient systemic decision pattern for followers.
This systemic research method can be used as a template for future researchers and can resolve the drawbacks of strategically qualitative research methods through quantitative methods. The implementation of carbon labeling in Taiwan was investigated from the governmental perspective. In future studies, other critical relevant parties, such as enterprises and consumers, can be included in the investigation. This development can improve the implementation of carbon labeling in Taiwan.
Footnotes
Acknowledgment
This study was supported by Taiwan EPA under the project of No.EPA-98-K102-02-98A200.
Author Disclosure Statement
No competing financial interests exist.