
Abstract
Abstract
Direct contact membrane distillation (DCMD) is a promising desalination technology for locations where low-cost energy (e.g., waste heat or geothermal energy) is readily available. Modeling of the DCMD process facilitates the optimization of membrane properties and module design for system performance. Since DCMD is a purely thermal process, membrane thermal conductivity, which greatly influences the conductive heat loss through membranes, plays an important role for DCMD modeling. Most researchers adopted the isostrain model when estimating the thermal conductivity of polyvinylidene fluoride (PVDF)-based membranes during modeling and very few actual measurements have been reported in literature to confirm the validity of these estimations. In this study, the transient plane source (TPS) method was used to measure the thermal conductivities of PVDF-based DCMD membranes and the observed values were compared to commonly used models, such as isostress and isostrain. Measurements showed the membrane thermal conductivity decreased with the increase of porosity at 23.5°C. Contrary to the practices reported in literature, the isostrain model showed a discrepancy of more than 200% from the TPS measurements whereas the isostress model provided the closest predictions. Overestimation of 49–80% from the isostress model was attributed to the Knudsen effect. Once the effect was incorporated, the Knudsen-corrected isostress model predicted the membrane thermal conductivity at 23.5°C accurately. Increasing temperature led to the departure between the Knudsen-corrected isostress model and the TPS measurements. Contribution of radiation conduction, which increases with temperature cubed and is not included in the isostress model, might have resulted in the deviation.
Introduction
M
Thermal conductivity of a sample can be quantified by either a time-dependent (transient) or steady-state method. Two transient methods (three omega and laser flash) and a steady-state method (Lees' disc) have been used to measure thermal conductivities of PVDF-based MD membranes (García-Payo and Izquierdo-Gil, 2004; Su et al., 2010; Li et al., 2014). Laser flash thermal analysis works by firing a laser pulse at the top of a sample and measuring the temperature rise on the opposite side to estimate thermal conductivity. It requires a sample that is homogenous with known specific heat capacity and density. The method also requires that the energy of the laser is completely (or very nearly) absorbed into the sample. These requirements make the laser flash an imperfect measurement tool for DCMD membranes, as the internal structure of a DCMD membrane can be extremely nonhomogenous (dos Santos et al., 2005; Su et al., 2010; Dumee et al., 2013; Ruoho et al., 2015). The three omega (3ω) method is based on the detection of a small third-harmonic voltage that is created while passing an alternating current at a frequency ω through a thin conductor in intimate thermal contact with the sample. When the oscillation generated from the resistive heating is coupled with the driving current, the result is a small 3ω voltage over the conductor. Thermal conductivity of the specimen can then be calculated from the frequency dependence of the oscillation amplitude and the phase of the 3ω voltage. Since this conductor functions both as a heater as well as a thermometer, the dimensions as well as the thermal properties of the conductor need to be known very precisely. The conductor is also required to be electrically insulated from the sample and this requirement can be easily met with polymer-based membranes (Hänninen, 2013; Li et al., 2014; Ruoho et al., 2015). The Lees' disc method uses the sample to separate a heat source from a cold sink. After a long period of time, the temperature of the hot side and cold side can be compared and the thermal conductivity of the sample determined (Sombatsompop and Wood, 1997; Price and Jarratt, 2002; García-Payo and Izquierdo-Gil, 2004). This method can provide extremely accurate measurements for large bulk samples, but when thin samples are used, a problem is developed. As the sample used becomes thinner, the temperature gradient across the sample drops (for a given heat flow) and the precision required in measuring the sample increases. It is a standard practice that multiple layers of thin samples must be used to satisfy the temperature gradient requirement for a precise reading. However, this multilayer procedure also injects uncertainty in terms of air-sample-air transitions. TPS also known as “hot disk” is a transient technique that was adopted to measure thermal conductivity of insulation materials (Johansson et al., 2012; Coquard et al., 2013; Notario et al., 2015). This technique, however, has not been used to measure thermal conductivities of MD membranes. TPS works by using a thin sensor/heater combination sandwiched by (if solid) or buried/submerged within (if powder or liquid) the sample. The sensor is a metallic film (generally nickel) deposited in a double spiral pattern between layers of a polymer, such as Kapton. The machine simultaneously sends an electrical current through the sensor, while monitoring its electrical resistance by a Wheatstone bridge inside the machine. This allows the machine to use the sensor as the heat source and to measure, with extreme precision, the temperature of the sensor with respect to time. As the sensor heats up, the sample begins to conduct heat away from itself at a rate that is directly dependent on the thermal conductivity of the sample. This allows a rapid, direct analysis of the thermal conductivity, which is blind to the thermal diffusivity and density of the sample (Ahadi et al., 2016; Zhang et al., 2017). This newer technique provides some distinct advantages to researchers working with thin samples because it is also capable of accurately measuring samples down to a thickness of 10 μm, with thermal conductivities ranging from 0.01 to 5 W/m-K (Thermtest: Thermtest Inc., 2015).
Most research groups, however, do not have access to any thermal conductivity measurement systems and must, therefore, infer the thermal conductivities of the membranes by models. Isostrain [Eq. (1)] is the most commonly used model for estimating the thermal conductivities of DCMD membranes (Gryta and Tomaszewska, 1998; Martinez-Diez et al., 1998; Curcio and Drioli, 2005; Bonyadi and Chung, 2007; Bui et al., 2010; Bahmanyar et al., 2012; Zhang et al., 2012; Li and Sirkar, 2016; Deshmukh and Elimelech, 2017; Johnson and Nguyen, 2017; Ghaleni et al., 2018). Isostress [Eq. (2)] and flux law [Eq. (3)] models are also employed in some studies (Phattaranawik et al., 2003; Lee et al., 2015). The flux law model is also called the Maxwell (Type I) model. These models are listed below:
where keff is the effective thermal conductivity of the membrane, ϕ is the membrane porosity, ka is the thermal conductivity of air, and kp is the thermal conductivity of the membrane polymer. Isostrain and isostress models are also referred to as the parallel and series models, respectively. The parallel (isostrain or resistance in parallel) model assumes a membrane structure ordered in such a way that the air and polymer layers are evenly spaced and oriented in the direction of the heat flux. The series (isostress or resistance in series) model instead assumes the air and polymer layers to be oriented in series, perpendicular to the heat flux (Hitsov et al., 2015). For the flux law (Maxwell, Type I) model, membrane polymer is assumed to be noninteracting particles randomly distributed in a homogeneous medium of air (García-Payo and Izquierdo-Gil, 2004). These models were originally developed to estimate mechanical properties of composite materials and were used for the estimation of membrane thermal conductivity out of practicality (Marom et al., 1978; Ravichandran, 1994; Smith and Hashemi, 2006). With widespread adoption of these models, very little direct measurement has been done to confirm the validity of these estimations for DCMD membranes (Izquierdo-Gil et al., 1999; Su et al., 2010; Li et al., 2014).
Materials and Methods
Membrane fabrication
Flat-sheet membranes for this research were formed by nonsolvent-induced phase separation. The polymer (dope) solution for membrane fabrication consisted of 12 weight percent (wt%) of polyvinylidene fluoride, PVDF (average molecular weight of 534 kDa from Sigma-Aldrich, St. Louis, MO) as the membrane material, 12 wt% of ethylene glycol (Sigma-Aldrich) as the pore-forming agent, and 76 wt% of 1-methyl 2-pyrrolidinone, NMP (VWR, Randor, PA), as the solvent. Components for the solution were measured, mixed together in a screw top-lidded glass jar and placed in an oven at 70°C for 24 h before being mixed again and placed in a room temperature vacuum chamber to degas for 2 h.
The homogenized polymer solution was then cast onto a plate glass substrate with a doctor blade (MTI Corp., CA) that was set at a thickness of 250 μm. The substrate, with the membrane solution cast on it, was then submerged into a coagulation bath for 45 min to undergo phase exchange and allow the membrane to form. The composition of the nonsolvent in the coagulation bath varied based on the desired membrane characteristics (described in Membrane Characteristics section), as shown in Table 1. They included a mixture of NMP and deionized water, pure deionized water, and a mixture of deionized water and isopropyl alcohol, IPA (PL Developments, Clinton, SC). The solidified membrane was then extracted from the bath and placed into a deionized water bath (Millipore Sigma, Billerica, MA) for 24 h to extract any remaining solvent before being dried.
Membrane Coagulant Compositions and Expected Pore Structures
The proportion of the sponge layer in SM2 would be larger than that in SM1.
IPA, isopropyl alcohol; NMP, 1-methyl 2-pyrrolidinone.
Membrane characterization
Dry membranes were sectioned, fractured, while submerged in liquid nitrogen, and then secured onto a sample holder by carbon tape and sputter coated with platinum. After the completion of sample preparation, the membranes were then analyzed using scanning electron microscopy, SEM (HITACHI S3200-N; HITACHI, Tokyo, Japan), to collect data on the membrane thickness as well as microstructure and macrostructure characteristics.
Porosity was determined by first weighing the dry membrane on a Mettler-Toledo (Columbus, OH) balance. The membrane was then placed in an ethanol bath to wet for 18–24 h before being placed in a deionized water bath to exchange the ethanol with water for 24 h. The membrane wetted with water was then massed using the balance and a porosity (ϕ) can be determined using Equation (4).
where Mw is the mass of the wetted membrane, Mm is the mass of the dry membrane, ρw is the density of the wetting liquid (i.e., water) at 25°C, and ρm is the density of the membrane matrix material (i.e., PVDF).
Mean pore size and pore size distribution of the PVDF membranes were determined using capillary flow porometry (Quantachrome 3G zh, Boynton Beach, FL), which has a through-pore size range from 0.013 to 500 μm. Membrane samples of 25 mm in diameter were first wetted with Porofil® (Quantachrome, 2016). The wetted membranes were then installed onto the sample holder for the porometry analysis.
Thermal conductivity in dry air was measured using a Thermtest TPS 2200 (Thermtest, New Brunswick, Canada) equipped with a thin-film module. The sensor employed for the measurement of membrane thermal conductivity was a TPS thin film sensor (Sensor No. 7854) with Kapton insulation. The sensor has a radius of 10.48 mm and a maximum operating temperature of 50°C (Thermtest: Thermophysical Instruments, 2018). A general schematic of the sensor can be found elsewhere (Notario et al., 2015). Before thermal conductivity testing could begin, the sensor had to be characterized at the measurement settings used for the thin film or membranes to yield a sensor-characteristic thermal conductivity (e.g., 0.0526 W/m-K for the setting of 80 s at 120 mW). The sample membrane was first positioned underneath the sensor, on top of a Pyrex plate (L × W × H: 75 mm × 75 mm × 13 mm). The membrane was then folded over the sensor to completely encapsulate it and an identical Pyrex plate was placed on top. Finally, a 1-kg brass weight was placed on top of the whole assembly to assure good contact between the Pyrex and membrane, and membrane and sensor. Multiple measurements of the thermal conductivity were completed for each batch of membranes to estimate the mean and standard deviation. The thermal conductivity of PVDF was also estimated in a similar manner using solid PVDF sheets of 76 μm thickness and a measurement setting of 40 s at 1 W. For thermal conductivity measurements at temperatures above the room temperature, the sensor/sample assembly was placed in a constant temperature incubator (Fisher Scientific, model: Isotemp) and equilibrated with the target temperatures before commencing the measurements.
There was a concern that the 1 kg weight placed on top of the samples would significantly alter the membrane pore structures, thereby impacting the measurement of thermal conductivity. To investigate this potential effect, thermal conductivity testing was run using a series of lighter weights to reduce the compressive effect on the membranes during testing. Loads ranged from no weight on the membrane (except for the Pyrex backing plate) to 1 kg in 250-g increments. At each weight arrangement, six measurements were performed with the setting of 80 s at 120 mW.
To ensure that the membrane pore structures were comparable to those for DCMD, water flux tests with the fabricated membranes were conducted as described in the Supplementary Data. A DCMD setup shown in the Supplementary Figure S1 was employed for the testing. Deionized water was used as the hot feed for the water flux experiments.
Results and Discussion
Membrane characteristics
Four types of PVDF membranes with different pore structures were fabricated by varying the composition of the nonsolvent used for phase separation. The intention was to vary the membrane porosity progressively from 0.4 to over 0.8 through the change of membrane pore structure so that the correlation between porosity and associated thermal conductivity could be evaluated. Figure 1 shows the SEM images of the membranes from the fully sponged structure (S membrane), through a combination of sponged and macrovoided structures (SM2 and SM1 membranes), to the fully macrovoided structure (M membrane). The rate of phase separation is of great importance to the final structure of the membrane and depends heavily on the composition of the nonsolvent. For the S membrane, the phase inversion or separation was extremely slow (i.e., delayed demixing) due to the relatively low difference in the NMP concentration between the dope solution and the nonsolvent. This slow rate of diffusion allowed for a dense, more crystalline membrane structure referred to as the “sponge” layer. The M membrane is opposite to the S membrane where phase inversion happened rapidly (i.e., instantaneous demixing) because the concentration gradient of NMP between the dope solution and the nonsolvent was very high. Instantaneous demixing coupled with rapid fluid diffusion manifested as large voids inside the membrane referred to as “macrovoids,” with supporting structures made of very small pores. The two membranes of moderate porosity were coagulated in a bath made of part deionized water and part IPA. The difference in solubility parameters between PVDF and water is much greater than that between PVDF and IPA, suggesting that water has a much higher tendency to induce instantaneous demixing of PVDF (Sukitpaneenit and Chung, 2009). Consequently, a higher IPA proportion in the nonsolvent would intensify delayed demixing and promote a higher percentage of sponge-like membrane structures, as shown in the SM2 membrane.

Cross-sectional morphology of PVDF-based flat-sheet membranes
Membranes with a higher proportion of macrovoids should have a higher porosity due to the large empty regions of the membrane. Table 2 shows the porosity, thickness, and thermal conductivity of the fabricated membranes for this study. Indeed, the M (fully macrovoided) membranes exhibited a porosity more than doubled that of the S (fully sponged) membranes. Researchers have theorized that macrovoids inside a DCMD membrane would result in increased water flux due to the reduced membrane tortuosity. This type of structure could also lower thermal conductivity because a large volume of air, which is substantially less thermally conductive than PVDF, was trapped in the macrovoids (Wang et al., 2011; Wang and Chung, 2015). The varying membrane thickness observed under the same casting conditions was probably due to different degrees of membrane contraction during the drying process as a result of the pore structures. This variation, however, does not affect the values of the membrane thermal conductivity, which is an intrinsic property.
Membrane Characteristics
Nominal dimensions estimated from the SEM images.
Measured at 23.5°C.
Compression testing
Membranes were tested at 0, 250, 500, 750 g, and 1 kg of weight to evaluate how the membrane conductivity varied against the compression loading applied. All loads have been converted into pressure and include the weight of the top Pyrex plate. Figure 2 shows the effect of compression loading on the measured thermal conductivity for the SM2 membranes at 23.5°C. The results suggested that there is a very weak correlation between the compression loading and the measured thermal conductivity. The average thermal conductivity measured under the 1-kg load condition was statistically higher (one-sided test with 5% level of significance) than that measured under the no-load condition by ∼0.0029 W/m-K. This increase was probably due to the compression of the membrane pore structure and/or better contact between the membrane and the sensor. In this study, measurements with 1-kg loadings (recommended by the manufacturer) were reported without correction for the compression effect because the differences were very small, relative to the magnitude of thermal conductivities observed.
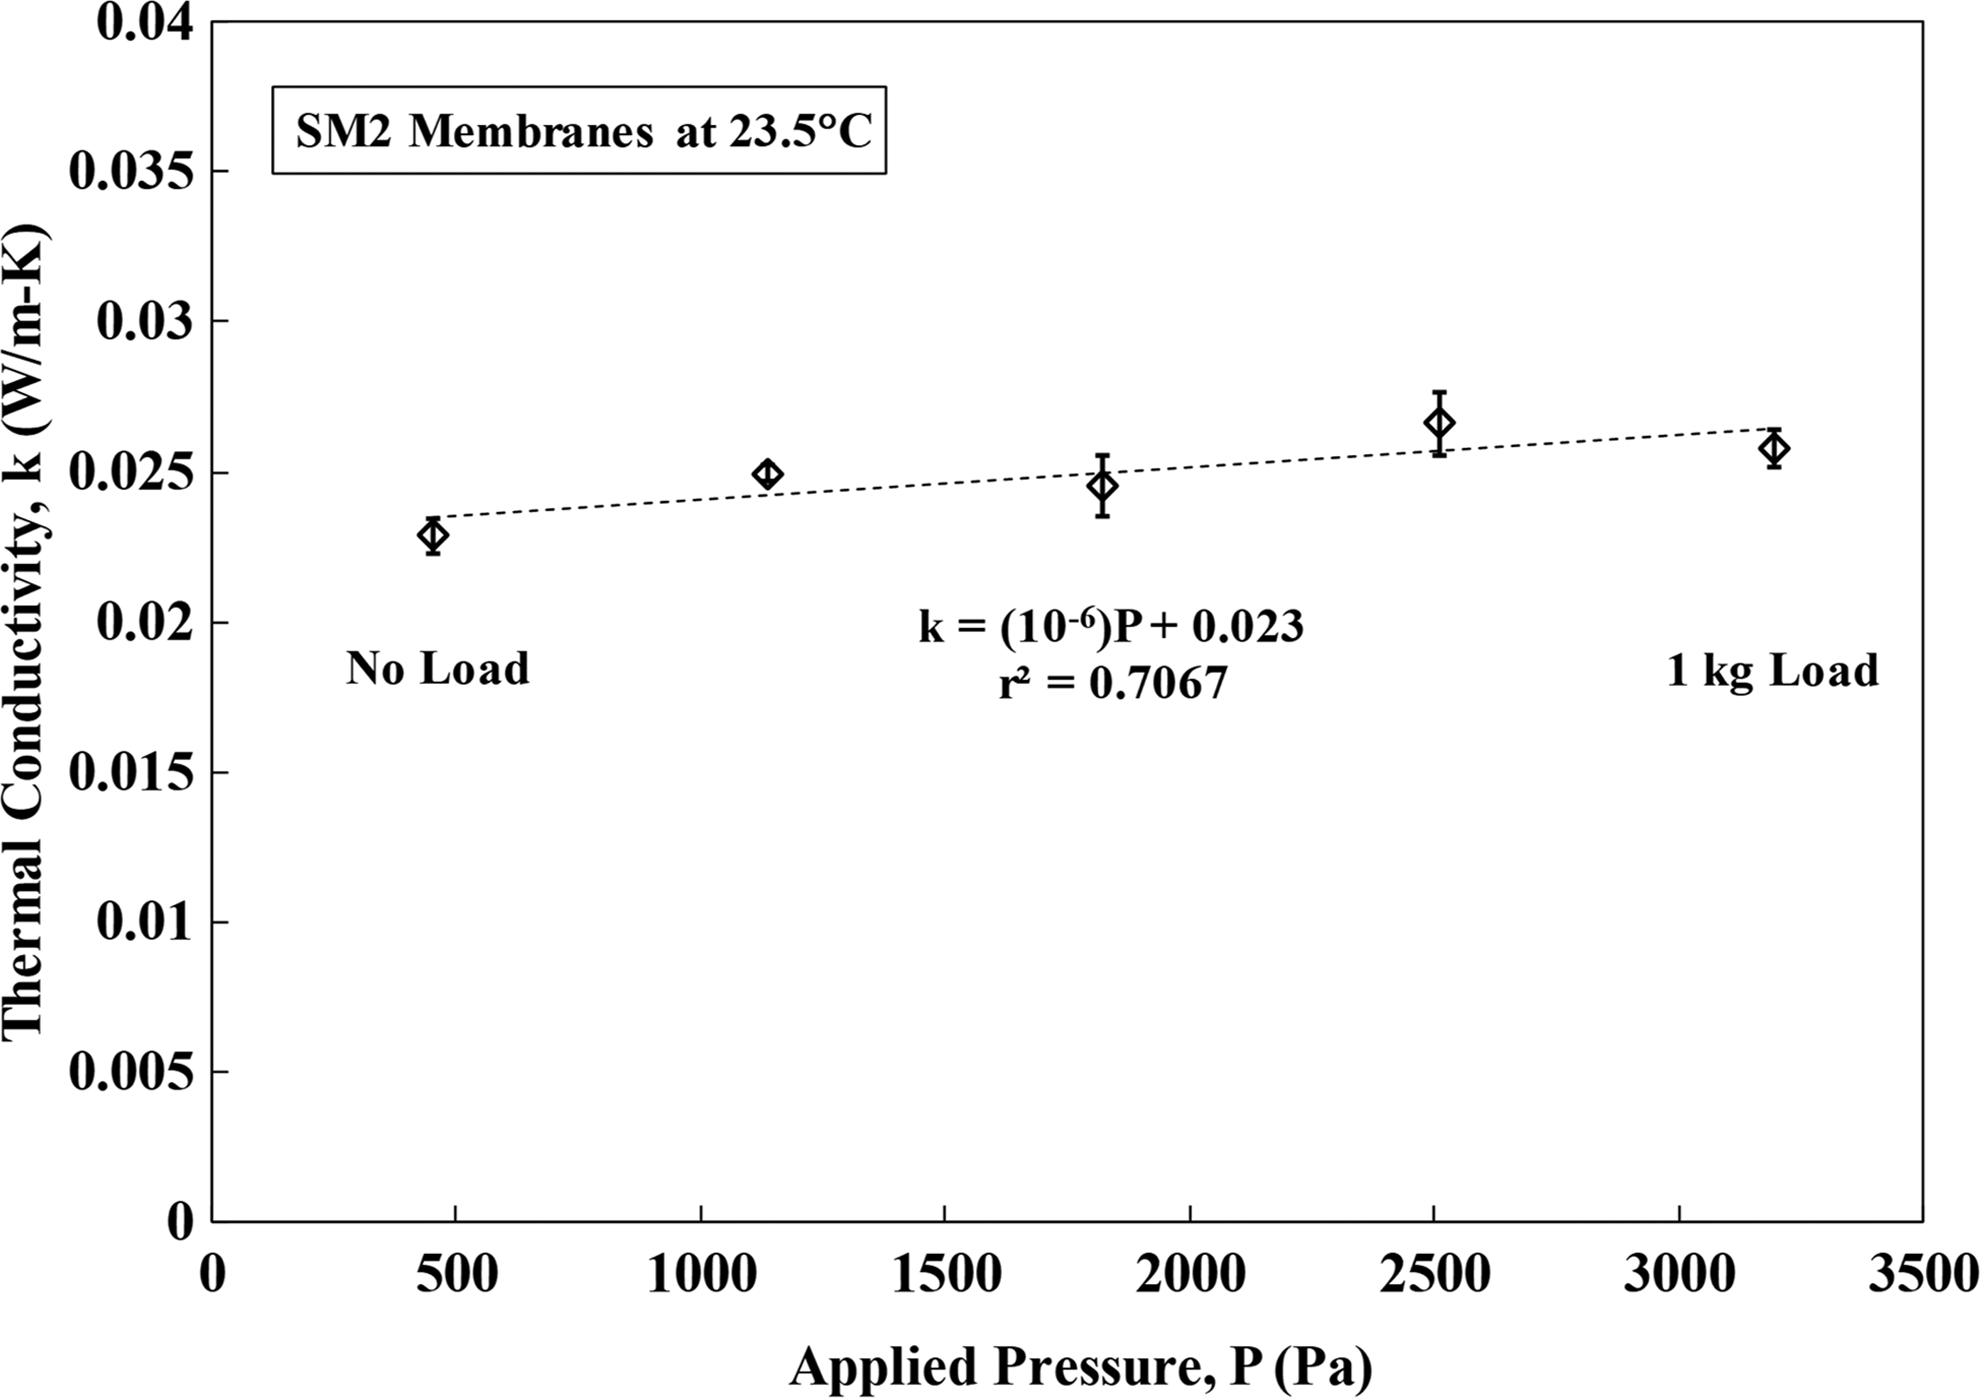
Effect of compression loadings on thermal conductivity measurements of the SM2 membrane at 23.5°C.
Thermal conductivity
Analysis of thermal conductivity in the following sections for PVDF-based MD membranes focused on
Assessing the difference between the TPS measurements (in this study) and the predictions from commonly used models as a function of membrane porosity or temperature,
Comparing the Lees' disc measurements reported at 50°C with the scaled TPS values for measurement validation, and
Evaluating the potential contribution of the Knudsen effect on thermal conductivity.
Measurements and model predictions
Measured thermal conductivities at 23.5°C were linearized (R2 = 0.985) over the porosity range tested and the empirical relationship is listed as Equation (5), where keff and ϕ are the effective thermal conductivity and porosity of the membrane, respectively. The linearity is a practical fit for analysis and is not theoretically justified. It is expected that over the full porosity range, the thermal conductivity will follow a nonlinear trend, converging to that of solid PVDF at porosity of zero and that of dry air at porosity of one.
Measured values were compared to the predictions estimated from the commonly used isostrain [Eq. (1)], isostress [Eq. (2)], and flux law [Eq. (3)] models as shown in Fig. 3. Thermal conductivity of PVDF was measured to be 0.165 W/m-K at 23.5°C, which is close to 0.181 W/m-K reported in literature (Phattaranawik et al., 2003). Thermal conductivity of bulk dry air was calculated to be 0.0256 W/m-K at 23.5°C based on the relationship presented in literature as shown in Table 3 (Lide, 2003; Phattaranawik et al., 2003). These values were then used in the model predictions of thermal conductivity for the PVDF membranes. The results of the thermal conductivity measurements were somewhat surprising. At high porosities (>0.6), the measured thermal conductivity was consistently lower compared with bulk dry air, while the predictions from the isostress, flux law, and isostrain models were approaching that of bulk dry air, as confined by the models. It was hypothesized that the Knudsen effect commonly observed in aerogels might have rendered the thermal conductivity of air in the membrane pores lower compared with bulk dry air. At high porosities where the gas-phase thermal conductivity has a greater contribution to the overall thermal conductivity, this reduction could result in the measured membrane thermal conductivity being lower compared with bulk dry air. Detailed analysis of the Knudsen effect is described in the Knudsen Effect section below. For model predictions, the isostress model was much closer to the measured values than the isostrain and flux law models. However, the deviation from the measured values at 23.5°C was still significant at 49–80% over the porosity range commonly observed for DCMD membranes.
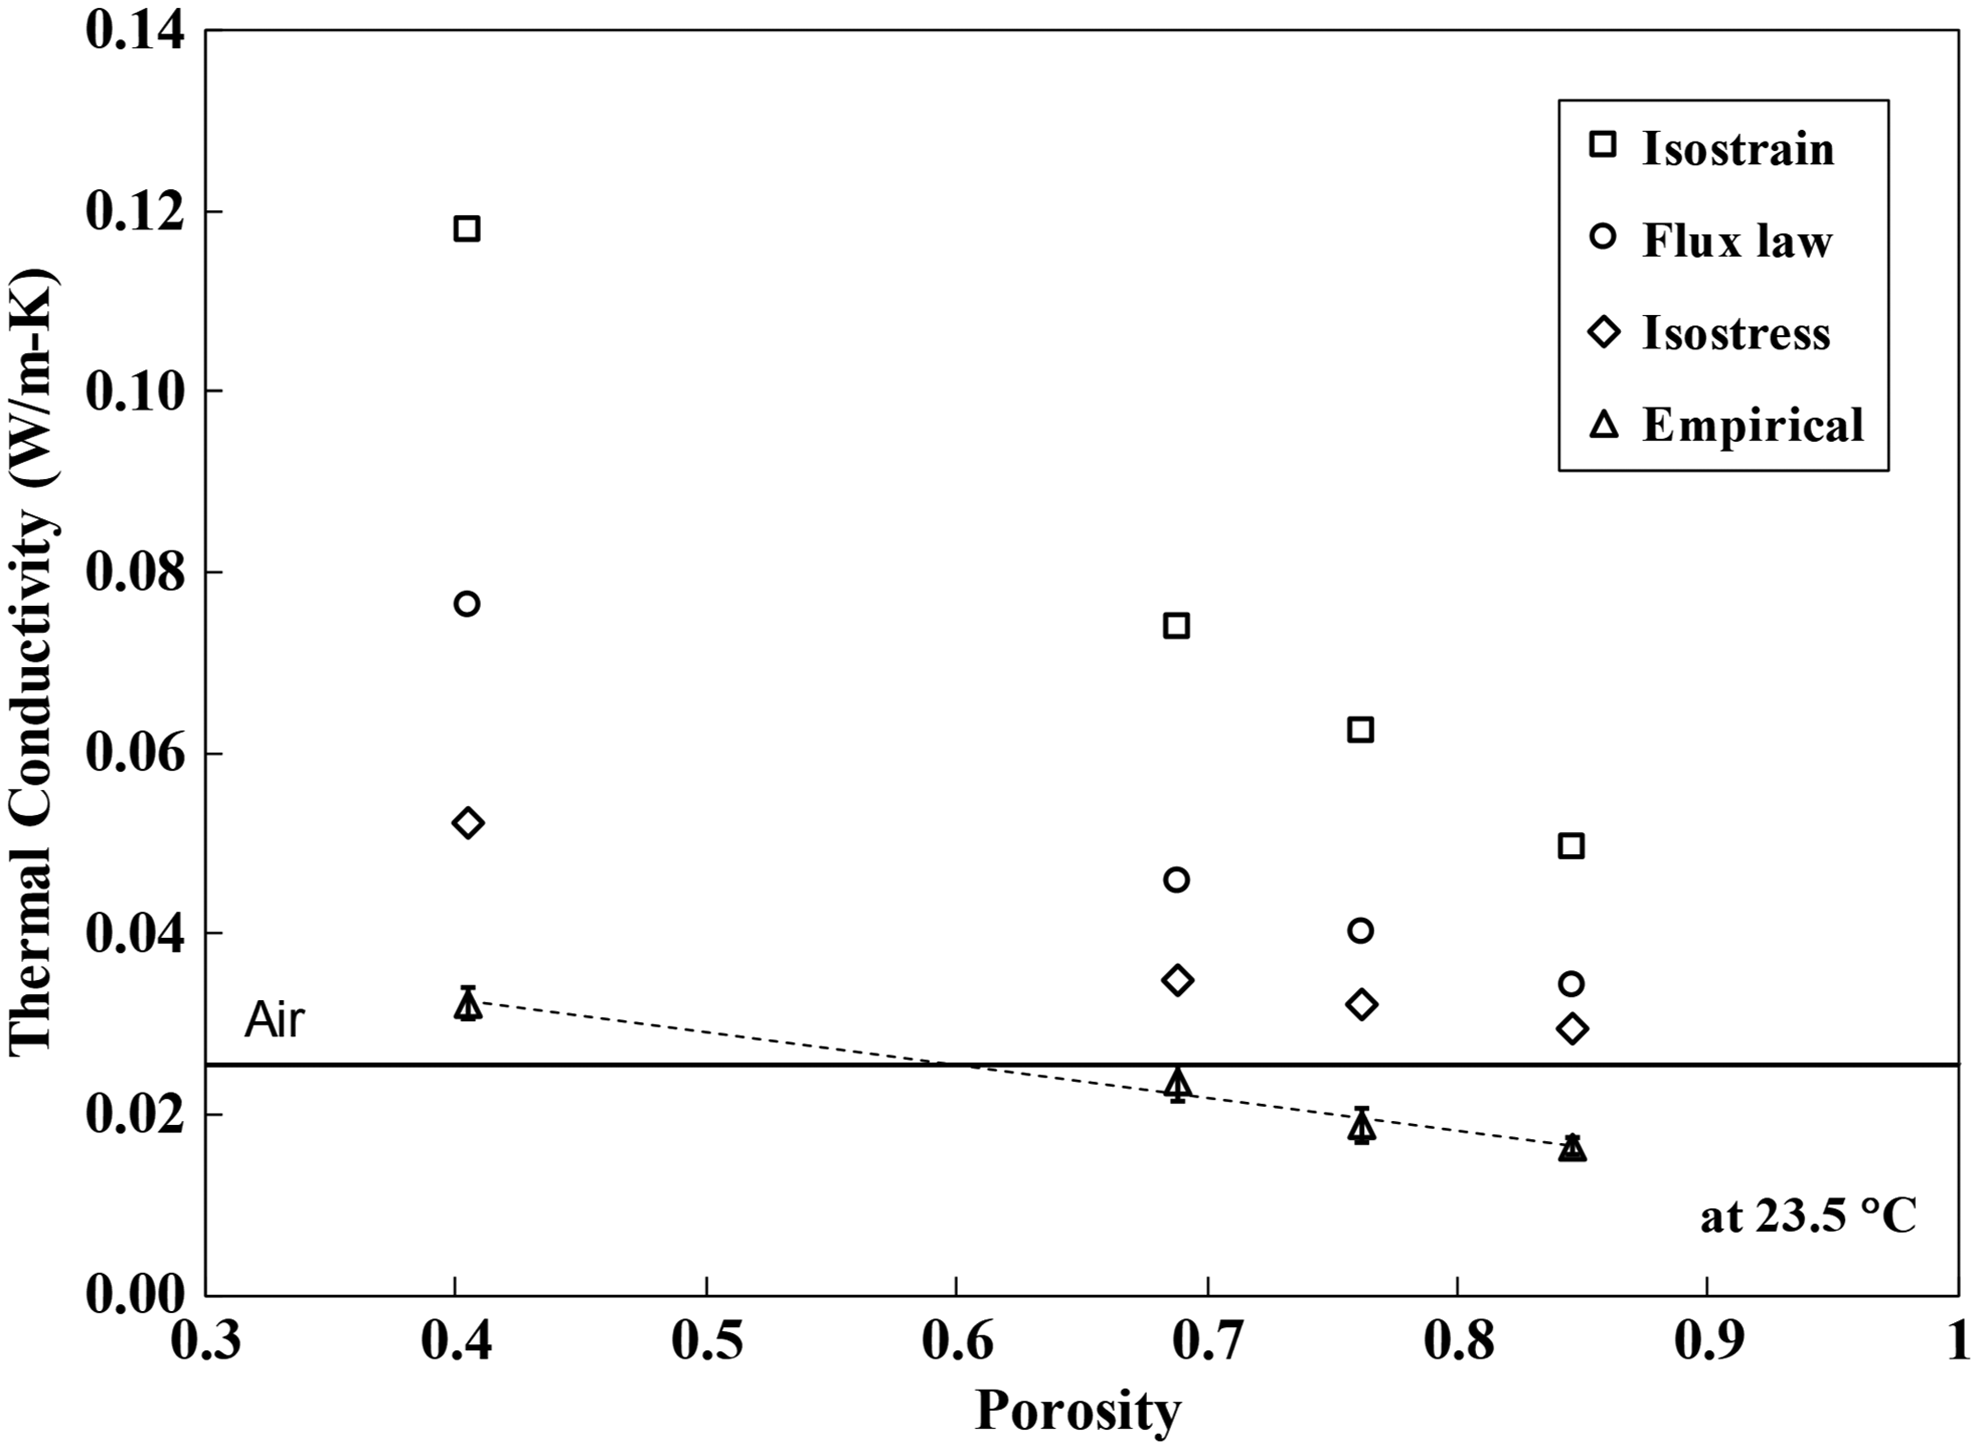
Membrane thermal conductivity with respect to porosity for TPS measurements and the predictions from isostrain, isostress, and flux law models at 23.5°C. TPS, transient plane source.
Correlations Between Thermal Conductivity and Temperature
k in W/m-K, T in °C. The linearity is a practical fit for analysis based on the literature data and is not theoretically justified.
Based on references Phattaranawik et al. (2003) and Lide (2003) for a temperature range of 23–75°C (r2 = 0.996 for bulk dry air).
Based on references Lide (2003) and Su et al. (2010) for a temperature range of 27–87°C (r2 = 0.999).
Based on TPS measurements between 23°C and 48°C (r2 = 0.97) in Fig. 4. Sensor tolerance is 50°C.
PVDF, polyvinylidene fluoride; TPS, transient plane source.
Temperature dependence of the membrane thermal conductivity was also investigated on the SM2 membrane, which has an asymmetric pore structure similar to those used in DCMD studies (Sukitpaneenit and Chung, 2009; Huang et al., 2018). Figure 4 shows an increase of thermal conductivity with temperature for the TPS measurements and the corresponding model predictions. It is interesting to note that even though the isostress model had a 49% deviation from the TPS measurement at 23.5°C, the gap was narrowed down to within 12% as the temperature was raised to 48°C. Contributions from the Knudsen effect and the radiation conduction (described in Knudsen Effect section), which were not considered in the isostress model, might have let to the empirical observations.
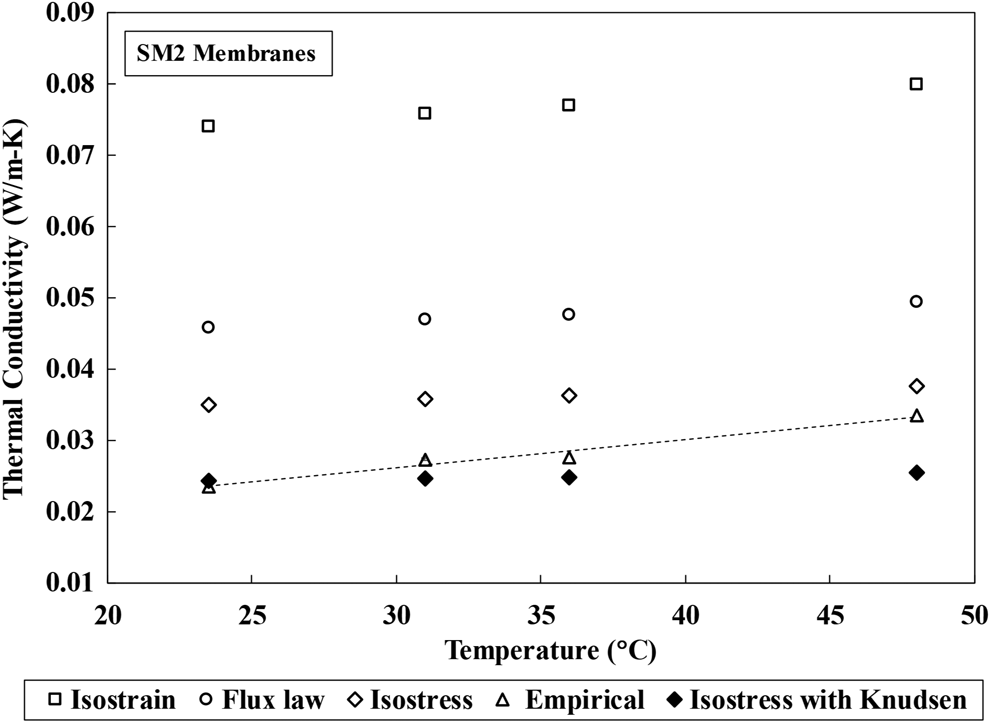
Thermal conductivity of the SM2 membrane with respect to temperature for the TPS measurements, predictions from the isostress model with the Knudsen effect, and predictions from the isostrain, isostress, and flux law models without the Knudsen effect.
When modeling the performance of DCMD membranes, most researchers adopted the isostrain (parallel) model to estimate the thermal conductivity of membranes (Gryta and Tomaszewska, 1998; Martinez-Diez et al., 1998; Curcio and Drioli, 2005; Bonyadi and Chung, 2007; Bui et al., 2010; Bahmanyar et al., 2012; Zhang et al., 2012; Li and Sirkar, 2016; Deshmukh and Elimelech, 2017; Johnson and Nguyen, 2017; Ghaleni et al., 2018). Very few actual measurements of thermal conductivity have been reported in literature (García-Payo and Izquierdo-Gil, 2004; Su et al., 2010; Dumee et al., 2013; Li et al., 2014). Table 4 shows the measurements of thermal conductivity for PVDF-based DCMD membranes reported in literature (Lees' disc method and 3ω technique) and in this study (TPS method) (García-Payo and Izquierdo-Gil, 2004; Li et al., 2014). The temperature-scaled TPS measurements in this study were in good agreement with the reported Lees' disc measurements at 50°C, which supported the validity of the measurements in this study. For the corresponding model predictions, the isostress model matched nicely with the Lees' disc measurements, while the isostrain model overestimated the membrane thermal conductivities significantly, as was observed in this study. To compare the TPS measurement (at 23.5°C) in this study to Lees' disc measurements (at 50°C), Equation (5) was used to estimate the membrane thermal conductivities at 23.5°C for the porosities (i.e., 0.62 and 0.66) listed for Lees' disc measurements. The calculated thermal conductivities were then scaled from 23.5°C to 50°C, assuming that the slope of the temperature scaling was the same as that in Table 3 for the SM2 membrane. The porosity of the SM2 membrane was close to the values for the Lees' disc measurements, and consequently, the assumption for the temperature scaling would be reasonable.
Comparisons of the Measured Thermal Conductivities
Based on reference: Garcia-Payo and Izquierdo-Gil (2004).
Temperature of measurement is not available, based on reference Li et al. (2014).
For the SM2 membrane.
Using Equation (5) and the temperature correlation for SM2 membrane in Table 3 to estimate the k.
Knudsen effect
TPS measurements in Fig. 3 showed that PVDF membranes with porosity greater than 0.6 had thermal conductivities lower compared with bulk dry air at 23.5°C. It was hypothesized that the Knudsen effect might have contributed to the observed thermal conductivities due to the pore sizes of the PVDF membranes in this study. It is well documented that porous media with pore sizes approaching the mean free path of air, such as aerogels, can exhibit effective thermal conductivities lower compared with bulk air due to the Knudsen effect. The air molecules will collide with the pore walls more frequently than with each other, leading to a reduced thermal conductivity of air through the porous medium (Zhao et al., 2012a, 2012b). To quantify the potential impact of the Knudsen effect on the model predictions of thermal conductivities in this study, Equations (6)–(8) are used to calculate the effective thermal conductivity of air in the membrane pores.
where

Submicron pore structures of SM2 membrane
Parameter Values for the Calculations of the Knudsen Effect
Measured using porometry.
Based on references: Curcio and Drioli (2005), Johnson and Nguyen (2017), and Ghaleni et al. (2018).
Thermal conductivity for bulk dry air and saturated water vapor, from Table 3.
TPS measurements in this study were conducted using dry air; however, for DCMD, it is assumed that air in the membrane pores is saturated with water vapor. Calculations were performed to gauge the impact of water vapor inclusion on the gas-phase thermal conductivity. Experiments with saturated water vapor, however, were not conducted to validate the calculations due to the inability to ensure that water condensate did not exist in the membrane pores during TPS measurements. Liquid water exhibits a much higher thermal conductivity (e.g., 0.61 W/m-K at 27°C) than saturated water vapor (e.g., 0.018 W/m-K at 27°C) at a specific temperature and would introduce significant errors if it existed in the membrane pores during measurements (Lide, 2003). To calculate the thermal conductivity of air saturated with water vapor at a specific temperature, the partial pressure of saturated water vapor was first calculated using Equation (9) before converting it to the corresponding mole fraction with a total pressure of 1 atm for the air-water vapor mixture (Reid et al., 1987). The thermal conductivity of air saturated with water vapor was then estimated using the temperature correlations for bulk dry air and saturated water vapor listed in Table 3, and Equation (10) (Izquierdo-Gil et al., 1999). To include the Knudsen effect for the air-water vapor mixture, Equations (11) and (12) were used to calculate the mean free paths of air and water vapor, respectively (Levine, 2009; Deshmukh and Elimelech, 2017). The values were then averaged to get the mean free path for the mixture, followed by the application of Equations (7) and (8) to estimate the thermal conductivity of the mixture with the Knudsen effect. Table 5 lists the values of the parameters used for the calculations of the mean free paths in the air-water vapor mixture.
where Pwv is partial pressure of saturated water vapor, T is temperature of the air-water vapor mixture, kair-wv, kair, and kwv are thermal conductivities of the air-water vapor mixture, bulk dry air, and saturated water vapor, respectively, χair and χwv are mole fractions of air and water vapor, respectively,
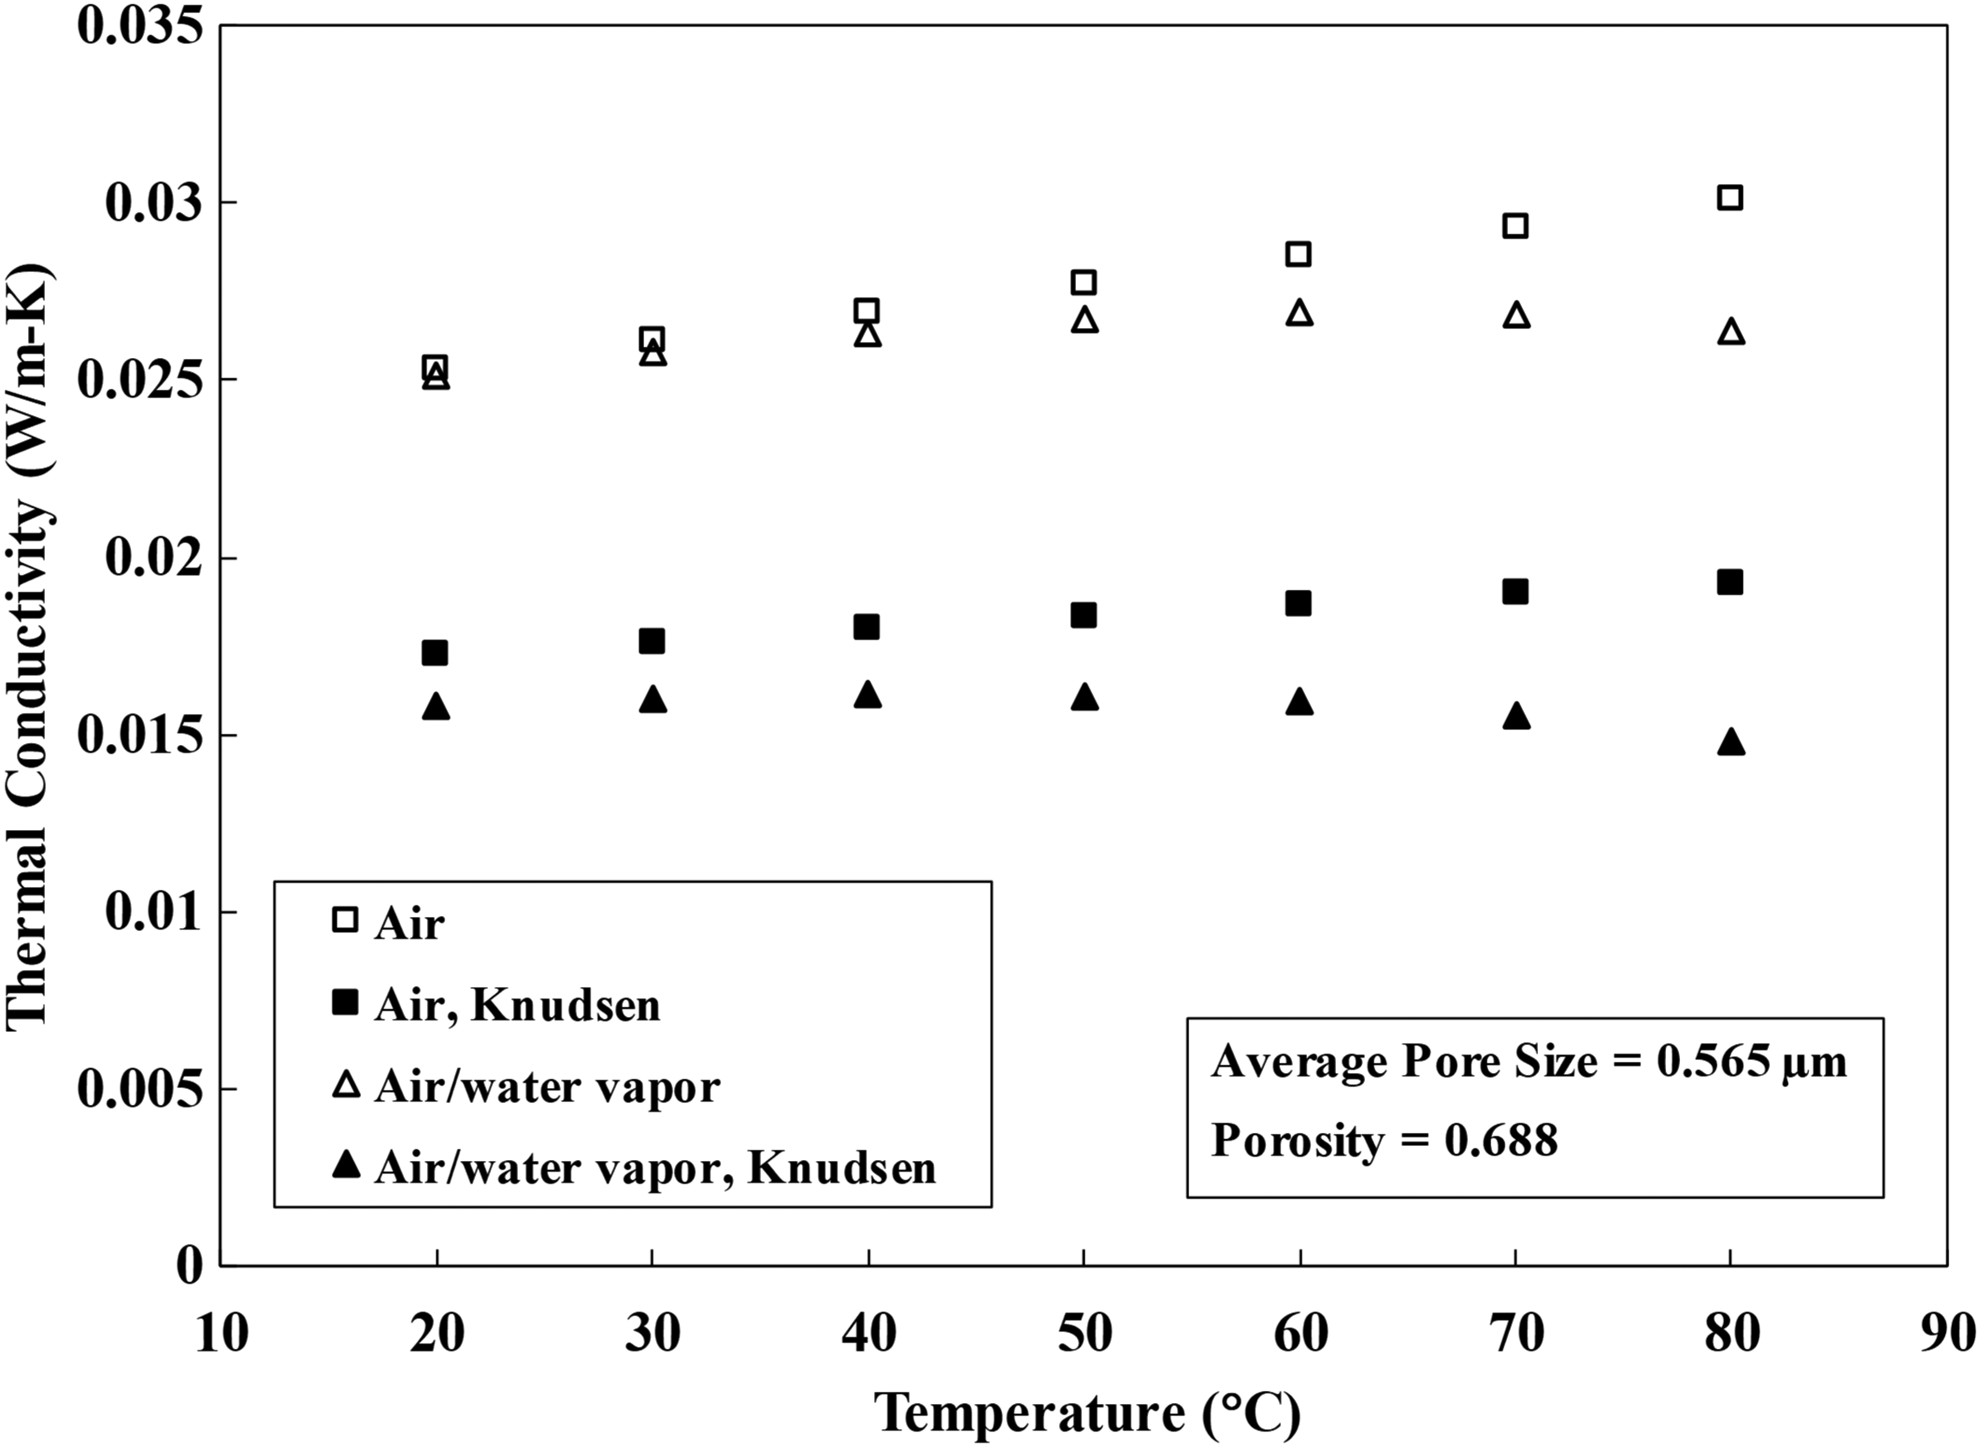
Temperature dependence of thermal conductivity for dry air and air saturated with water vapor, with and without inclusion of the Knudsen effect (for a porosity of 0.688 and an average pore size of 0.565 μm).
Water flux testing
Water flux result observed in this study, as presented in the Supplementary Table S1, was in line with the data of similar membranes. This indicated that the SM2 membrane in this study could indeed be used for DCMD and the thermal conductivity analyses are applicable to other PVDF-based DCMD membranes.
Conclusions
Thermal conductivities of PVDF-based DCMD membranes were measured using the TPS or hot disk method in dry air. Contrary to the common practices reported in literature, the isostress model, instead of the isostrain model, showed the closest results when compared to the TPS measurements at 23.5°C. However, the deviation from the measured values was still significant at 49–80% over the porosity range commonly observed for DCMD membranes. Incorporating the Knudsen effect in the isostress model lowered the thermal conductivity of dry air in the membrane pores and accurately predicted the observed membrane thermal conductivity from the TPS measurement at 23.5°C. As temperature increased, the Knudsen-corrected isostress model gradually digressed from the TPS measurements. It was hypothesized that the underestimation from the Knudsen-corrected isostress model was resulted from not including radiation conduction in the model. Radiation conduction is more prominent for membrane with high porosities and increases rapidly with temperature (∝ T3). During DCMD operations, air in the membrane pores is generally assumed to be saturated with water vapor. Inclusion of saturated water vapor in air lowers the gas-phase thermal conductivity in membrane pores. The presence of water vapor may also limit the increase of membrane thermal conductivity with temperature due to the increased mole fraction of water vapor in the air-water vapor mixture.
Incorporating the Knudsen effect and the contribution of radiation conduction could improve the accuracy of the isostress model. In the event that these contributions are not known, the traditional isostress model listed in Equation (2) would provide the closest predictions of membrane thermal conductivities. For PVDF-based DCMD membranes with a commonly reported porosity of 70%, the isostress model without Knudsen correction is anticipated to overestimate the membrane thermal conductivity up to 50% for feed temperatures less than 60°C.
Footnotes
Acknowledgments
This work was supported by National Science Foundation Award No. IIA-1301346 to NM EPSCoR and its Osmotic Power Research Group.
Author Disclosure Statement
No competing financial interests exist.
Nomenclature
Kn Knudsen number (dimensionless)
T Air temperature (K)
Greek Letters
References
Supplementary Material
Please find the following supplemental material available below.
For Open Access articles published under a Creative Commons License, all supplemental material carries the same license as the article it is associated with.
For non-Open Access articles published, all supplemental material carries a non-exclusive license, and permission requests for re-use of supplemental material or any part of supplemental material shall be sent directly to the copyright owner as specified in the copyright notice associated with the article.