
Abstract
Abstract
In the United States, approved methods to measure free chlorine concentrations in drinking water systems adding sodium dichloroisocyanurate (dichlor) or trichloroisocyanuric acid (trichlor) as chlorine sources exhibit measurement bias from the presence of chlorinated cyanurates, leading to overestimated free chlorine concentrations for regulatory compliance. One option to overcome this limitation is to estimate free chlorine concentrations using an established water chemistry model (full model), but the full model has only been determined for 25°C. The current research used a simplified version of the full model (simple model) and estimated the unknown temperature dependence (5°C to 35°C) of the two remaining equilibrium constants (K7a and K9a) required for the simple model. At 0 M ionic strength (μ),
Introduction
I
Addition of dichlor or trichlor to drinking water is equivalent to adding free chlorine (hypochlorous acid [HOCl] plus hypochlorite ion [OCl−]) and cyanuric acid (C3H3N3O3) in a fixed proportion. The C3N3O3 moiety (126.05 molecular weight) is typically denoted as Cy; therefore, cyanuric acid is represented as H3Cy, Cl3Cy is trichlor, and NaCl2Cy is dichlor. For context and assuming 100% chemical purity, each mg Cl2/L added from dichlor or trichlor adds 0.89 or 0.59 mg Cy/L respectively. Regardless of how cyanuric acid becomes present in water with free chlorine (i.e., through addition of dichlor, trichlor, or free chlorine and cyanuric acid individually), a rapid equilibrium (Matte et al., 1990) is obtained between H3Cy and its three dissociation products, HOCl, and chlorinated cyanurates (Fig. 1) that has been established at 25°C by O'Brien (1972) and O'Brien et al. (1974), referred to herein as the full model (Table 1). The resulting free chlorine concentration present in the water (assuming no ammonia is present) is dependent on (1) temperature, (2) pH, (3) chemical added (i.e., dichlor or trichlor), (4) chemical dose that determines the total chlorine (sum of chlorine in free chlorine and chlorinated cyanurates, TOTCl) and the total cyanurate added (sum of the cyanurate in H3Cy and its three dissociation products and chlorinated cyanurates, TOTCy), and (5) extent of chlorine demand that has occurred, which determines the remaining TOTCl concentration (Wahman, 2018a).
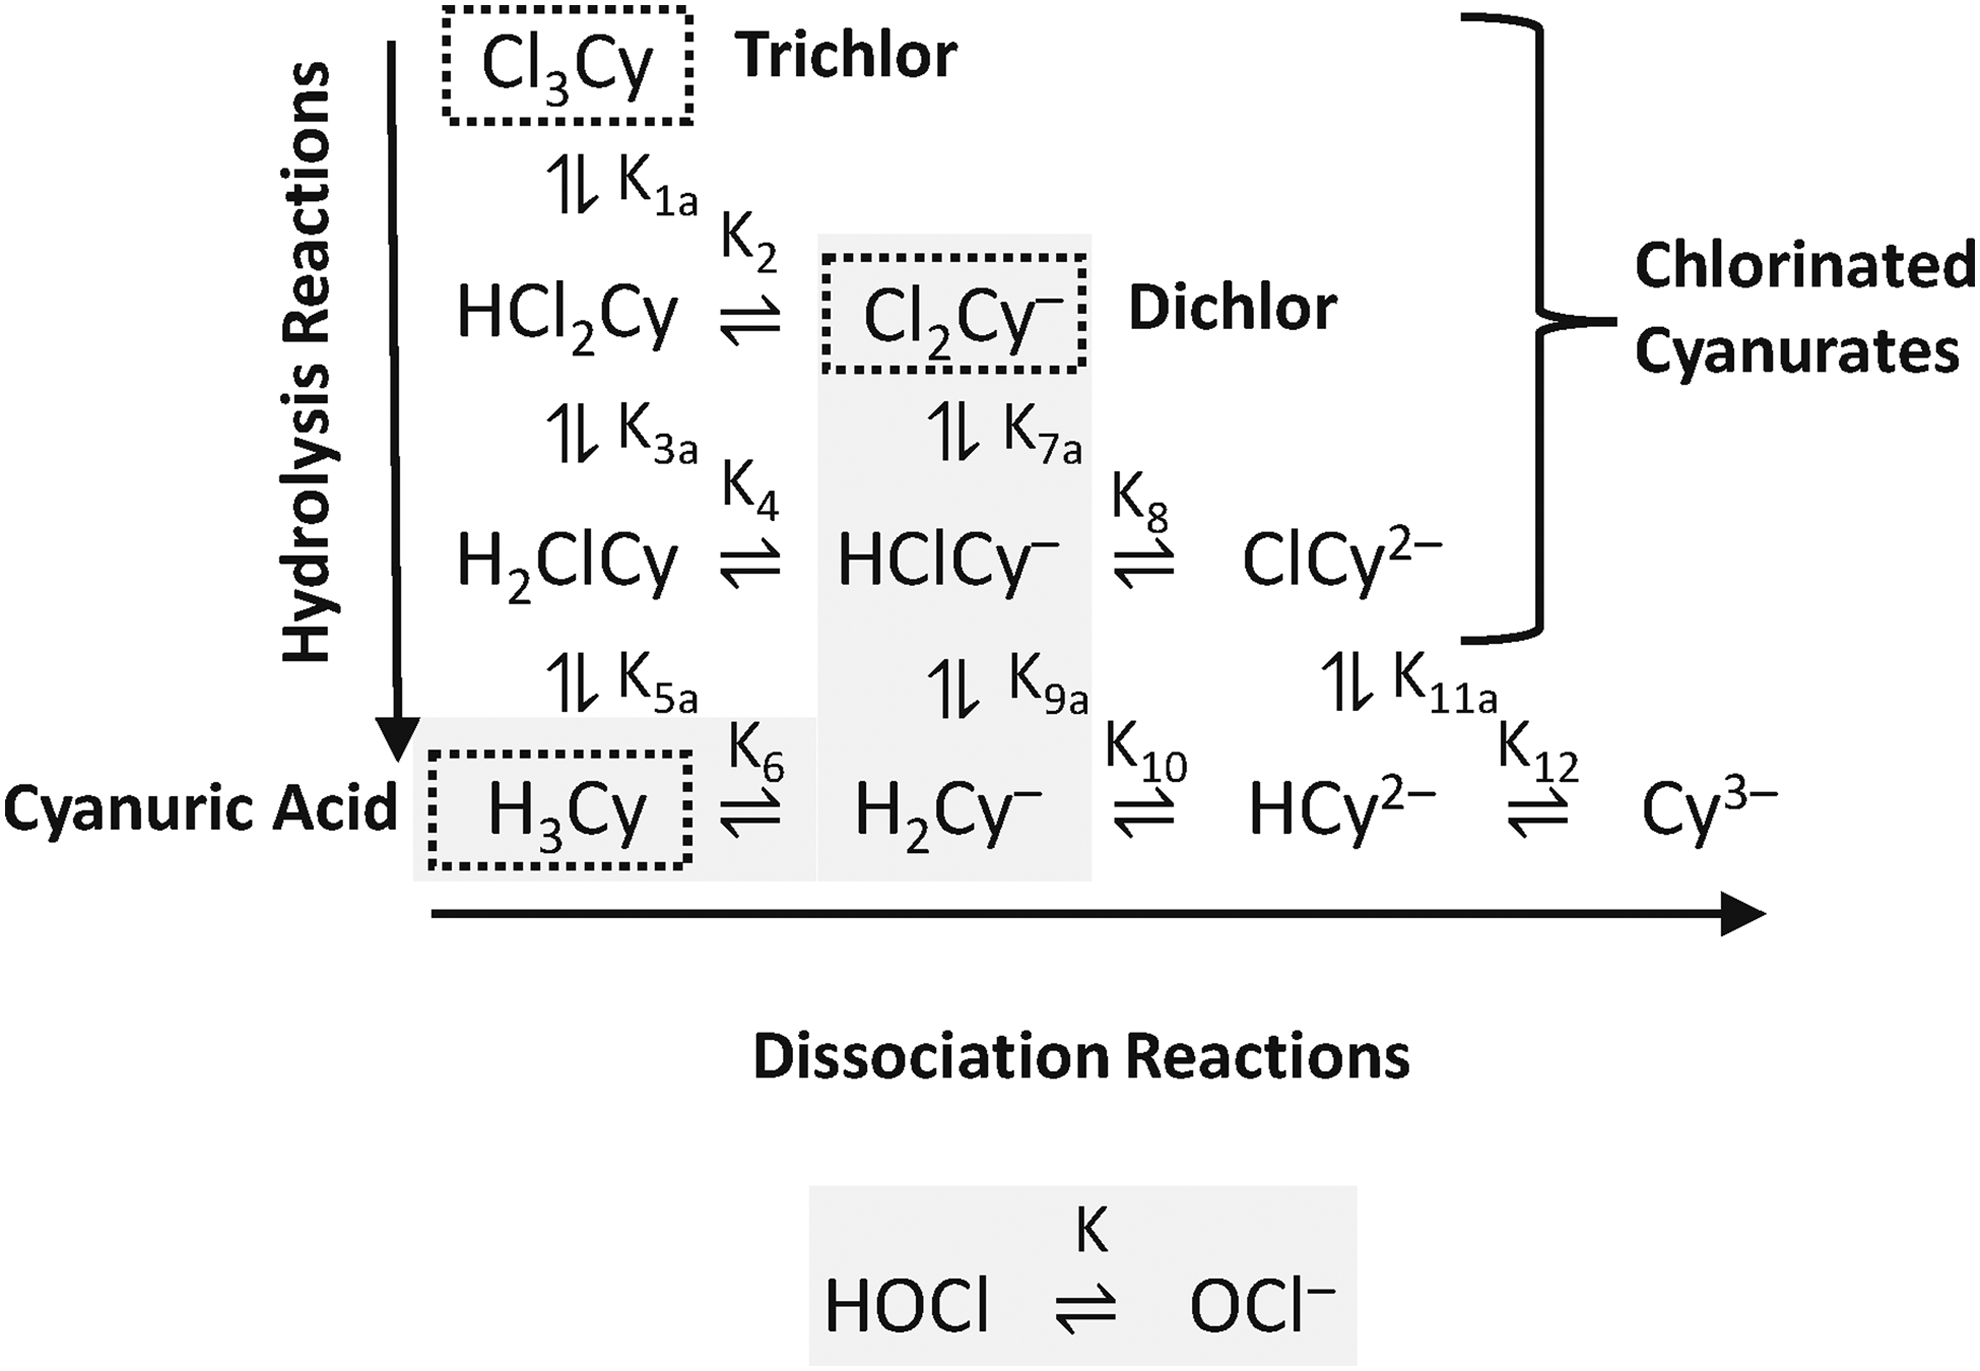
Hypochlorous acid, cyanuric acid, cyanuric acid ionization products, and chlorinated cyanurate equilibria for the full model. Gray shaded regions indicate chemicals and reactions that are relevant under drinking water conditions and chemical dosages and are those included in the simple model. Hydrogen ion for dissociation reactions and water and hypochlorous acid for hydrolysis reactions are not shown for clarity, and required full reactions for the full and simple models are shown in Table 1. Adapted with permission from Brady et al. (1963) Copyright 1963 American Chemical Society. Dotted boxes denote those chemicals which are called out by name in the figure by the text next to them (e.g., trichlor, dichlor, or cyanuric acid).
Determined by O'Brien et al. (1974) but not required in the full model implementation.
O'Brien et al. (1974) at 0.020 M ionic strength and 25°C unless otherwise noted.
Morris (1966) at 0 M ionic strength and 25°C.
Because of the combination of a fast equilibrium (Matte et al., 1990) between H3Cy and its three dissociation products, HOCl, and chlorinated cyanurates (Fig. 1 and Table 1) and the possibility of direct reactions with method reagents (Jensen and Johnson, 1990), typical wet chemistry methods (e.g., N,N–diethyl–p–phenylenediamine [DPD]-based methods and amperometric titration) used to measure the free chlorine concentration in drinking water systems adding dichlor or trichlor exhibit measurement bias from the presence of chlorinated cyanurates (Whittle, 1970; Canelli, 1980; Wajon and Morris, 1980; Jensen and Johnson, 1990; Wahman et al., 2017). Therefore, when TOTCy is greater than zero and no ammonia is present to form chloramines, the free chlorine concentration is overestimated, which is important because the effective disinfectant in systems wherein chlorinated cyanurates and free chlorine are present is considered to be free chlorine, specifically HOCl (Canelli, 1974; Engel et al., 1983; Yamashita et al., 1988; Wojtowicz, 1996; Murphy et al., 2015).
Currently, the inability to accurately determine free chlorine concentrations in systems adding dichlor or trichlor prohibits determination of disinfection efficacy, including compliance with U.S. primary disinfection requirements or numeric free chlorine distribution system residual (i.e., greater than detectable) requirements required by several states (Wahman and Pressman, 2015). The current issue with free chlorine measurement is highlighted in the State of Utah's plan review policy for dichlor and trichlor installations (Utah Division of Drinking Water, 2017) and a recent memorandum from the U.S. Environmental Protection Agency (USEPA, 2018).
To overcome the inability to directly measure free chlorine in systems using dichlor or trichlor, one option is to simulate free chlorine concentrations using the established equilibrium water chemistry of the free chlorine and cyanuric acid system. For example, a web-based application has recently been developed to estimate free chlorine concentrations using this concept (Wahman, 2017). A limitation with the water chemistry estimate is that it is currently only applicable to 25°C, limiting its usefulness in actual drinking water systems where temperature may vary over a wide range (e.g., 5°C to 35°C). In addition, O'Brien (1972) and O'Brien et al. (1974) used chemical concentrations one to two orders of magnitude greater than would be seen in drinking water (e.g., 149 mg Cl2/L TOTCl and 378 mg Cy/L TOTCy) to estimate the equilibrium constants evaluated herein. Therefore, extending the water chemistry model to include temperatures from 5°C to 35°C and evaluating it under relevant drinking water conditions are an immediate need.
If pH, TOTCy, and TOTCl are known, the full model for the free chlorine and cyanuric acid system consists of 10 independent equilibrium expressions that are temperature dependent, 2 mass balance equations for TOTCl and TOTCy, and 12 unknown chemical concentrations (Table 1 and Fig. 1) (O'Brien et al., 1974). As described in Wahman (2018a) and for drinking water samples, pH and TOTCl can be directly measured, and TOTCy can be conservatively calculated based on the dichlor or trichlor mass originally dosed. Fortunately, under relevant drinking water conditions (i.e., 6.5 ≤ pH ≤9.5, TOTCl ≤10 mg Cl2/L, and TOTCy ≤10 mg Cy/L), the system is reduced to six chemicals present at meaningful concentrations (Fig. 1) because of the pH range and TOTCl and TOTCy concentrations. Therefore, only four (K, K6, K7a, and K9a) temperature-dependent equilibrium expressions (Table 1 and Fig. 1) are required along with the TOTCl and TOTCy mass balances. The resulting model is herein termed the simple model (Table 1).
Figure 2 displays the impact of using the simple model versus the full model to simulate free chlorine concentrations at 25°C and was generated using relevant drinking water combinations (13,671 total simulations) of pH (6.5 to 9.5 every 0.1 units), TOTCl (0 to 10 mg Cl2/L every 0.5 mg Cl2/L), and TOTCy (0 to 10 mg Cy/L every 0.5 mg Cy/L). For most conditions, the simulated free chlorine concentrations by the simple model were slightly greater than those from the full model, and the differences were generally <0.05 mg Cl2/L, reaching a maximum of 0.20 mg Cl2/L at pH 9.5 (Fig. 2A). In the worst-case scenario (pH 9.5), the deviation of the simple model was only 6% of the full model-simulated free chlorine concentration (Fig. 2B). Furthermore, Supplementary Fig. S1 shows that for the conditions evaluated in the current research (Table 2), the full and simple models simulate essentially the same free chlorine concentrations, assuming 25°C.

Comparison of the difference in simulated free chlorine concentrations at 25°C between the full model of O'Brien et al. (1974) and the proposed simple model over a range of relevant drinking water conditions (6.5 ≤ pH ≤9.5, TOTCl ≤10 mg Cl2/L, and TOTCy ≤10 mg Cy/L) on a concentration
In the simple model, two of the four required equilibrium expressions (Table 1 and Fig. 1) represent the acid–base chemistry of free chlorine (HOCl and OCl−, K) and cyanuric acid (H3Cy and H2Cy−, K6) whose temperature dependence in Kelvin (TK) have been established [Eqs. (1) and (2), respectively, 0 M ionic strength (μ)] (Morris, 1966; Wahman, 2018b).
Using the reported K and K6 relationships, only the temperature dependence of two equilibrium constants (K7a and K9a) involving chlorinated cyanurates is required to expand the simple model to a range of relevant drinking water temperatures. Therefore, the goal of the current research was to determine the temperature dependence of K7a and K9a from 5°C to 35°C. With the temperature dependence of K7a and K9a determined, the simple model's temperature dependence is complete, providing the necessary information to simulate free chlorine concentrations in drinking water systems using dichlor or trichlor over a range of practical temperatures (e.g., updating the existing web-based application to incorporate temperature).
In addition to the previously described drinking water application, the simple model developed in this research may have broader applications. For instance, cyanuric acid, dichlor, and trichlor have been used as disinfectants and algicides in cooling towers (Hammond et al., 1986) and added to outdoor swimming pools since 1958 to stabilize chlorine residual by minimizing sunlight-related degradation (Canelli, 1974).
Materials and Methods
Reagent and glassware preparation
Solutions were prepared in ultra-pure water (18.2 MΩ-cm, Barnstead NANOpure Diamond). Stock cyanuric acid solutions (1,000 mg/L of H3Cy, pH >9, 129.07 molecular weight) were prepared from reagent grade cyanuric acid (Acros Organics), accounting for reagent purity of 98%. Free chlorine and OCl− solutions were prepared from reagent grade sodium hypochlorite (Fisher Chemical). Carbonate buffers were made from sodium bicarbonate (Fisher Chemical) and adjusted to the target pH with 0.05 and 0.5 N hydrochloric acid (HCl) or sodium hydroxide (NaOH) as required. All glassware was treated to make it chlorine-demand free before use (Summers et al., 1996).
Analytical methods
Spectrophotometric measurements (292 nm) were conducted with a 10-cm path length quartz cuvette using a Hach DR/4000U Spectrophotometer. The spectrophotometer was blanked with ultra-pure water before use. Triplicate absorbance measurements were taken and averaged for any measured sample.
The sample pH and temperature were measured immediately before each spectrophotometric measurement with an Orion pH electrode with automatic temperature compensation connected to an Orion Star A211 pH meter that had been calibrated with nominal pH standards of 4, 7, and 10 per manufacturer's instructions. Free and total chlorine colorimetric DPD samples were analyzed in parallel with each measurement using a Hach SL1000 Portable Parallel Analyzer (Hach Company, 2015, 2017).
Absorbance verification experiments
Morris (1966) estimated molar absorptivity values for HOCl and OCl− from 230 to 300 nm between 5°C and 35°C, demonstrating that a linear relationship between absorbance and HOCl and OCl− concentrations existed at each temperature and wavelength studied, and the relationship did not change substantially with temperature. In this research, absorbance was measured at 292 nm because (1) at the TOTCl and TOTCy concentrations used in the experiments, HOCl and OCl− are the only two chemicals present in the experimental water that meaningfully absorb at 292 nm (Morris, 1966; O'Brien, 1972; O'Brien et al., 1974) (see Supplementary Data for confirmation, Absorbance Interference Check at 292 nm section), (2) the maximum molar absorptivity for OCl− at 292 nm is ∼3.5 times that of HOCl at 230 nm (Morris, 1966), and (3) at the pH values evaluated in this research, OCl− is present at approximately the same or greater concentration than HOCl. Therefore, 292 nm represented the wavelength providing the maximum absorbance that could be attributed to free chlorine and not subject to interference from other chemical species present.
As subsequently discussed (see Equilibrium Constant Experiments section), the molar absorptivity values for HOCl and OCl− at 292 nm are not required for data analysis. Rather, only verification on the current spectroscopy equipment that a linear relationship exists between concentration and absorbance at 292 nm from 5°C to 35°C is required. Therefore, 0, 0.25, 0.50, 1, 2, and 4 mg Cl2/L OCl− (pH 10) standards were prepared in duplicate at 5, 20, and 35°C and measured at 292 nm to verify that the current equipment could produce results comparable with Morris (1966). OCl− was chosen to demonstrate spectroscopy equipment linearity at the various temperatures because it was simpler to create solutions of OCl− versus HOCl, and OCl− has a greater molar absorptivity, allowing TOTCl concentrations (0 to 4 mg Cl2/L) to be used that were relevant to this research.
Equilibrium constant determination experiments
Equilibrium constant experiments
All experiments and associated measurements were conducted in a temperature controlled chamber maintained nominally at either 5, 10, 15, 20, 25, 30, or 35°C. Duplicate experiments were conducted at 5, 20, and 35°C. To acquire the required data to allow estimation of K7a and K9a temperature dependence, solutions of free chlorine only and free chlorine with cyanuric acid additions of either 1, 2, 3, or 4 mg/L cyanuric acid were created in 0.004 M carbonate buffer at pHs 7.5, 8.3, and 9.0 at each experimental temperature and for two TOTCl concentrations (1.9 and 3.7 mg Cl2/L).
A sample's free chlorine concentration was determined using a combination of spectrophotometry and colorimetric methods. In a solution containing only free chlorine (i.e., no cyanuric acid addition and designated as Solution #1) at a fixed pH and temperature, the 292-nm absorbance is proportional to HOCl and OCl− concentrations [Eq. (3)].
In Equation (3), Abs1 is the measured total absorbance at 292 nm in Solution #1; α0 and α1 are the fractions of free chlorine that are HOCl and OCl−, respectively; ɛHOCl and ɛOCl are the molar absorptivities of HOCl and OCl− at 292 nm, respectively; l is the path length of the absorbance cell; and TOTFree1 is the free chlorine concentration in Solution #1 that equals the TOTCl concentration in Solution #1.
Adding some mass of cyanuric acid to Solution #1 creates Solution #2 wherein the absorbance at 292 nm is now related by Equation (4). Note that the only difference between Solution #1 and Solution #2 is the presence of cyanuric acid in Solution #2 (i.e., Solution #2 has the same pH, temperature, and TOTCl concentration as Solution #1). Therefore, α0 and α1 are also the same between Solution #1 and Solution #2. In Equation (4), Abs2 is the measured total absorbance at 292 nm in Solution #2 and TOTFree2 is the free chlorine concentration in Solution #2. Because some TOTCl is now bound as chlorinated cyanurates in Solution #2, TOTFree2 is less than TOTCl.
Taking the absorbance ratio for Solution #1 and Solution #2 results in Equation (5), which relates the absorbance ratio to the fraction of free chlorine in Solution #2 and becomes independent of HOCl and OCl− molar absorptivities.
TOTFree2 can be calculated using Equation (5) and the measured (by an appropriate method such as colorimetric DPD) free or total chlorine concentration in Solution #1 as shown by Equation (6).
Equation (6) does not require knowledge of the HOCl and OCl− molar absorptivities. Rather, the only requirement for Equation (6) is that at each temperature, HOCl and OCl− have a constant molar absorptivity (i.e., that concentration is proportional to absorbance) as has been determined by Morris (1966).
Simple model
Equation (7) represents a third-order polynomial equation derived from the simple model in terms of total free chlorine (TOTFree) concentration (see Derivation of Equation (7) from the Simple Model section in Supplementary Data). In Equation (7), αo is the concentration fraction of TOTFree that is HOCl [Supplementary Eq. (S1)];
Ionic strength and activity corrections for K6 and K
To determine the concentration-based equilibrium constants Kc and K6c from K and K6 [Supplementary Eqs. (S1) and (S4)], the range of μ for the experimental conditions was calculated using Equation (8) based on known chemical additions, the measured pH and temperature, and a charge balance to account for the acid or base addition required to obtain the measured pH (Wahman, 2018b). For the μ calculations, relationships for carbonate and water ionization constants with temperature were taken from Goldberg et al. (2002) and Stumm and Morgan (1996), respectively.
Subsequently, μ was used to calculate the single charge ion (z = 1) activity coefficient (γ1) from the Davies equation using Equation (9) (Benjamin, 2002). In Equation (9), the term ADH is determined from Equation (10) at the specified TK (Benjamin, 2002), and in Equation (10), the dielectric constant for water (ɛwater) is determined at the specified temperature in °C (Tc) from Equation (11) (Malmberg and Maryott, 1956).
The determined range of μ (0.0040 to 0.0045 M) and corresponding γ1 (0.928 to 0.935) values covered a narrow range. Because γ1 was identical to two significant figures over its entire range, γ1 was fixed at 0.93 for all experimental conditions to simplify analysis, representing at worst a 0.5% deviance from the actual γ1.
Equilibrium constant temperature dependence
The basic relationship between an equilibrium constant (Keq) and TK is shown by Equation (12) (Stumm and Morgan, 1996). In Equation (12), ΔH0 is the standard enthalpy change of the reaction, whereas R is the universal gas constant (8.314 × 10⁻³ kJ/[mol·K]. If ΔH0 is assumed to be independent of TK, Equation (13) results. Equation (13) can be further simplified to Equation (14) or Equation (15). Using Equation (14), specific relationships for K7a and K9a with TK are represented by Equations (16) and (17). Equations (1), (2), (7), (16), and (17) were used for parameter estimation, and A7a, A9a, B7a, and B9a represent constants estimated during parameter estimation with
Parameter estimation
Estimation of A7a, A9a, B7a, and B9a and corresponding determinations of
Results and Discussion
Absorbance verification experiments
Figure 3 shows results demonstrating the verification of a linear relationship (R2 = 0.999) between concentration and absorbance on the current equipment at 292 nm over the range of temperatures evaluated in this research, using OCl− as the demonstration chemical. For each temperature, similar slopes (345 to 356 M−1 cm−1 molar absorptivity) were determined, verifying that the current equipment can reproduce similar results of Morris (1966). Based on variability in the lowest standard (0.25 mg Cl2/L), the detection limit corresponded to an absorbance of 0.002 with a 10-cm cell (APHA et al., 2005). To provide a measure of safety, the minimum absorbance values used for any sample used in parameter estimation was set to 0.020 with a 10-cm cell.

Linearity verification between concentration and absorbance at 292 nm and 5°C
Equilibrium constant determination experiments
Source data
Experimental data obtained from the equilibrium constant determination experiments are summarized in Supplementary Table S1, consisting of 208 data points. A summary of the experimental conditions is provided in Table 2. For each temperature, 24 possible samples containing both free chlorine and cyanuric acid were created for analysis. The lower number of samples shown in Table 2 at each temperature is a result of samples whose absorbance were <0.020 and removed from subsequent analyses. As temperature decreased, a greater number of samples did not achieve the 0.020 absorbance threshold, which is a result of lower concentrations of free chlorine being present as temperature decreased.
Full model (without temperature dependence) representation of experimental data
To evaluate the need to incorporate temperature into the water chemistry model, a comparison of the experimentally determined free chlorine concentrations (Supplementary Table S1) with the simulated free chlorine concentrations using the full model (Table 1) was conducted (Fig. 4A). If there was no impact with temperature, the experimentally measured and model-simulated concentrations would fall on the 1:1 line displayed in Fig. 4A. It is clear in Fig. 4A that as temperatures decreased below 25°C, the full model (without temperature dependence) overestimated the free chlorine concentrations. To understand the discrepancy between the measured free chlorine concentrations and the full model-simulated free chlorine concentration, Supplementary Fig. S2 displays the difference on a concentration (Supplementary Fig. S2A) and percentage basis (Supplementary Fig. S2B). Differences of up to 1.2 mg Cl2/L are evident with percentages reaching nearly 60% of the simulated value. Taken together, these results indicated that temperature must be considered to properly represent the experimental data.

Comparison of model-simulated versus experimentally determined free chlorine concentrations for the full model
Simple model estimated parameters
Using the data presented in Supplementary Table S1, A7a, A9a, B7a, and B9a were estimated using Equations (7), (16), and (17) to determine K7a and K9a at various temperatures. No apparent pattern is evident in the simple model residuals (experimentally measured minus model-simulated free chlorine concentrations) associated with the parameter estimation (Supplementary Fig. S3). A comparison of the simple model-simulated and experimentally measured free chlorine concentrations is summarized in Fig. 4B. If the simple model-simulated and experimentally measured free chlorine concentrations were identical, the points shown in Fig. 4B would form a line with a slope of one passing through the origin. The linear regression results in a line with a slope that is not significantly different than 1 (0.99 ± 0.010, 95% confidence interval [CI]), an intercept not significantly different from 0 (0.018 ± 0.021, 95% CI), and excellent R2 (0.994), indicating that the simple model is representing the experimental data extremely well and that the assumption of constant ΔH0 [Eq. (13)] was justified.
A summary of the estimates of A7a, A9a, B7a, and B9a and corresponding pK7a and pK9a values ranging from 5 to 35°C is provided in Table 3 along with comparisons with the 25°C O'Brien et al. (1974) estimates adjusted to μ = 0 M (refer to Supplementary Data, Adjustment of O'Brien et al. (1974) Equilibrium Constants). From the estimated values of A7a and A9a,

Paired bootstrap estimates (n = 10,000) of parameters for K7a
O'Brien et al. (1974) after adjusting to 0 M ionic strength and converting the reported standard deviations to 95% confidence intervals using the experimental data from O'Brien (1972).
CI, confidence interval.
Using the reported standard deviations from O'Brien et al. (1974) and after adjusting their estimates determined at μ = 0.020 M to μ = 0 M with the experimental data provided in O'Brien (1972) (pK7a = 4.45–4.57 and pK9a = 5.64–5.71; 95% CI), the current 25°C simple model estimates (pK7a = 4.59–4.71 and pK9a = 5.81–5.85; 95% CI) are comparable yet significantly different than the full model estimates of O'Brien et al. (1974). The differences between the current estimates of pK7a and pK9a and those of O'Brien et al. (1974) may be a result of the different experimental conditions, methods used to estimate equilibrium constants, or models implemented (i.e., simple versus full). This research conducted experiments under conditions representative of drinking water (pH 7.5 to 9.0, <4 mg Cl2/L TOTCl, and <4 mg Cy/L TOTCy), used a simplified model that only included chemical species important under drinking water conditions, and simultaneously estimated two equilibrium constants (K7a and K9a) using all the data collected from 5 to 35°C.
To estimate K9a, O'Brien (1972) and O'Brien et al. (1974) used pHs from 9.4 to 10.6, chemical concentrations one to two orders of magnitude greater than the current research (149 mg Cl2/L TOTCl and 378 mg Cy/L TOTCy), and relied on two estimated equilibrium constants from the full model (Table 1; K8 and K10) to estimate K9a. In addition, O'Brien (1972) discussed an apparent linear trend with the experimental pH for individual K9a estimates used to determine the reported K9a and associated uncertainty, noting that further experimental work should be conducted to investigate the pH trend as it should not exist. The O'Brien (1972) linear trend with pH (R2 = 0.96) is illustrated in Supplementary Fig. S5, where the O'Brien (1972) individual pK9a estimates increased as the experimental pH under which the pK9a estimates were determined decreased. If the O'Brien (1972) pK9a estimates (5.75 and 5.77) at the lowest experimental pH (9.45) are more representative of the actual pK9a value, then the current research estimated pK9a (5.81–5.85) corresponds better with these previous results. For K7a, O'Brien (1972) and O'Brien et al. (1974) did not conduct specific experiments to estimate K7a. Rather, K7a was calculated from three estimated equilibrium constants (Fig. 1 and Table 1; K2, K3a, and K4) that were determined with TOTCl and TOTCy concentrations like those used to estimate K9a. Regardless of the differences between the current estimates and those of O'Brien (1972) and O'Brien et al. (1974), the simple model presented herein represented the entire data set extremely well.
Practical implications
With the addition of K7a and K9a's temperature dependence to the known temperature dependence of K and K6, a relevant drinking water chemistry model for the free chlorine and cyanuric acid system (i.e., systems using dichlor or trichlor) has been determined over a practical range of drinking water temperatures (5 to 35°C), allowing estimation of free chlorine concentrations. Figure 6 summarizes the temperature impact on the percentage free chlorine for a 2 mg Cl2/L dichlor addition (1.8 mg Cy/L TOTCy) at 5, 15, 25, and 35°C. The percentage free chlorine decreases with decreasing temperature at all pH values simulated, highlighting the importance of accounting for temperature so as not to overestimate free chlorine concentration, which is the true disinfectant. For example and at pH 7.0, the percentage free chlorine decreases from 45% (0.90 mg Cl2/L free chlorine) at 25°C to 31% (0.60 mg Cl2/L free chlorine) at 5°C. If temperature was not considered, a system operating at 5°C would overestimate their free chlorine concentration by 50%, which could have significant implications for understanding disinfection efficacy (e.g., compliance with U.S. primary disinfection requirements).
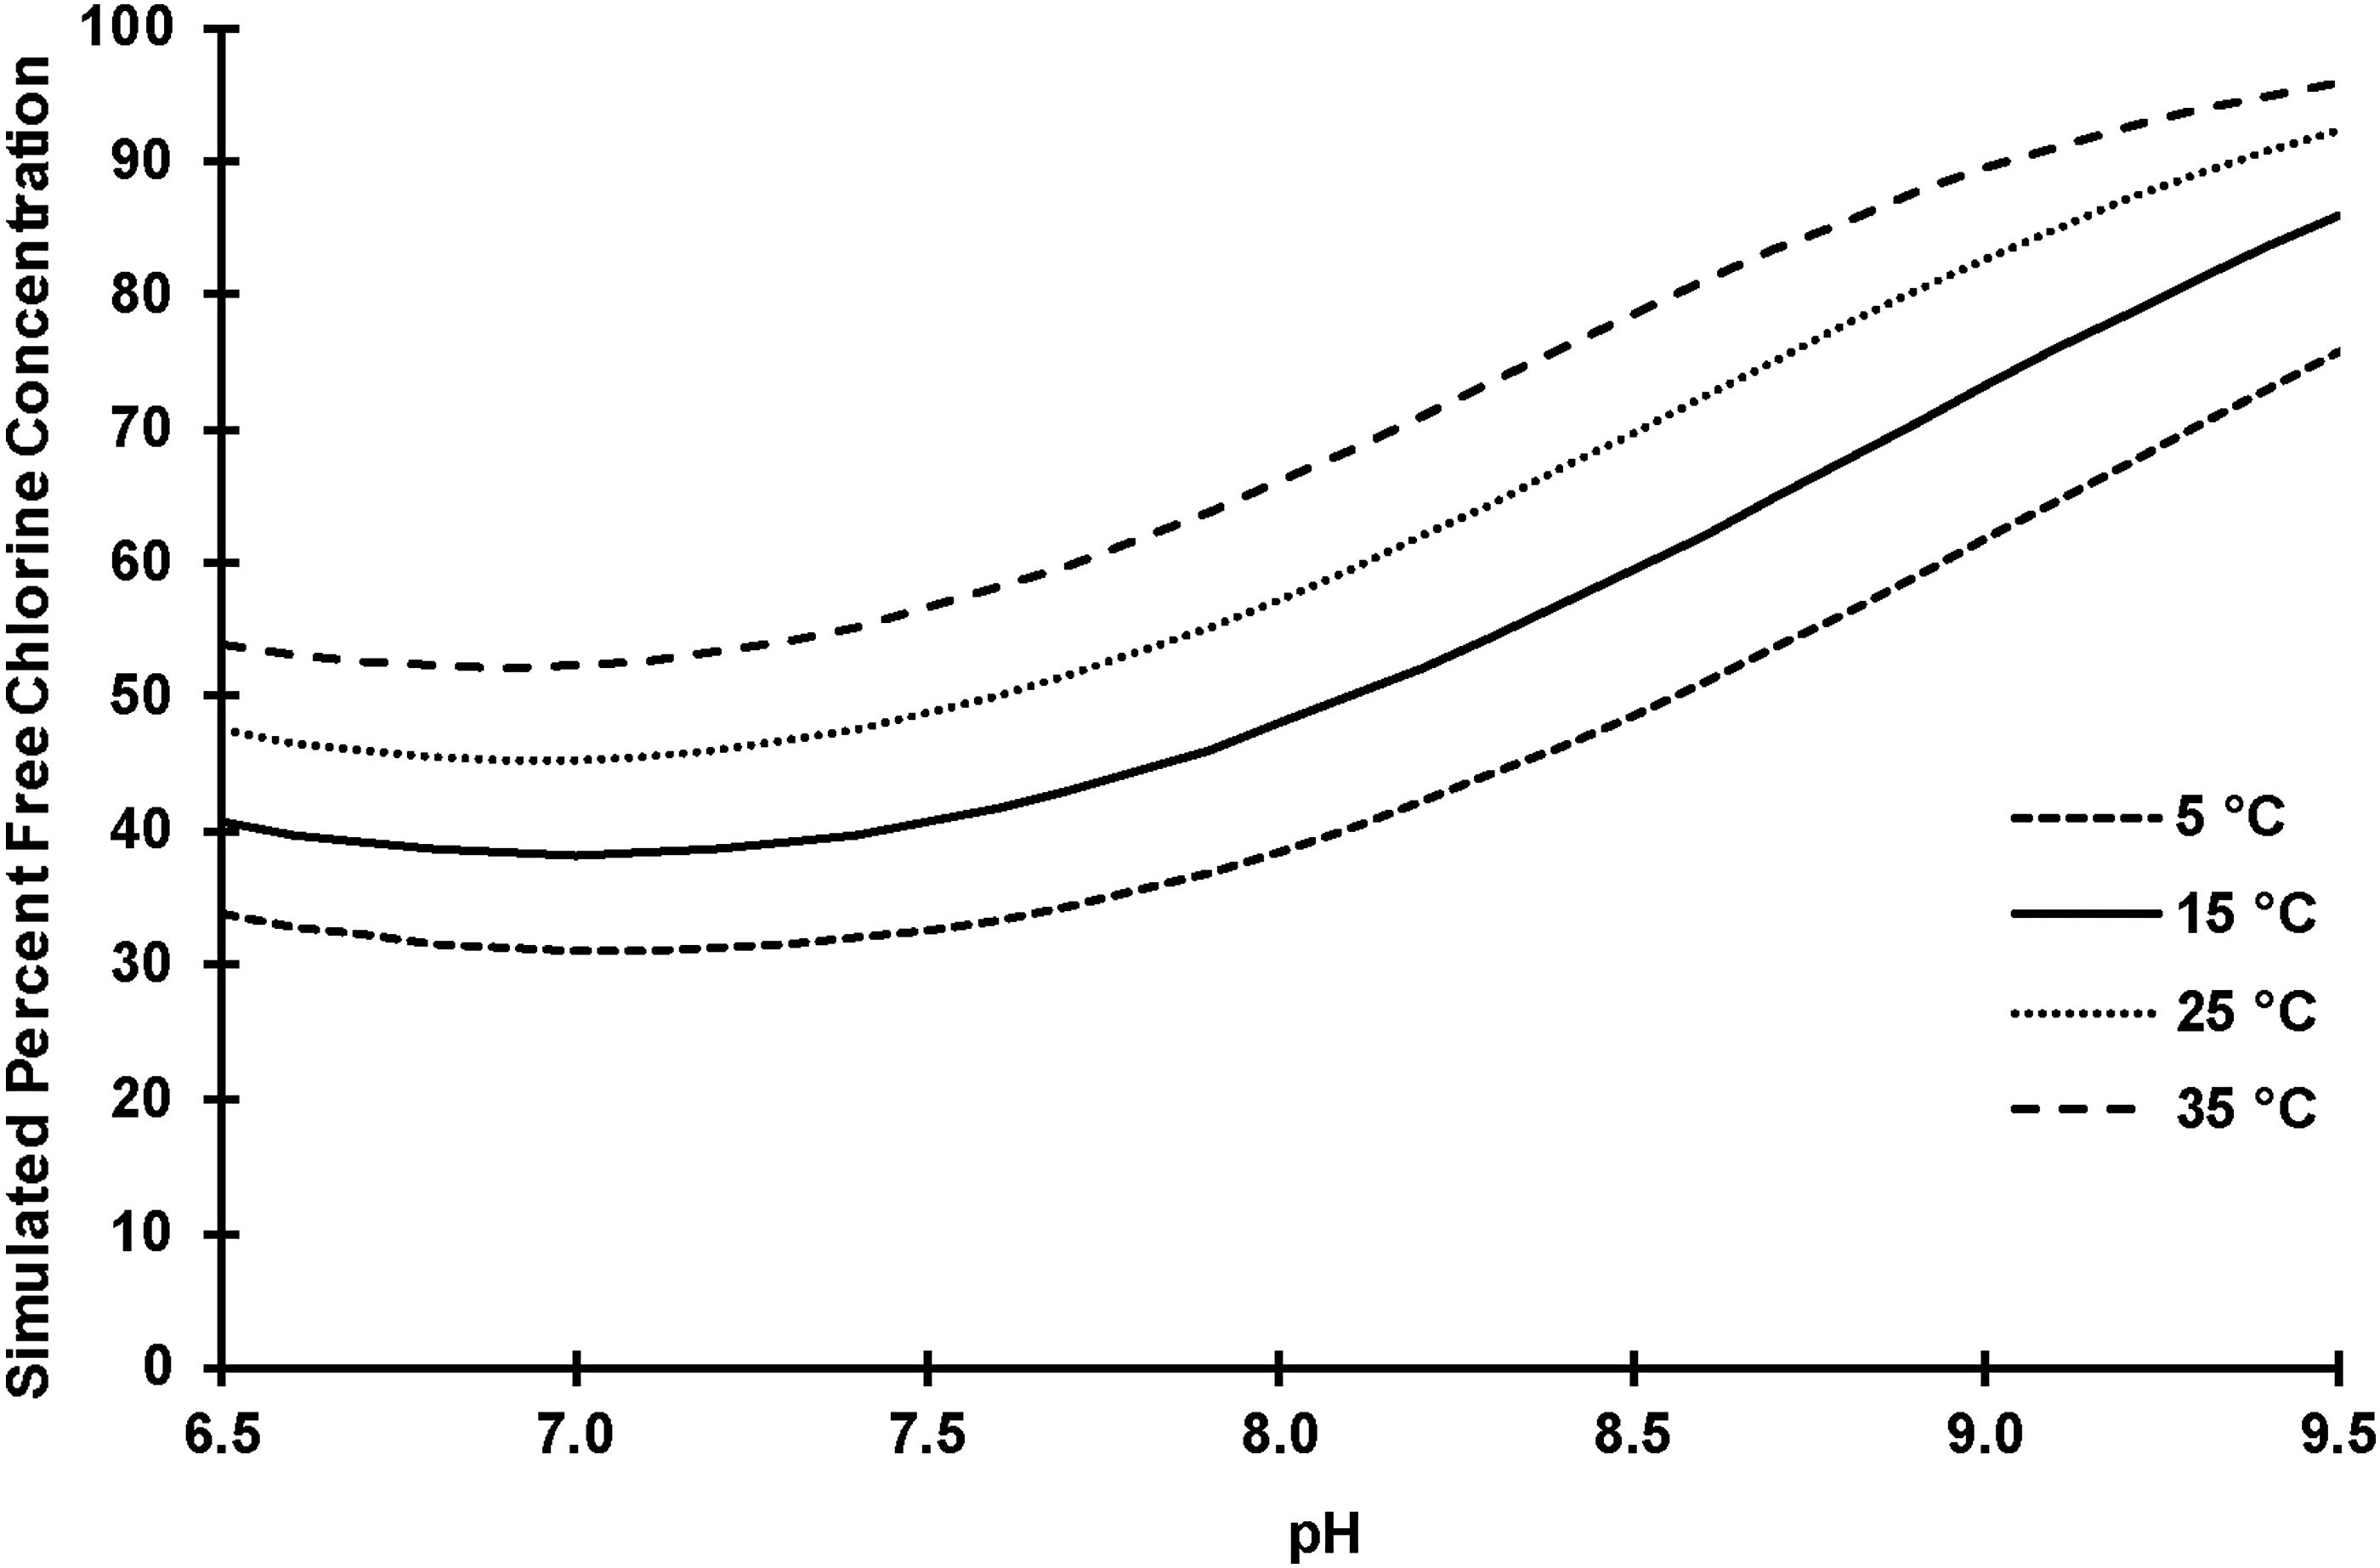
Simple model simulation of percentage free chlorine concentration at various temperatures for a 2 mg Cl2/L dichlor addition (i.e., 2 mg Cl2/L total chlorine). Simulations conducted using equilibrium constants determined in the current research. Percentage free chlorine = 100 × actual free chlorine/total chlorine.
Summary
A simplified version of the free chlorine and cyanuric acid equilibrium water chemistry model (simple model) was used to estimate the unknown temperature dependence (5 to 35°C) of the two remaining equilibrium constants (K7a and K9a) required for the simple model. At 0 M ionic strength (μ), the estimated equilibrium constants were
To apply the simple model in drinking water practice, one would follow the methodology outlined by Wahman (2018a) with the addition of temperature as another required measurement. Therefore, for a water sample, one needs to know the pH, TOTCl, TOTCy, and temperature as inputs to the simple model. As discussed in Wahman (2018a), pH, TOTCl, and now temperature could be measured directly on the water sample whereas the TOTCy concentration could be calculated from the total mass of dichlor or trichlor that was dosed into the water system, accounting for chemical purity. Because chlorine demand may have occurred, TOTCy cannot be calculated from the measured TOTCl in the water sample and dichlor or trichlor's chemical formula. Doing so would lead to an underestimation of TOTCy and an overestimation of the actual free chlorine concentration. With pH, TOTCl, TOTCy, and temperature known, the simple model provides an estimate of the sample's actual free chlorine concentration.
Footnotes
Acknowledgments
The authors acknowledge the technical assistance provided by Meridith Bartley of Neptune and Company for the implementation of the bootstrapping analysis in R and Richard Falk for fruitful discussions on relevant chemistry.
Disclaimer
This work has been subjected to the United States Environmental Protection Agency's (Agency's) review and has been approved for publication. The views expressed in this article are those of the authors and do not necessarily represent the views or policies of the Agency. Any mention of trade names, products, or services does not imply an endorsement by the Agency. The Agency does not endorse any commercial products, services, or enterprises. This research did not receive any specific grant from funding agencies in the public, commercial, or not-for-profit sectors.
Author Disclosure Statement
No competing financial interests exist.
References
Supplementary Material
Please find the following supplemental material available below.
For Open Access articles published under a Creative Commons License, all supplemental material carries the same license as the article it is associated with.
For non-Open Access articles published, all supplemental material carries a non-exclusive license, and permission requests for re-use of supplemental material or any part of supplemental material shall be sent directly to the copyright owner as specified in the copyright notice associated with the article.