
Abstract
Abstract
The food–energy–water (FEW) nexus is a focal point in research due to its impacts on ecosystem services that sustain human life. Despite this, FEW studies have not produced enough policy-relevant insights, particularly addressing differences across demographic groups with sufficient data and analysis. We addressed this research gap by integrating socioeconomic status (SES) with pertinent life cycle assessment findings to explore food-consumption impacts across three of the largest demographic groups (Black, Latinx, White) in the United States. Looking at five food groups—vegetables, fruits, protein, dairy, and grains—food-consumption impacts per dollar spent (FCI$) were calculated. Results show that Latinx and Black household food purchasing and consumption behavior has greater impact on cradle-to-farm-gate environmental resources (land, greenhouse gas [GHG], water) for every dollar spent compared with White households. Higher FCI$ rates for Latinx and Black households are attributable to relatively low average household incomes (i.e., lower SES), which is associated with the purchase of more cheaper, energy-dense foods. Addressing food access issues for demographic groups of lower SES could facilitate the purchase of less environmentally-intense foods, thereby conserving environmental resources and mitigating GHG emissions. Specifically, different messaging relevant to particular demographic groups may be necessary to encourage healthier and lower-impact dietary choices. This study's results provide practitioners, policy makers, and researchers policy-relevant data for issues involving the environment, with interesting discussion on implications for racial equity and human health.
Introduction
The food–energy–water (FEW) nexus is a focal point in research due to its dynamic impacts on ecosystem services that sustain human life (Wichelns, 2017; Dai et al., 2018; Zhang et al., 2018). That is, food systems utilize vital natural resources through socioecological interactions (Storm et al., 2015; Vallejo-Rojas et al., 2016); climate change drives more frequent and intense agroclimatic events which affect food availability and quality (Zucali et al., 2017; Rötter et al., 2018); and human health outcomes are affected by access to healthy food options and clean water (Donley and Gualtieri, 2015; Ahola et al., 2016; Dieter and Tuttle, 2017; Karabulut et al., 2018). It is also understood that food consumption is integral to the FEW nexus (USGCRP, 2018), and food-consumption patterns in the United States tend to vary based on factors such as race and income level (Kirkpatrick et al., 2012).
Researchers have made progress in establishing approaches that are intended to develop policy-relevant insights for the FEW nexus. One such approach has been to perform a broad analysis of FEW interactions to understand risks and impacts (Al-Saidi and Elagib, 2017; Kaddoura and Khatib, 2017; Kurian, 2017; Amorim et al., 2018; Zhang et al., 2018). However, many FEW nexus analytical tools require extensive data while lacking synergistic capabilities (Kaddoura and Khatib, 2017). Furthermore, many FEW nexus studies often are ostensible in their nexus integration or crossdisciplinary claims, in that their methodological approaches fall short of facilitating nexus studies that employ core analytical techniques from more than one scientific field (Al-Saidi and Elagib, 2017; Dai et al., 2018; Zhang et al., 2018). Specifically, the broad analysis of Al-Saidi and Elagib (2017) had three pertinent findings: (1) FEW nexus issue prioritizations seem to be left to case studies or to the predilection of policymakers, (2) there needs to be increased crosslinking of FEW issues, and (3) establishing a FEW nexus governance structure is the missing link to the nexus debate. Findings from the broad analysis by Dai et al. (2018) share this sentiment, in that they state there is a clear need to improve our ability to classify and compare FEW nexus approaches to increase focus on nexus governance and implementation. Similarly, in a study of eight FEW nexus modeling approaches, Zhang et al. (2018) found that system performance evaluation was lacking, and that nexus-specific assessment metrics and quantitative approaches need to be developed. These are some of the reasons why developing policy-relevant insights that influence the environment, racial equity, and human health for the FEW nexus for example are a scientific challenge (Scanlon et al., 2017). The present study attempts to address this scientific challenge by establishing a FEW nexus quantitative approach that considers the environment, racial equity, and human health to varying extents.
Another popular approach to exploring policy-relevant FEW insights has been life cycle assessment (LCA). LCA studies are more specific than broad analyses and tend to yield quantitative, FEW impact data for some group of products. The boundaries of such studies begin at the cradle (often farm) and end at the farm gate (Monti et al., 2009; Nhu et al., 2016; Tabatabaie and Murthy, 2016), retail and food transport (Mundler and Rumpus, 2012; Yang and Campbell, 2017), or end-of-life/food waste disposal (Nayal et al., 2016; Eriksson and Spångberg, 2017). Quantitative results from these often come in the form of environmental impacts, such as land use, greenhouse gas (GHG) emission, air contamination, energy use, and water use estimations. For example, a study on U.S. beef production found that cultivating a single cow from cradle-to-farm-gate results in the GHG emission of 5,310 kilograms (kg) of carbon dioxide equivalents (CO2e) and uses 33,000 square meters (m2) of land on average (Pelletier et al., 2010). Another cradle-to-farm-gate study on U.S. beef production found water was used at rates between 2,015 and 2,925 liters (L) per kg of beef produced (Rotz et al., 2013). Data from these kinds of studies can be converted into consistent units and aggregated to assess overall cradle-to-farm-gate FEW impacts (Tilman and Clark, 2014). Despite the quantitative information that is derived from LCA studies, they have historically failed to consider the full diversity of ecosystem services and their socioecological dynamics (Pavan and Ometto, 2018).
The U.S. government generates policy-relevant data by estimating land, energy, and water impacts for the entire U.S. food system. For instance, 52% of the total U.S. land area is used for agricultural activities that supply food for human consumption, including cropland, grassland pasture, forestland graze, and farm road uses (USDA ERS, 2014). This share is down 11% from what it was in 1949 due to declines in cropland and grazed forestland uses. Cradle-to-grave food system activities—which include cradle-to-farm-gate activities but extend to food distribution, preparation, and end-of-life/food waste disposal activities—account for about 16% of the national energy budget (USDA ERS, 2010). Also, agriculture accounts for about 80% of the nation's total consumptive water resources through ground and surface water use (USDA ERS, 2018). These findings suggest that reductions in FEW impacts and effective policy development could reduce burdens on natural resources.
Socioeconomic status (SES) studies have also attempted to produce relevant policy insights for FEW data. These studies tend to utilize existing government or institutional data (Ogden et al., 2010; Snyder and Dillow, 2012). In doing so, these studies have made associations that link SES and the FEW nexus. For example, socioeconomic inequalities have been linked to diet quality through disparate food choice and purchasing behaviors (Pechey and Monsivais, 2015). Other studies have focused on associations between SES indicators, food choice, and human health, generalizing that those with higher SES—for example, social groups with more income than other groups—exhibit food purchasing habits that lead to the acquisition of healthier food items—such as foods with higher fiber, higher protein, and lower sodium content (Appelhans et al., 2012; Pechey et al., 2013; Pechey and Monsivais, 2016).
Those with lower SES—for example, social groups with less income than other groups—tend to choose food items with more energy density in attempt to ward off feelings of insufficiency and scarcity (Cheon et al., 2018). Studies like these can produce policy-relevant data since they tend to be methodologically linked with the kinds of institutions that develop or enforce public policy. For instance, U.S. SES data primarily comes from the Bureau of Labor Statistics, a subsidiary of the U.S. Department of Labor, which develops and enforces public policy. This differs from studies that may use SES data from nongovernmental sources—for example, using SES data from surveys administered by a research group with no government affiliations. Nevertheless, there has been no U.S. study we are aware of that links FEW impacts to SES across demographic groups.
In the present study, we integrate SES with pertinent LCA findings to produce policy-relevant data and insights for the environment as it relates to U.S. demographics. This approach allows us to explore the central question driving the present study: How do food consumption and spending choices of the three largest U.S. demographic groups (Black, Latinx, White) correlate with FEW impacts (land, GHG, water)? We begin answering this question by describing our methodology in the Experimental Protocols section, followed by a detailed explanation of our data in the Results section. Then, we discuss our findings and study limitations in the Discussion section. We conclude by recapping major study components and implications in the Summary section.
Experimental Protocols
Figure 1 shows the relationship between key study components. We provide methodology for each in the following subsections. First, we explain our approach for using LCA-derived FEW impact findings to produce cradle-to-farm-gate FEW impacts for basic food items. Next, we explain our methodology for combining FEW impacts with average food intake to produce food-consumption impacts (FCIs) across demographics. We then explain our methodology for aligning food-spending data with FCIs to produce FCIs per dollar spent (FCI$) on SES food groups across demographics. Lastly, we describe the methodology for our statistical analysis.
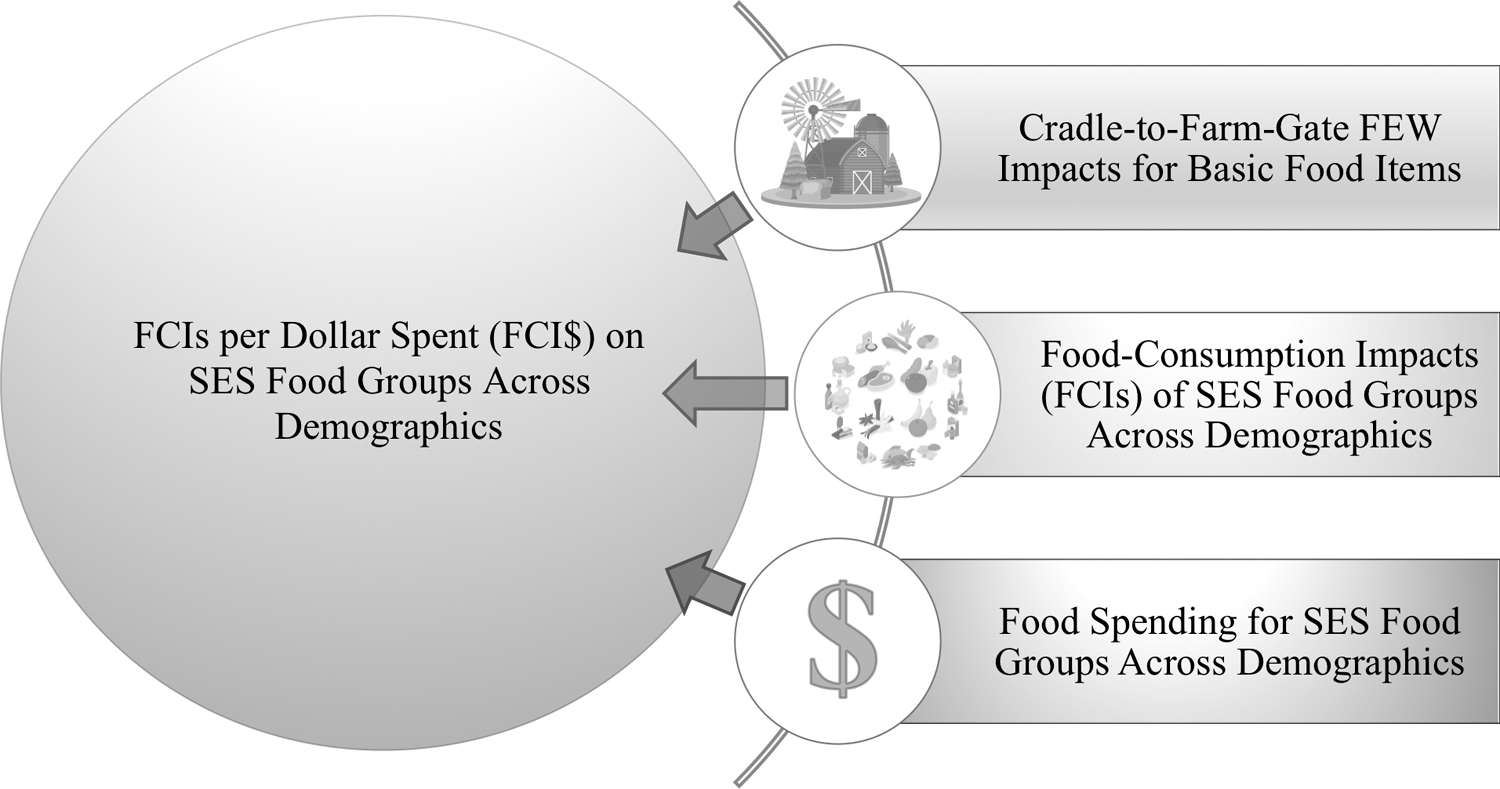
Major components for the present study's analytics and data relations, showing that annual FCI$ rates are comprised of three key components. FCI$, food-consumption impacts per dollar spent.
Our principal equation for calculating FCI$ is:
where n denotes the food item of a particular SES food group, xn denotes the annual consumption of food item n in units of kg per year (kg/year), and
Cradle-to-farm-gate FEW impacts for basic food items
A large group of basic food items were identified and aggregated to represent the expanse of food commodities consumed in the United States. Americans consume over 7,000 different kinds of foods that make up more than 500 food commodities, and basic food items make up the constituents of these food commodities (USEPA FCID, 2018). After reviewing LCA study methodological approaches and data availability bounds of key FEW sources, a cradle-to-farm-gate boundary was selected (Bozeman et al., 2019).
LCA findings were originally compiled for 24 basic food items that effectively represent the bulk of what is consumed. These 24 basic food items were selected by first compiling a list of basic foods, meaning that they were not a derivative of other foods (USEPA FCID, 2018). For instance, sugar—a nutrient that exists naturally in fruits–is not a basic food item once it is manufactured in a way that yields a derivative sugar product such as refined sugar. This is why sugar is not listed as a basic food item although it is naturally present in many of the basic food items identified in the present study. We then performed an exhaustive search for cradle-to-farm-gate land, GHG, and water data for each basic food item chosen. This search utilized findings primarily from centralized databases maintained by the Food and Agriculture Organization, OpenLCA, Barilla Center for Food and Nutrition, and the United States Department of Agriculture; and supplemented by literature reviews. Basic food items that had cradle-to-farm-gate land, GHG, and water data available were aligned with USEPA FCID (2018) food commodities to estimate the expanse of foods consumed in the United States (Bozeman et al., 2019).
The food groups relevant to the present study were identified as vegetables, fruits, protein food, dairy, and grains. The oil food group was excluded since there were no socioeconomic spending indicators for this category, making it 23 basic food items that were ultimately incorporated. Table 1 shows the mean FEW impacts for these five food groups [i.e.,
Annual Cradle-to-Farm-Gate Food–Energy–Water Impacts for Basic Food Items
These FEW impacts are adapted from Bozeman et al. (2019), where bolded values represent aggregate FEW impact means for each food group.
FEW, food–energy–water.
We also explored food-related retail and food acquisition transport impacts to assess the importance and applicability of life-cycle GHG emissions beyond the cradle-to-farm-gate study boundary. The distance that food is transported from the farm or production site is known as food miles, which can account for the relatively long distances that many food items travel before reaching consumers (Coley et al., 2011; Kissinger, 2012). Food miles and their life cycle GHG emission estimations vary country to country and region to region largely due to differences in study framing and dynamic food market conditions (Rothwell et al., 2016; Mohareb et al., 2017). These regional and country-level variances make associated food–mile estimations difficult to interpret and frame. Furthermore, research suggests that food miles deriving from U.S. activities represent only a small portion of life cycle GHG emissions (Weber and Matthews, 2008). We have therefore excluded food miles from the present study.
FCIs of SES foods across demographic groups
As the focus of this study is to explore how FCIs correlate with food-spending patterns across demographic groups, we identified associative SES indicators that encompass useful food expenditure data. Eight indicators were identified for the purposes of understanding FEW impact correlations based on the review of data from U.S. Government sources and their affiliates (USDA, 2016a; USBOLS, 2017; ACS, 2018). Table 2 shows a listing of the SES indicators and their correlation with FCIs.
Socioeconomic Status Indicators
Bolded terms highlight SES food group designations from Table 1.
AEA, annual expenditures: all; AEAF, annual expenditures: all food; SES, socioeconomic status.
The U.S. population was estimated at 326,971,407, with the Black demographic at 13.3% of the total population, the Latinx demographic at 17.8%, and the White demographic at 61.3% (USCB, 2017, 2018). Altogether, Black, Latinx, and White demographic groups represent 92.4% of the U.S. population. The other 7.6% of the population—such as Native American, Pacific Islander, and Asian—had food intake data that were aggregated as if they were a single demographic category (USEPA FCID, 2018). This “other” demographic group was not included in the present study since there was no disaggregated food intake data available. In other words, Native American, Pacific Islander, and Asian populations have very different food-consumption profiles and cannot be meaningfully analyzed as a single group. As such, analysis of this other demographic group would not yield meaningful insights (Bozeman et al., 2019). Furthermore, the Latinx demographic—that is, Mexican American and other Hispanic demographic categories as shown in the EPA FCID database (USEPA FCID, 2018)—is termed “Latinx” in effort to align with modern intersectional, gender nonbinary, social terminology (García, 2018). Race reference information from the Census data can be found in the Appendix section (Appendix Table A1).
SES indicator data, in its original form, are linked to the Average Number in Consumer Unit value, which differs between demographic groups. The Average Number in Consumer Unit value is an average number of people per household (USBOLS, 2018). For the year 2017, Black and White households have equal values with an average of 2.4 people per household, while Latinx households have a higher average at 3.2. The U.S. average is 2.5 people per household (USBOLS, 2017). These points carry particular importance when SES indicator values are being assessed directly and not as ratios or percentages.
Table 3 shows the per-household average food intake and FCIs for SES food groups across demographics (Black, Latinx, White). The average intake rates (xn) for each food item of a SES food group (grains, protein, dairy, fruits, vegetables) were multiplied by their corresponding FEW impact mean (
Annual Per-Household Food Group Intake and Food-Consumption Impacts Across Demographic Groups
Bolded values denote the highest food intake and FCI values for each SES food group across demographics. The U.S. category includes all demographic groups, including Black, Latinx, and White households.
FCI, food-consumption impact.
The demographic group with the highest SES food group intake rate does not always have the highest FCIs across land, GHG, and water categories. Relatively high intake rates of a particular food item can contribute to a higher FCI in one or more categories even when that demographic has a lower SES food group intake value. For example, Table 3 shows that White households tend to have the largest water FCI in the fruits food group despite having the lowest average household food intake compared with Black and Latinx households. This is partly due to White households having the highest within-demographic intake rate of grapes (Appendix Table A2). This particular food item has a relatively high water use rate (542 L/kg), but has low land and GHG rates compared with other within-food group food items (refer to Table 1). When taken together to calculate FCIs, the grapes food item intake and FEW impact rates for White households contribute to Whites having the largest water FCI in the fruits food group despite consuming fruits at the lowest household rate. This same dynamic occurs for the White demographic in the protein food group for GHG and water, and for the Latinx demographic in the grains food group for land and GHG (Table 3).
Food spending for SES foods across demographic groups
Table 4 shows the 2017 annual expenditure values. The data year was established as 2017 since it was the most recent SES dataset available. SES indicator values were adjusted to allow for meaningful correlations with per-household FCIs. The term adjusted denotes that the SES indicator values have been proportionally altered to make the average number of people per household value equal across each demographic group at 2.4. This means that corresponding Latinx SES indicator values are 75% of their unadjusted values, U.S. average values are 96% of their unadjusted values, and Black and White SES indicator values were unchanged.
Adjusted, Annual Socioeconomic Status Indicator Values Across Demographics
Bolded values denote the highest within-demographic food group expenditure. The U.S. category includes all demographic groups, including Black, Latinx, and White households. Expenditures for the five food groups do not approximate total AEAF since spending on other food groups are not included.
Food spending (Table 4) and FCIs (refer to Table 3) are major study components of FCIs per dollar spent on SES foods (FCI$) across demographic groups. Effectively, FCI$ is an annual ratio of either land (m2), GHG (kgCO2e), or water impacts (L) for every dollar spent in a SES food group.
Statistical analysis of food-related SES indicators
Analysis of variance (ANOVA) was used to analyze the significance level (i.e., p-value) of mean group differences between Blacks, Latinx, and White households for SES indicators. By calculating the F-statistic and assessing significance level for each aforementioned SES indicator (Larson, 2008; Tabachnick and Fidell, 2013), we were able to determine whether there were meaningful differences between demographic group mean values. The entire U.S. population, classified as a single group, was excluded from within-demographic ANOVA analysis since it is an aggregation of Black, Latinx, White, and other demographic groups.
ANOVA results tell us whether there is an overall difference between our three demographic groups. The overall difference between these groups were considered very significant if the p-value was 0.010 or below (i.e., p = 0.010 or p = 0.001). That is, if the p-value was found to be 0.010 or lower there was very high confidence that the mean group differences between demographics were meaningful and not due to chance, indicating a confidence interval (99% CI) or higher.
Results
Statistical significance of SES indicators
Table 5 shows the significance level for all of the identified SES indicators except for the Average Number in Consumer Unit indicator. This indicator is different from the others since it does not have a sampling error associated with it (USBOLS, 2017). The remaining seven indicators were analyzed for statistical significance. Five of the seven have a p-value of 0.001. The grains and protein indicators have a p-value of 0.010. All indicator p-values best the standard 0.050 p-value threshold for significance (Rice, 1989). This means that all SES indicators are very significant with a CI of 99% or higher. In other words, within-demographic mean differences (i.e., mean differences of SES indicators across demographic groups) are unlikely to exist by chance and are influenced by demographic group identification.
Statistical Significance of Socioeconomic Status Indicators Per Household
“N” denotes sampling size. Supplemental sampling size data can be found in the Appendix section (Appendix Table A5).
Broad expenditure analysis
Broad expenditure characteristics were analyzed to understand how different demographic groups tend to spend money. In Fig. 2, the SES category represents the ratio of dollars spent on all food (AEAF) to the total amount of USD spent on all expenses (AEA) as a percentage: Expensed for All Food (i.e., ratio of average food expenditures against total expenditures). The AEA category encompasses spending for all living expenses (e.g., rent/mortgage, household operations, health care, and clothing expenses), whereas AEAF encompasses all food expenses (e.g., food purchased for the household and away from home). These results show that Latinx households use the highest proportion of their total expenses on food spending compared with Black and White households. Note that this holds even after correcting for the larger average size of Latinx households.

Household comparison of the percentage of AEA spent on AEAF, where “**” denotes p = 0.001 (CI of 99.9%). Broad expenditure SES category names are located on the horizontal axis. AEA, annual expenditures: all; AEAF, annual expenditures: all food; CI, confidence interval.
Figure 3 shows the percentage of AEAF dollars spent on SES foods: grains, protein, dairy, fruits, and vegetables food groups. These results show that Latinx households tend to spend the highest proportion of food expenditures in the dairy, fruits, and vegetables categories, whereas Black households are shown to spend the highest proportion in grains and protein categories on average. These results also indicate that the highest proportion of AEAF is expensed on the protein food group compared with grains, dairy, fruits, and vegetables. It is also interesting to note that while White households spend the largest dollar amounts in each of the food categories, these expenditures represent a relatively small proportion of their entire expenditures. Supplemental income data can be found in the Appendix Section (Appendix Table A4).

Household comparison of broad expenditure SES categories and their corresponding demographic group as a percentage of expenditures, where “*” denotes p = 0.010 (CI of 99%) and “**” denotes p = 0.001 (CI of 99.9%). Broad expenditure SES category names are located on the horizontal axis.
Food intake patterns across demographic groups
Food intake was assessed to better understand how eating patterns differ between demographic groups (Fig. 4). Black households are shown to consume the largest ratio of food from the protein food group (23%) compared to proportional intakes for Latinx (19%) and Whites (19%) households on average. The same is true for grains.

Food intake of food groups for each demographic. Food intake data comes from Table 3.
Black and Latinx households share similar intake patterns for two food groups. Results show that these demographics consume the same proportion of fruits (21%) and vegetables (16%). In the case of fruits, White households fall below Black and Latinx households at 17%; and for vegetables, White households are shown to have the highest proportion across demographic groups at 18%.
The largest disparity in proportional food intake across demographic groups is shown in the dairy food group. Results show that Black households have a relatively low proportional intake of dairy (20%). Furthermore, results show that Latinx (26%) and White (27%) households tend to consume higher ratios of dairy than Black households. This higher proportion of dairy intake for Latinx and White households reduce the intake ratios of their other food groups, respectively.
Ratios of food intake lend insight into food-consumption patterns, but FCIs more so correlate with the amount of food consumed. That is, kilograms of food consumed has positive proportionality with FCIs: the more food that is consumed, the more aggregate environmental resources that tend to be used to produce such food (refer to Table 3).
FCI$ across demographic groups
We divided the annual FCIs by corresponding SES food spending to find impact expense rates for each demographic group [refer to Eq. (1)]. Figure 5 shows that protein has the highest aggregate land impacts for FCI$ categories across all demographic groupings—the most environmentally intense food group. Latinx households have the highest land impact rate for protein at 4.32

Per-household comparison of annual land FCI$ across demographic groupings as a number of square meters of land impact per dollar rate. FCI$ categories are located on the horizontal axis. The bolded value denotes the demographic with the highest aggregate land FCI$.
Figure 6 shows a household comparison of GHG FCI$ across demographic groupings. These results indicate that dairy has the highest aggregate GHG impacts for FCI$ categories across all demographic groupings. Results also show that Latinx households have the highest GHG impact rate for grains at 1.05 (
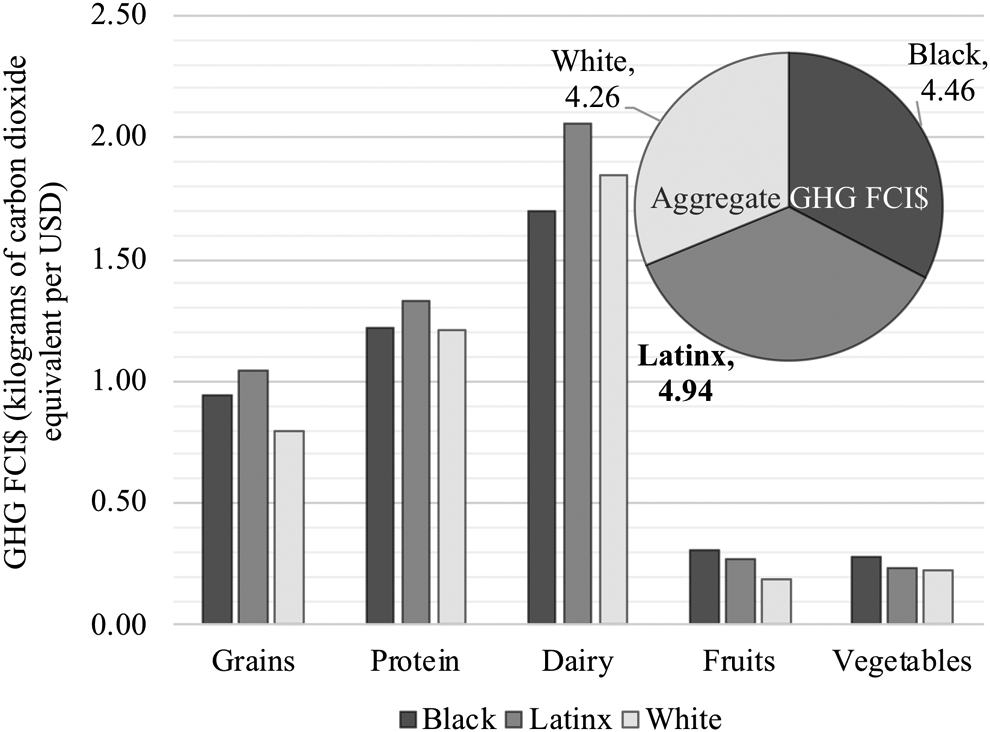
Per-household comparison of annual GHG FCI$ across demographic groupings as a number of kilograms of carbon dioxide equivalent emitted per dollar rate. FCI$ categories are located on the horizontal axis. The bolded value denotes the demographic with the highest aggregate GHG FCI$. GHG, greenhouse gas.
Figure 7 shows a household comparison of water FCI$ across demographic groupings. Grains show the highest aggregate water impact across all FCI$ groupings here. Within the grains category, Latinx households have the highest water use rate at 1402.47
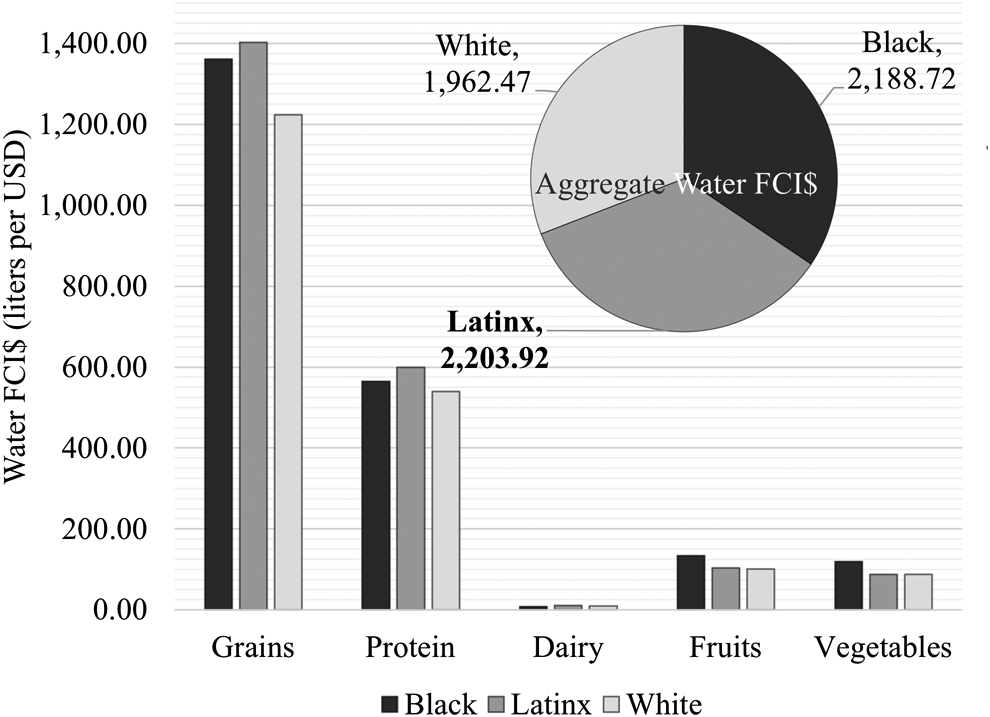
Per-household comparison of annual water FCI$ across demographic groupings as number of liters per dollar. FCI$ categories are located on the horizontal axis. The bolded value denotes the demographic with the highest aggregate water FCI$.
Land, GHG, and water FCI$ results show that Latinx household food purchasing and consumption tends to affect the environment the most for every dollar spent compared to Black and White households, with aggregate FCI$ rates of 8.16
Overall results also show that protein represents a relatively large proportion of aggregate land FCI$ rates, dairy for GHG, and grains for water compared to other food groups across demographic groupings. This suggests that reducing food spending and consumption of environmentally intense foods (i.e., food items that have the highest FEW impacts or FCIs) within the protein and grain food groups could result in the highest conservation of cradle-to-farm-gate land and water resources, whereas reducing dairy food spending and consumption could mitigate the most GHG emissions. Please see the Appendix section for detailed numerical values (Appendix Table A3).
Discussion
The present study addresses an important research gap by correlating food spending and FEW impacts with demographics. In doing so, we have established an innovative methodology that integrates SES and FEW LCA findings. This approach has produced statistically significant FCI$ rates for U.S. Black, Latinx, and White households. One of our major findings is that Latinx household food purchasing and consumption behavior tends to affect the physical environment the most for every dollar spent compared to Black and White households. Yet, Latinx and Black household FCI$ patterns match closely. We sought to uncover why these patterns emerge, and then developed policy suggestions based on these insights.
Our results suggest that Latinx and Black households are spending less on food overall but purchasing higher proportions of environmentally intense food items in the protein, dairy, and grain food groups compared to White households. Recent research suggests that individuals from lower SES groups tend to choose food items with more energy density in attempt to ward off feelings of insufficiency and scarcity (Cheon et al., 2018). Specifically, these feelings of insufficiency and scarcity tend to result in the purchasing of lower-cost, high-calorie foods compared to fruits and vegetables. These feelings also tend to lead to the consumption of increased food quantities during meal and snack times.
Latinx and Black households earn less on average than White households, and as such have lower purchasing power. Alkon et al. (2013) found that food cost was the primary barrier to healthy food access in low-income areas in the cities of Oakland, California, and Chicago, Illinois. Other studies support this sentiment by highlighting food access and cost barriers for lower-income populations (Coveney and O'Dwyer, 2009; Walker et al., 2010; Breyer and Voss-Andreae, 2013). These previous studies suggest that the purchase of higher-priced, healthier food items is inhibitive for demographic groups of lower SES.
Taken together, these findings suggest that Latinx and Black households are more likely to purchase cheaper, energy-dense food items at higher proportions than White households. This supports the present study results, which find that Latinx and Black households have higher aggregate FCI$ rates in land, GHG, and water compared to White households. Furthermore, there are significant health implications of poor dietary consumption patterns characterized by cheap, low-quality, energy-dense foods. In a study that explored food availability and access in Black communities, Odoms-Young et al. (2009) found that minority populations are disproportionately at risk for obesity compared to Whites. Human health findings like the one aforementioned can be more directly explored with the present study's framework since it correlates FEW impacts with SES on quantitative terms.
Policy recommendations for reducing FCIs need to be cognizant of the differences in food consumption and spending across demographic groups. While it is generally accepted that reducing beef consumption can have significant environmental benefits (Pelletier et al., 2010; Heller and Keoleian, 2014; Tilman and Clark, 2014), our study shows that higher protein consumption in Latinx and Black households correlate with their lower SES or purchasing power. As such, shifts to similar energy-dense, but less environmentally impactful protein choices may be necessary to meet the calorific needs of these populations. On the other hand, plant-based diets tend to be less environmentally impactful than meat-based diets (Clark and Tilman, 2017); so, getting more people to consume less environmentally intense foods may require a shift in some consumers' preference toward meat, or may require asking households to shift their purchases to more fish or plant-based foods. However, switching to fish or plant-based foods can present food accessibility challenges for households identified as having lower SES such as those of the Black demographic (Walker et al., 2010). This exemplifies why none of these suggestions are easy. Nonetheless, the demographic and SES-specific findings related to FEW impacts reveal a path for improving the understanding of food-consumption and -spending impacts on the environment. Furthermore, our study findings facilitate the development of demographically specific communication to address these concerns.
The present study has policy implications relevant to the environment, racial equity, and human health. One policy implication could manifest by incorporating FCI$ estimates into educational materials for Supplemental Nutrition Assistance Program (SNAP) recipients. That is, FCI$ rates could be highlighted as part of the USDA's existing SNAP Education (SNAP-Ed) program, which is an evidence-based program that helps benefit recipients lead healthier lives. The USDA could make FCI$ awareness a prerequisite for SNAP benefits. Such a measure could positively affect the food-consumption behavior of anyone informed by SNAP-Ed, with a concentrated effect on Black, Latinx, and White SNAP recipients. Of the total SNAP recipients, these demographic groups represent 79.9% of 45.8 million people and 22.5 million households (USDA, 2016b). It follows that FCI$ awareness through SNAP-Ed could influence many to be mindful of the environmental and human health impacts of food choice and purchasing habits. This demographically specific education could be provided to recipients who give consent and identify as one of the three major demographic groups (Black, Latinx, White).
Another policy implication could be to incentivize SNAP recipients of a particular demographic to increase the purchase of fish- and plant-based foods through increased monetary benefits. Such an increase in benefits could play a role in alleviating food access challenges for demographics of lower SES.
A third policy implication could be to use demographically specific FCI$ rates as part of USDA national dietary guidelines. Issues of food access and race are already a part of the 2015–2020 Dietary Guidelines, including suggestions to incentivize store development to increase healthy food access and affordability for lower SES groups and improving organizational programming so that issues of food access are seriously considered (USDA, 2015). Data and findings from the present study could bolster this section of the national dietary guidelines by highlighting how SES and FCI$ trends support the sentiment of developing effective food access incentives and educational programming.
Future research can use our methodological approach to link nutritional intake, SES, and FEW impacts to yield quantitative measures of human health as it relates to FEW impact estimations. Examples of research questions worth exploring are: how have demographic food intake patterns changed over time and what economic and social influences correlate with significant changes in food spending across demographic groups? Similarly, how does relative consumption of specific food items within food groups (e.g., chicken vs. beef) vary across demographic groups and what are the related environmental and health implications? Nonetheless, the path toward linking environmental impacts like land, GHG emissions, and water with human health outcomes is even more tangible than before.
Study limitations
There are key study limitations that should be considered when assessing present study results and findings. First, using mean values for FEW impact estimations and FCI calculations can skew results, in that not considering the share of purchases of less impactful to more impactful versions of foods (i.e., foods that are more land, GHG, or water intensive than others) can hide more specific food-impact patterns across demographic groupings. For instance, land FEW-impact estimates show that minimum beef rates (19.902
It follows that using average household size can hide ranges within FCI calculations, even though sampling error or range informatiom was not provided in the USBOLS (2017) dataset for household sizes. Nonetheless, interesting findings could emerge in a similar study where value ranges and overlaps are the analytical focus rather than statistically significant means. In the present study, we chose to assess applicable mean values using statistical significance to ensure the resultant FCI calculations were meaningful and not due to chance alone. We determined this approach was essential in framing an exploratory study of this kind.
Another study limitation is that the demographically specific food intake data is derived from year 2005 to 2010 surveys (USEPA FCID, 2018), whereas SES indicator values are from year 2017 (USBOLS, 2017). It would be ideal to have more recent food intake data across demographic groups that fit into the present study's framework.
It is also important to note the relationship between the present study findings and those from Bozeman et al. (2019). Bozeman et al. (2019) found that White eating patterns impact the environment the greatest in GHG and water, while Black eating patterns impact the environment the greatest in land on a per-capita basis. The present study results and findings suggest that Latinx and Black food spending affect the environment the greatest as a function of FCI$ rate on a per-household basis. These study findings should not be compared directly since they differ in framing and methodology. Rather, the present study and Bozeman et al. (2019) should be viewed as component studies that explore the FEW nexus and demographics in different ways.
Summary
We explored how environmental impacts of food consumption across Black, Latinx, and White demographics correlate with household spending in the United States. Grains, protein, dairy, fruits, and vegetables were identified as major food groups for cradle-to-farm-gate land, GHG, and water impacts. Impact expense rates were then calculated to show how Black, Latinx, and White households affect the physical environment through demographically specific food consumption and purchasing behavior (i.e., FCI$s). Our study yields statistically significant FCI$ rates for major U.S. demographics by integrating SES with pertinent LCA findings. Results show that Latinx household food purchasing and consumption behavior tends to affect the environment most for every dollar spent compared to Black and White households, with aggregate FCI$ rates of 8.16
Key findings suggest that the high impact expense rates for Latinx and Black households are attributable to relatively low average household income. That is, lower SES is associated with the purchase of more cheaper, energy-dense foods as a means to ward off feelings of insufficiency and scarcity. Findings suggest that reducing food spending and consumption of environmentally intense foods within the protein and grains food groups could result in the highest conservation of cradle-to-farm-gate land and water resources, whereas reducing dairy food spending and consumption could mitigate the most GHG emissions.
Our findings also suggest that different messaging relevant to particular demographic groups may be necessary to encourage healthier and lower-impact dietary choices. These findings and results are critical in providing practitioners, policy makers, and researchers with policy-relevant insights and data that influence environmental and racial equity matters. Furthermore, these findings could facilitate studies that link environmental impacts with human health given further analysis.
Footnotes
Acknowledgments
This study was funded in part by the Institute for Environmental Science and Policy of the University of Illinois at Chicago and the Bayer-Monsanto Diversity Science, Technology, Engineering, and Mathematics Fellowship. The authors would like to acknowledge Dr. Rayne Bozeman from Chicago State University in Chicago, IL, USA, for her input on the statistical analysis framework and data visualization.
Author Disclosure Statement
No competing financial interests exist.
Appendix: Distinguishing Environmental Impacts of Household Food-Spending Patterns Among U.S. Demographic Groups
Sample Sizes for Annual Food-Consumption Rates Across Demographics
| Demographic | N |
|---|---|
| Black | 5,337 |
| Latinx | 7,869 |
| White | 10,249 |
| U.S. | 24,673 |
“N” represents 2-day average, per-capita, food commodity mass sample sizes as shown in USEPA FCID (2018). Sampling errors and statistical analyses of basic food items, and their USEPA FCID (2018) alignment, can be found in Bozeman et al. (2019).