
Abstract
Abstract
This study investigated the adsorptive removal of fluoride from simulated water pollution using various (hydro)oxide nanomaterials, which have the potential to be used as sorbents for surface water and groundwater remediation. Tested nanomaterials include hematite, magnetite, ferrihydrite, goethite, hematite-alpha, hydroxyapatite (HAP), brucite, and four titanium dioxides (TiO2-A [anatase], TiO2-B [rutile], TiO2-C [rutile], and TiO2-D [anatase]). Among 11 (hydro)oxide nanomaterials tested in this study, ferrihydrite, HAP, and brucite showed two to five times higher removal of fluoride than other nanomaterials from synthetic fluoride solutions. Freundlich and Redlich–Peterson adsorption isotherms better described the adsorptive capacity and mechanism than the Langmuir isotherm based on higher R2 values, indicating better fit of the regression predictions. In addition, the adsorption kinetics were well described by the intraparticle diffusion model. Column studies in a fixed bed continuous flow through system were conducted to illustrate the adsorption and desorption behavior of fluoride on ferrihydrite, HAP, or brucite. Experimental results fitted well with the Thomas model because of the R2 values at least 0.885 or higher. By comparisons of the adsorption capacity and the rate constant, columns packed with ferrihydrite exhibited not only faster rates but also higher sorption capacity than those packed with HAP or brucite. Desorption tests in deionized water showed that the adsorbed fluoride could be desorbed at a lower efficiency, ranging from 4.0% to 8.9%. The study implicated that (hydro)oxide nanomaterials of iron calcium and magnesium could be effective sorptive materials incorporated into filtration systems for the remediation of fluoride polluted water.
Introduction
Fluorine, the 13th most abundant element in the Earth's crust, is also one of the most widespread contaminants in surface water and groundwater (Miretzky et al., 2008). Fluoride is typically associated with many types of fluorine-bearing rocks and minerals, averaging 625 mg/kg (Edmunds and Smedley, 2005). These fluorine-bearing rocks and minerals also supply fluoride to soil through soil forming processes such as weathering, dissolution, precipitation, and deposition, with the concentration ranging from 20 to 500 mg/kg (Edmunds and Smedley, 2005). High concentrations of fluoride (0.1 to 10 mg/L) in surface water and groundwater were reported in western United States, Mexico, Argentina, and many countries in Asia and Africa (Edmunds and Smedley, 2013). The World Health Organization (WHO) has an allowable concentration of fluoride set at 1.5 mg/L in drinking water. In addition, the U.S. EPA (2006) has enforced the U.S. drinking water primary standard at 4 mg/L, although the secondary standard (nonenforceable) for drinking water is 2 mg/L.
Elevated fluoride concentrations in groundwater are mainly attributed to two major processes: the natural release from weathering and dissolution of fluoride-bearing rocks and geothermal processes and anthropogenic activity from various industries manufacturing organofluoride compounds, semiconductors, aluminum, glass, and phosphate fertilizers (Sujana et al., 1998; Kabata-Pendias and Pendias, 2001; Camargo, 2003; Shen et al., 2003).
The presence of fluoride in drinking water has been known to be beneficial to public health (Babaeivelni and Khodadoust, 2013) and is often added to municipal drinking water to prevent dental carries. However, there are increasing concerns regarding fluoride as a commonly found water pollutant (Das et al., 2003; Vithanage and Bhattacharya, 2015). Exposure to fluoride at concentrations exceeding the allowable concentration, such as 1.5 to 2 mg/L, can be detrimental to humans, causing dental and/or skeletal fluorosis (Gao et al., 2009). It is estimated that 200 million people worldwide are drinking water containing fluoride above the WHO recommended levels and are suffering from fluorosis (Chuah et al., 2016). Moreover, it is well documented that the antimicrobial effects of fluoride can inhibit the activity of various microbial cells and bacterial metabolisms in aquatic environment and soil (Marquis et al., 2003; Wiegand et al., 2007).
In the United States, fluoride poses a significant threat to ecosystem health. Of concern in the local Oklahoma/Texas region is the disposal of wastewater from petroleum refineries, as fluoride is found as a contaminant in toxic wastes from the petrochemical industry (Schroder et al., 2000). Commonly, the hazardous wastewater is disposed in land farms. However, because fluoride does not biodegrade, it accumulates in the soil and can leach out having detrimental impacts on the nearby terrestrial and aquatic ecosystems. Studies on fluoride exposures from the byproducts of petroleum refineries disclosed significant toxicological effects on sensitive keystone species such as the native Oklahoman, Cotton Rat (Propst et al., 1999; Kim et al., 2001; Schroder et al., 2003; Wake, 2005). Petrochemical byproduct disposal and other fluoride containing industrial wastes continues to threaten the environment. Alternative or pretreatment methods for disposal of wastewater byproducts are important to prevent toxicological impacts to sensitive ecosystems (Schroder et al., 2000).
To prevent the adverse effects of fluoride, many studies have examined ways to remove fluoride from water, including chemical precipitation, adsorption, ion exchange, reverse osmosis, and electrolysis (Mohapatra et al., 2009; Viswanathan and Meenakshi, 2009; Bhatnagar et al., 2011; Dolar et al., 2011). Although chemical precipitation can remove fluoride, it cannot achieve a concentration <2 mg/L. In addition, it can generate a large volume of toxic solid byproducts (Wang and Reardon, 2001; Mohapatra et al., 2011).
Ion exchange, reverse osmosis, electrodialysis, and membrane processes can effectively remove the fluoride to an acceptable level. However, these treatments are expensive since they require frequent regeneration of resins, or prevention of the membrane fouling and scaling (Pervov et al., 2000; Viswanathan and Meenakshi, 2008; Shen and Schäfer, 2014). Adsorption is a more attractive method for the removal of fluoride in terms of cost, simplicity of design, ease of operation, convenience, and availability of materials (Bhatnagar et al., 2011; Loganathan et al., 2013). Therefore, adsorption becomes the most promising technique for fluoride removal through infiltration systems that prevent the release of fluoride to receiving water bodies.
The selection of suitable and efficient sorbents is still problematic for fluoride removal in various infiltration systems. Sorbents such as granular activated carbon (GAC), aluminum hydroxides, gibbsite, and hydrous ferric oxides, and other (hydro)oxides have been used to remove fluoride from water. Ma et al. (2009) reported that GAC does not effectively remove fluoride, however, metal oxides modified GAC (e.g., MnO2 coated GAC) demonstrated better removal efficiency that fits well with Freundlich isotherm model.
In addition, various (hydro)oxides showed promising potentials for effective removal of fluoride, as summarized in Supplementary Table S1. Moreover, (hydroxyl)apatite has been illustrated to be favorable sorbents for the removal of fluoride from aqueous solutions (Hammari et al., 2004; Goa et al., 2009). The findings elucidate that increasing surface area could potentially enhance removal capacity. Thus, nanoscale (hydro)oxides were selected to evaluate fluoride removal from water due to their physiochemical properties and high surface area as well as natural presence in natural environment. The objectives of this study were to investigate the adsorption capacity of these nanomaterials for fluoride removal from water in both batch and fixed bed continuous flow through column systems.
Materials and Methods
Chemical reagents
All chemicals used in this study were reagent grade of 99% purity or better. Chemicals were purchased from Fischer Scientific, Thermo Scientific, or Sigma-Aldrich. A complete list of chemicals including ID/CAS number is provided in Supplementary Table S2.
Selected nanomaterials
Eleven (hydro)oxides nanomaterials were selected and used as adsorptive materials in this study, including hematite (Fe2O3), magnetite (Fe3O4), ferrihydrite (Fe(OH)3), goethite (FeOOH), hematite-alpha (α-Fe2O3), hydroxyapatite (HAP; Ca5(PO4)3OH), brucite (Mg(OH)2), and four different nano-sized titanium dioxides (TiO2). Nanomaterials purchased from Nano-Amor, Inc. (Houston, TX) include Fe2O3, Fe3O4, α-Fe2O3, Ca5(PO4)3OH, Mg(OH)2, TiO2-A (anatase), TiO2-B (rutile), and TiO2-C (rutile). TiO2-D (anatase) was purchased from Sigma-Aldrich (St. Louis, MO). In addition, two nanoscale iron hydroxides, ferrihydrite (Fe(OH)3) and goethite (FeOOH), were synthesized in this study. A complete list of nanomaterials including ID/CAS number is provided in the Supplementary Table S3.
The synthesis and characterization of ferrihydrite procedure were reported by Su and Suarez (1995), in which 200 mL of 1.5 M ferric chloride (FeCl3) was added to 450 mL solution of 2 M NaOH at a rate of 50 mL/min. The synthesis of goethite followed a procedure reported by Cornell and Schwertmann (1991), in which 200 mL of 0.1 M ferric nitrate (Fe(NO3)3) was added to 450 mL solution of 5 M KOH at a rate of 50 mL/min. The pH of the solution was adjusted to between 7 and 8 to ensure complete precipitation of formed ferrihydrite or goethite. The precipitate was rinsed with deionized water until the supernatant conductivity reached the range of 14 to 24 μS/cm. The precipitate was then collected and dried at 70 °C for 60 h and gently ground to pass through a 53 μm sieve. The characteristics of these nanomaterials are summarized in Table 1 and Supplementary Figs. S1, S2, and S3.
Physiochemical Properties of Nanomaterials of (Hydro)oxides Tested in This Study
Brunauer, Emmett, and Teller surface area, n = 2.
Materials selected for further study.
HAP, hydroxyapatite.
Batch experiments
Batch experiments were carried out to investigate the adsorption behavior of fluoride onto various nanomaterials. In this study, 100 mg of each sorbent was added to a 50 mL polypropylene tube mixed with 20 mL of 5 mg/L sodium fluoride (NaF) solution, in the presence of either 1.0 mM sodium chloride (NaCl) or 0.33 mM magnesium chloride (MgCl2). These electrolytes were used to evaluate the effect of different cations at the same ionic strength on the adsorption of fluoride. The tubes were incubated for 48 h on an agitator shaker at a constant speed (200 rpm) at ambient room temperature. Each batch experiment was conducted in duplicates and the results are presented as averaged value with standard deviation calculated
Of the 11 (hydro)oxide nanomaterials tested, ferrihydrite, HAP, and brucite were the three nanomaterials that showed the higher adsorption capacity of fluoride. Thus, they were selected to examine the adsorption isotherms and kinetics for fluoride based on the sorption capacity measured in previous batch experiments. For the adsorption isotherm experiments, 100 mg of nanomaterials was added into a 50 mL polypropylene tube with 20 mL of NaF at a concentration ranging from 2.5 to 240 mg/L for ferrihydrite, or 0.4 to 47 mg/L for HAP and brucite, respectively. Because ferrihydrite removed 100% of the fluoride when the concentrations were <2.5 mg/L, these values were not included in the isotherm experiments. In addition, the concentration of fluoride was up to 240 mg/L for the ferrihydrite isotherm to obtain more data for a better fitting model.
The adjusted pH was measured at 6.8, 7.0, and 9.8 for ferrihydrite, HAP, and brucite, respectively, using 1 M HCl or NaOH. For isotherm tests, ferrihydrite and HAP were evaluated at near neutral, however, brucite begins dissolving at a pH <9, thus the pH was controlled at 9.8. In this study, 1 mM NaCl was used to maintain ionic strength. The tubes were incubated for 48 h on an agitator shaker at a constant speed (200 rpm) at ambient room temperature. The samples were centrifuged at 2,740 g for 30 min and the supernatants were stored at 4°C until fluoride analysis.
For the adsorption kinetics experiment, the same setup as the isotherm experiment was used, except the concentration of F− was 5 mg/L. The tubes were removed one by one from the shaker after 0, 2, 4, 24, and 48 h. The supernatant was immediately collected and then filtered through a 0.22 μm membrane filter made from mixed cellulose esters, which was purchased from Sigma-Aldrich (catalog no. GSWPO2500) before fluoride analysis. Quality control tests were performed using NaF in deionized (DI) water as well as NaF with 1 mM NaCl, which demonstrated that there was no retention of fluoride on the filters.
Adsorption models
Mass of fluoride adsorbed on the adsorbent was calculated based on Equation (1):
where q is the fluoride adsorbed on the adsorbent (mg/g), C0 is the initial concentration of fluoride (mg/L), Ce is the equilibrium concentration of fluoride (mg/L), V is the liquid volume (L), and m is the mass of adsorbent (g).
The experimental data were analyzed using adsorption isotherm models, which include Langmuir, Freundlich, and Redlich–Peterson isotherms. Langmuir isotherm assumes monolayer coverage of adsorbate on a structurally homogeneous adsorbent surface. The Langmuir isotherm is given as Equation (2):
where KL is the Langmuir adsorption constant (L/mg), qmax is the maximum capacity of the adsorbent (mg/g), and Ce is the equilibrium concentration of fluoride (mg/L).
Freundlich isotherm model describes the multilayer adsorption of adsorbate on a heterogeneous surface of the adsorbent. The Freundlich isotherm is presented as Equation (3):
where KF is the Freundlich affinity coefficient ([mg/g] [mg/L]−1/n), Ce is the equilibrium concentration of fluoride (mg/L), and n is an empirical parameter constant.
The Redlich–Peterson isotherm is a hybrid form of both Freundlich and Langmuir isotherms, approaching the Freundlich equation at high concentrations while fitting in the Langmuir equation at low concentrations. The Redlich–Peterson isotherm includes three empirical parameters, and therefore, can describe the adsorption on either homogeneous or heterogeneous surface. This isotherm is illustrated as Equation (4):
where KR is the Redlich–Peterson isotherm constant (L/mg), αR is a constant (L/mg) β , and β is the exponent with a value between 0 and 1.
Column adsorption experiments
Ferrihydrite, HAP, or brucite was used as individual adsorbent in continuous flow columns to investigate the adsorption and desorption mechanisms of fluoride and to illustrate the adsorption capacities in both batch and column systems. Glass columns (cross-sectional area as 4.91 cm2 and height as 30 cm) were used as fixed bed (30 cm of the bed depth) up-flow reactors and packed with 1 g of adsorptive nanomaterial and 92 g of acid washed quartz sand (particle size: 0.25–0.29 mm, Sigma-Aldrich). The packed materials were premixed to create a homogeneous mixture. The pore volume was measured at 24, 22, and 21 mL for columns filled with ferrihydrite, HAP, or brucite, respectively. During the operation of each column, the influent containing 35 mg/L fluoride and 10 mM NaCl was pumped through the packed columns in an up-flow mode with a peristaltic pump at a flow rate of 1.0 mL/min at an ambient room temperature.
The adsorption capacity at the point of breakthrough (qB) is defined as the mass of fluoride ions adsorbed on the nanomaterials when the effluent concentration of fluoride reaches 5% or lower of the initial influent concentration of 35 mg/L. The adsorption capacity at the point of exhaustion (qE) is defined as the mass of fluoride ions adsorbed on the nanomaterials when the effluent concentration of fluoride reaches 95% or higher of the influent concentration.
After the fluoride is exhausted from the column, desorption experiments were performed by passing DI water as the desorption solution through the exhausted columns. The effluent was collected every 7 min for ferrihydrite, HAP, or brucite and every 9 min for quartz in the collection vessels on the fraction collector, and the pH was measured immediately. A 10 mL sample of the effluent was collected and filtered with 0.22 μm membrane filter, and stored at 4°C until fluoride analysis.
Analytical methods
The fluoride concentration of the solutions was measured using a Waters Quanta 4000 capillary ion analyzer. The procedure is briefly summarized as follows: 0.5 mL solution was injected into a 60 cm × 75 μm silica capillary column filled with a buffered electrolyte solution containing an UV-absorbing anion salt (4.6 mM sodium chromate) and an electro-osmotic flow modifier (0.46 mM OFM) with a pH at 8. The sample was introduced at the cathode end of the capillary and the anions were separated in the electric field and then were detected indirectly from the absorption of chromate using an Hg UV lamp set at 254 nm. The instrument was operated with a voltage of 20 kV and a current of 18 to 20 μA at 25°C. The injection mode was hydrostatic with a flow of 10 cm every 30 s. The duration was performed at a run time of 3.5 min.
The measurement of specific surface area was performed using a Quantachrome NOVA 2000e Surface Area and Pore Size Analyzer Brunauer, Emmett, and Teller. For each analysis, 0.1 g of dry sample was placed in a bulb cell under the parameters (e.g., temperature, duration) described in the manual instruction.
The values of pH at point of zero charge (pHPZC) for three nanomaterials (ferrihydrite, Hap, and brucite) were determined using a modified method described in a previous study (Tan et al., 2008). In brief, 50 mL of 0.1 M KCl solution was added in different 60 mL polypropylene centrifuge tubes. The initial pH of the mixture solution was adjusted to the range of 3–11 for ferrihydrite and HAp, and 9–12 for brucite using either 1.0 M HCl or 1.0 M NaOH solution. Nitrogen gas was bubbled during the pH adjustment to prevent dissolution of atmospheric CO2. Then 0.5 g of dry nanomaterial sample was added into each tube, and each tube was vigorously agitated in a shaker for 24 h at ambient room temperature. After that, the suspensions were settled down and the final pH was measured immediately. The differences between final and initial pH values (ΔpH) were calculated and plotted against the initial pH values. Therefore, the initial pH at which ΔpH is zero is the pHPZC.
Results and Discussion
Adsorption of fluoride on various nanomaterials
The purpose of selecting the 11 (hydro)oxide nanomaterials was to screen potential effective materials for fluoride removal. To accomplish this screening, batch tests were run on 11 nanomaterials to evaluate their adsorption capacity. Tests were run using both NaCl and MgCl2 as background electrolyte. As summarized in Table 2, using NaCl or MgCl2 solutions to maintain constant ionic strength (INaCl = 1.12 × 10⁻³ M and IMgCl2 = 1.11 × 10⁻³ M) showed no significant difference in the adsorption of fluoride when comparing the same nanomaterials.
Adsorptive Removal of Fluoride by Various Nanomaterials of (Hydro)oxides in Different Salt Solutions
MgCl2, magnesium chloride; NaCl, sodium chloride.
Among the 11 (hydro)oxide nanomaterials, ferrihydrite, HAP, and brucite demonstrated the two to five times higher adsorption capacity than other nanomaterials for fluoride removal from aqueous solutions, 0.99 ± 0.00, 0.92 ± 0.01, and 0.59 ± 0.01 mg F/g dry material, respectively, in NaCl solution, and 0.93 ± 0.00, 0.40 ± 0.14, and 0.52 ± 0.02 mg F/g dry material, respectively, in MgCl2 solution. For ferrihydrite and brucite, there was no observed difference for fluoride sorption capacity in NaCl or MgCl2 solution. By comparison, HAP showed less sorption capacity in MgCl2 solution than in NaCl solution, which may be attributed to the precipitation of Mg2+ on the HAP surface blocking the sorption sites (Farzadi et al., 2014). Therefore, NaCl solution was used for the rest of the experiments.
Specific surface area was compared with adsorption capacity. It was found that there was a negative relationship between the adsorption capacity of fluoride and specific surface area of selected nanomaterials. Sorption capacity of F− versus specific surface area was 0.0075 ± 0.00012, 0.310 ± .034, and 0.037 ± 0.0001 mg/m2 at 48 h equilibrium time for ferrihydrite (specific surface area, 241.5 m2/g), HAP (17.3 m2/g), and brucite (104.9 m2/g), respectively. The adsorption of fluoride on ferrihydrite was conducted at pH of 6.8, which is slightly lower than that measured pHPZC of 7.7, indicating the positive surface charge. Thus, the adsorption of fluoride using ferrihydrite is mainly due to electrostatic attraction on the surface of ferrihydrite (Huang et al., 2011).
In contrast, HAP, having the lowest specific surface area, demonstrated the second highest adsorption of fluoride. It has been shown that both physical adsorption from electrostatic interaction and chemical adsorption from ion exchange can be the driving forces for the removal mechanism of fluoride using HAP (Sandaram et al., 2009; Wang et al., 2011; Zhang et al., 2012). In this case, the formation of fluorite (CaF2) was determined as the primary removal mechanism, based on (1) thermodynamic modeling of the system (MINTEQ 3.1 software) showing supersaturation of CaF2 and (2) batch experiments were conducted at a pH of 7, leading to the slight dissolution of HAP (solubility = 6.8 mg/dm3), releasing Ca2+ and precipitating CaF2 (Uskoković, 2015). Thus, the removal of fluoride using HAP is attributed to the strong chemical bond of fluoride with the structural calcium of HAP.
As for the adsorption of fluoride onto brucite, one mechanism could be electrostatic attraction, since the pH of adsorption at 9.8 was lower than the measured pHPZC of 10.1, suggesting a positively charged surface. Although the measured pHPZC is close to the pH of adsorption (only 0.3 pH units apart), it is still considered to be the main adsorption mechanism, because the solubility of MgF2 (Ksp = 2.6 × 10⁻⁴) is much less than CaF2 (Ksp = 3.9 × 10⁻¹¹), indicating much weaker binding of F− with Mg2+ than F− with Ca2+. Thus, the system is more likely to remove the fluoride anion due to electrostatic attractions with Mg2+ than surface precipitation of MgF2. Because MgF2 does occur naturally, it could be argued that direct bonding between Mg2+ and F− to form MgF2 may be occurring. However, the simulation using desorption chemistry modeling (MINTEQ 3.1 software) shows that the solution is unsaturated with respect to MgF2, further supporting electrostatic interactions as the primary mechanism.
Batch experiments of the adsorption isotherms were performed to evaluate the affinity of fluoride removal to three nanomaterials, including ferrihydrite, HAP, and brucite. As shown in Fig. 1, the experimental data were fitted to the Langmuir, Freundlich, and Redlich–Peterson isotherm equations. The isotherm parameters and R2 values for each model are summarized in Table 3. The R2 values indicate that Freundlich and Redlich–Peterson isotherms can best represent the adsorption of fluoride on each nanomaterial. Thus, the best fit of both Freundlich and Redlich–Peterson isotherms strongly indicates the adsorption of fluoride on the heterogeneous surfaces of the nanomaterials.

Adsorption isotherms of fluoride fit with the Freundlich, Langmuir, and Redlich–Peterson equations. The experiment was operated at pH of 6.8, 7.0, and 9.8 for ferrihydrite, HAP, and brucite, respectively, in 1 mM NaCl solution at ambient room temperature. Fitting lines were extrapolated with linear integration. Error bars are calculated from standard deviation (n = 2). HAP, hydroxyapatite; NaCl, sodium chloride.
Model Parameters of Freundlich, Langmuir, and Redlich–Peterson Isotherms for Adsorption of Fluoride
The β values, ranging from 0.59, 0.63, and 0.39 for ferrihydrite, HAP, and brucite, respectively, are lower than the unity indicating that the fluoride has not reached maximum coverage on the nanomaterials. This result showed that the multiple active sites on the heterogeneous surfaces of nanomaterials express different affinities for the removal of fluoride. Previous studies reported similar findings on the adsorption isotherms of fluoride by different materials. The comparison of the model parameters of Freundlich and Langmuir isotherms as well as Redlich–Peterson isotherm is given in Table 3.
Batch adsorptions for fluoride as a function of time on ferrihydrite, HAP, and brucite are presented in Fig. 2. Since the adsorption started immediately and reached the maximum equilibrium quickly, not enough experimental data were available to be processed and fitted in common kinetics models (e.g., pseudo-first-order model and pseudo-second-order model). However, the experimental adsorption data were well described by the three-step intraparticle diffusion model (Sun and Yang, 2003; Noroozi et al., 2007). The first step reflects the instantaneous external surface adsorption stage; the second step represents the gradual adsorption stage, which takes place very fast. The third step reaches the final equilibrium stage, where the intraparticle diffusion slows due to the extremely low solute concentration in solution.
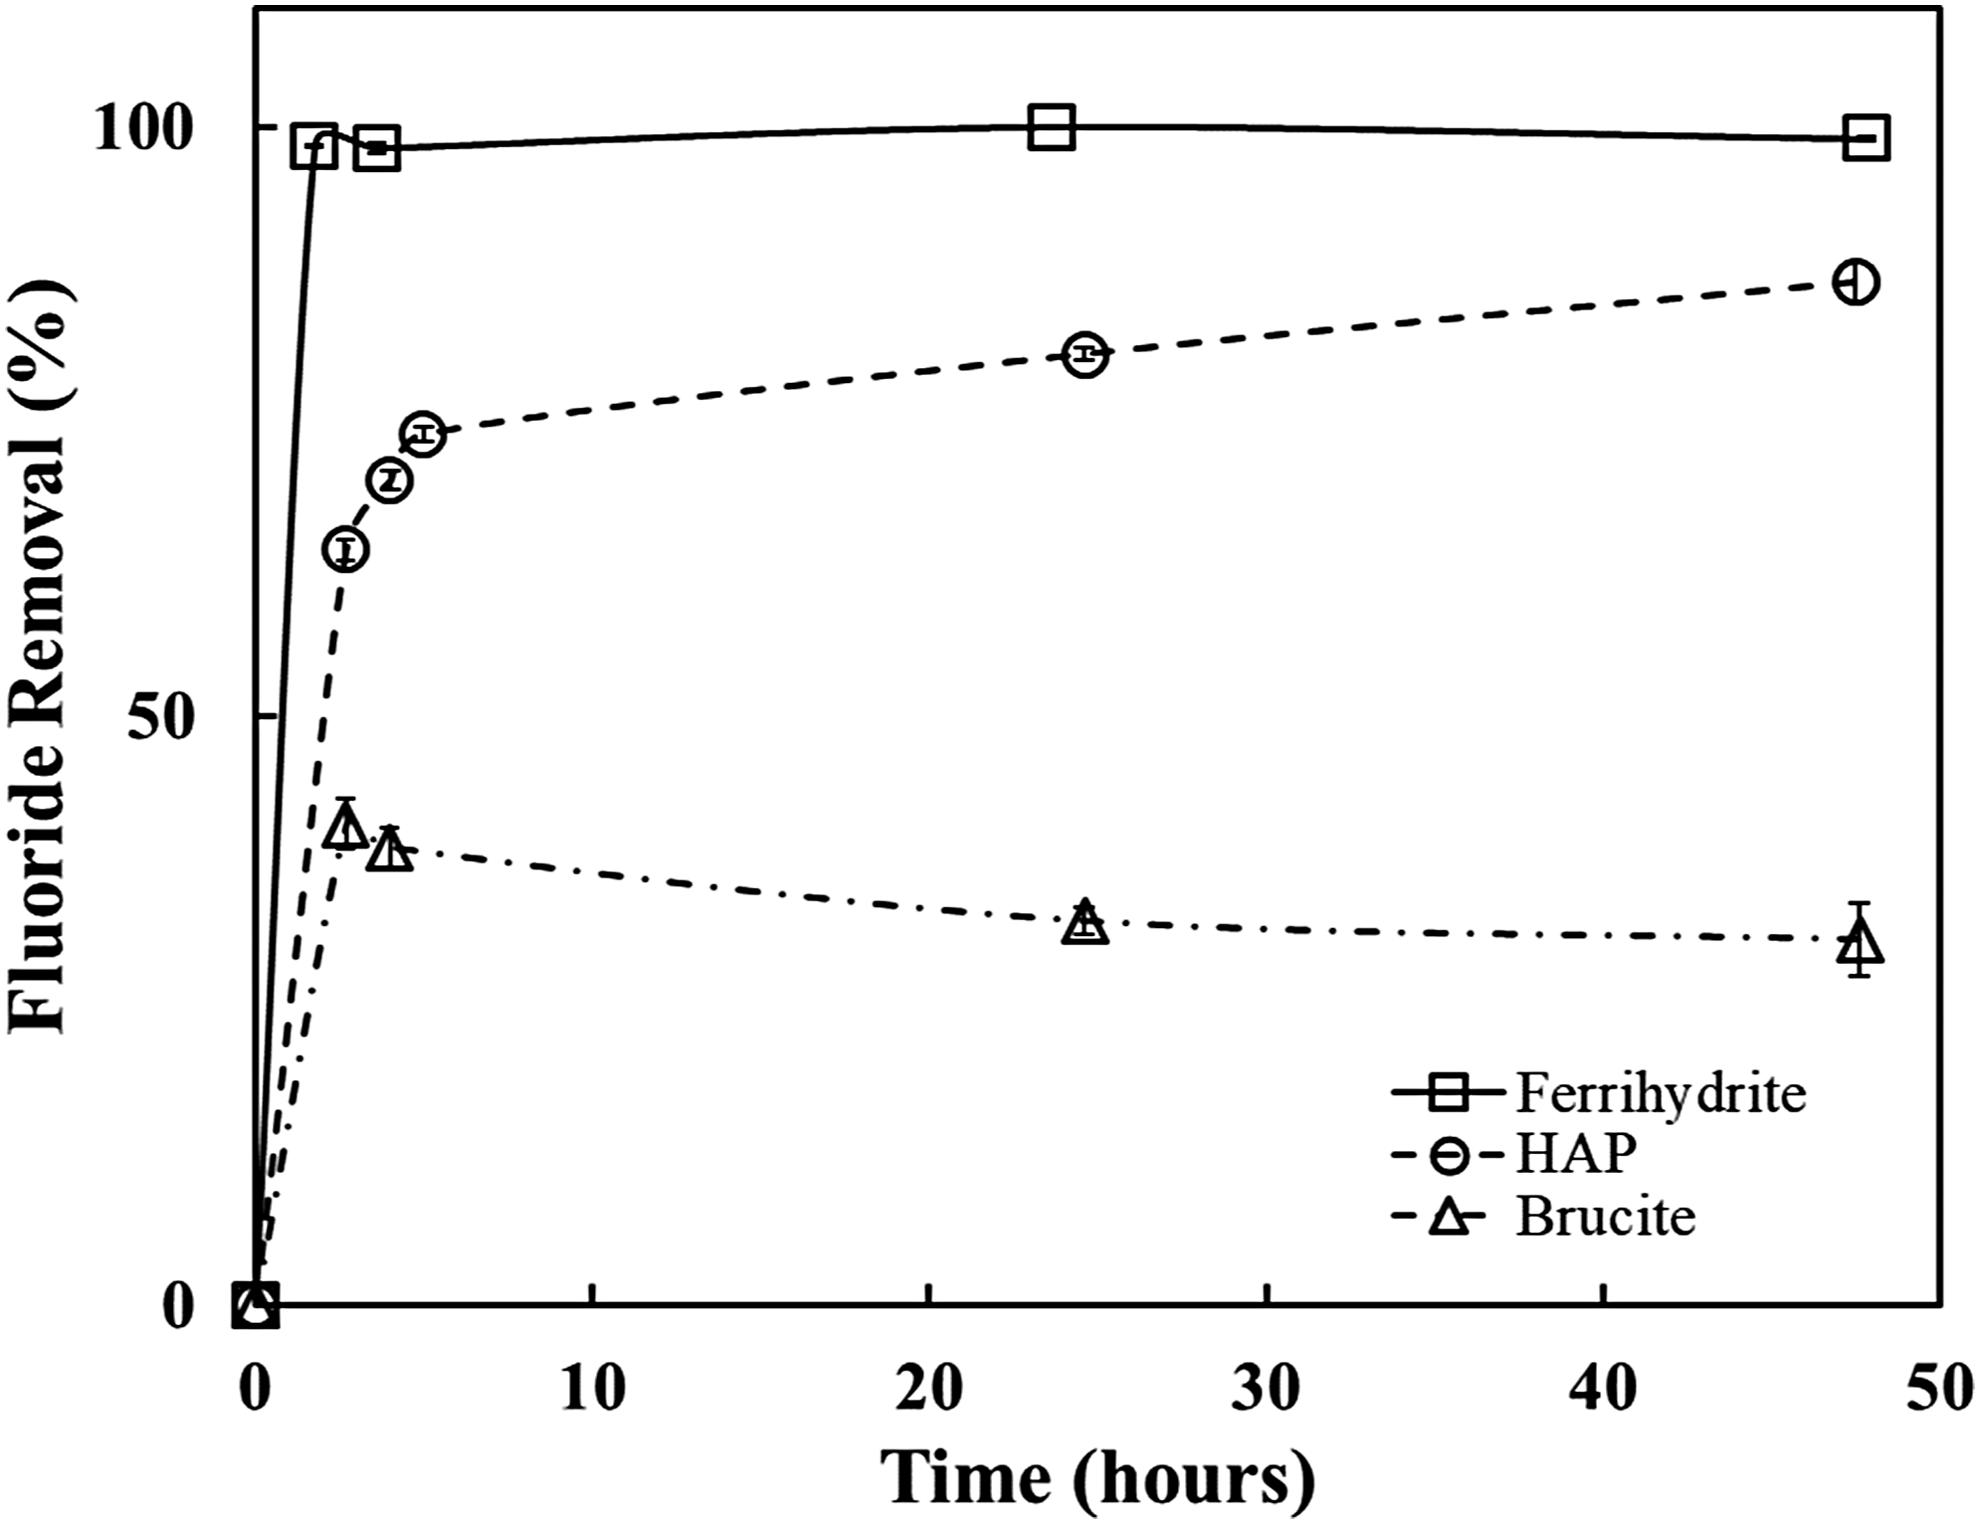
Adsorption kinetics of fluoride onto ferrihydrite, HAP, or brucite, respectively. The experiment was operated at pH of 6.8, 7.0, and 9.8 for ferrihydrite, HAP, and brucite, respectively, in 1 mM NaCl solution. Error bars are calculated from standard deviation (n = 2).
Continuous column experiment
In this study, the continuous flow columns were operated to investigate the adsorption and desorption of fluoride on ferrihydrite, HAP, and brucite. The column filled with pure quartz sand without addition of nanomaterial was included as a control treatment. The breakthrough curves for the columns are given in Fig. 3. In the control columns with pure quartz sand, fluoride adsorption was not observed in an appreciable amount over the operation time of 200 min. By comparison, treatment columns filled with nanomaterials demonstrated better adsorption, but showed different breakthrough points occurring at 60, 20, and 7 min for ferrihydrite, HAP, and brucite, respectively. The results confirm that the presence of nanomaterials played the most important role in adsorbing fluoride from the aqueous phase. Furthermore, ferrihydrite demonstrated better adsorption capacity for the fluoride than brucite and HAP in the column study.

Breakthrough curves expressed as Ce/C0 versus time for the sorption of fluoride onto ferrihydrite, HAP, or brucite, respectively, mixed with quartz sand medium in a continuous flow column. Control columns are filled with quartz sand. The initial fluoride concentration was 35 mg/L in 10 mM NaCl solution. Error bars are calculated from standard deviation (n = 2).
During the operation, the influent containing fluoride ions flows through the fixed bed of adsorbents and forms a mass transfer zone, where the fresh solution is in contact with unsaturated adsorbents. This zone moves through the column and reaches the exhaustion point. The height of the mass transfer zone (hZ) can be calculated using Equation (5):
where H is the bed depth (cm), f is the parameter indicating the symmetry of the breakthrough curve, or the fraction of adsorbents present in the column that is still capable of adsorbing fluoride ions. The f can be defined as in Equation (6):
where V is the effluent volume (L).
The parameters given by Equations (5) and (6) were calculated from the experimental data and summarized in Table 4. Because the adsorption is not at steady state while the influent is still passing through the column, it is difficult to describe the dynamic behavior of fluoride in a fixed bed under the defined operating conditions. Several simple mathematical models have been developed to describe and possibly predict the dynamic behavior in fixed bed column (Aksu and Gonen, 2004). Among these models, the Thomas model is commonly used for continuous flow conditions (Thomas, 1944), which is given in Equation (7):
where C0 and Ce are the fluoride concentrations in the influent and effluent (mg/L), respectively, kT is the rate constant (L/[mg·h]), θ is the flow rate L/h, qT is the total sorption capacity (mg/g), V is the throughput volume (L), and m is the mass of adsorbent.
Thomas Model Parameters Derived from Experimental Data in Continuous Columns
As shown in Fig. 4, the experimental data were fitted reasonably well to the Thomas model and the calculated parameters are summarized in Table 4. The total adsorption capacity qT calculated was close to the qE calculated above up to saturation point. The agreement of qT and qE verifies the applicability of the Thomas model to describe the adsorption of fluoride in the continuous up-flow column system. By comparison of the total adsorption capacity and the rate constant kT, columns filled with ferrihydrite not only demonstrated faster rates, they also showed a higher sorption capacity than brucite and HAP.
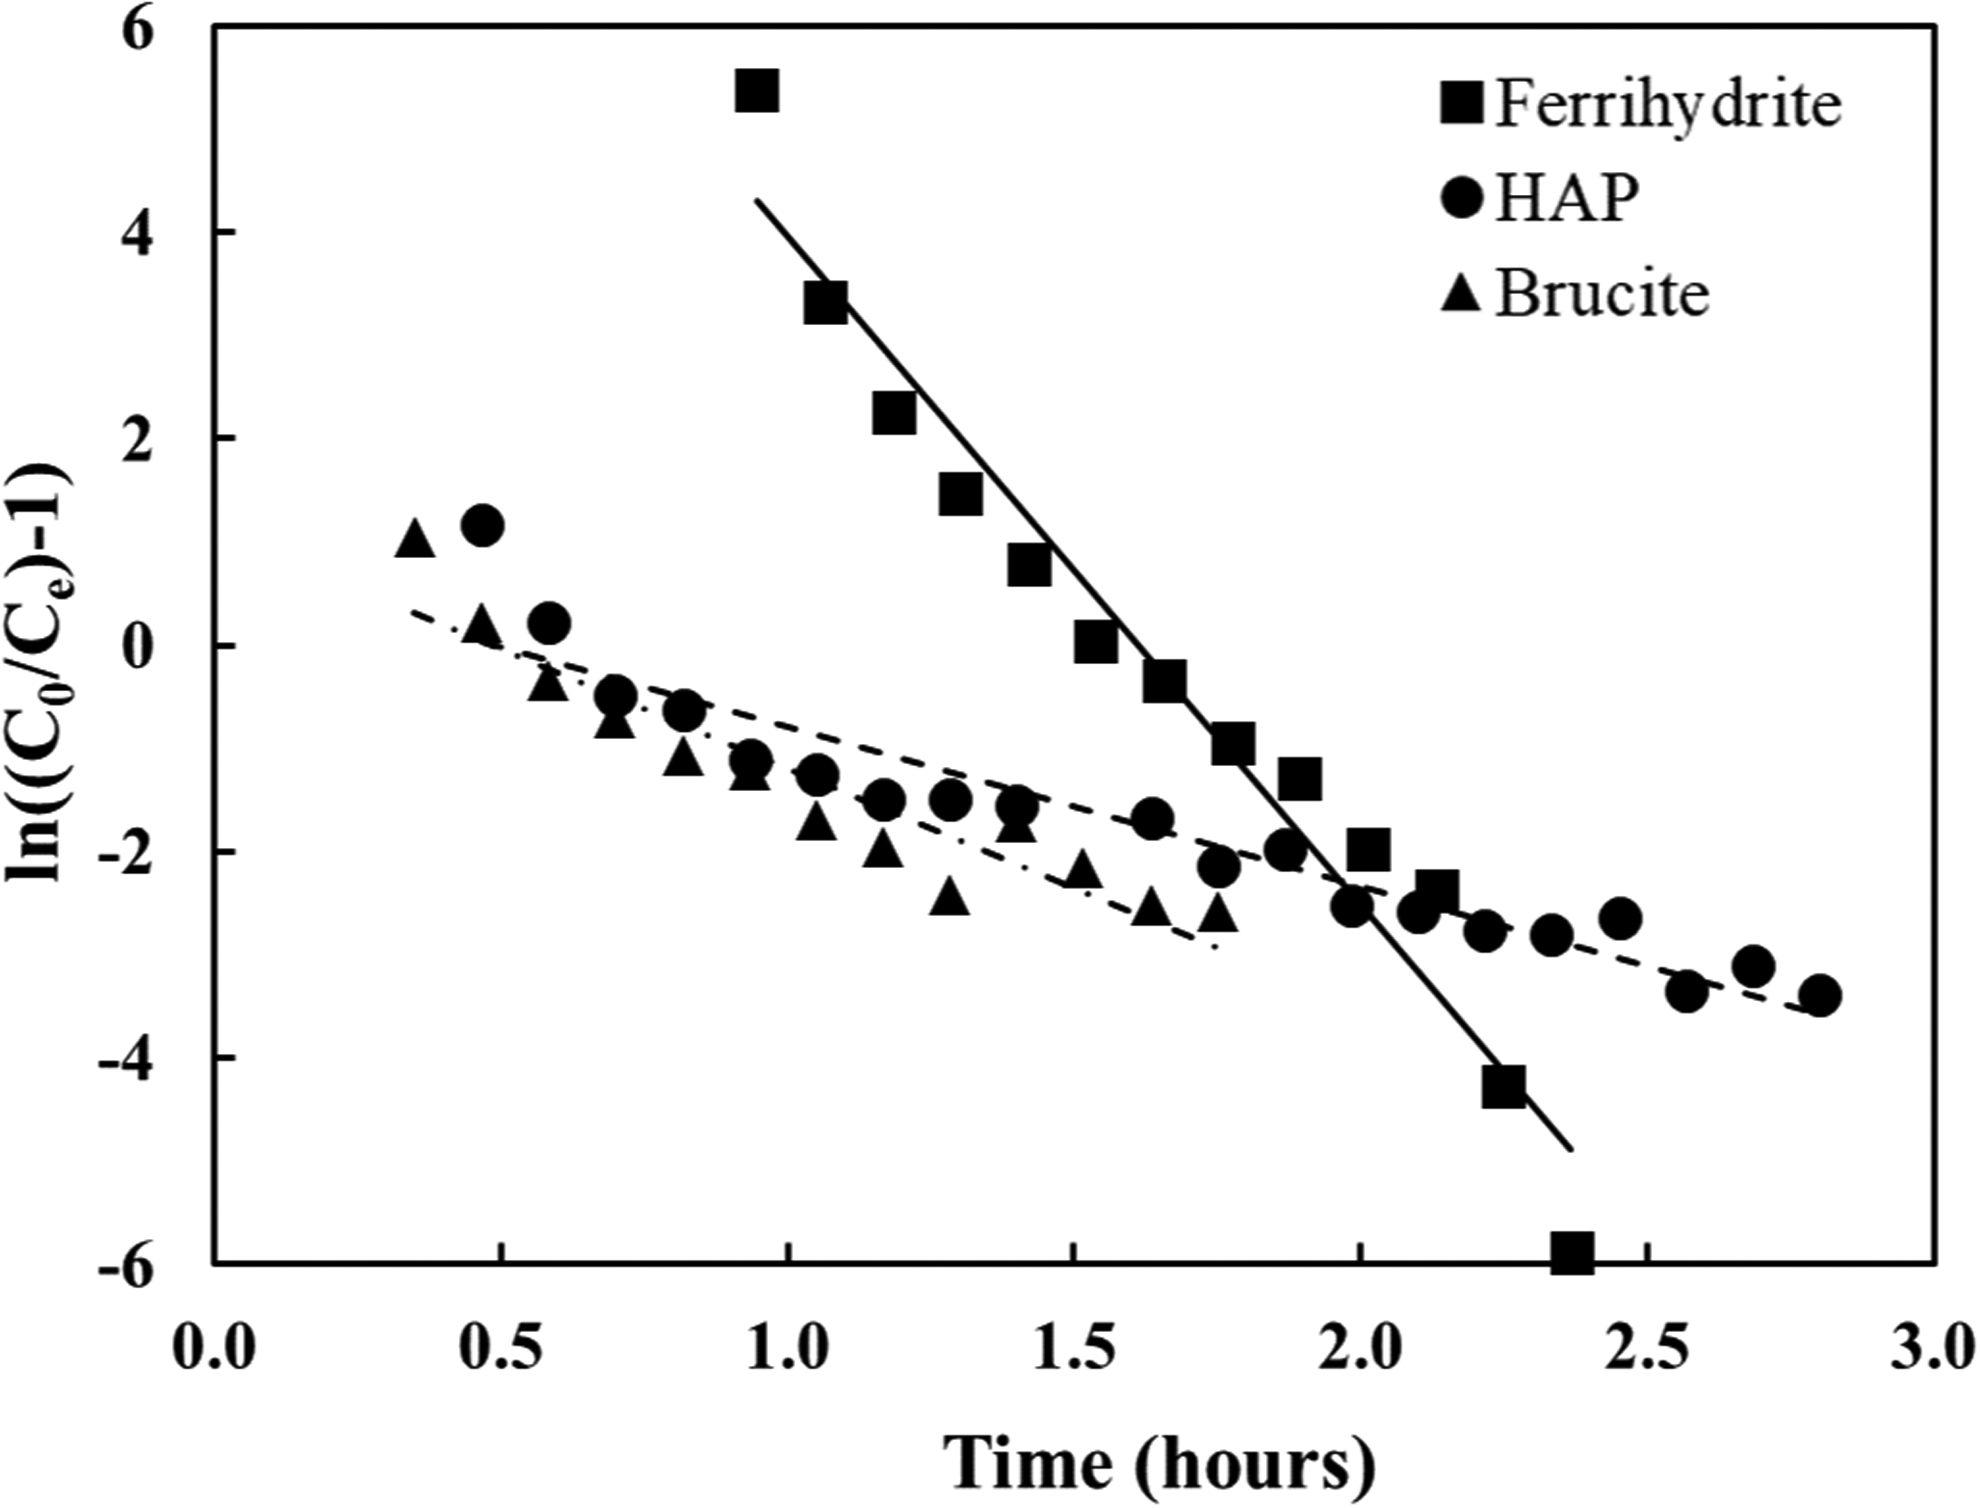
Fitting of experimental data to the Thomas equation. Error bars are smaller than the marker and are calculated from standard deviation (n = 2).
Moreover, the results showed that the sorption capacities from column study are lower than the corresponding sorption capacities calculated using the Redlich–Peterson model from batch experiment. The observed differences between the sorption capacity in the continuous flow column and batch systems have been reported by previous studies (Gupta et al., 2001; Tor et al., 2009). The discrepancies might be attributed to the shorter time of reaction in the column test (<3 h) than in the batch test (48 h).
When the adsorbents were saturated with fluoride, the desorption process was carried out to examine the stability of fluoride adsorbed on the packed materials in the continuous flow columns. The exhausted fixed bed columns were washed by passing DI water through the bed at a flow rate of 1 mL/min until no fluoride could be desorbed. The duration for desorption was 99, 64, 62, and 87 min for quartz, ferrihydrite, HAP, and brucite, respectively.
The mass of desorption was calculated in the way identical to calculation of the mass adsorbed in the columns. Owing to possible fluoride solution left in the pores of columns when the influent was changed to DI water, the desorption mass in the column packed with nanomaterials and quartz was corrected by subtracting the desorption mass from the control columns composing of quartz alone. The calculated column desorption parameters are listed in Table 5. It is concluded that the adsorbed fluoride could be desorbed, however, the desorption efficiency was not very high, ranging from 4.0% to 8.9%.
Sorption and Desorption of Fluoride on Various Nanomaterials of (Hydro)oxides in Continuous Flow Through Columns (n = 2)
F, fluoride; N/A, not available.
Conclusions
In this study, 11 (hydro)oxide nanomaterials were evaluated for their effectiveness on the adsorption of fluroide. Three out of the 11 (hydro)oxide nanomaterials, ferrihydrite, HAP, and brucite, were closely examined for physiochemcial characterization, adsopriton capacity, and kinetics in batch tests. Adsorption–desorption behavior was also evaluated in continuous flow column experiments. These three nanomaterials showed the potential to be used as effective sorptive materials for remediating fluoride polluted water. The main conclusions are summarized as follows:
Among 11 (hydro)oxide nanomaterials tested in this study, ferrihydrite, HAP, and brucite showed the higher affinity for fluoride adsorption from aqueous phases. The adsorption of fluoride on these nanomaterials in batch experiments is best represented by the Redlich–Peterson and Freundlich isotherms. The adsorption kinetics were well described by the intraparticle diffusion model. Higher fluoride sorption capacity was obtained in batch systems than that in continuous column systems, which might be due to (1) the longer reaction time (48 h) in the batch test than that in the column test (<3 h) and (2) preferential flow paths in the column media inhibiting the exposure to all available sorption sites. The Thomas model can be used for describing the sorption behavior of fluoride removal in a fixed bed continuous flow column. The desorption study showed that the adsorbed fluoride could be desorbed, however, the desorption efficiency was low, in the range of 4% to 9%. Low desorption is attributed to strong binding of fluoride on sorbent(s).
Future work is needed to better understand fluoride removal on a pilot scale level using the nanomaterials ferrihydrite, HAP and brucite, especailly pertaining to petroleum and industrial waste remediation. In addition, further studies examining the regeneration capacity of each nanomaterial for practical application and reuse should be conducted.
Footnotes
Acknowledgments
This research was partially funded by the U.S. Environmental Protection Agency (U.S. EPA). Anna Rose Wallace is a Student Trainee (Engineering) under the U.S. EPA Pathways Internship Program and produced this article while conducting research as part of her Master of Science degree program at Southern Methodist University. We appreciate Lynda Callaway, Kristie Rue, and Gary Brooks for laboratory assistance.
Author Disclosure Statement
No competing financial interests exist.
Disclaimer
Although the U.S. EPA partially funded this research and U.S. EPA employees contributed to this article; the views, interpretations, and conclusions expressed in the article are solely those of the authors and do not necessarily reflect or represent the U.S. EPA's views or policies. Any use of trade, product, or firm names is for descriptive purposes only and does not imply endorsement by the U.S. EPA or the U.S. Government.
References
Supplementary Material
Please find the following supplemental material available below.
For Open Access articles published under a Creative Commons License, all supplemental material carries the same license as the article it is associated with.
For non-Open Access articles published, all supplemental material carries a non-exclusive license, and permission requests for re-use of supplemental material or any part of supplemental material shall be sent directly to the copyright owner as specified in the copyright notice associated with the article.