




Abstract
Abstract
Understanding the nexus between food, energy, and water (FEW) systems is emerging as a critical area of study since federal research agencies in North America and Europe began highlighting the needs related to data collection/management, systems optimization, and opportunities for new technologies. Little information regarding FEW systems exists across Asia, including within the Yangtze River basin, despite having 1/15th of the world's population living within the basin and generating as much as 40% of the Chinese gross domestic product. This research provides a case study of FEW systems with analysis in the Yangtze River basin, showing the spatial and temporal variations in water availability/use, food production, and energy production. At a district-level scale in China, we integrated key Chinese data sets from multiple industrial, commercial, and agricultural sectors together with key land use and hydrologic information to evaluate the FEW parameters normalized to the land area of each district rather than the commonly used approach where FEW consumptive parameters are normalized to population (i.e., per capita). The results illustrated the types of data sets currently available within China to conduct FEW system analyses and identified districts that are net producers or dependents regarding food, energy, or water. The northeastern portion of the Yangtze River basin have several districts that are net negative relative to the amount of water that falls within the district boundaries versus all water uses plus evaporation, with the most stressed districts lacking as much as 0.5–1 m annually of equivalent rainfall per unit land area. The geospatial analysis concludes that policies to manage the FEW system cannot be considered for a single district alone, nor the Yangtze River watershed in its entirety, but instead needs to consider the interdependencies among districts and consider encouraging growth (agriculture, industry, or population) within more water-abundant regions.
Introduction
Many complex interrelated problems facing human society today relate to the production, distribution, and use of food, energy, and water (FEW), especially in developing countries (Bazilian et al., 2011). FEW systems have inherent antagonisms, and the development of one sector usually depletes resources in the two other sectors (Chang et al., 2016b). An emerging body of research on the FEW nexus in Europe (Bhaduri et al., 2015; Hang et al., 2016) and the United States of America (Mortensen et al., 2016; Smidt et al., 2016) is beginning to break down barriers between different institutions (e.g., separate government ministries) to inform coordinated decision making about FEW systems (Ferroukhi et al., 2015). There is a recognized need to improve data aggregation and visualization techniques to facilitate coordinating policies in a holistic manner toward sustainability goals that consider interconnected FEW systems (Chang et al., 2016a).
Compared with abundant research on FEW systems at global (D'Odorico et al., 2018), European or North American scales, relatively few studies directly quantifying case studies of FEW systems are available for China despite China having the world's largest population and a rapidly developing economy that is applying stress to FEW systems (Jiang 2015). The Yangtze River (called as Chang Jiang in China) is the longest river in Asia and the third longest in the world. The river's basin is home to more than 400 million people (i.e., 1/15th of the world's population). This basin alone would be the third most populated country in the world. The Yangtze River flows for 6,300 km from the glaciers on the Qinghai–Tibet Plateau in Qinghai eastward across southwest, central, and eastern China before emptying into the East China Sea at Shanghai. The basin represents 20% of the land area of the People's Republic of China, is home to 30% of the country's population, and conveys 30% of the water flow within China (Zhang et al., 2006) (Varis and Vakkilainen 2001). We focused on the Yangtze River basin because of its large role in the culture and economy of China. The Yangtze River basin generates as much as 40% of China's gross domestic product (Chen et al., 2014). Despite these staggering statistics, there is no published integrated FEW system analysis for the Yangtze River basin. This limits the ability of the country and, because of its scale, the world to understand the holistic FEW system management.
A major gap in understanding and managing the global FEW system will require knowing where local freshwater availability is sufficient to sustain future water needs (D'Odorico et al., 2018). At a very localized scale for a major city in China (Beijing), an analysis of “virtual water” showed that while local water supplies, including reuse of wastewater, was adequate to meet industrial and environmental water uses within the city, the population needed to import grains and livestock, which had a water footprint from outside the city (Ye et al., 2018). In most cases for cities across developed countries, the water footprint is dominated by virtual water embedded in food (Chini et al., 2017). Recognizing the dominant water footprint of the food system has been crucial in identifying strategies (e.g., irrigation practices, dietary changes) can be applied to meet food or water security and sustainability goals (Davis et al., 2016). One study suggests that because of the high water demand of food systems that agricultural water use efficiency could free up enough water for growing urban use in 80% of high-conflict watersheds around the world, including several regions in the Yangtze River where identified where modest (<5%) irrigation efficiencies could help overcome surface water deficits (Flörke, Schneider, and McDonald, 2018). The average water footprint for citizens in China (1,071 m3/year) was 60% lower than that in the United States, and in both countries, this was dominated by virtual water associated with food consumption (Hoekstra and Mekonnen, 2012). Changing diets in China may lead to increases in this water footprint. Climate change has and will impact the Yangtze River basin in China (Han et al., 2015), and it is likely that extreme hydrologic events (e.g., floods, droughts) will increase in frequency, while annual mean streamflow will likely be remain constant (Yu et al., 2018). Thus, regions within the Yangtze River watershed will see shifting climate patterns in local water availability for food, municipal, and energy production needs, which will necessitate developing a framework for managing real and virtual water within the basin (Rasul and Sharma, 2016). While general global trends and mega-city specific trends have been well studied, there is a lack of understanding at a regional (i.e., district) scale on water availability and FEW systems throughout the Yangtze River watershed.
This article quantifies and compares components of the FEW system spatially, at the district level, within the Yangtze River basin. Food production, energy production, and water availability/use is normalized to land area (km2), rather than the more frequently applied normalization to population when consumption or use of FEW resources are evaluated, because generation of FEW resources occur at a spatial or landscape scale. For select cases, population normalized FEW consumption values are also provided and discussed relative to other literature values. The objective of this study was to identify how various districts in the Yangtze River contribute differently, and show interdependence upon, to the production and consumption of food, water, and energy. Using an ArcGIS data management approach, we integrated data sets from multiple governmental agencies and applied ArcGIS models to (1) analyze geospatial patterns in land use and land cover (LULC); (2) conduct a preliminary water balance based on precipitation, potential evaporation, and water intake of each district; and (3) analyze spatial distribution characteristics of FEW components across agricultural, industrial, and municipal sectors. This study was the first FEW analyses across the Yangtze River basin, and it focused on identifying and spatially quantifying key drivers for the FEW systems in this basin.
Data Sources and Methodologies
Study site
Watershed boundaries and important cities in the Yangtze River basin are illustrated in Supplementary Fig. S1. Supplementary Figure S1 illustrates the river course and watershed boundaries, and the Yangtze River watershed can be divided into upper, middle, and lower reaches based on landscape and climatic characteristics. The highest elevation point in the Yangtze River basin is 6,621 m, located near Geladaindong Peak. From the river origins to Yichang, where Three Gorges Dam is located, is called the upper reach. In this reach, the river flows from high elevation plateaus and mountains and into the fertile valleys near the bottom of the reach. The middle reach, which spans from Yichang to Poyang Lake, receives the most precipitation and accounts for 40% of the river basin area. Here, the Yangtze River gradient decreases and its course meanders, forming a broad river and slow stream flows. The lower reach, which starts at Poyang Lake, has flat terrain, short tributaries, stable flow, and a dense water network, ending at the estuary in the East China Sea.
Data sources and computational methodologies
ArcGIS was used to aggregate data from different publically available sources (Supplementary Data). Geographic Information System layers for topography as well as stream networks and district boundaries were obtained from China Geological Survey (NGCC 2018). The LULC data set was provided by Cold and Arid Regions Sciences Data Center at Lanzhou (Ran et al., 2010). The primary data set included the quantity of water intake and water consumption collected from water resources bulletins and the streamflow of rivers in Yangtze River basin (NGCC 2018; China 2005–2016a). All provinces in China publish water resource bulletins annually that include macro data about water consumption and wastewater production within cities (China 2005–2016a). They also publish annually economic and social development bulletins and energy production and consumption bulletins (China 2005–2016b). The output of grain (cereals, beans, and potatoes) data set was collected from economic and social development bulletins (China 2005–2016b). All data were based on the prefecture-level administrative regionalization. Additional information was obtained from the literature (Chang et al., 2003; Besha 2011; Amadei et al., 2013; Zheng et al., 2014; Jiang 2015; Albala-Bertrand 2016; Yang et al., 2016).
Historical streamflow data collected from 1954 to 2014 were obtained from Yangtze River Water Resources Committee (China 2005–2016a). Supplementary Table S1 shows average annual stream flows at 12 hydrologic stations along the Yangtze River (shown in Supplementary Fig. S1). On annual average, 26,121 m3/s leaves the middle reach and 26,752 m3/s leaves the lower reach before entering the East China Sea.
Annual precipitation and potential evapotranspiration data were derived from high-resolution gridded data sets provided by climatic research unit, and potential evapotranspiration was calculated from a variant of the Penman–Monteith formula (Harris et al., 2014). Within different districts (i) of the Yangtze River, a district-level natural climatic water balance (CWBi, mm) across the land area of the basin was computed as a function of measured annual precipitation (Pi, mm) minus calculated annual evapotranspiration (Ei, mm):
The total water balance (TWBi) of the Yangtze River a district across the land area of the basin was computed as a function of Pi (mm) minus Ei (mm) minus both industrial water intake (IWI, mm) and residential water intake (RWI, mm) normalized to district (i) land area (m3/km2):
Water consumption for electrical energy production was calculated. In 2010, 74% of the power in China was produced by thermal-electric power plants that consumed 2.45 kg/kWh of produced power (沈旭 et al., 2013); reported values decreased from 3.00 to 2.45 and 2.30 kg/kWh between 2005, 2010, and 2015, respectively. Power production information was obtained from energy production and consumption bulletins of each involved province.
Population and land use distributions
Figure 1 shows the geospatial distribution of land use (forest, grasslands, croplands, urban and build areas, and waterbodies; Ran et al., 2012) and population with the Yangtze River basin. The upper reach, except within the Sichuan basin, is characterized by higher elevations, lower average temperatures, mostly grass and forest lands, and low population density. The Sichuan basin is a lowland region in upper reaches of Yangtze River basin, and it is heavily populated with more than 100 million inhabitants. The relatively flat lands and fertile soil in the upper reach support extensive irrigated croplands. Two dense urban areas in the upper reach are Chengdu and Chongqing, which are the major economic centers in southwest China.
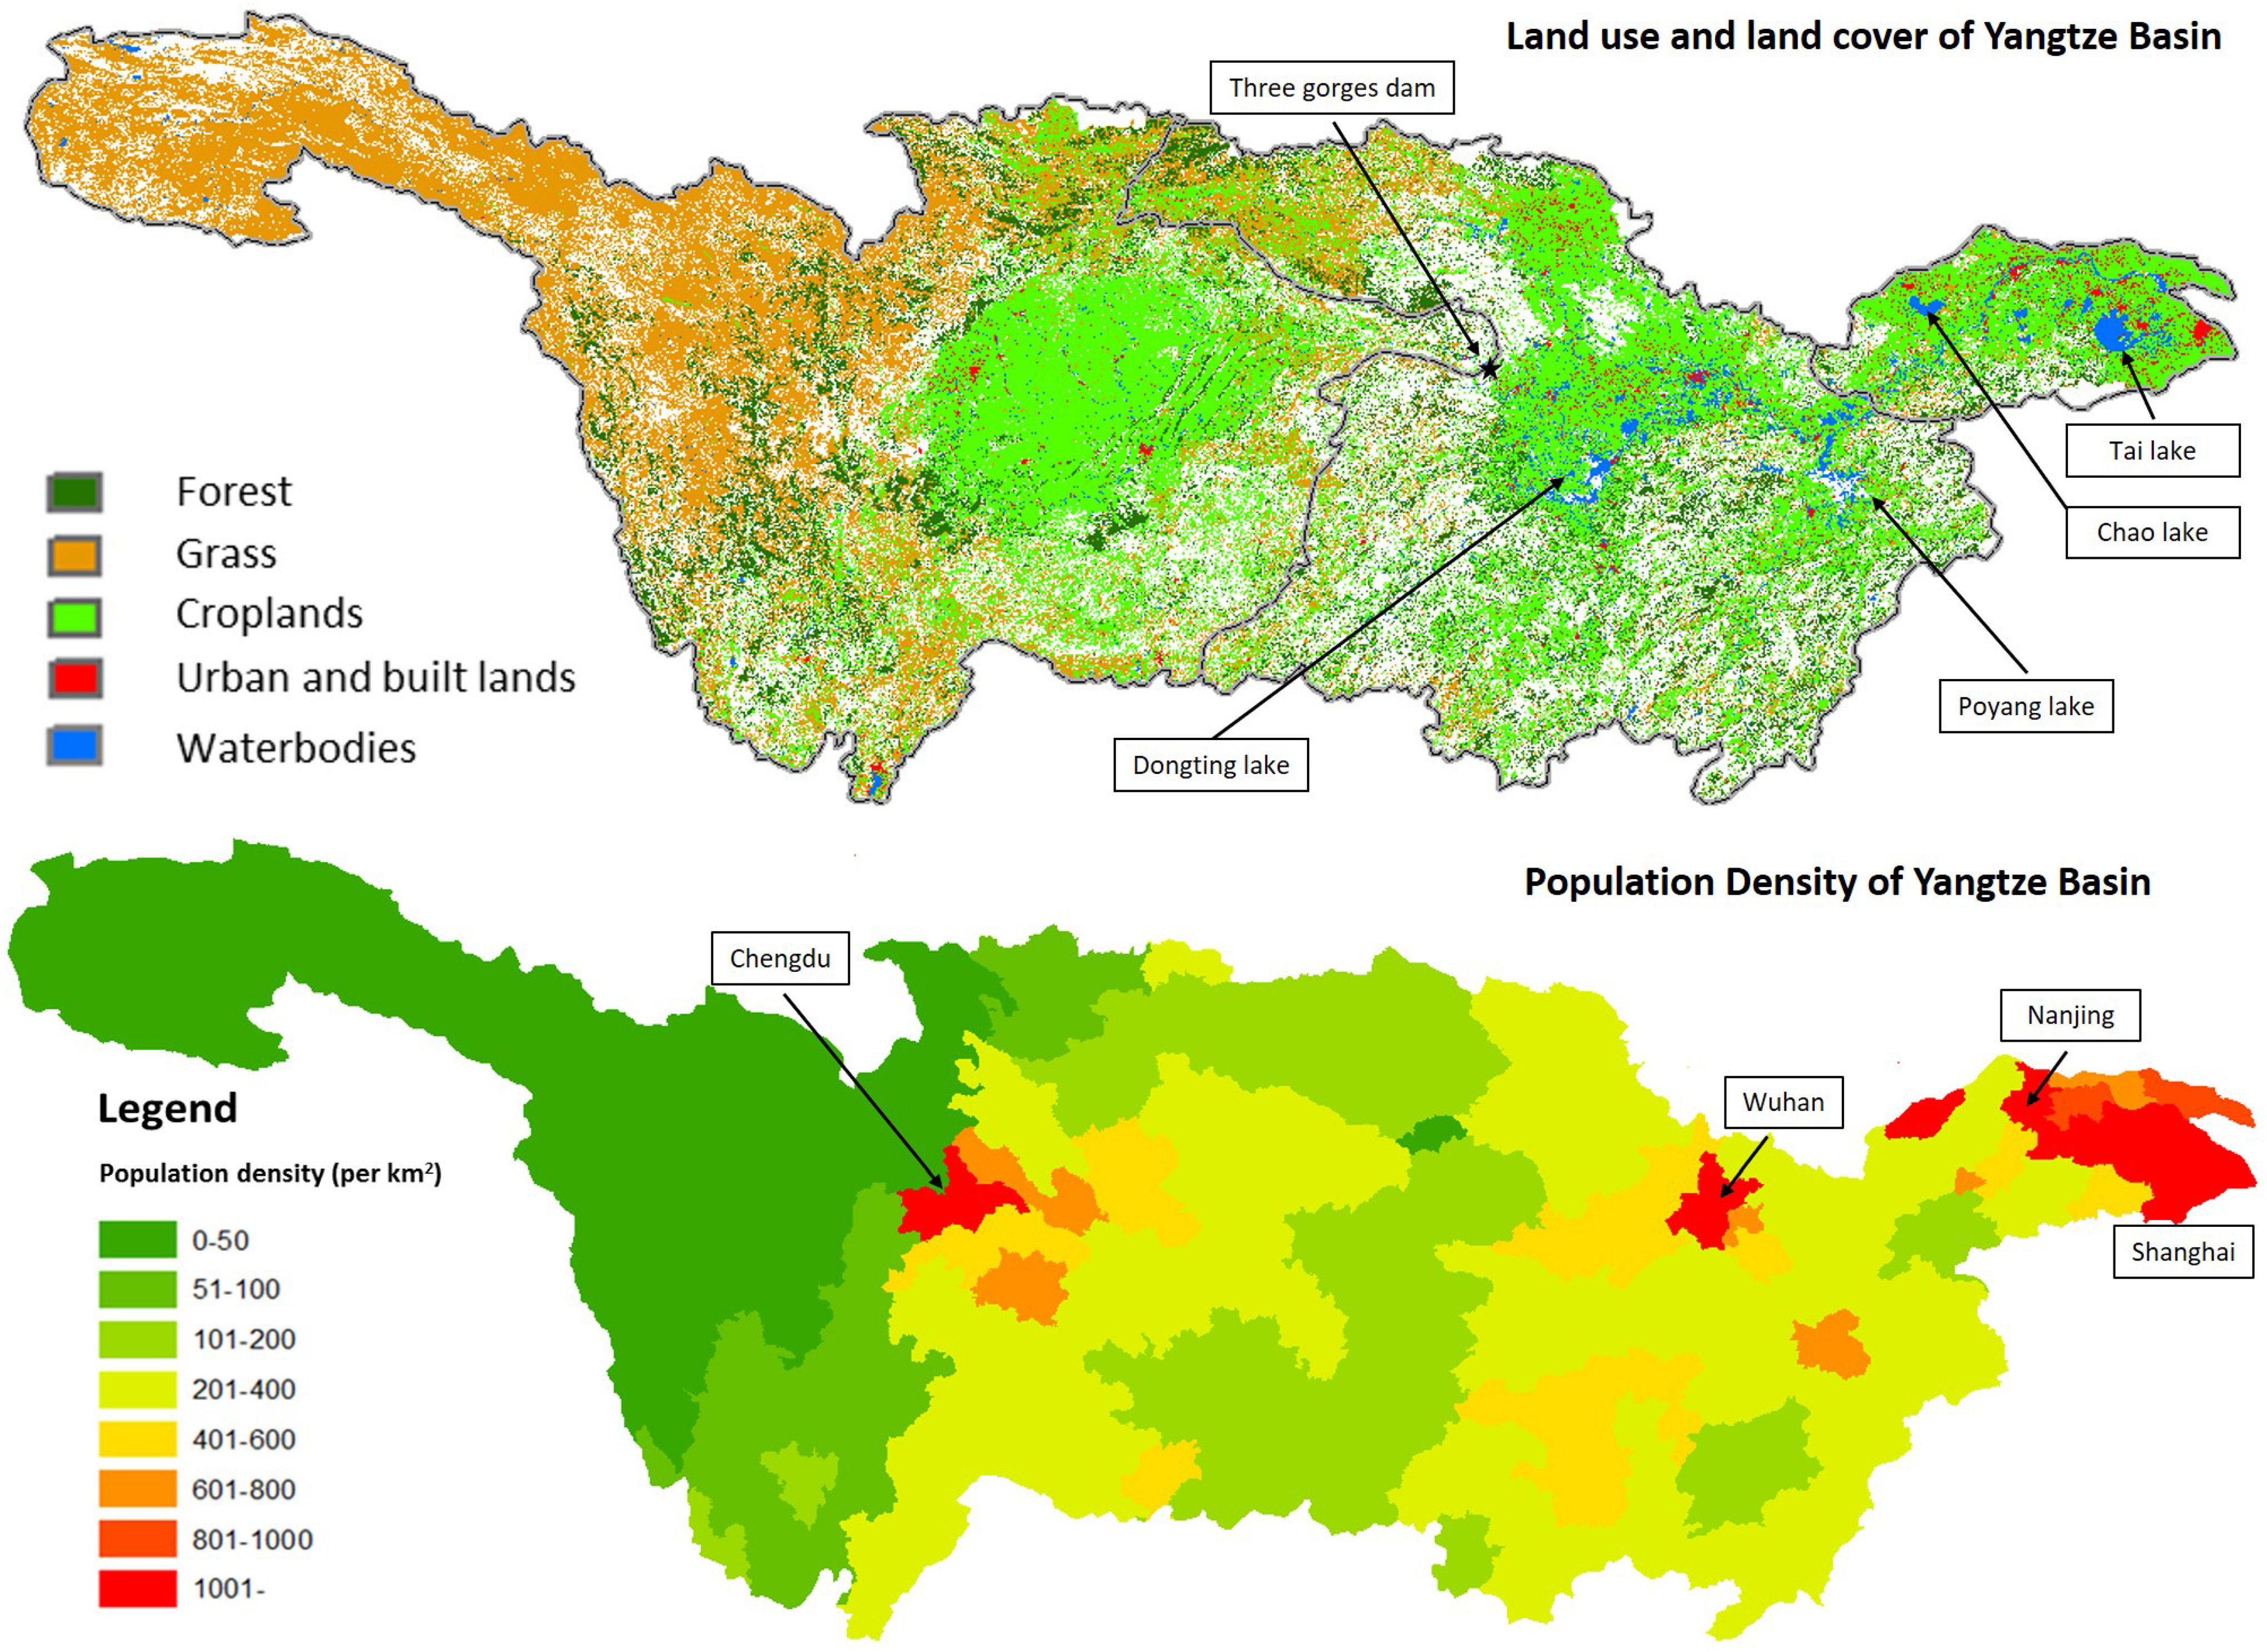
Map of land use and land cover and population density of the Yangtze River basin. Tributary basins, lakes, and Three Gorges dam are shown on the top map. Cities are shown on the bottom map for 2010.
Broad plains formed of alluvial deposits crisscross the middle reach of the basin. This area is known as China's major granary and is characterized by moderate temperatures and abundant rainfall that support large areas of nonirrigated croplands. Population in major cities such as Wuhan and lands across the basin have seen more significant urbanization than the upper reaches, resulting in a loss of natural grass and forest lands.
The Yangtze River delta in the lower reach includes the economic centers of Shanghai and Nanjing and is the most affluent region in China. In the lower reach, the Yangtze River widens as the land gets flatter, and streamflow from the upper basin combined with fertile soil makes the Yangtze River delta suitable for growing rice. Over the past few decades, the population and level of urbanization has increased dramatically in select parts of the basin.
Results and Discussion
District-level water balance
Average annual precipitation across the Yangtze River basin ranges from 400 to 2,000 mm (Fig. 2). Generally, lands located south of the Yangtze River have more precipitation than regions located north of the river in middle and lower reaches. The middle reach and coastal lands receive the most precipitation. Mountains northwest of Ya′an influence monsoon-related rainfall when humid southerly winds blow against the mountains, lifting moisture and enhancing rainfall. This is one example of many areas across the Yangtze River basin where annual rainfall amounts do not always reflect constant rainfall patterns throughout the year.
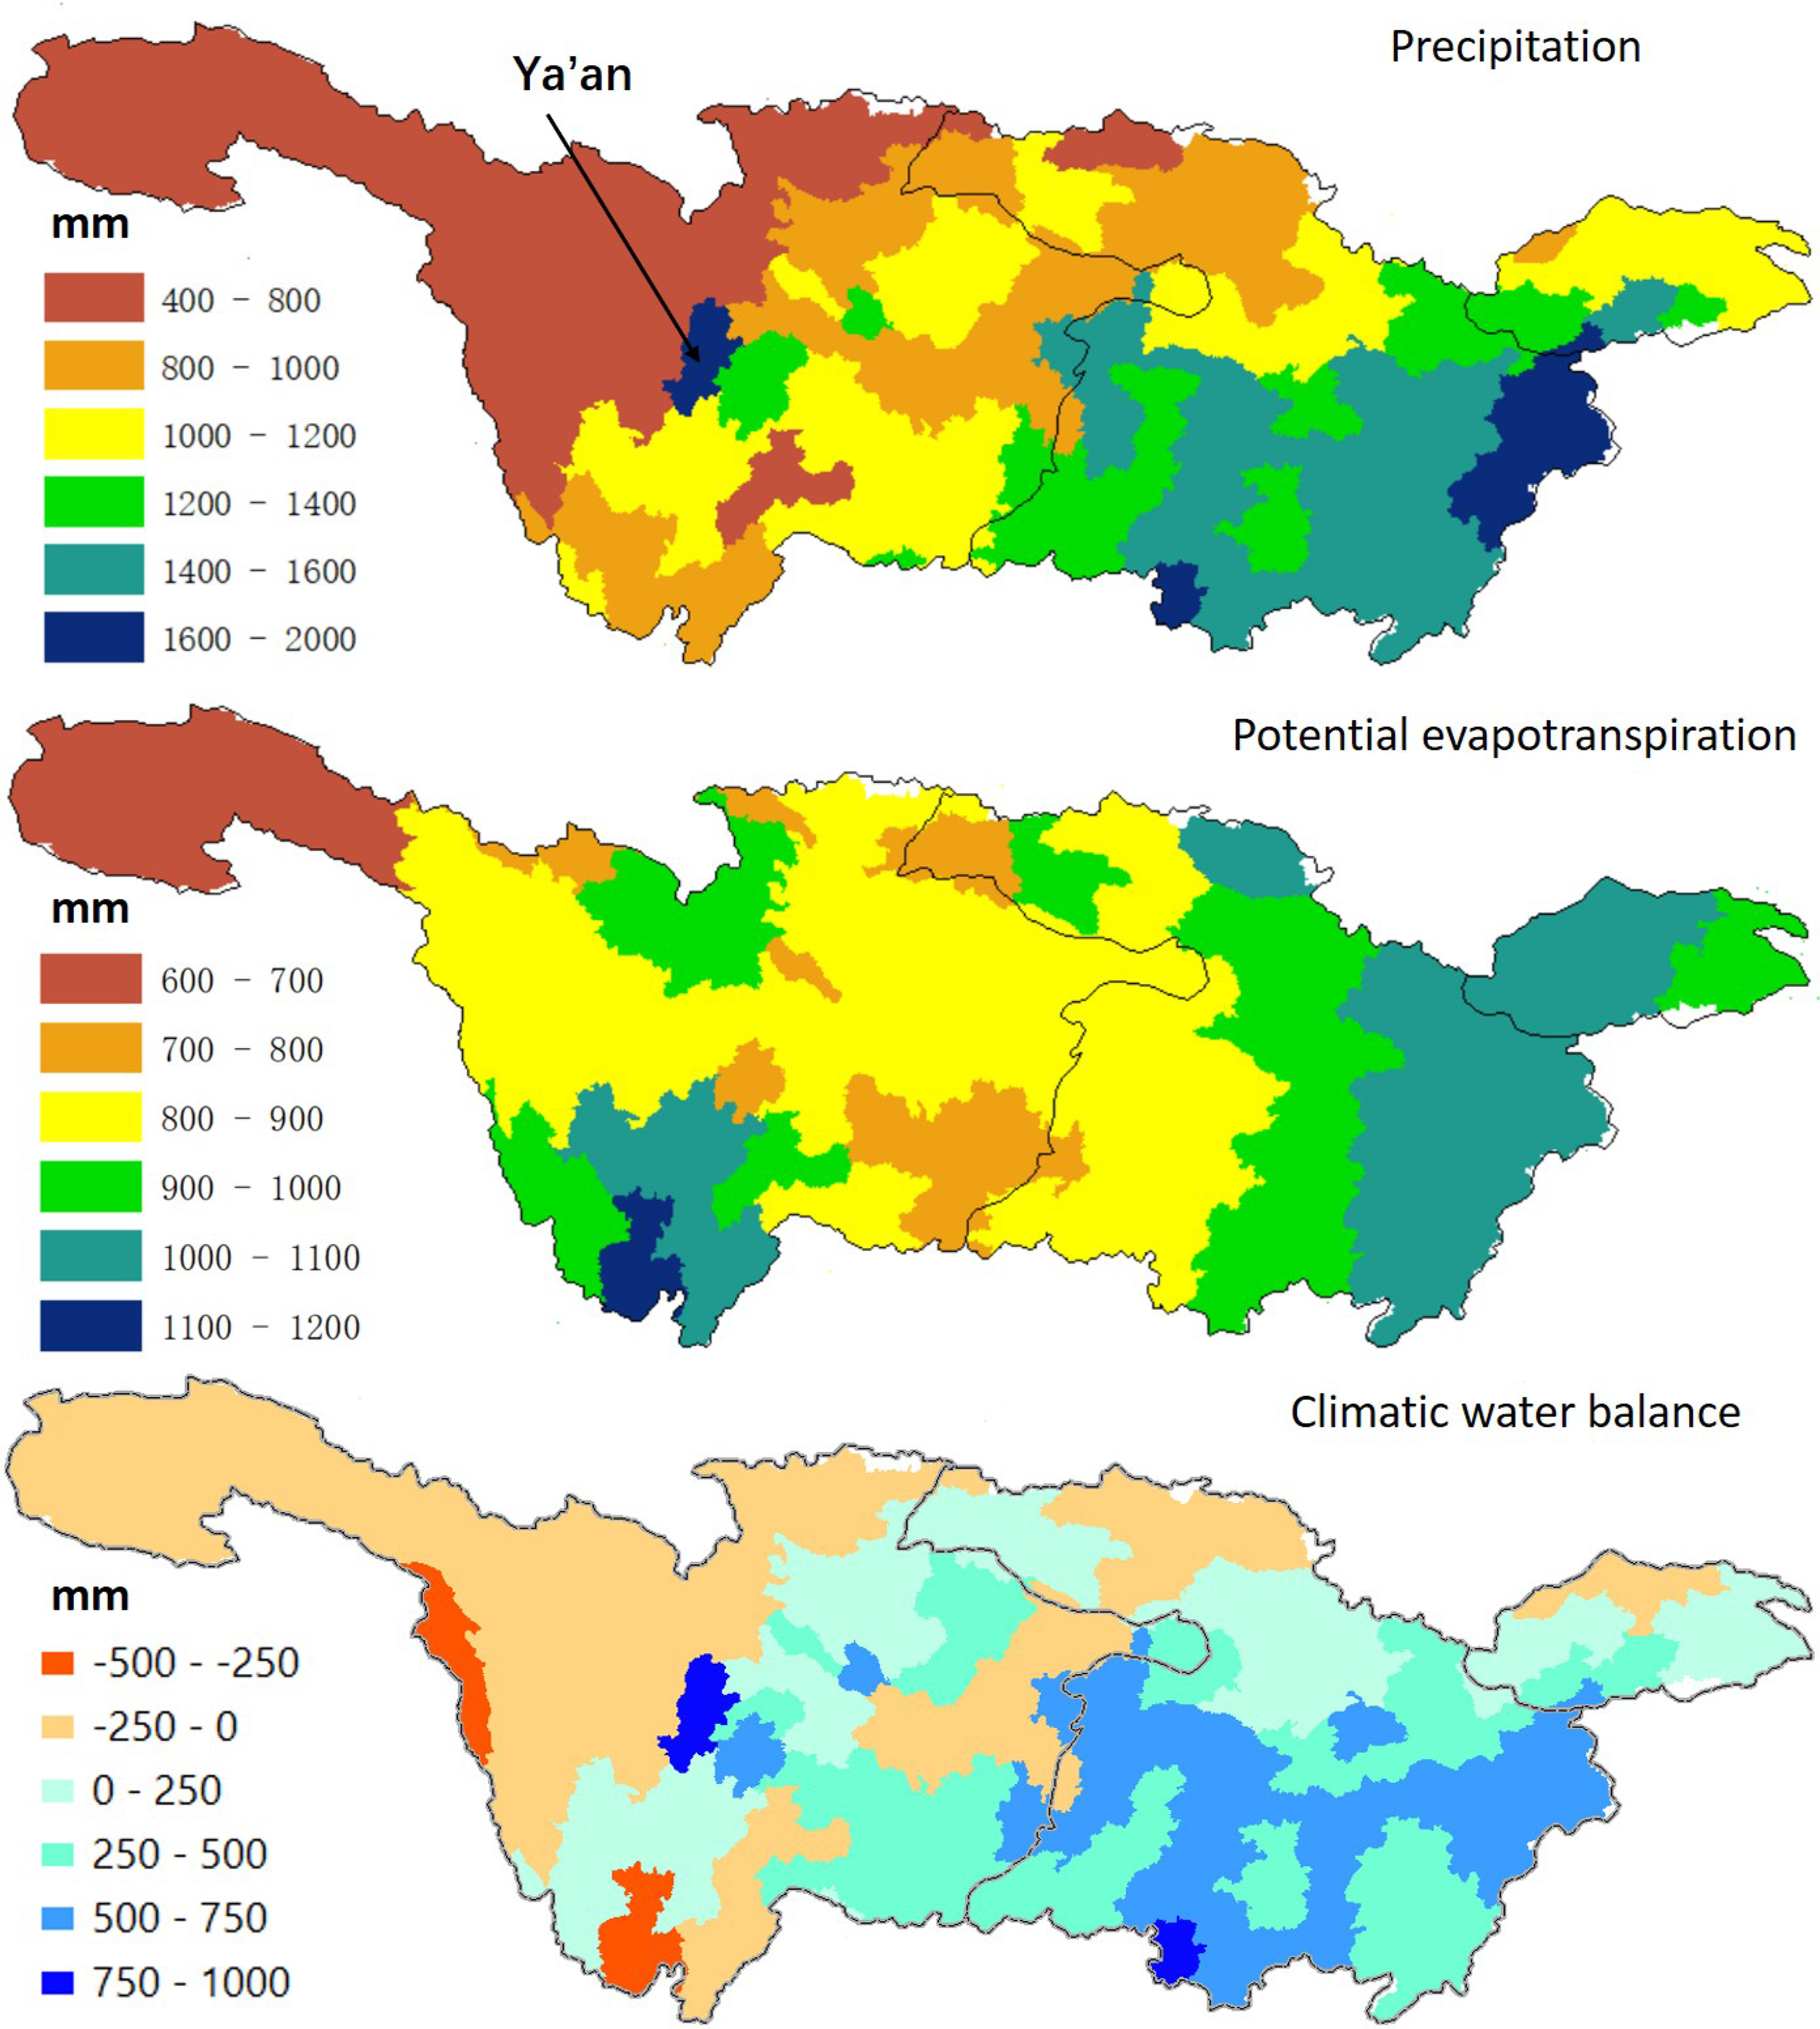
Spatial distribution across districts for 2010 in the Yangtze River basin of precipitation, calculated potential evapotranspiration and calculated climatic water balance [Eq. (1)].
Using annual estimates for precipitation and evapotranspiration within each district and without considering water uses or in-stream flows, a macro-scale water balance was conducted to identify districts with a net excess or deficiency of water simply based on hydrologic inputs (rainfall) and outputs (evaporation) [i.e., Eq. (1)]. Figure 2 shows that approximately half the basin is a net producer of water (i.e., over 250 mm more annual rainfall than evapotranspiration) and shows that the distribution over the basin is highly spatial. Individual districts that are net producers (positive values in Fig. 2) or have a net deficit (negative values in Fig. 2) are neither “good” nor “bad,” but begins to show the interdependencies for water availability among and between districts scattered throughout the basin. Because of irregular precipitation throughout the year and snowfall at higher elevations, this simple macro-scale water balance provides only minimal information on the availability of water at the right time and place within the basin. Precipitation runoff and snowmelt generate streamflow into the tributaries and main stem of the Yangtze River (Supplementary Table S1). Based on historical data, the annual average streamflow leaving the middle reach (26,121 m3/s) is roughly equivalent to the streamflow out of the lower reach (26,752 m3/s), which enters the East China Sea, suggesting the lower basin may be approaching a steady-state intake of river water, discharge of municipal, industrial, or agricultural wastewater, with some contribution of stormwater runoff. Annual differences in streamflow exist and are described elsewhere (Wang et al., 2017c). Later, we describe the impact on water balances of additional demands for industrial, municipal, and agricultural water. However, it suggests that the lower region may be nearing a tipping point, where it becomes a net consumer of river water.
Human water uses
In China, water use data are divided into three sectors: agricultural (agriculture, forestry, animal husbandry, and fishing), industrial (mining, manufacturing, and power), and municipal (service industry, information technology, education, and living). Available water data were used from 2003 through 2014 annual bulletins. Three years (2005, 2010, and 2014) were selected to illustrate the effect of rapid urbanization and industrialization in China on spatial water uses. To enable spatial comparisons, data across each district were normalized by the land area, and Fig. 3 shows spatial water intake patterns for these 3 years for each sector. The total municipal water intake volume for the entire Yangtze River basin increased from 22.54 billion m3 in 2005 to 32.39 billion m3 in 2010 and 32.82 billion m3 in 2014 (Supplementary Table S2). In most districts, the municipal water use is low compared with agricultural or industrial intakes. There are many districts in the upper and middle reaches with less than 50 m3 water per km2. Densely populated districts intake 100 to over 200 m3 water per km2. This includes districts of Chongqing, Wuhan, and Shanghai, which intake 1.9, 1.0, and 2.4 billion m3 water, respectively.
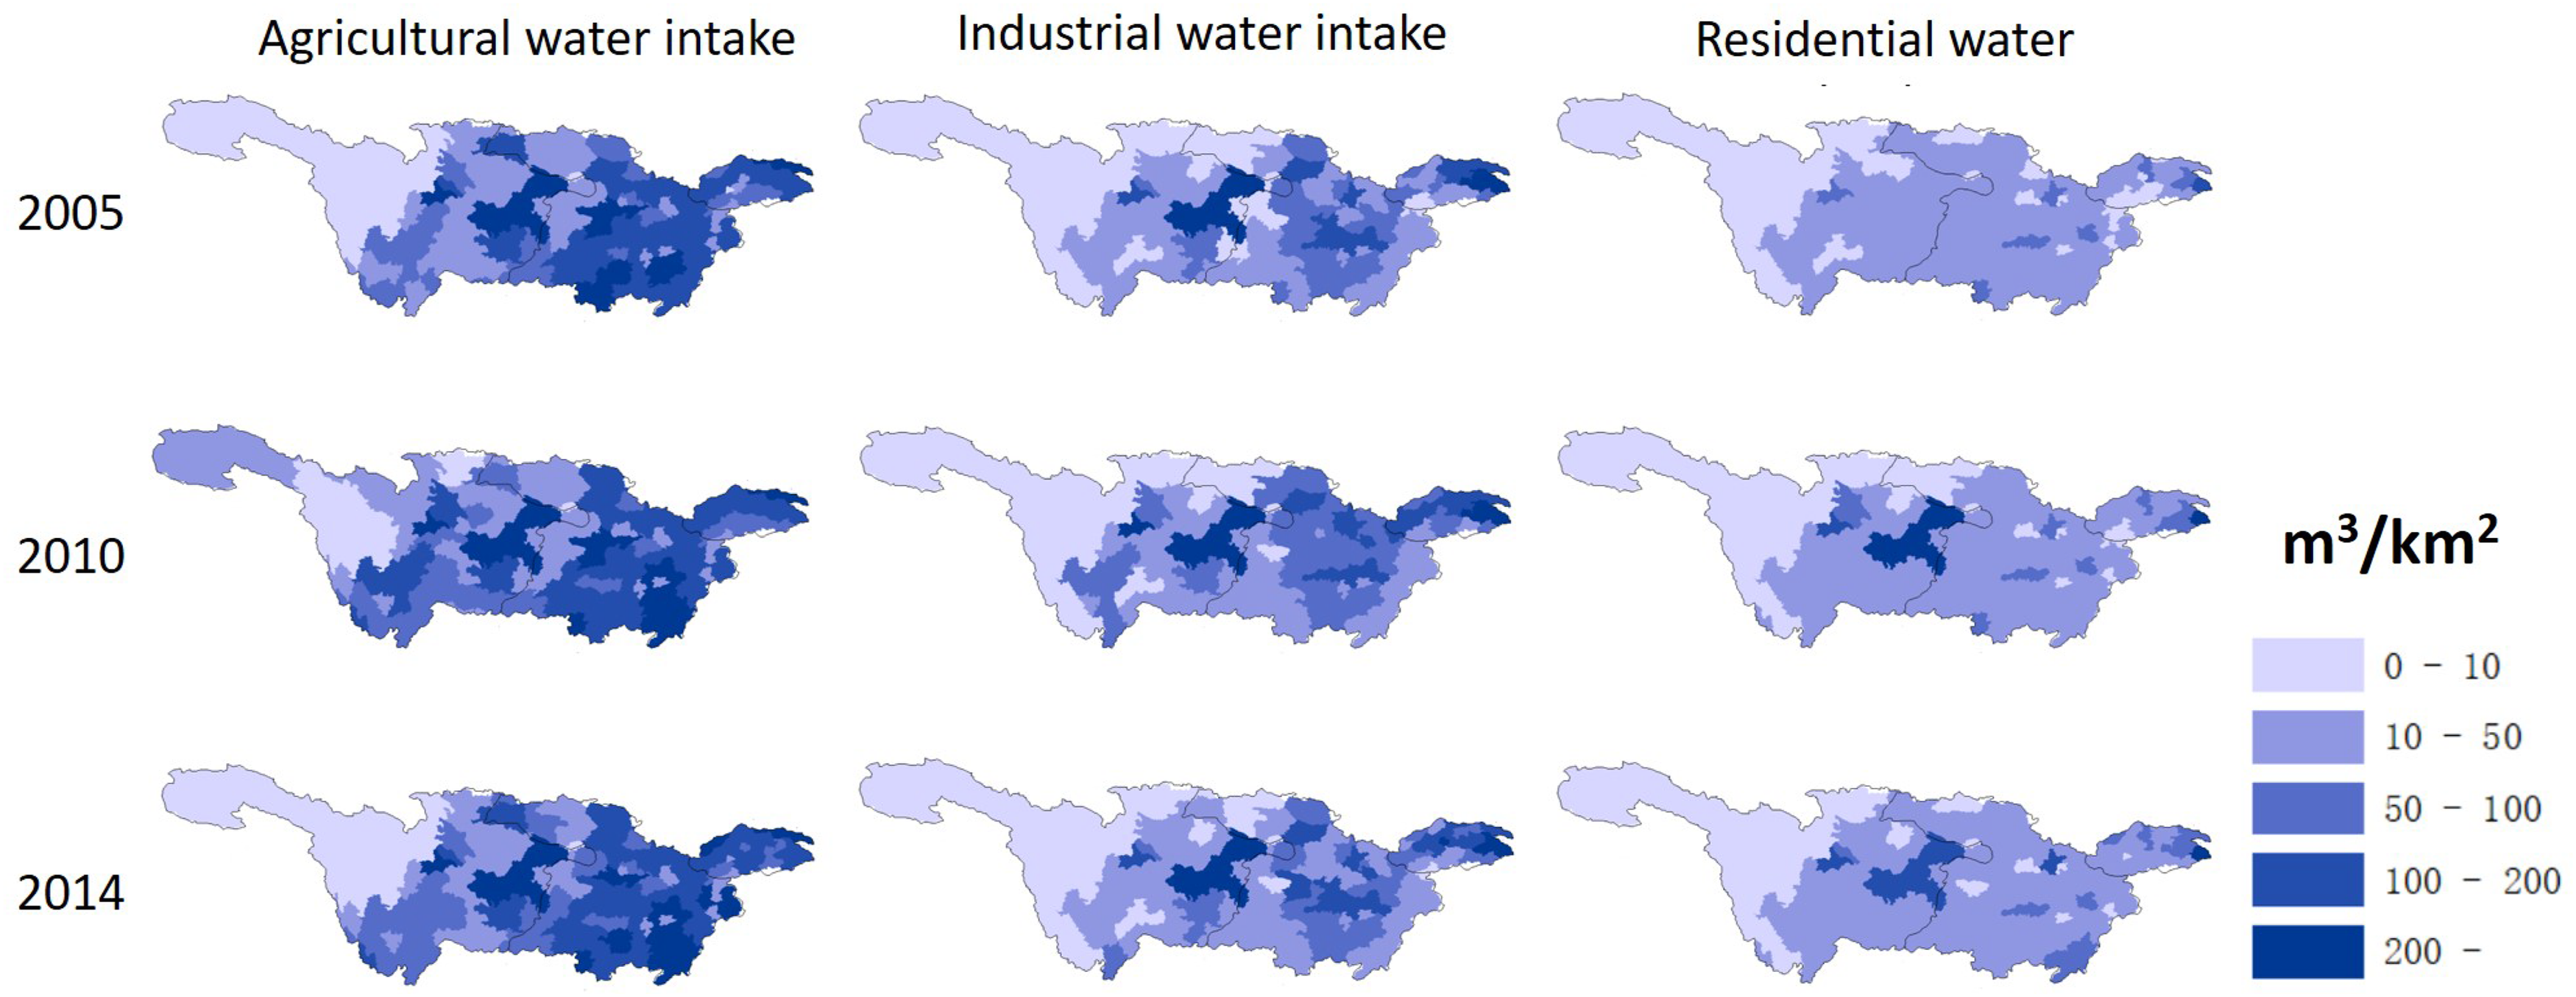
Land area based annual water intake (m3/km2) of agricultural, industrial, and municipal sectors in 2005, 2010, and 2014.
In the upper reach, the water intake for the agricultural sector, industrial sector, and municipal sector is 53%, 35%, and 12% respectively. In the middle reach, the percentages are 61%, 32%, and 7%, respectively. In the lower reach, the percentages are 42%, 50%, and 8%, respectively. Thus, agricultural sectors intake the majority of water in the upper and middle reaches, whereas industry accounts for the majority in the lower reach. The municipal sector accounts for a relatively small percentage (7–12%) of water intakes across the entire Yangtze River basin; however, the percentage increases in high population density districts (e.g., Chengdu, Wuhan, Nanjing, and Shanghai). For example, municipal water accounts for 32% of the total water intake in the district of Shanghai, compared against agricultural (18%) and industrial water (50%) use.
Not all water intakes result in consumptive use, and a fraction of the water returns to the river. Separately, we describe how relationships between population, municipal water intake, and construction of sewage treatment plants contribute to streamflow along the Yangtze River (Wang et al., 2017c), including the following two key conclusions relevant for FEW systems: (1) municipal wastewater produced in the Yangtze River basin increased by 41% between 1998 and 2014—from 2,580 m3/s to 3,646 m3/s—in conjunction with China's investment in public infrastructure and (2) under low flow conditions in the Yangtze River near Shanghai treated wastewater contributions to river flows increased from 8% to 14% between 1998 and 2014. Figure 4 shows additional insights when municipal water consumption and total water intake is normalized to population. Municipal water consumption varies little across the basin, whereas the cumulative water consumption rates (industry, agriculture, and municipal) are higher on the fringes of densely populated urban areas and in the southeastern portion of the Yangtze River basin (Fig. 4). This illustrates the importance of adjoining districts on supporting the prosperity of higher density population districts.
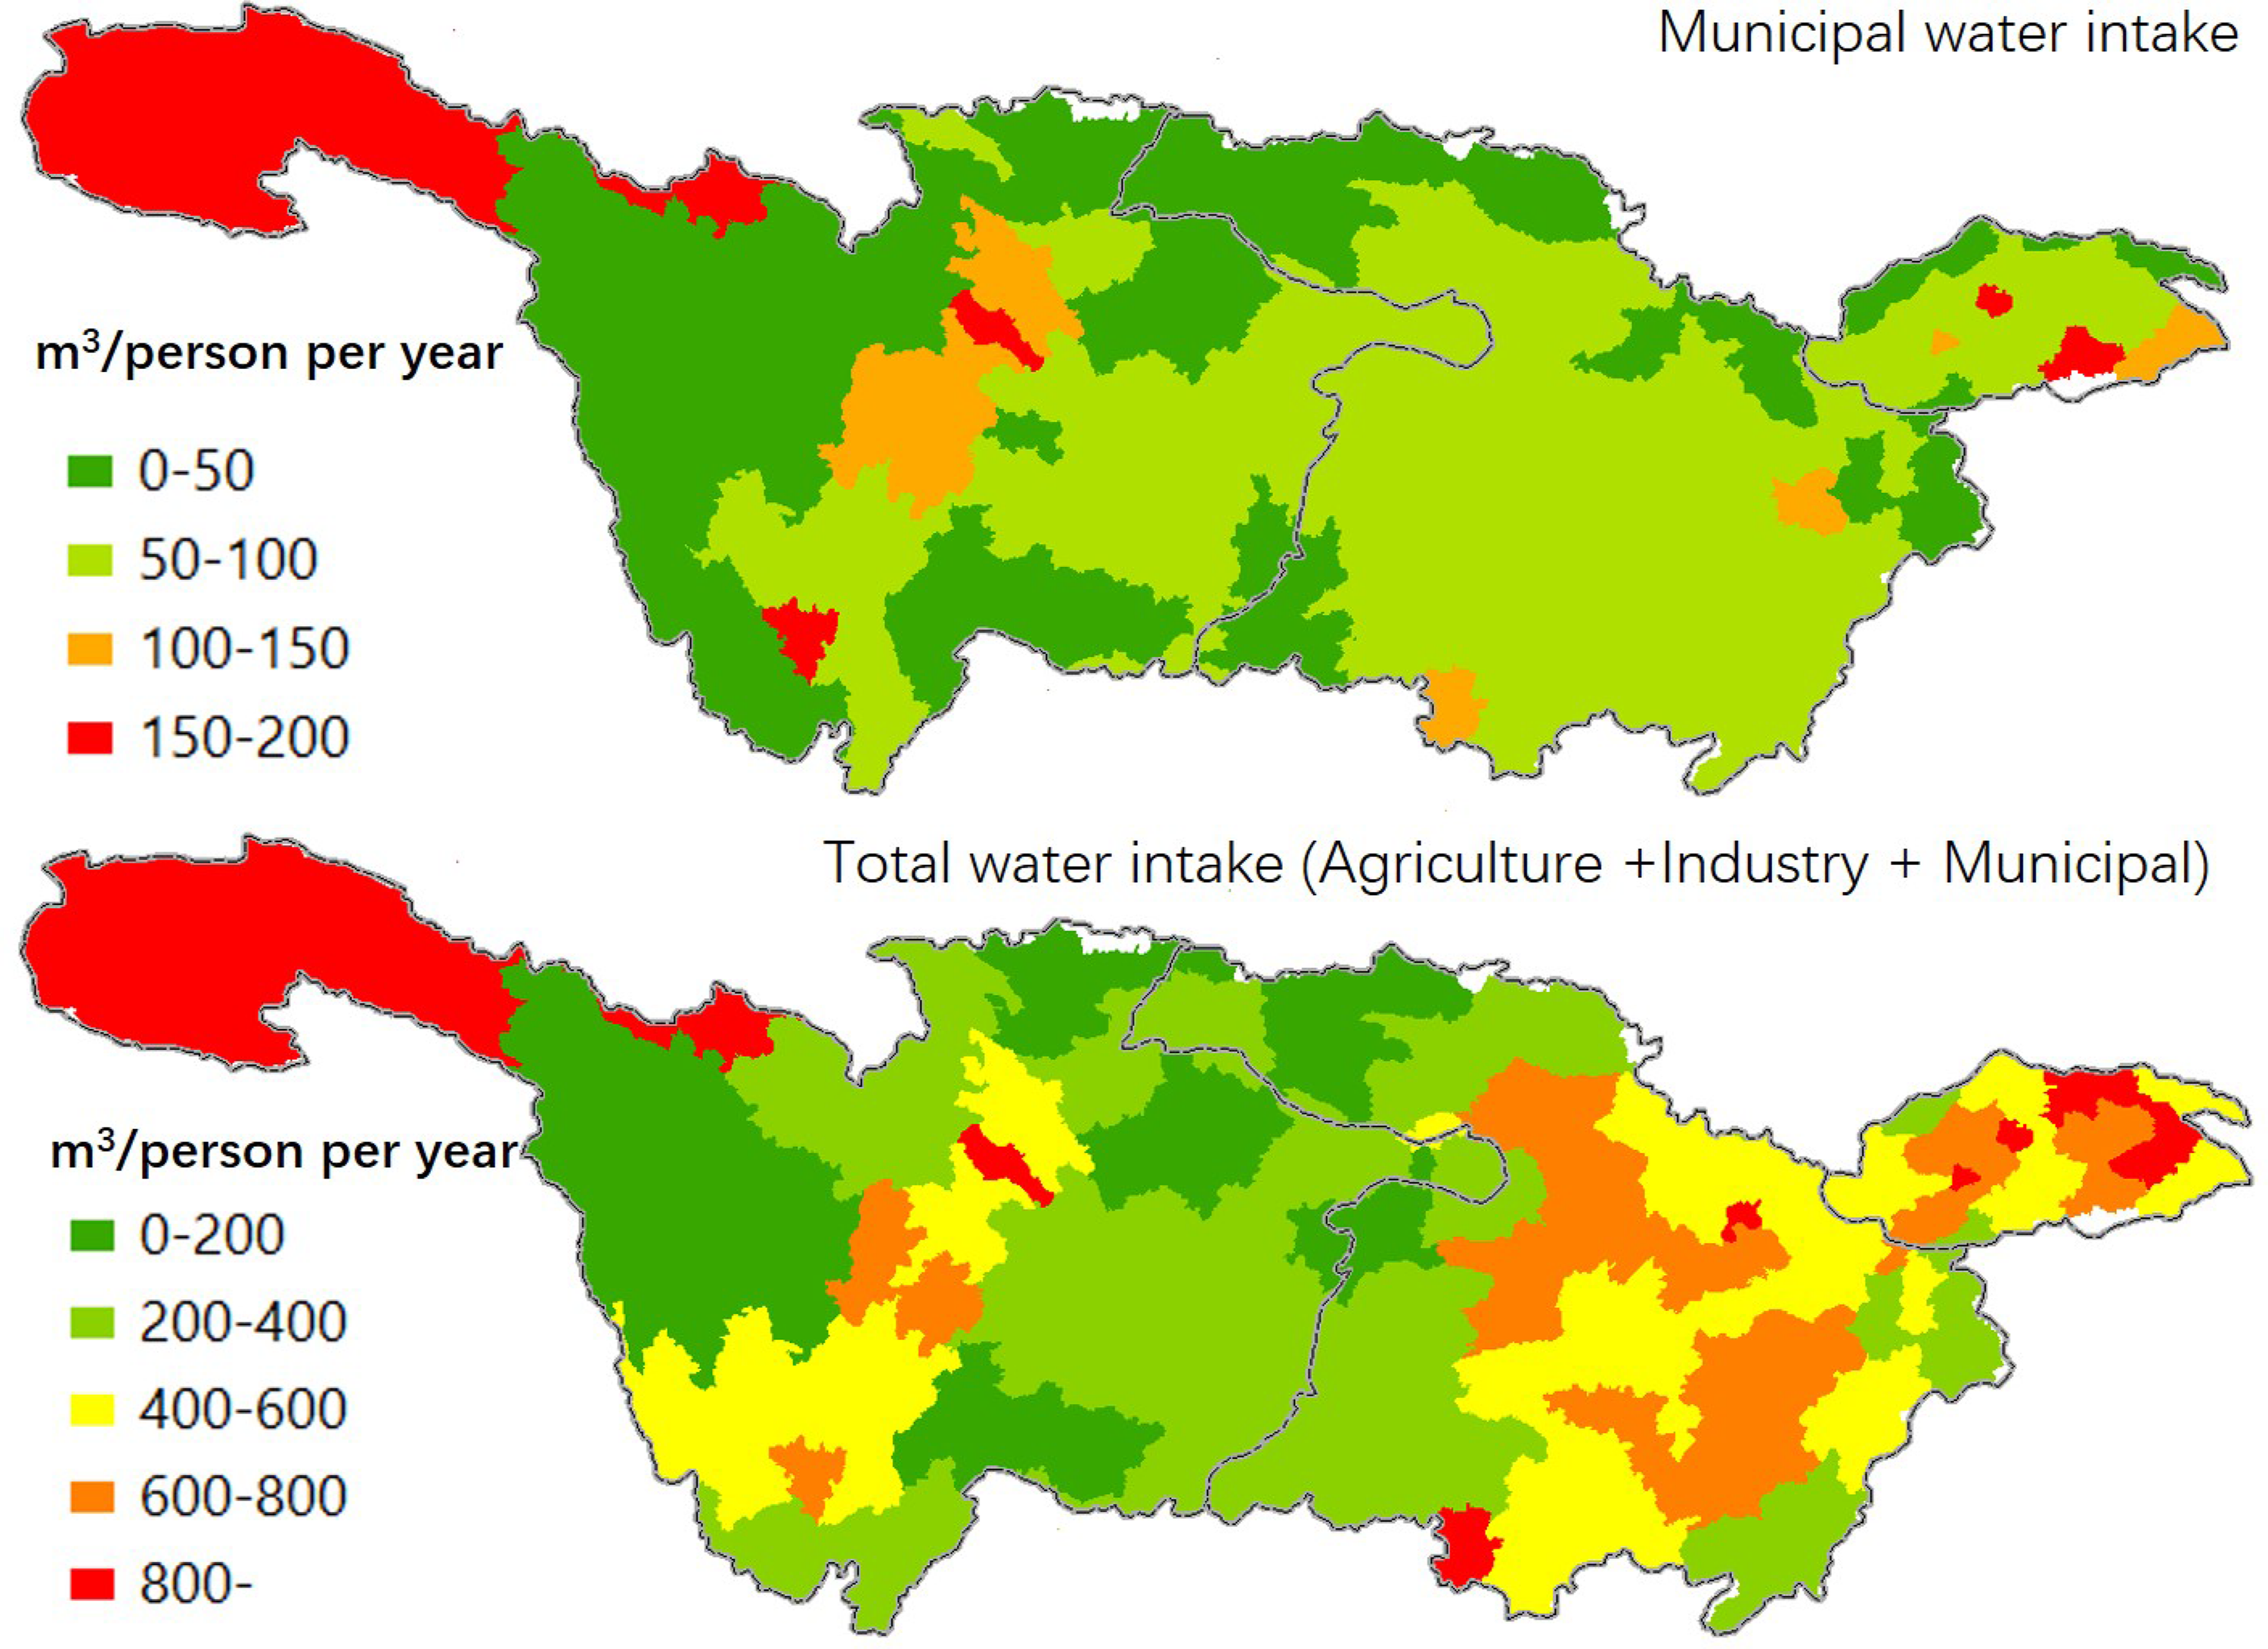
Population-based water consumption (m3/person per year) in each district for municipal water intake only and cumulative water intake (municipal + agriculture + industry [m3]) for each district in 2010.
Food production and agricultural water use
The Yangtze River basin produces a diverse array of agricultural products (Liu et al., 2014), with the major group being grains, beans, and potatoes. Figure 1 shows the spatial distribution of croplands, and Fig. 5 shows the district-level areal production of grain (tons/km2), which totaled 205 million tons in 2014 (Supplementary Fig. S2 shows population normalize energy production). Grain production per unit area is lower in the upland parts of the upper reach (i.e., <100 tons/km2) and gradually increases throughout the middle and lower basins. Sichuan Basin is the main grain producer in upper reach, and the district of Chongqing has the highest annual total regional grain output (11.5 million ton). Abundant croplands in the middle reach account for 98.4 million tons of annual grain, with the highest output coming from the Han River basin. The lower reaches produce 35.9 million tons of annual grain, with the highest output (5 million tons) coming from the district of Nantong, which is located near the estuary of the Yangtze River.
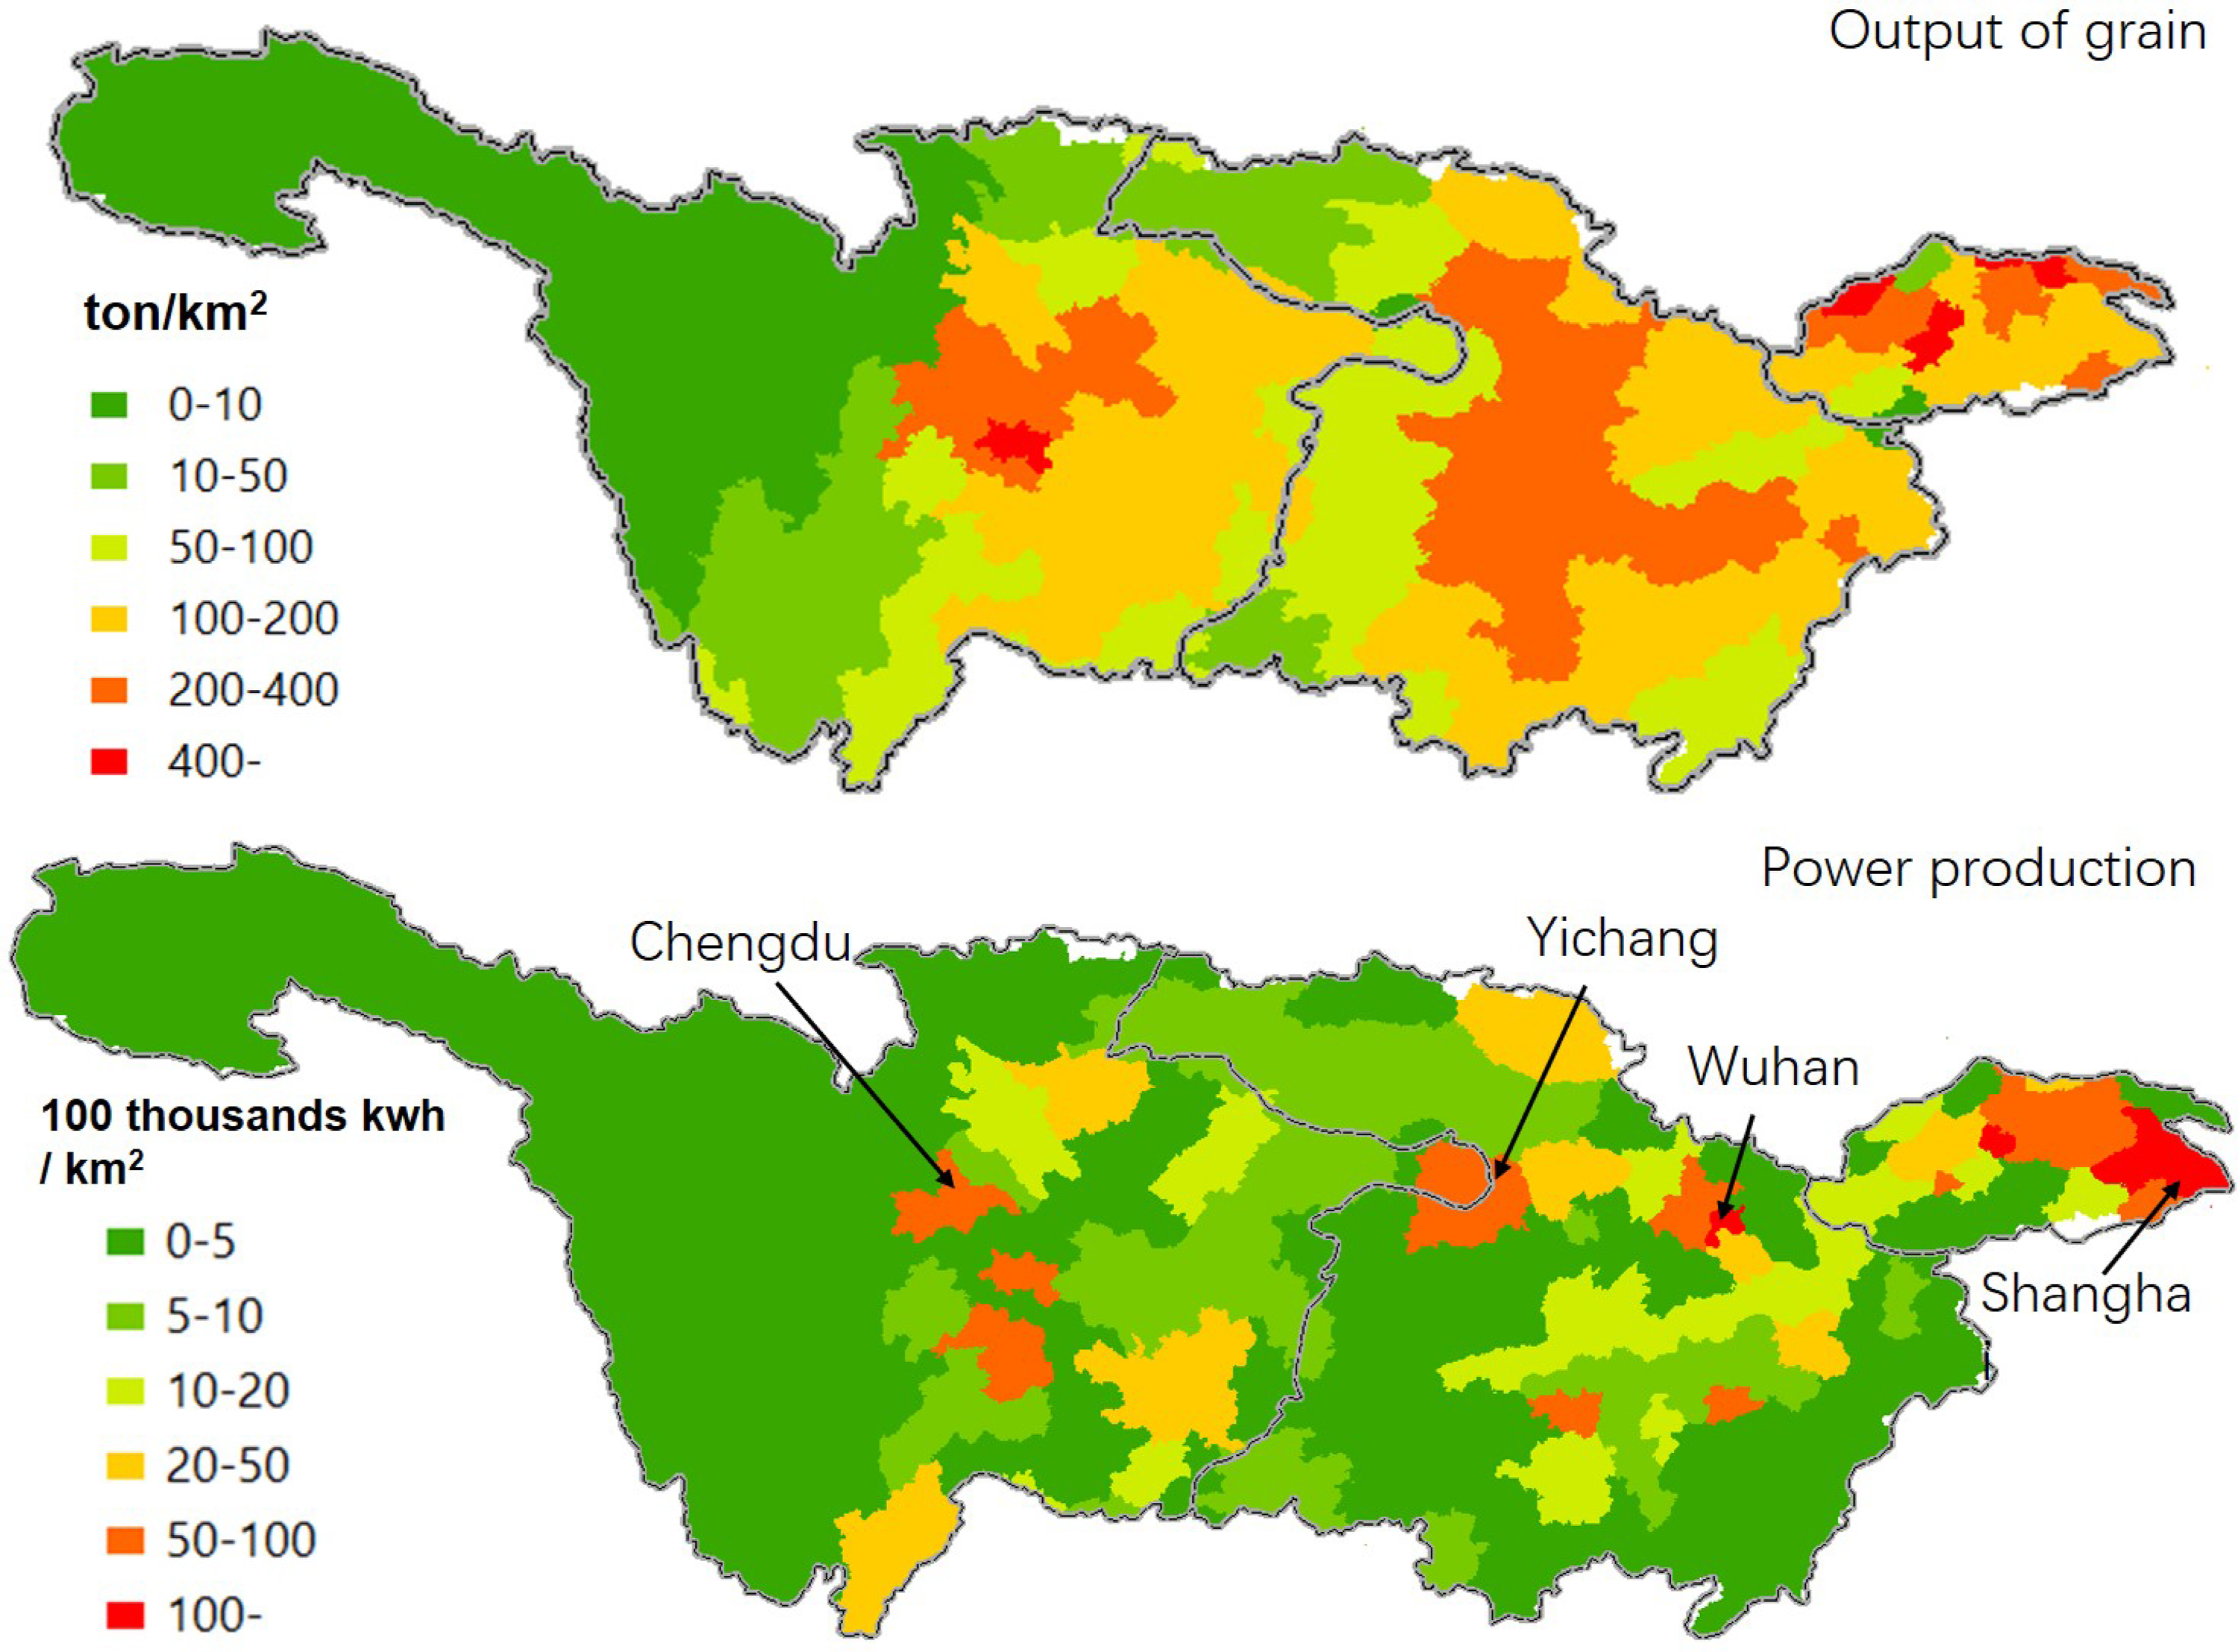
Land area-based outputs of grain (food) and power production (energy) from each district in the Yangtze River basin in 2010.
The basin's high grain output exerts a high water demand. The agricultural sector water intakes in 2014 for the districts of Chongqing, Xiangyang, and Nantong were 2.4, 2.4, and 2.2 billion m3, respectively. This equates to 209 m3 of water per ton of grain in the Chongqing district, 440 m3/ton in Nantong, and 480 m3/ton in Xiangyang. Between 2005, 2010, and 2014, there was a slight increase in the agricultural sector water intake from 104 billion m3 in 2005 to 113 and 114 billion m3 in 2010 and 2014, respectively. Agricultural water intake (Fig. 3) correlates wells with grain output (Fig. 5) throughout the basin.
Energy production and industrial water use
Industrial water accounted for 66 billion m3 in 2005 and 82 and 65 billion m3 in 2010 and 2014, respectively. As illustrated in Fig. 3, industrial sectors intake less water than agricultural sectors. Intense water intake districts are geographically spotted across the basin, including Chengdu, Chongqing, and Wuhan in the upper and middle reaches and Changzhou, Wuxi, Suzhou, and Shanghai districts in the lower reaches, where the industrial sector water intake in 2014 was 1.3, 2.0, 3.1, and 3.9 billion m3, respectively. These intakes account for 48%, 56%, 57%, and 50% of the total water intakes in these four districts of the lower reach.
Energy production facilities (coal, gas, nuclear, and hydropower) distributed across different districts (Supplementary Fig. S3) account for a large portion of the industrial sector water intake. While hydropower generation may slightly increase evaporation from lake surfaces, the nuclear, coal, and gas energy production facilities require large volumes of water for thermo-electric cooling towers. While once-through cooled power facilities may only evaporate on the order of 0.5% of the intake water, those with cooling towers evaporate on the order of 50% of the intake water (Sanders et al., 2014). Approximately 900 energy generation facilities are capable of cumulatively producing 1,826 billion kWh. To contrast agricultural versus power generation outputs from each district, Fig. 5 normalizes both these outputs to land area (Supplementary Fig. S4 shows population normalize energy production). The energy production within each district (kWh/km2) utilizes water from within the district but can deliver energy to multiple districts. Compared against agricultural grain production, which consumes water across larger land areas, point sources of water consumption for power production (Supplementary Fig. S3) are concentrated in fewer districts.
Power-generating facilities are spatially located based on availability of coal, gas, or hydropower and near major population centers (Fig. 1 and Supplementary Fig. S3). The Three Gorges hydropower facility located near Yichang generates more than 160 billion kWh per year. Smelting facilities in districts with significant metal mining activities rely, in part, on local coal powered facilities to produce electricity, resulting in several districts with relatively small populations having relatively high energy production capacity. Water intake for power production is greater in 2010 (Fig. 3) than in 2014. This corresponds with a decline in the growth rate of the industrial output from China. Production and rapid adoption of photovoltaic and thermal solar power are occurring across China (Wang et al., 2017a, 2017b), and the water footprint of solar power in China was recently suggested to be higher than previously thought and may account for >30% of the total industrial water use in some major cities (Wu and Chen 2017).
The FEW nexus in the Yangtze River basin
Grain output, power output, and total water intake of each district in 2014 were used to study the FEW nexus of the Yangtze River basin. Figure 6 shows the FEW systems net water interdependency of each district in the basin (i.e., precipitation, evaporation, and all water intakes), represented as net mm of water across the landscape [Eq. (2)]. Net negative values indicate that districts more strongly dependent on river flow from up-river locations, whereas net positive values indicate a surplus that flows to down-river locations. Districts close to net zero cumulative water, or negative, are water-stressed regions that depend on water management policies in the upper watershed, including south to north water transfers from Three Gorges Dam (Fig. 1) (Zhao et al., 2015). The northeastern portion of the Yangtze River basin have several districts that are net negative regarding cumulative water, with the most stressed districts lacking as much as 0.5–1 m annually of equivalent rainfall per unit area.
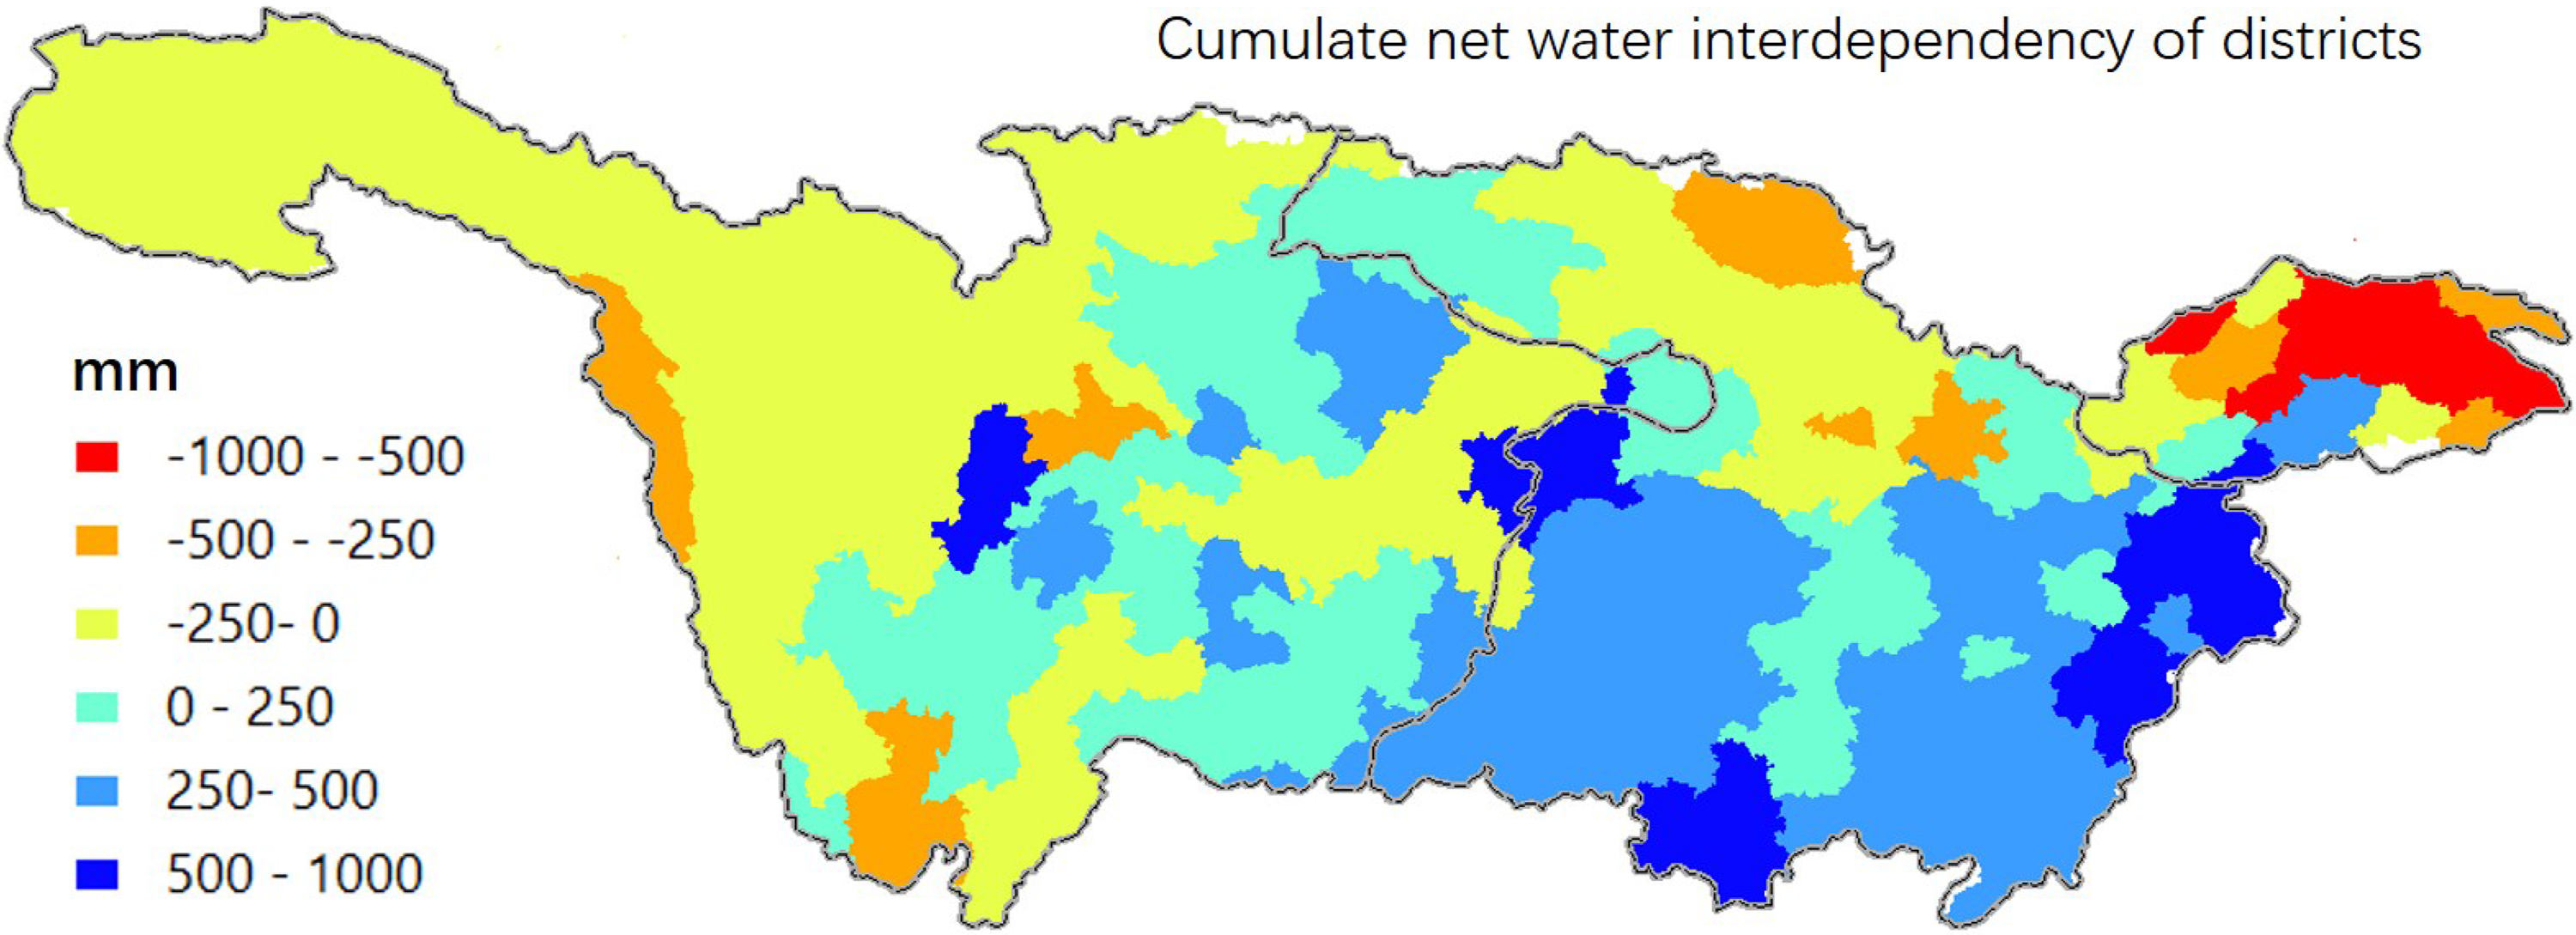
Net water intake by people across the Yangtze River basin in 2010 [based on Eq. (2)].
Ultimately, communities rely upon water for food and energy, and an interesting juxtaposition of the FEW is presented in Fig. 4 for the total water intake per district normalized to population within the district. While annual municipal water consumption rates range up to 200 m3/person/year, accounting for agriculture and industrial withdraws raises these cumulative rates to 800 m3/person/year. Municipal water consumption varies little across the basin, whereas the cumulative water consumption rates are higher on the fringes of densely populated urban areas and in the southeastern portion of the Yangtze River basin where the largest amounts of net positive cumulative water (Fig. 6) is located; Supplementary Fig. S5 shows similar patterns of net water consumption or production from across the district (m2) using the mm of water data from Fig. 6 and then normalizing values to population within each district. This case study demonstrates the value of data visualization to consider spatial district level and temporal analysis of FEW systems to maximize available resources within districts across the Yangtze River basin.
Conclusions
This case study on FEW systems across one of the largest watersheds in the world provides valuable insights into data availability in developing countries and geospatial patterns. Municipal water consumption varies little across the basin, despite very different rainfall patterns. This places a high level of reliance upon water in the Yangtze River and highlights the reliance upon large population centers at the downstream end of the basin on generally less populated but more agriculture and mining intensive activities in upstream regions of the basin. While municipal water consumption rates range up to 200 m3/person/year, accounting for agriculture and industrial withdraws raises by nearly 4X the cumulate water usage per capita within certain districts. Agricultural water intake correlates geospatially well with grain output (Fig. 5) throughout the basin. Thus, as agricultural activity increases to provide food to growing populations, either more water will be withdrawn from the basin upstream or technological advances in agricultural water efficiency are needed to prevent droughts and challenges to large downstream municipalities. We observed a decline in water intakes for power production between 2010 and 2014, corresponding not only with a decline in the growth rate of the industrial output from China but also with increased reliance upon solar-based energy production (Besha 2011; Albala-Bertrand 2016; Yang et al., 2016). As China adopts more aggressive renewable energy production (Song and Wang 2018), it may decrease water use by coal-fired power-generating stations and increase water availability for agriculture or municipal uses.
Many of the water-stressed districts are in the northeastern portion of the Yangtze River basin, and much of the water demand is for municipal rather than industrial or agricultural use. Consequently, with their proximity to ocean, the large cities in this area may be candidates to consider ocean desalination projects, where generated municipal wastewater could be used to supply water to the local agriculture or industry water users. Desalination has an embedded energy density of roughly <1 kWh/m3 for treatment (Werber et al., 2017; Qin et al., 2019) and can be equally as energy intensive to pump treated water inland. Thus, while desalination may address water demand challenges, there will be an associated water demand somewhere in the basin associated with the energy required to desalinate and transport seawater.
Footnotes
Acknowledgments
The authors thank the National Science Foundation for funding through the Central Arizona-Phoenix Long-Term Ecological Research (DEB-1832016) and Arizona State University Decision Center for a Desert City (Award No. 0951366). This study is supported by the National Science and Technology Major Special Project (No. 2012ZX07205005) and the National Natural Science Foundation of China (No. 51379150 and No. 51439006).
Author Disclosure Statement
No competing financial interests exist.

References
Supplementary Material
Please find the following supplemental material available below.
For Open Access articles published under a Creative Commons License, all supplemental material carries the same license as the article it is associated with.
For non-Open Access articles published, all supplemental material carries a non-exclusive license, and permission requests for re-use of supplemental material or any part of supplemental material shall be sent directly to the copyright owner as specified in the copyright notice associated with the article.
