
Abstract
Abstract
Recently, much attention has been paid to the mechanical properties of cementitious materials containing recycled crushed waste oyster shells (WOSs) instead of river sand. However, few have focused on their transport behavior. The present study investigated the mechanical and transport properties, as well as cost efficiency, of hardened mortars containing crushed WOSs. Mortar mixtures containing different amounts of crushed WOSs (10%, 20%, and 30%) in place of river sand were prepared and compared with mortar containing only river sand (reference). Use of crushed WOSs lowered hardened densities and mechanical properties, but increased water absorption, water permeability, and chloride ion penetration compared with control mortars. Increasing the curing period, however, effectively improved the hardened densities, mechanical properties, and transport behavior of crushed WOS mortars. Furthermore, use of crushed WOSs improved the cost efficiency of mortar production. By better understanding the behavior of mortars containing crushed WOSs, acceptable crushed WOS: river sand replacement ratios can be selected to make mortars with different mechanical and durability-related properties for various uses.
Introduction
Aquaculture has become one of the fastest growing production activities in coastal countries (Bernal and Oliva, 2016), with an annual growth rate of 6.2% between 1980 and 1990 (FAO, 2014). It is estimated that by 2022, global aquaculture output may grow by as much as 29–50% (FAO, 2015). Oysters are a main aquaculture product representing more than 12% of the total output from 2000 to 2009 (FAO, 2011). The amount of oysters produced in Korea every year is reportedly 0.3 million tons, and about 0.305 million tons of oysters were generated in Taiwan in 2009. As the largest aquaculture producer in the world, China's oyster production exceeded 1 million tons in 2008 and increased rapidly to 5.11 million tons in 2010. It is estimated that worldwide oyster production exceeds 20 million tons annually (EPAGRI, 2010).
In addition to providing a steady supply to meet consumer demands, rapid growth in oyster aquaculture has also advanced the oyster product industry. However, such growth has also led to accumulation of large amounts of oyster shell waste (Wheaton, 2007). If not properly recycled, harmful bacteria adhering to oyster shells can pollute the groundwater, and decomposition of salts in the shells could lead to release of toxic organic gases, such as hydrogen sulfide and ammonia. Moreover, decay of the oyster body produces very unpleasant odors (de Alvarenga et al., 2012; Palmer et al., 2015). Therefore, methods of recycling waste oyster shells (WOSs) have attracted more and more attention in coastal countries.
In the past three decades, much effort has focused on developing viable methods for solving this problem. For example, WOSs have been used in agricultural fertilizer preparation, water treatment agents, and soil adsorbents. However, common denominators restricting the widespread use of these approaches were their high production costs and low availability relative to more commonly used products (Kwon et al., 2004; Lee et al., 2010; Yong et al., 2010; Yu et al., 2010; Garrido-Rodríguez et al., 2013; Ahmed et al., 2015). Additionally, use of WOSs in soil adsorbent production was further limited by high energy consumption and pollution (Barros et al., 2009; Wang et al., 2014). Hence, only a small portion of WOSs produced are actually recycled, while 40–50% are discarded in coastal areas. Therefore, development of cost-effective, environment-friendly, and sustainable ways of coping with the ever-increasing WOS problem is critical.
In recent years, chemical analyses have shown that oyster shells mainly comprise calcium carbonate, which does not react with binder materials. This property suggests WOSs could feasibly be used as an alternative to other natural aggregates in cementitious materials (Yoon et al., 2003). Such usage would require large amounts of WOSs and potentially be a cost-saving method of making mortar (Mo et al., 2016). Introduction of WOSs as an aggregate has been shown to have distinctive effects on the behavior of cementitious materials. A study by Eo and Yi (2015) showed that the presence of coarse WOS aggregates in cementitious material reduced its fresh and mechanical properties compared with material made with natural coarse aggregates. However, further investigation by Yoon et al. (2004) found that cementitious materials made with fine WOS aggregates exhibited higher compressive strength than those made with coarse WOS aggregates, while others showed that replacing 20% of the river sand in cementitious material with crushed WOSs enhanced the mechanical properties (Yang et al., 2005; Kuo et al., 2013). Furthermore, inclusion of mineral admixtures has been shown to significantly improve properties of cementitious materials made with crushed WOSs (Wang et al., 2013).
Although the fresh and mechanical properties of cementitious materials made with crushed WOSs have been studied extensively, few reports have investigated the transport behavior. The hardened structure of cementitious materials allows for penetration by water and/or chemicals in the environment, causing corrosion and reducing its service life. Hence, a complete understanding of the transport behavior of cementitious materials (i.e., absorptivity and permeability) is critical for evaluating durability.
The present study investigated the mechanical and transport properties of hardened mortars containing various concentrations of finely crushed WOSs in place of river sand. In addition, the cost efficiency of crushed WOS mortars was also discussed. By better understanding the behavior of mortars containing crushed WOSs, acceptable crushed WOS: river sand replacement ratios can be selected to make mortars with different mechanical and durability-related properties for various uses.
Materials and Methods
Cement
Ordinary Portland cement (OPC) with a strength class of 42.5 was used as the binder. OPC met the ASTM C 150-07 (2007) specification for ASTM type I cement. The oxide compositions and physical properties of OPC are given in Table 1.
Oxide Composition and Physical Properties of Ordinary Portland Cement
Fine aggregates
Natural river sand with a maximum granule size of 5 mm was obtained from Nanjing, China. WOSs were sourced from the southeast coast of China and prepared by removing residual surface materials, cleaning, and then crushing into a particle size of 5 mm or smaller. Then, the crushed WOSs were heated in an oven at 100–110°C for 24 h. Table 2 provides particle grades and physical properties of the river sand and crushed WOSs.
Particle Grades and Physical Properties of River Sand and Crushed Waste Oyster Shells
OD: density at absolutely dry condition.
SSD: density at SSD condition.
OD, optical density; SSD, saturated surface dry; WOSs, waste oyster shells.
Superplasticizer
The sulfonated naphthalene formaldehyde superplasticizer with 0.5% sodium sulfate was used.
Mortar mixture
Preliminary experimental results showed that mortar containing 40% finely crushed WOSs in place of river sand did not meet accepted engineering requirements due to its low workability. Therefore, mortar mixtures assessed in the present study were prepared with 10% (WOS-10), 20% (WOS-20), and 30% (WOS-30) WOSs; mortar containing only river sand as the fine aggregate (i.e., 0% WOS) was used as a reference. To make the 28-day compressive strength of all of the mortars greater than 45 MPa, the weight ratio of the binder:water:total fine aggregates was 0.4:0.18:1 by calculation. The amount of binder was constant at 608 kg/m3, and the amount of sulfonated naphthalene formaldehyde superplasticizer added to all mixtures was equal to 0.3% of the binder material mass. Mortar mixture proportions are shown in Table 3.
Mixture Proportions of Crushed Waste Oyster Shells and River Sand Mortars
Reference, mortar mixture prepared with river sand only; WOS-10, -20, and -30 mortar mixtures prepared with 10%, 20%, and 30% crushed WOSs, respectively.
per m3 of fresh mortar.
OPC, ordinary Portland cement; SNF SP, sulfonated naphthalene formaldehyde superplasticizer; W/C, weight ratio of water and cement.
Mortar preparation and curing conditions
First, both of the fine aggregates at appropriate percentages were premixed for 120 s in a rotary mixer before adding the OPC and dry mixing for another 60 s. Then, water and sulfonated naphthalene formaldehyde superplasticizer mixtures were added to the dry contents and mixed for 180 s. The fresh mortars were poured into molds and compacted by three layers. The compacted mortar samples were cured at 20°C for 24 h to comply with the GOST 10180 standard (GOST 10180, 1999). Thereafter, prepared samples were demolded and cured in a standard water box at 20°C ± 2°C with 95% ± 5% relative humidity until of testing age.
Chloride content
The chloride content in aggregate materials and mortars (fresh and hardened) is shown in Table 4. The chloride content in crushed WOSs was measured according to GB/T 14684 (2011). JTJ 270 (1998) was introduced to test the total chloride content in fresh and hardened mortars. The chloride content of crushed WOSs (0.17%) exceeded the limit for aggregates specified by almost all national standards (BS 882, 1992; JIS A 5308, 2009; GB/T, 2011). However, BS EN 12620 (BS EN 12620, 2002, 2013) removed the limit values of chloride content in aggregates, and controlling total chloride content in concrete has become a trend (Liu et al., 2018). From Table 4, the total chloride content in mortars increased with increasing WOS content, and the total chloride content in fresh mortars was slightly larger than that in hardened mortars. The total chloride content in fresh mortars containing 30% WOSs was the largest of all (0.151%). Since the maximum limit of chloride content in concrete under normal atmospheric conditions is mostly >0.20% ( ACI 318, 2005; JGJ 55, 2011; BS EN 206, 2013), crushed WOSs can be safely used in plain fiber-reinforced polymer, or reinforced concrete in a chloride-free environment in Britain if the replacement rate is low, and has the potential to be used by other countries in the future.
Chloride Content in Fine Aggregate Materials and Mortars
Reference, mortar mixture prepared with river sand only; WOS-10, -20, and -30 mortar mixtures prepared with 10%, 20%, and 30% crushed WOSs, respectively.
Hardened density measurement
The hardened density of mortar samples was determined according to BS EN 12390-7 (2009). After water curing for 3, 7, 28, and 90 days, three cube samples (100 × 100 × 100 mm) were used for each curing time. The mortar samples were dried at 105°C ± 5°C for 24 h until mass change was <0.2%. Then, the mass of each sample was obtained and the volume of mortar measured. The standard equation for density was used to determine the hardened density of each mortar sample:
where D is the hardened density of the oven-dried mortar sample (kg/m3), M is the mass of the oven-dried mortar in air (kg), and V is the volume of the oven-dried mortar (m3).
Flexural strength testing
After water curing for 3, 7, 28, and 90 days, three prism-shaped samples (40 × 40 × 160 mm) were used for each curing time to determine flexural strength according to ASTM C 348 (2008). A universal test machine with constant external load of 3,000 kN and displacement rate of 0.20 mm/min was applied.
Equivalent compressive strength testing
ASTM C 349 (2008) was introduced to test the equivalent compressive strength of each mortar sample. After water curing for 3, 7, 28, and 90 days, two broken pieces of prism-shaped mortar samples (at least 40 × 40 × 65 mm) used in the flexural strength test were used to test equivalent compressive strength. The uniaxial equivalent compressive strength of each mortar sample was assessed using a universal compression machine with a maximum load capacity of 3,000 kN.
Stress–strain testing
The stress–strain response of each mortar sample was estimated in compliance with ASTM C 469-02 (2002) using three Φ 50 × 100-mm cylindrical samples for each curing duration (i.e., 28 and 90 days). Before the stress–strain test, two linear variable differential transducers were attached to the middle of each sample to test the axial displacement of mortar. Longitudinal deformation of each sample was measured by a linear variable differential transducer in the horizontal direction. Displacement-controlled loading was applied at a rate of 0.001 mm/s. Upon reaching peak load, the load on the sample began to reduce. Stress–strain curves were recorded by a computer.
Water absorption testing
After water curing for 28 and 90 days, water absorption testing using three Φ 100 × 50-mm cylindrical samples for each curing duration was conducted based on ASTM C 1585-04 guidelines (ASTM C 1585-13, 2014). Then, samples were dried in an oven at 100–110°C for 24 h and cooled to room temperature until the mass was constant. Then, side and top surfaces of each sample were coated with epoxy resin; the bottom surface of each sample was kept in contact with water (≤5 mm above the bottom surface). At each time interval (1, 2, 4, 8, 24, 48, 72, and 96 h), the cumulative average mass gain of the sample per surface area due to water absorption was tested. Initial water absorption and the water absorption coefficient of the sample were obtained according to Buyle-Bodin and Hadjieva-Zaharieva (2002) as follows:
where I is the cumulative average mass gain of the sample per surface area at the absorption time interval (kg/m2), I0 is the initial water absorption (mass gain of the sample per unit surface area within the first 1 h; kg/m2), K is the coefficient of water absorption (kg/m2·s0.5), and t is the absorption time (s).
Water permeability testing
The water permeability test was carried out on the triaxial cell system. Three cylindrical samples of Φ 50 × 100 mm were water cured for each curing time (i.e., 28 and 90 days). Then, samples were dried in an oven at 100–110°C for 24 h to ensure a mass change less than 1%. Thereafter, the side surface of each sample was covered with epoxy resin. Finally, the sample was placed in the water permeability test cell, and the top surface of each sample was exposed to 2 MPa of water pressure for 24 h. At the end of the test, the total water volume that penetrated into each mortar sample was recorded. The water permeability coefficient was determined according to Darcy's law:
where KP is the water permeability coefficient (m/s), μ is the coefficient of dynamic viscosity of water (N·s/m2), L is the thickness of the sample (m), V is the total water volume that penetrated the sample in 24 h (m3), A is the cross-sectional area of the specimen (m2), ΔP is the difference in seepage pressure between the top and bottom surfaces of the sample (Pa), t is the time under water pressure (s), ρ is the density of water (1,000 kg/m3), and g is the acceleration of gravity (9.8 N/kg).
Rapid chloride migration testing
Rapid chloride migration (RCM) testing was based on NT BUILD 492 (1999) guidelines and used to assess the resistance of each mortar sample to penetration by chloride ions. Before the test, three cylindrical samples of Φ 100 × 50 mm were immersed in water for each curing duration (i.e., 28 and 90 days), then kept under vacuum-saturated conditions for 24 h. Then, mortar samples were placed in a rubber sleeve and transferred to test cells. The top surface of each sample was kept in contact with 0.3 M sodium hydroxide, while the bottom surface was exposed to 10% sodium chloride. Then, the samples were subjected to an external potential of 30 V for 24 or 48 h. At the end of testing, samples were axially split into two pieces, and the interior surface of each sample was sprayed with 0.1 M silver nitrate to determine the penetration depth of chloride ions. According to Section 6.5 of NT BUILD 492 (1999), the chloride ion migration coefficient (DRCM0) can be calculated as follows:
where DRCM0 is the chloride ion migration coefficient (m2/s), T is the average temperature of the anolyte solution (K), R is the gas constant (8.314 J/K·mol), z is the absolute value of ion valence for chloride ions (i.e., 1), F is Faraday's constant (9.648 × 10⁴ J/V·mol), U is the absolute value of the applied voltage (V), L is the thickness of the sample (m), xd is the average depth of chloride ion penetration (m), t is the test duration (s), erf−1 is the inverse of error function, cd is the chloride ion concentration at which the color changes, and c0 is the chloride ion concentration in the catholyte solution.
Results and Discussion
Hardened density
Figure 1 presents hardened densities of the reference and crushed WOS mortars at different curing times. The hardened densities of all mortar mixtures increased with longer curing time. This is due to the cement hydration reaction generating more hydration products over time, which fill any voids within the hardened mortar. However, utilization of crushed WOSs as a fine aggregate reduced the hardened density of the mortar compared with the reference mortar at each curing stage. After curing for 7 days, the average hardened densities of WOS-10, -20, and -30 were 2,096.6, 2,089.9, and 2,076.6 kg/m3, respectively, which were 0.38%, 0.69%, and 1.33% lower than the reference, respectively (Fig. 1). After 90 days of curing, the average hardened densities of WOS-10, -20, and -30 were only slightly lower than that of the reference (0.26%, 0.45%, and 0.69%, respectively). The lower density of hardened WOS mortar can be attributed to the lower saturated surface dry density of crushed WOSs (2,411 kg/m3) versus river sand (2,620 kg/m3). Furthermore, the random distribution of crushed WOS particles in the mortar also likely led to a looser structure (Martínez-García et al., 2016).

Hardened densities of mortars. Reference, mortar containing only river sand; WOS-10, -20, and -30 mortar samples containing 10%, 20%, and 30% crushed WOSs, respectively. WOSs, waste oyster shells.
Flexural strength
Figure 2 shows that flexural strength values of reference and WOS-10, -20, and -30 mortars ranged from 6.02–5.01, 6.69–5.73, 7.01–6.42, and 7.28–6.72 MPa at four curing stages (3, 7, 28, and 90 days). The 7-day flexural strength of crushed WOS mortars was 89.25–91.25% of the 28-day flexural strength of corresponding samples, indicating that inclusion of crushed WOSs in the mortar did not significantly influence the cement hydration process or flexural strength development. However, utilization of crushed WOSs in mortar lowered the average flexural strength compared with the reference at each curing stage. After curing for 7 days, the average flexural strength values of WOS-10, -20, and -30 were 8.07%, 10.91%, and 14.35% lower than the reference, respectively (Fig. 2). Increasing the curing period had a positive effect on the flexural strength of WOS mortars as WOS-10, -20, and -30 values were only slightly lower (2.88%, 5.49%, and 7.69%, respectively) than the reference after 90 days of curing. Furthermore, the 28-day flexural strength values of all mortar samples were >5 MPa, which met the strength limits stipulated by JTG D40 (2011).

Flexural strength of mortars. Reference, mortar containing only river sand; WOS-10, -20, and -30 mortar samples containing 10%, 20%, and 30% crushed WOSs, respectively.
Equivalent compressive strength
Figure 3 shows that the compressive strength of all mortars increased rapidly with curing duration (3–28 days). However, the average compressive strength of crushed WOS mortars developed very slowly and was lower compared with the reference mortar. Moreover, compressive strength decreased as the proportion of crushed WOSs increased in the mortar. After 28 days of curing, the average compressive strength values of WOS-10, -20, and -30 were 36.55, 33.59, and 31.44 MPa, respectively, all of which were lower compared with the reference (38.94 MPa) (Fig. 3). Nonetheless, the 28-day compressive strength values of all mortar samples were within the strength limits (17.2 MPa) stipulated by ASTM C 270 (2014). Increasing the curing period substantially improved compressive strength because it allowed more time to generate cement hydration reaction products, which fill any voids within the hardened mortar (Yoon et al., 2010; González-Fonteboa et al., 2012). In the early curing stages, crushed WOSs had a larger particle size than river sand (Table 2), thereby weakening the adhesive capability of mortar and loosening its microstructure.

Equivalent compressive strength of mortars. Reference, mortar containing only river sand; WOS-10, -20, and -30 mortar samples containing 10%, 20%, and 30% crushed WOSs, respectively.
Stress–strain curves
Figure 4 shows that the stress–strain curves of all mortars were similar, and each curve can be characterized by three different stages. Initially, the stress increased relatively linearly as the strain increased up to approximately one-third of peak stress. In this ascending stage, the mortars were elastically compressed. Thereafter, a nonlinear correlation existed between stress and strain due to the appearance of microcracks on the mortar surface. Finally, after reaching its peak, the stress rapidly decreased as strain increased. In this descending stage, the mortar lost most of its bearing capacity and fractured.

Stress–strain curves of mortars.
Figure 4 also shows that the stress–strain behavior of mortar depended on the content of crushed WOSs. In the elastic stage of both the 28- and 90-day curing curves, the linear portion of the slope decreased with increasing crushed WOS content. This trend was more obvious in 28-day curves, wherein WOS-30 did not significantly decrease in stress and exhibited a large axial strain (Fig. 4a). Moreover, addition of crushed WOSs lowered peak stress and somewhat flattened the descending stage of stress–strain curves at both curing points compared with the reference. These results imply that inclusion of crushed WOSs in mortar reduced its brittleness and made it more susceptible to deformation. In addition, the reference and crushed WOS mortars cured for 90 days showed an increase of 26.05 to 14.17% in peak stress and decrease of 46.24–22.05% in peak strain (Fig. 4b) compared with the corresponding mixtures cured for only 28 days (Fig. 4a). This indicates that a longer curing time is very important for improving the stress–strain behavior of both reference and crushed WOS mortars.
Water absorption
The results of water absorption testing of mortars after curing for 28 and 90 days are shown in Figs. 5–7. The initial water absorption values (cumulative average mass gain of the sample per surface area within the first 1 h) and coefficients of water absorption (slope of the linear regression curve) of reference and crushed WOS mortar samples were obtained by fitting with Equation (2) (Fig. 5), and fitting results are summarized in Figs. 6–7.

Cumulative average mass gain of mortars in water over time.
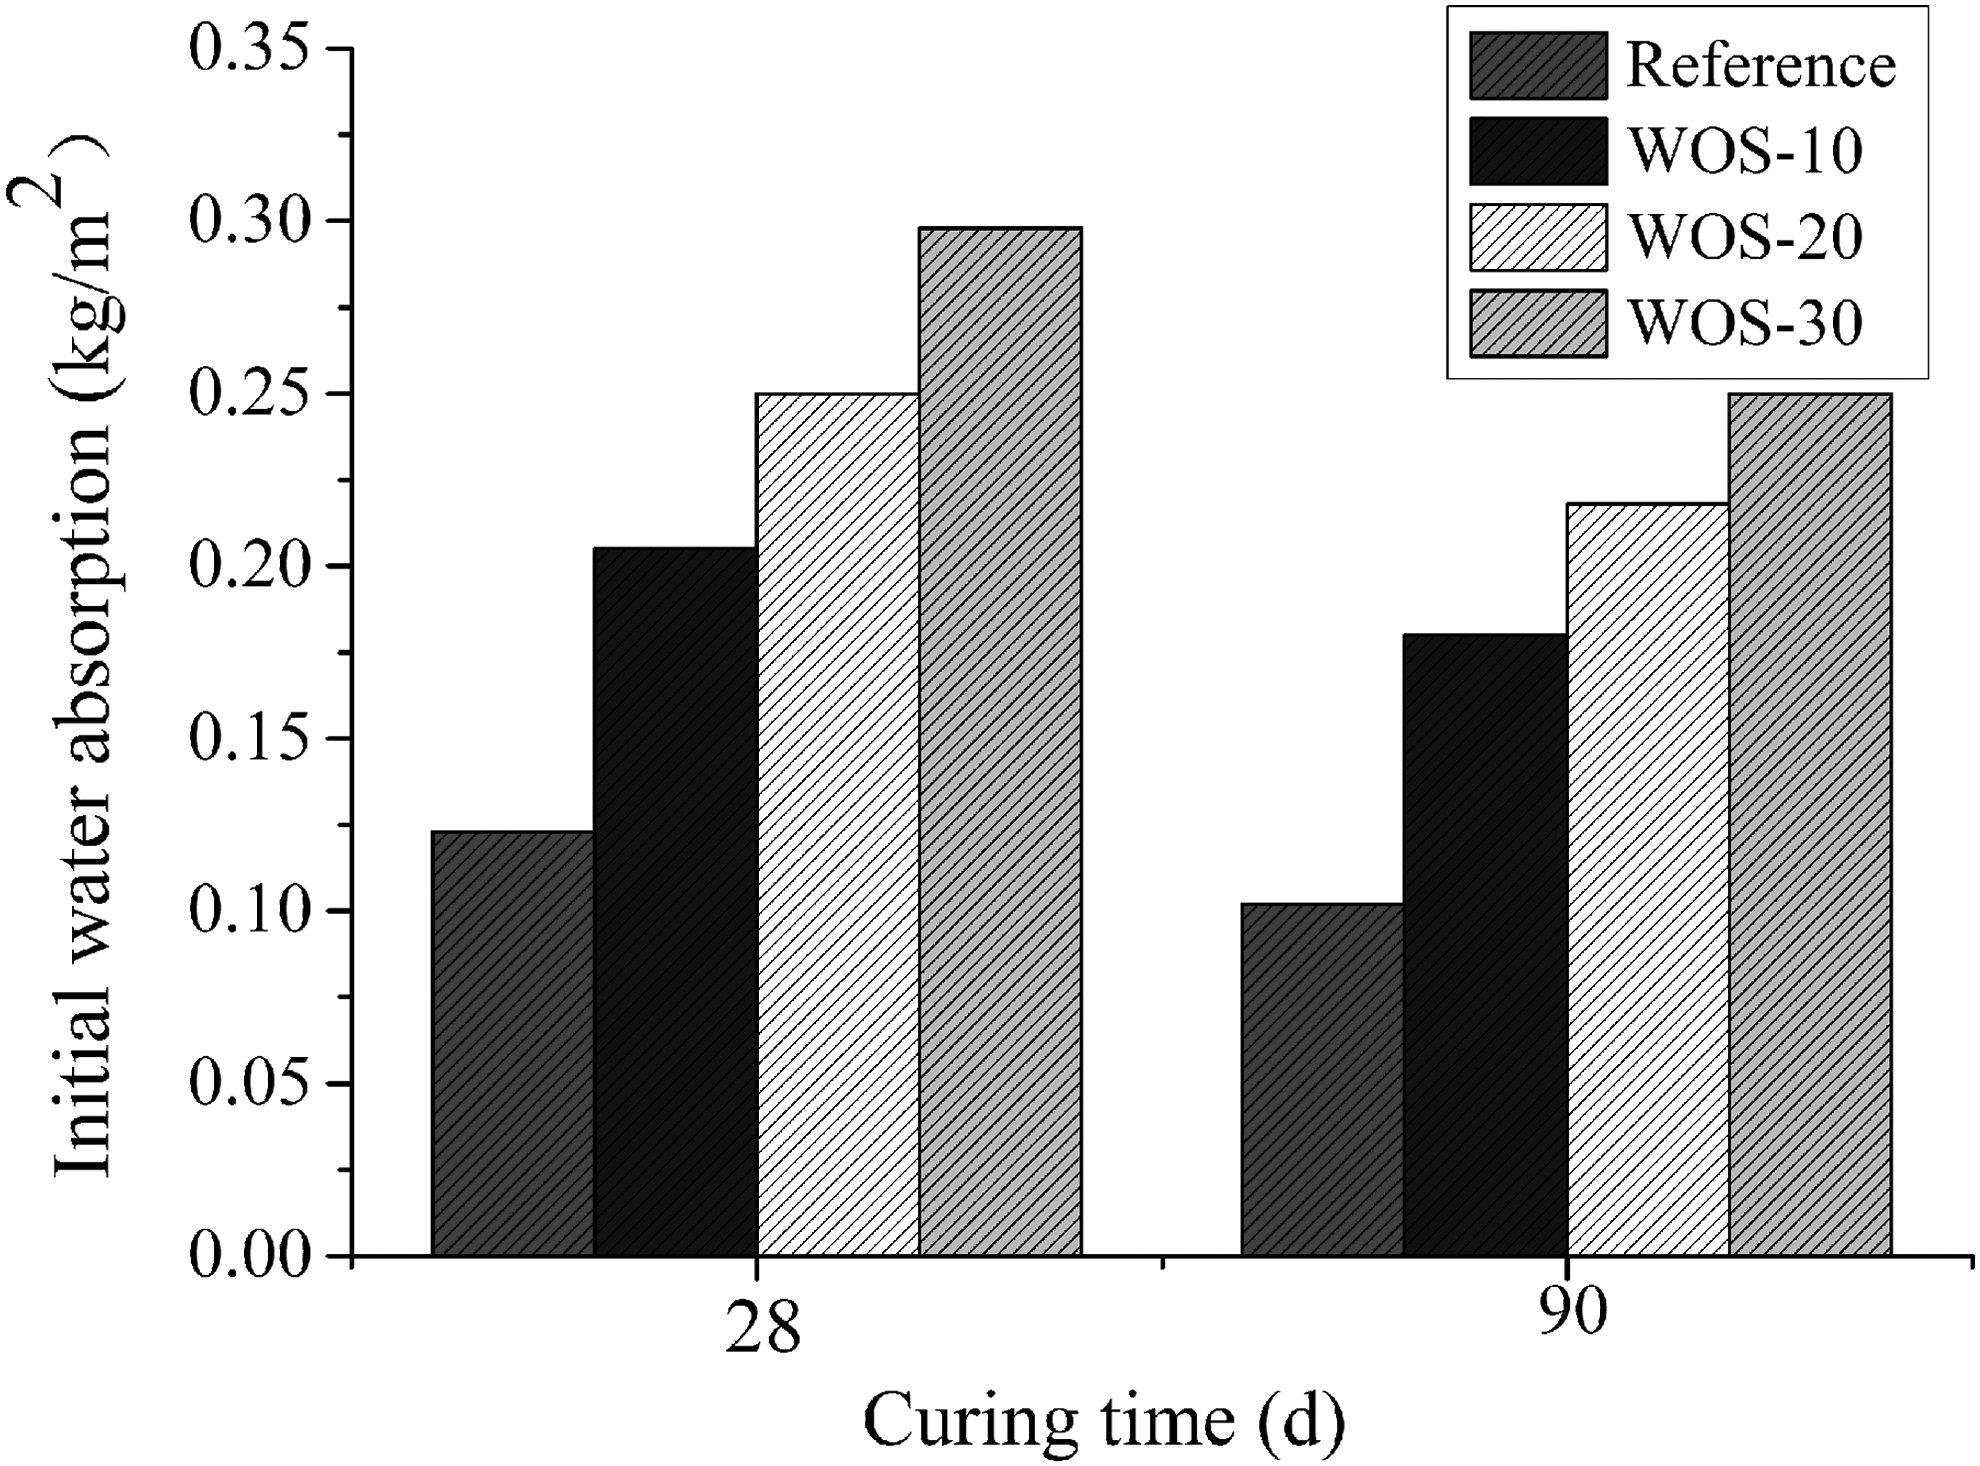
Initial water absorption of mortars. Reference, mortar containing only river sand; WOS-10, -20, and -30 mortar samples containing 10%, 20%, and 30% crushed WOSs, respectively.
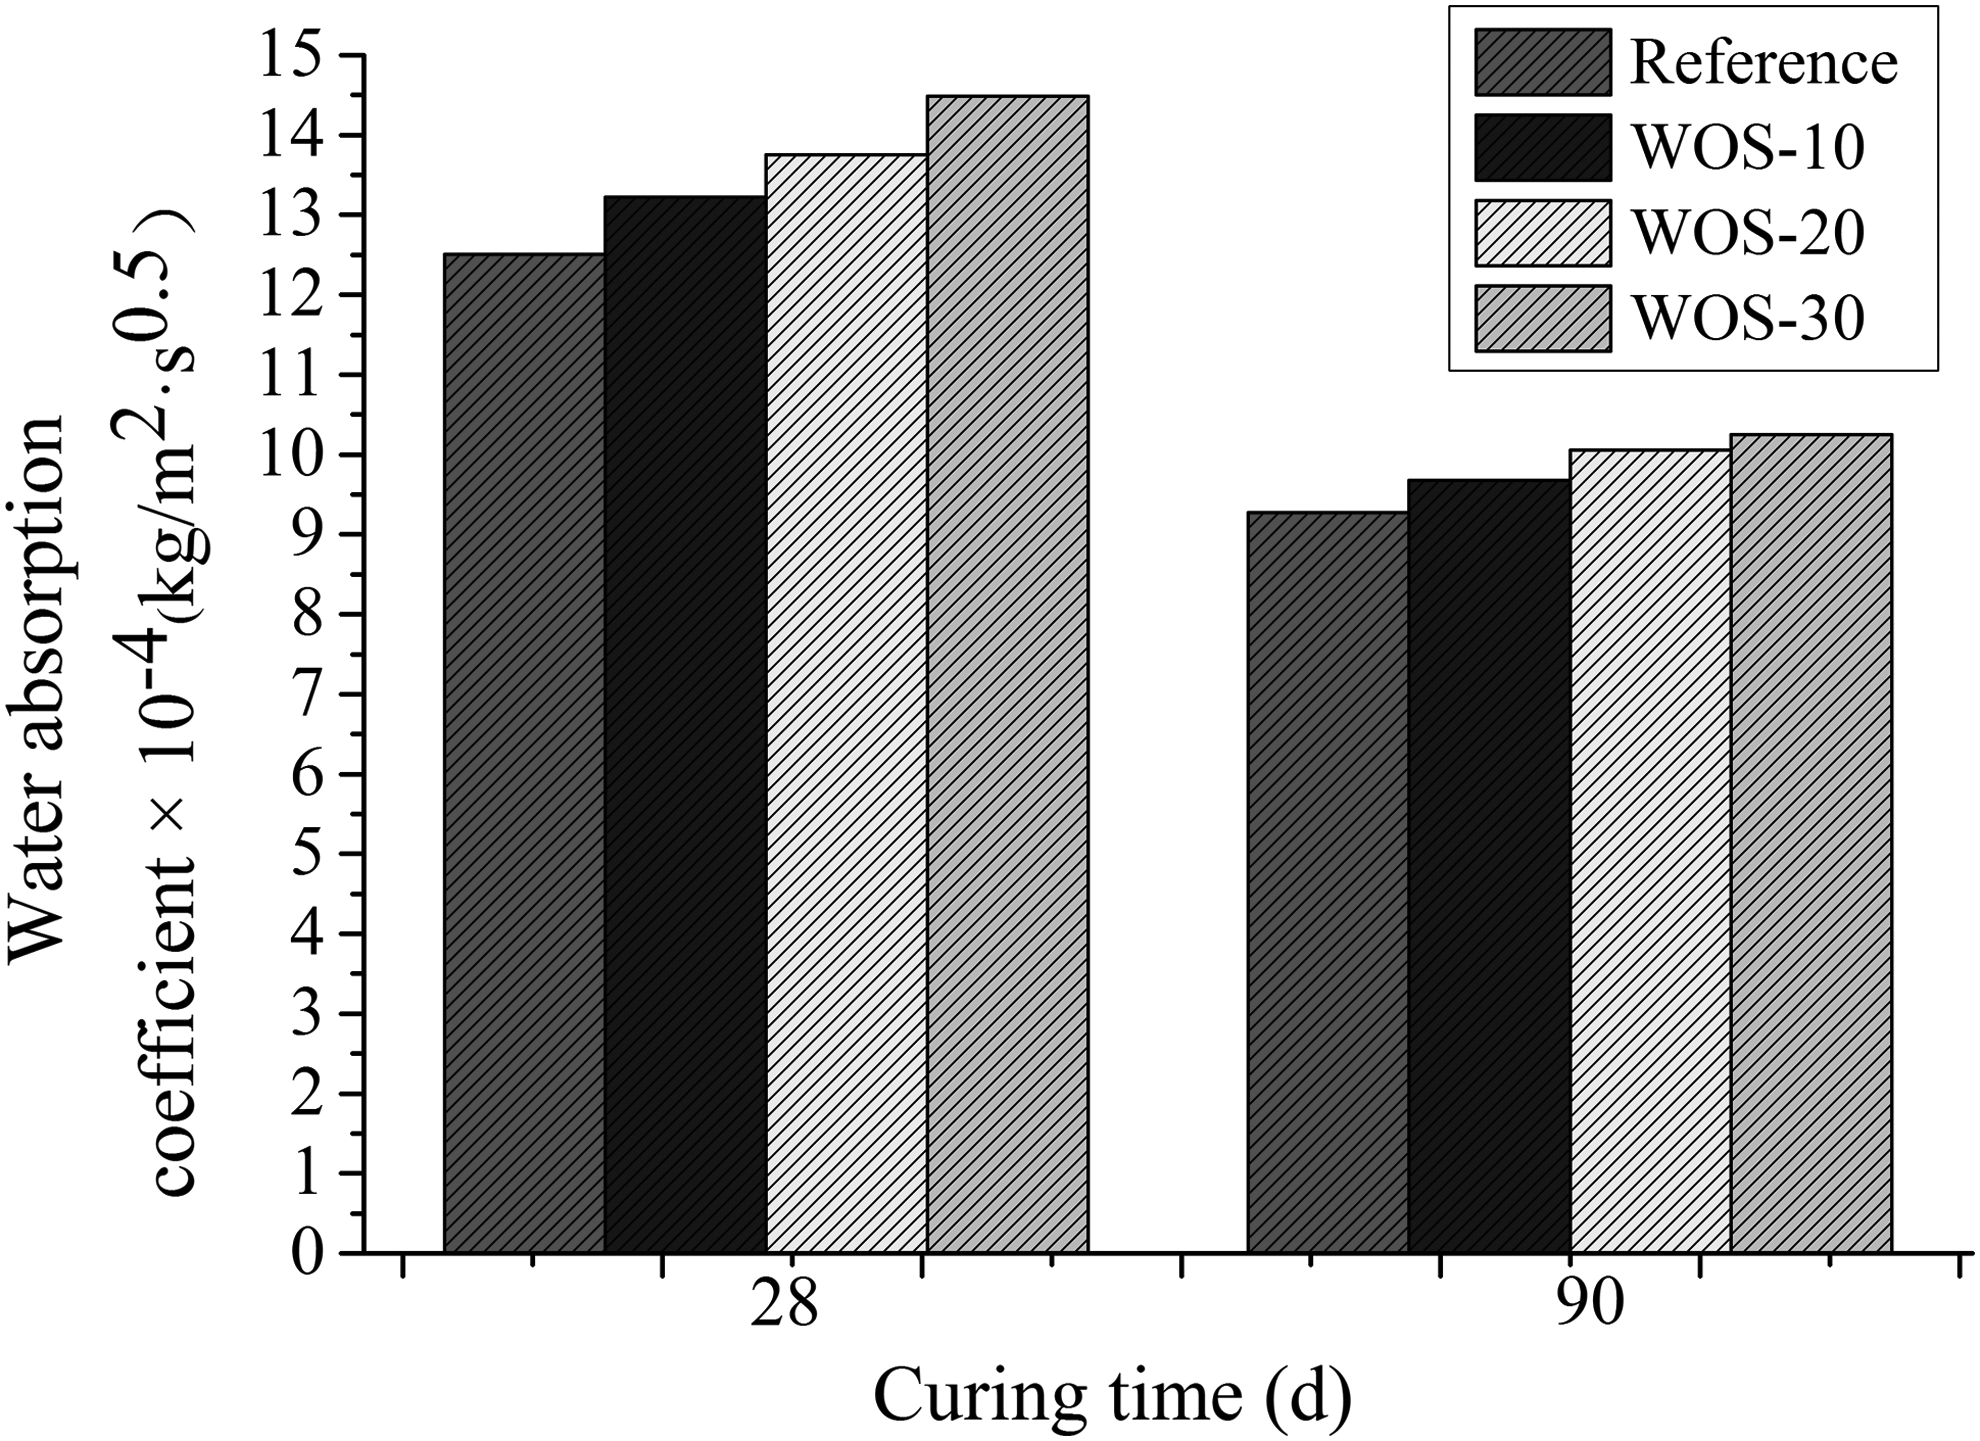
Water absorption coefficients of mortars. Reference, mortar containing only river sand; WOS-10, -20, and -30 mortar samples containing 10%, 20%, and 30% crushed WOSs, respectively.
Initial water absorption values for reference, WOS-10, -20, and -30 mortars were 0.123, 0.205, 0.250, and 0.298 kg/m2 after curing for 28 days and 0.102, 0.180, 0.218, and 0.250 kg/m2 after curing for 90 days, respectively, demonstrating higher overall initial water absorption in crushed WOS mortars versus the reference and increased absorption with increasing WOS content (Fig. 6). On the other hand, a longer curing period appeared to reduce water absorption into crushed WOS mortars. In samples cured for 90 days, crushed WOS mortars had lower initial water absorption than corresponding samples cured for 28 days. This result is also due to a longer curing period enabling production of more cement hydration reaction products to fill any voids in the mortar, thereby reducing its porosity (Wongkeo et al., 2014).
Water absorption coefficients of all mortars are given in Fig. 7. After curing for 28 days, the water absorption coefficient of WOS-10 mortar (13.22 × 10⁻⁴ kg/m2·s0.5) was higher compared with the reference (12.51 × 10⁻⁴ kg/m2·s0.5), and samples with greater crushed WOS content displayed more rapid increases than the reference. This result is probably due to the fact that crushed WOS particle sizes were initially larger than those of the river sand (Table 2), resulting in mortar with higher porosity, which would allow more water to be absorbed into the hardened structure (Neithalath et al., 2010). Increasing the curing period, however, effectively lowered the water absorption coefficient of all mortars tested. After curing for 90 days, the water absorption coefficients of reference, WOS-10, -20, and -30 mortars were 9.27 × 10⁻⁴, 9.68 × 10⁻⁴, 10.06 × 10⁻⁴, and 10.25 × 10⁻⁴ kg/m2·s0.5, respectively (Fig. 7); the difference among them was insignificant.
Water permeability
As shown in Fig. 8, the water permeability coefficients of all mortars rapidly decreased with increasing curing time. Again, this is largely due to the cement hydration reaction process producing a more compact structure that is less permeable to water. As expected, crushed WOS mortars exhibited larger water permeability coefficients than the corresponding reference regardless of curing duration. The water permeability coefficient values of WOS-10, -20, and -30 mortars cured for 28 days were 4.11 × 10⁻¹⁰, 4.99 × 10⁻¹⁰, and 6.04 × 10⁻¹⁰ m/s, respectively, revealing increases of 30.89%, 58.92%, and 92.36%, respectively, over the reference (3.14 × 10⁻¹⁰ m/s) (Fig. 8). Water permeability coefficient values for WOS-10, -20, and -30 mortars cured for 90 days were 2.03 × 10⁻¹⁰, 2.35 × 10⁻¹⁰, and 2.46 × 10⁻¹⁰ m/s, which were 10.93%, 28.42%, and 34.43% higher compared with the reference (1.83 × 10⁻¹⁰ m/s), respectively.
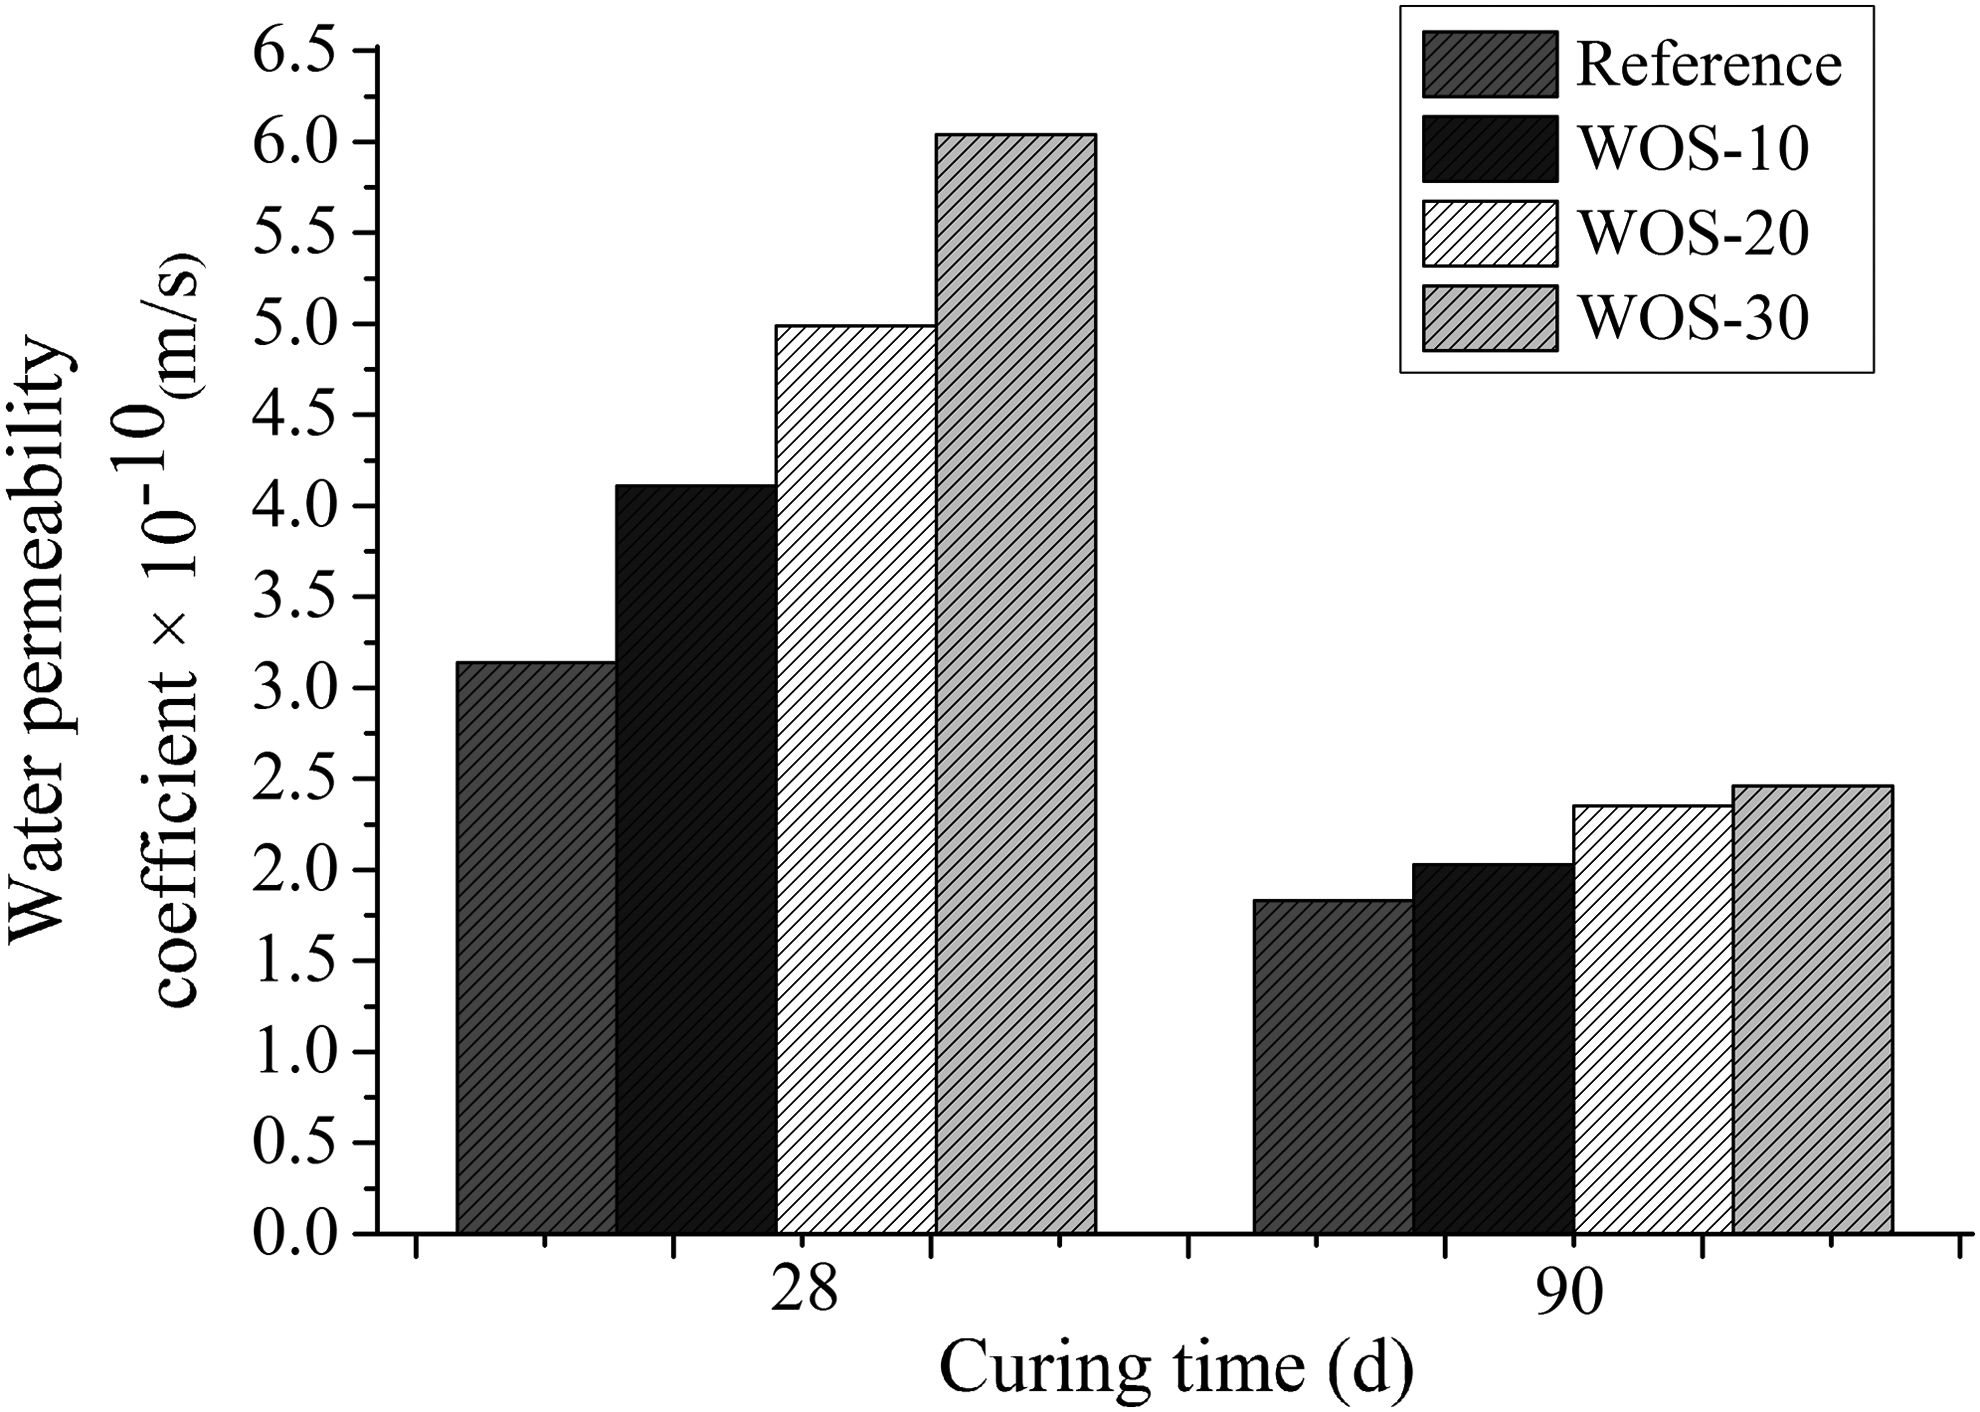
Water permeability coefficients of mortars. Reference, mortar containing only river sand; WOS-10, -20, and -30 mortar samples containing 10%, 20%, and 30% crushed WOSs, respectively.
Chloride ion penetration
Results of chloride ion migration coefficient testing of all mortars are presented in Fig. 9. The chloride ion migration coefficients of reference, WOS-10, -20, and -30 mortars were 1.23 × 10⁻¹¹, 1.46 × 10⁻¹¹, 1.72 × 10⁻¹¹, and 1.95 × 10⁻¹¹ m2/s after curing for 28 days and 0.98 × 10⁻¹¹, 1.04 × 10⁻¹¹, 1.28 × 10⁻¹¹, and 1.43 × 10⁻¹¹ m2/s after curing for 90 days, respectively. These results demonstrate that chloride ion migration coefficients of mortars were closely related to the crushed WOS content and curing period. Inclusion of crushed WOSs in mortar increased the probability of chloride ion migration. For example, the chloride ion migration coefficient of WOS-10 mortar cured for 28 days increased by 18.70% compared with the reference. Furthermore, a longer curing time lowered the chloride ion migration coefficient of crushed WOS mortars. WOS-10 mortar cured for 90 days had the lowest chloride ion migration coefficient of all mortars tested, which was slightly larger than the reference.
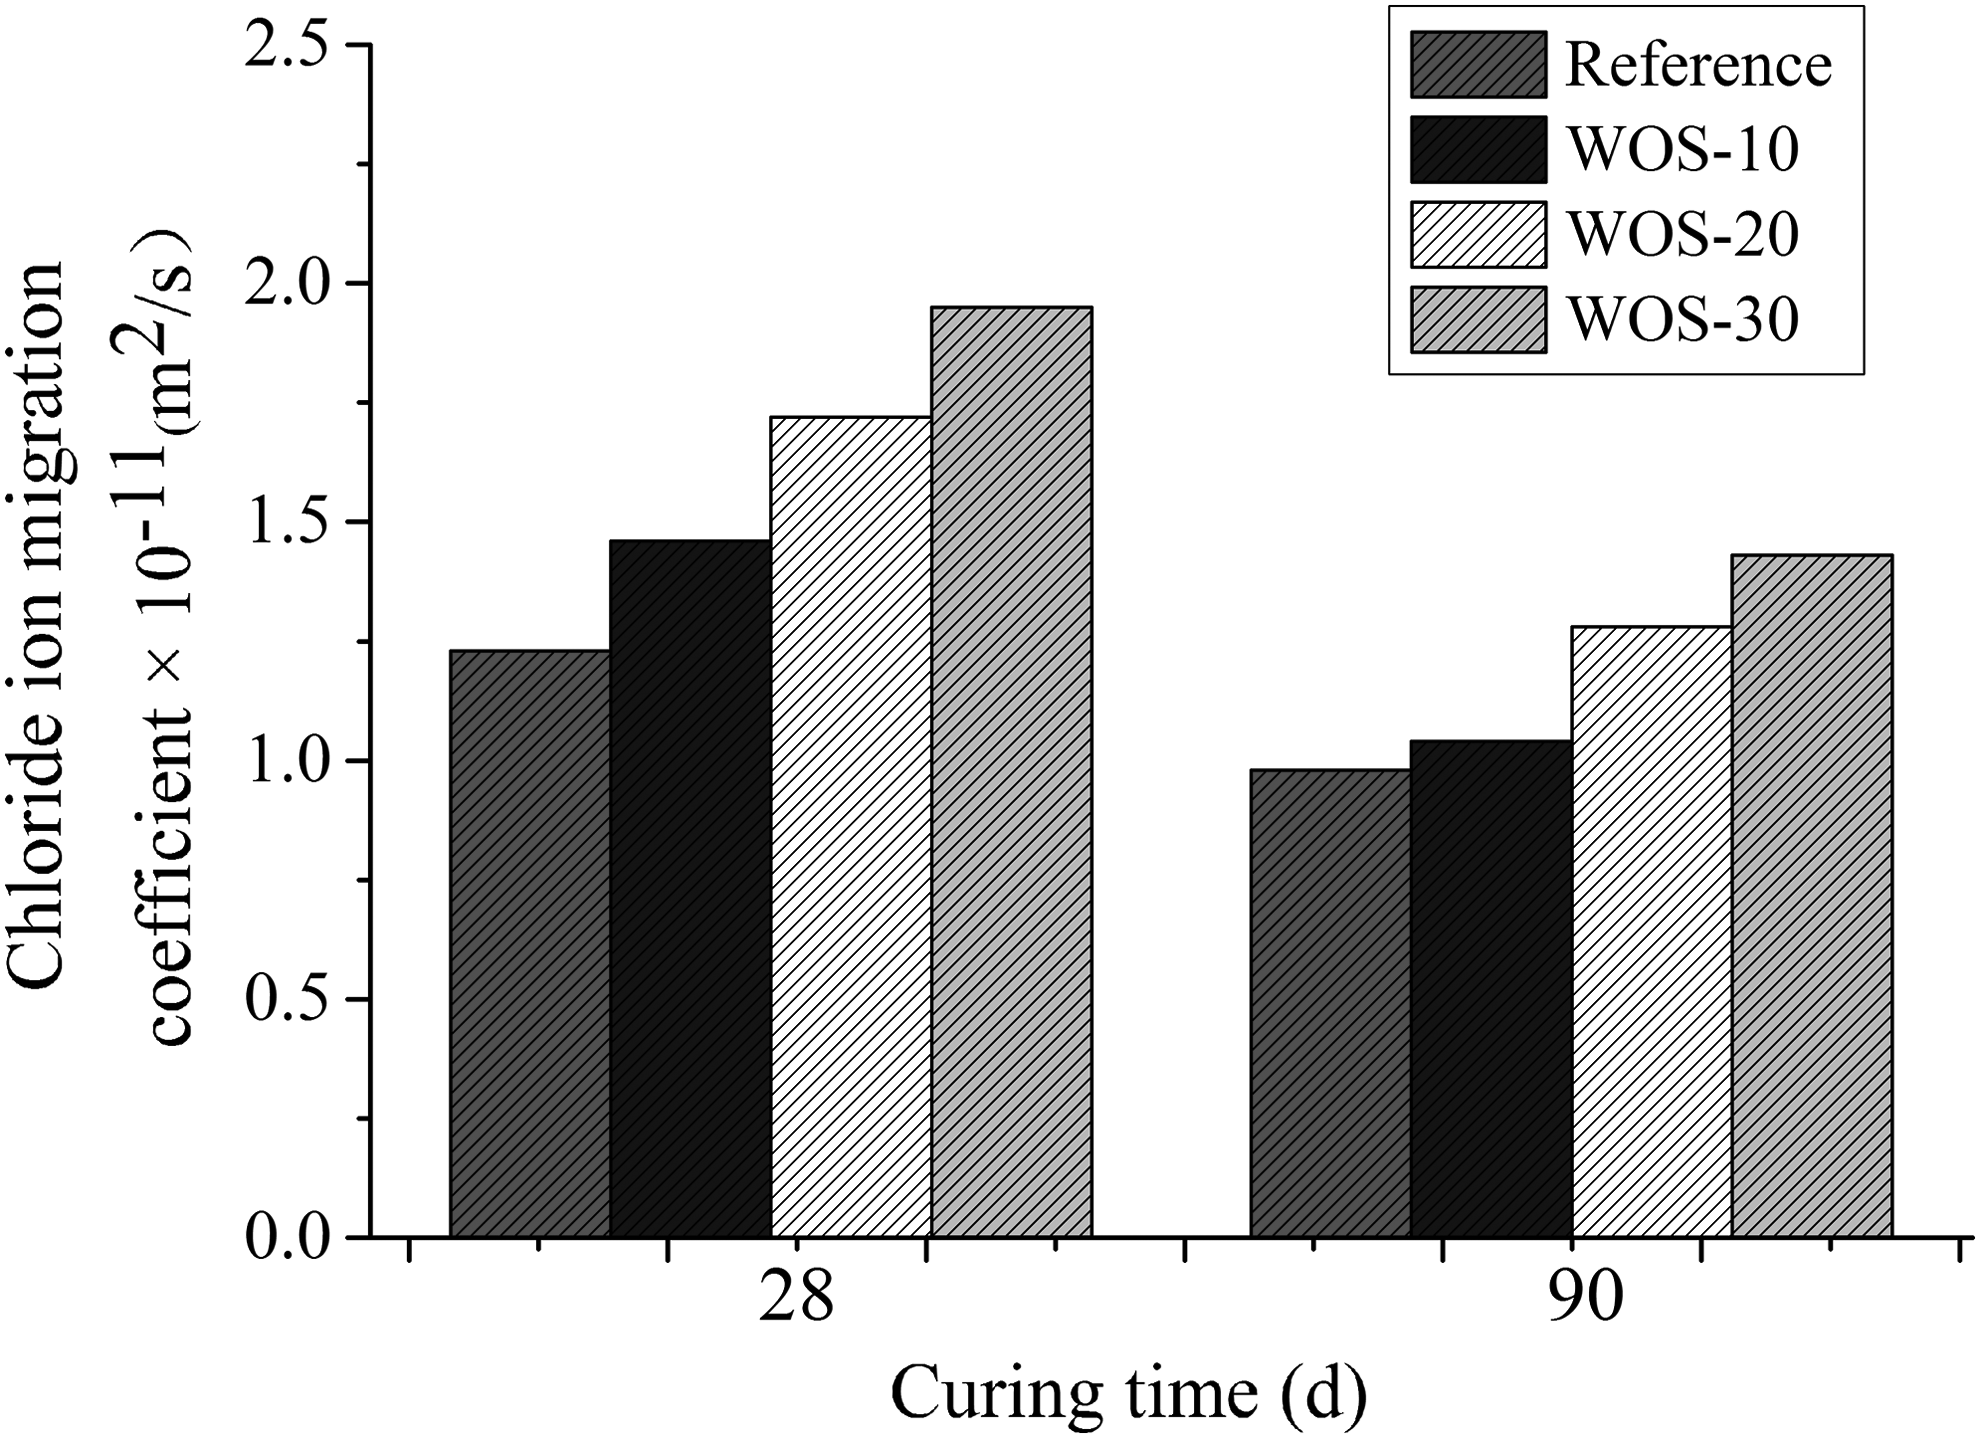
Chloride ion migration coefficients of mortars. Reference, mortar containing only river sand; WOS-10, -20, and -30 mortar samples containing 10%, 20%, and 30% crushed WOSs, respectively.
Cost efficiency
River sand costs are mainly associated with its mining, while the cost of crushed WOSs is largely related to collection and production. However, the cost of each material does not include transportation, placement, and quality control costs in this study. The unit price of mortar materials obtained in the southeast coastal region of China and the cost efficiency of different mortar mixtures are shown in Tables 5 and 6.
Local Unit Costs of Mortar Materials
RMB, Renminbi, Chinese yuan.
Cost Efficiency of Different Mortar Mixtures
Reference, mortar mixture prepared with river sand only; WOS-10, -20, and -30 mortar mixtures prepared with 10%, 20%, and 30% crushed WOSs, respectively.
Table 5 shows the local unit costs of river sand and crushed WOSs as 0.195 and 0.12 RMB/kg, respectively, demonstrating that crushed WOSs were more economical, being about 38.5% cheaper than river sand. Hence, WOS-30 mortar was the most economical mixture and about 5.75% cheaper than the reference mortar (Table 6). Although the cost of materials differs in other countries, the use of crushed WOSs is expected to increase cost efficiency of mortars worldwide. Furthermore, it is important to note that utilization of crushed WOSs in cementitious materials can also improve eco-efficiency since it recycles a large amount of WOSs.
Conclusions
In the present study, crushed WOSs were used to replace river sand as the fine aggregate in cementitious material and the mechanical properties, transport behavior, and cost efficiency of hardened mortars were assessed at different curing durations. Inclusion of crushed WOSs in mortar reduced the hardened density due to the lower saturated surface dry density of crushed WOSs versus river sand and random distribution of crushed WOS particle sizes, which led to a looser mortar structure. Flexural strength, compressive strength, and peak stress decreased with increasing crushed WOS content, indicating that crushed WOSs adversely affect the mechanical properties of mortar. However, all crushed WOS mortar mixtures showed 28-day flexural and compressive strength values >5 and 17.2 MPa, respectively, indicating that they can be used for most building applications. Incorporation of crushed WOSs also increased water absorption, water permeability, and chloride ion migration coefficients, thereby reducing the transport behavior of mortar. This was likely due to random distribution of crushed WOS particle sizes increasing the porosity of mortar, allowing more water and chloride ions to penetrate into the hardened structure. A prolonged curing period can effectively improve the properties of mortars. The main reason is that increased curing time accelerated the cement hydration reaction, and more hydration products filled into voids of the crushed WOS mortar. Importantly, prolonging the curing period effectively improved the properties of all mortars tested, especially crushed WOS mortars, because it allowed generation of more cement hydration reaction products, which filled any voids in the hardened mortar structure. Based on these results, inclusion of up to 30% crushed WOSs in cementitious materials is recommended due to their acceptable engineering-grade strength and economic and environmental benefits.
Footnotes
Acknowledgments
This study was supported by the National Natural Science Foundation of China (No. 51509081), the 111 Project (No. B12032), the Fundamental Research Funds for the Central Universities (No. 2019B61614) and the Postgraduate Research & Practice Innovation Program of Jiangsu Province (No. SJKY19_0508). These are gratefully acknowledged.
Author Disclosure Statement
No competing financial interests exist.