
Abstract
Abstract
Agricultural waste-based activated carbon has been applied to the treatment of antibiotics-loaded wastewater recently. In this article, cornstalk was employed as a raw material to manufacture a kind of granular activated carbon (GAC), which was then used to remove four antibiotics, including isoniazid (IN), sulfamethoxazole (SMZ), thiamphenicol (THI), and doxycycline (DOX), from water. The as-prepared GAC had a rough and porous structure; the surface area and total pore volume were 944.71 m2/g and 0.56 cm3/g, respectively. Kinetic and isothermal models were established to analyze the sorption mechanism and evaluate the sorption performance. Pseudo-second-order kinetic model fitted the sorption of IN, SMZ, THI, and DOX on the GAC better than pseudo-first-order model. Based on the Langmuir isothermal model, the maximum sorption capacities (qm) of the GAC toward IN, SMZ, THI, and DOX were 27.0172, 36.9301, 28.0637, and 32.3902 mg/g, respectively. According to the Weber–Morris intraparticle diffusion model and the Boyd kinetics model, film diffusion was preponderant in the sorption process. Moreover, two-dimensional correlation spectroscopy integrated with Fourier-transform infrared spectroscopy was used to give the sequence of the different functional groups binding to the four antibiotics. To our knowledge, this is the first report on the sorption of IN, SMZ, THI, and DOX by cornstalk-based GAC. This work not only evaluated the application potential of cornstalk in the field of water purification but also provided a technical way for removing IN, SMZ, THI, and DOX from aqueous solution.
Introduction
Antibiotics, capable of eradicating or inhibiting the growth of microorganisms (Takdastan et al., 2016), are extensively used as human and veterinary medicine. Nowadays, China is the largest producer and user of antibiotics in the world based on market sales volume (Zhang et al., 2015a). The total amount of antibiotics used in China reached 162 million kilograms in 2013, approximately nine times of that used in the United States (Zhang et al., 2015b). Antibiotics are released into the aquatic systems through various ways (Takdastan et al., 2016), including pharmaceutical wastewater discharge (Kakavandi et al., 2014), aquaculture application (Moussavi et al., 2013), and agricultural waste disposal (Chen et al., 2015a). Antibiotics are often characterized by high polarity and low volatility, which make them stably exist in water for a relatively long time (Ye and Zhang, 2015), so that they are one of the most detected drugs in the aquatic environment.
After being used by humans and animals, ∼10–90% of the administered antibiotics were excreted as either parent compounds or bioactive metabolites (Li et al., 2017). In some cases, the degradation by-products of antibiotics are even more toxic than the parent compounds. Halling-Sørensen et al. (2002) found that the degradation by-products of tetracycline such as 5a, 6-anhydrochlorotetracycline hydrochloride and 4-epichlorotetracycline hydrochloride resulted in more serious problems to both aerobic bacteria and microalgae than tetracycline itself. Antibiotics are regarded as emerging pollutants (Zhang et al., 2015b) and harmful to humans and other organisms, for example, increasing water toxicity (Jeong et al., 2010), resulting in teratogenic effect on aquatic organisms (Kong and Zhu, 2007), promoting antibiotic resistance in microbes (Belhachemi and Djelaila, 2017), and accessing the human body through food chain or drinking water (He et al., 2016). Since antibiotics pose a great threat to ecological security, how to remove them from the water environment has remained a strong concern.
Until now, several methods have been applied to remove antibiotics from water, including photocatalysis (Kaur et al., 2015), advanced oxidation process (Rodríguez-Alvarez et al., 2013), biodegradation (Koumaki et al., 2017), etc. Recently, sorption technology has attracted more and more attentions as it has the advantages of low cost, simple design and operation, good regenerability, and high removal efficiency compared with other treating methods (Ahmed, 2016). As for the technology of sorption, sorbent plays a key role for processing performance, in which river sediment (Zhang et al., 2011), clay mineral (Li et al., 2010), and different forms of activated carbons (Rivera-Utrilla et al., 2009; Çaliskan and Goktürk, 2010) have been developed and used. Among those sorbents, activated carbon (AC) is most commonly used as it is biologically resistant, and possesses multiple-pore structure, large specific surface area, well-developed interior structure, and various functional groups (hydroxy, carboxyl, amidogen, etc.) on its surface (Kakavandi et al., 2014). Moreover, the raw materials for preparing AC are abundant. Theoretically, all carbon-containing substances can be used for the manufacture of AC, and the outlook of AC can be easily tuned into different shapes, including powder, granular, and fiber.
In this study, the cornstalk was used as the raw material to prepare AC. Corn is a traditional crop, and its planting area in China was ∼3.7 million hectares in 2014 (Dong et al., 2018). Approximately 47,097 million tons of cornstalk are generated each year in China (Zhang and Chen, 2018). However, most of the cornstalk is disposed randomly or burned carelessly, causing a great environmental pollution and a waste of carbon resource. To resolve these problems, the Chinese government encourages scientists to explore various ways to promote the utilization of cornstalk. Since it belongs to a kind of agricultural waste, resource utilization of cornstalks (e.g., the manufacture of cornstalk-based AC) is of great scientific significance. Most importantly, cornstalk-based AC was proved to have an applicable potential for purifying polluted water or air. Liu et al. (2017) reported that ∼95% of sulfadiazine, norfloxacin, metronidazole, and tetracycline were removed from aqueous solution when cornstalk-based AC was used as the sorbent. In this study, we prepared cornstalk-based granular AC (GAC) as it has many advantages, such as stable physicochemical properties, high mechanical strength, easy regeneration, and more convenient separation from the effluent compared with powdered AC. For example, Ahmed and Theydan (2013) observed that >99% removal efficiency of metronidazole was achieved by using seed pods-based GAC.
In this work, four antibiotics, isoniazid (IN), sulfamethoxazole (SMZ), thiamphenicol (THI), and doxycycline (DOX), were selected. Due to the excellent antibacterial effect of the four antibiotics, they are commonly used in China and are randomly discharged into aquatic environment. Currently, SMZ was found in Taihu Lake (Bo and Yu, 2016). THI and DOX were detected in Pearl River (Ye and Zhang, 2015). However, there are few reports on the removal of the four antibiotics from water. To fill the knowledge gap, the cornstalk-based GAC was prepared, and then its sorption performance based on kinetics and isotherm was verified. Fourier-transform infrared spectroscopy (FTIR) was used to analyze the functional groups that the cornstalk-based GAC carried. Two-dimensional correlation spectroscopy (2D-COS) was adopted to analyze the FTIR spectra to determine which functional group took part in the sorption process and sequence the binding affinity of the functional groups (Chen et al., 2015b) for IN, SMZ, THI, and DOX. The novelty of this article is that the sorption mechanism was revealed from the viewpoint of binding interaction between the cornstalk-based GAC and the four antibiotics. The binding affinity of the functional groups that GAC carried for the four antibiotics was sequenced.
Materials and Methods
Chemicals
IN, SMZ, THI, and DOX with purities of ≥98% were provided by J&K Scientific Ltd. (Beijing, China). Table 1 shows their chemical structures and physicochemical properties. N,N-Dimethylformamide (DMF), HCl, NaOH, and HF with purities of ≥99% were bought from Sigma-Aldrich (Shanghai, China). Ultrapure water was prepared by an ultrapure water machine (UPT-11-10T; Sichuan, China).
Chemical Structures and Physicochemical Properties of Four Antibiotics
DOX, doxycycline; IN, isoniazid; SMZ, sulfamethoxazole; THI, thiamphenicol.
Preparation of GAC
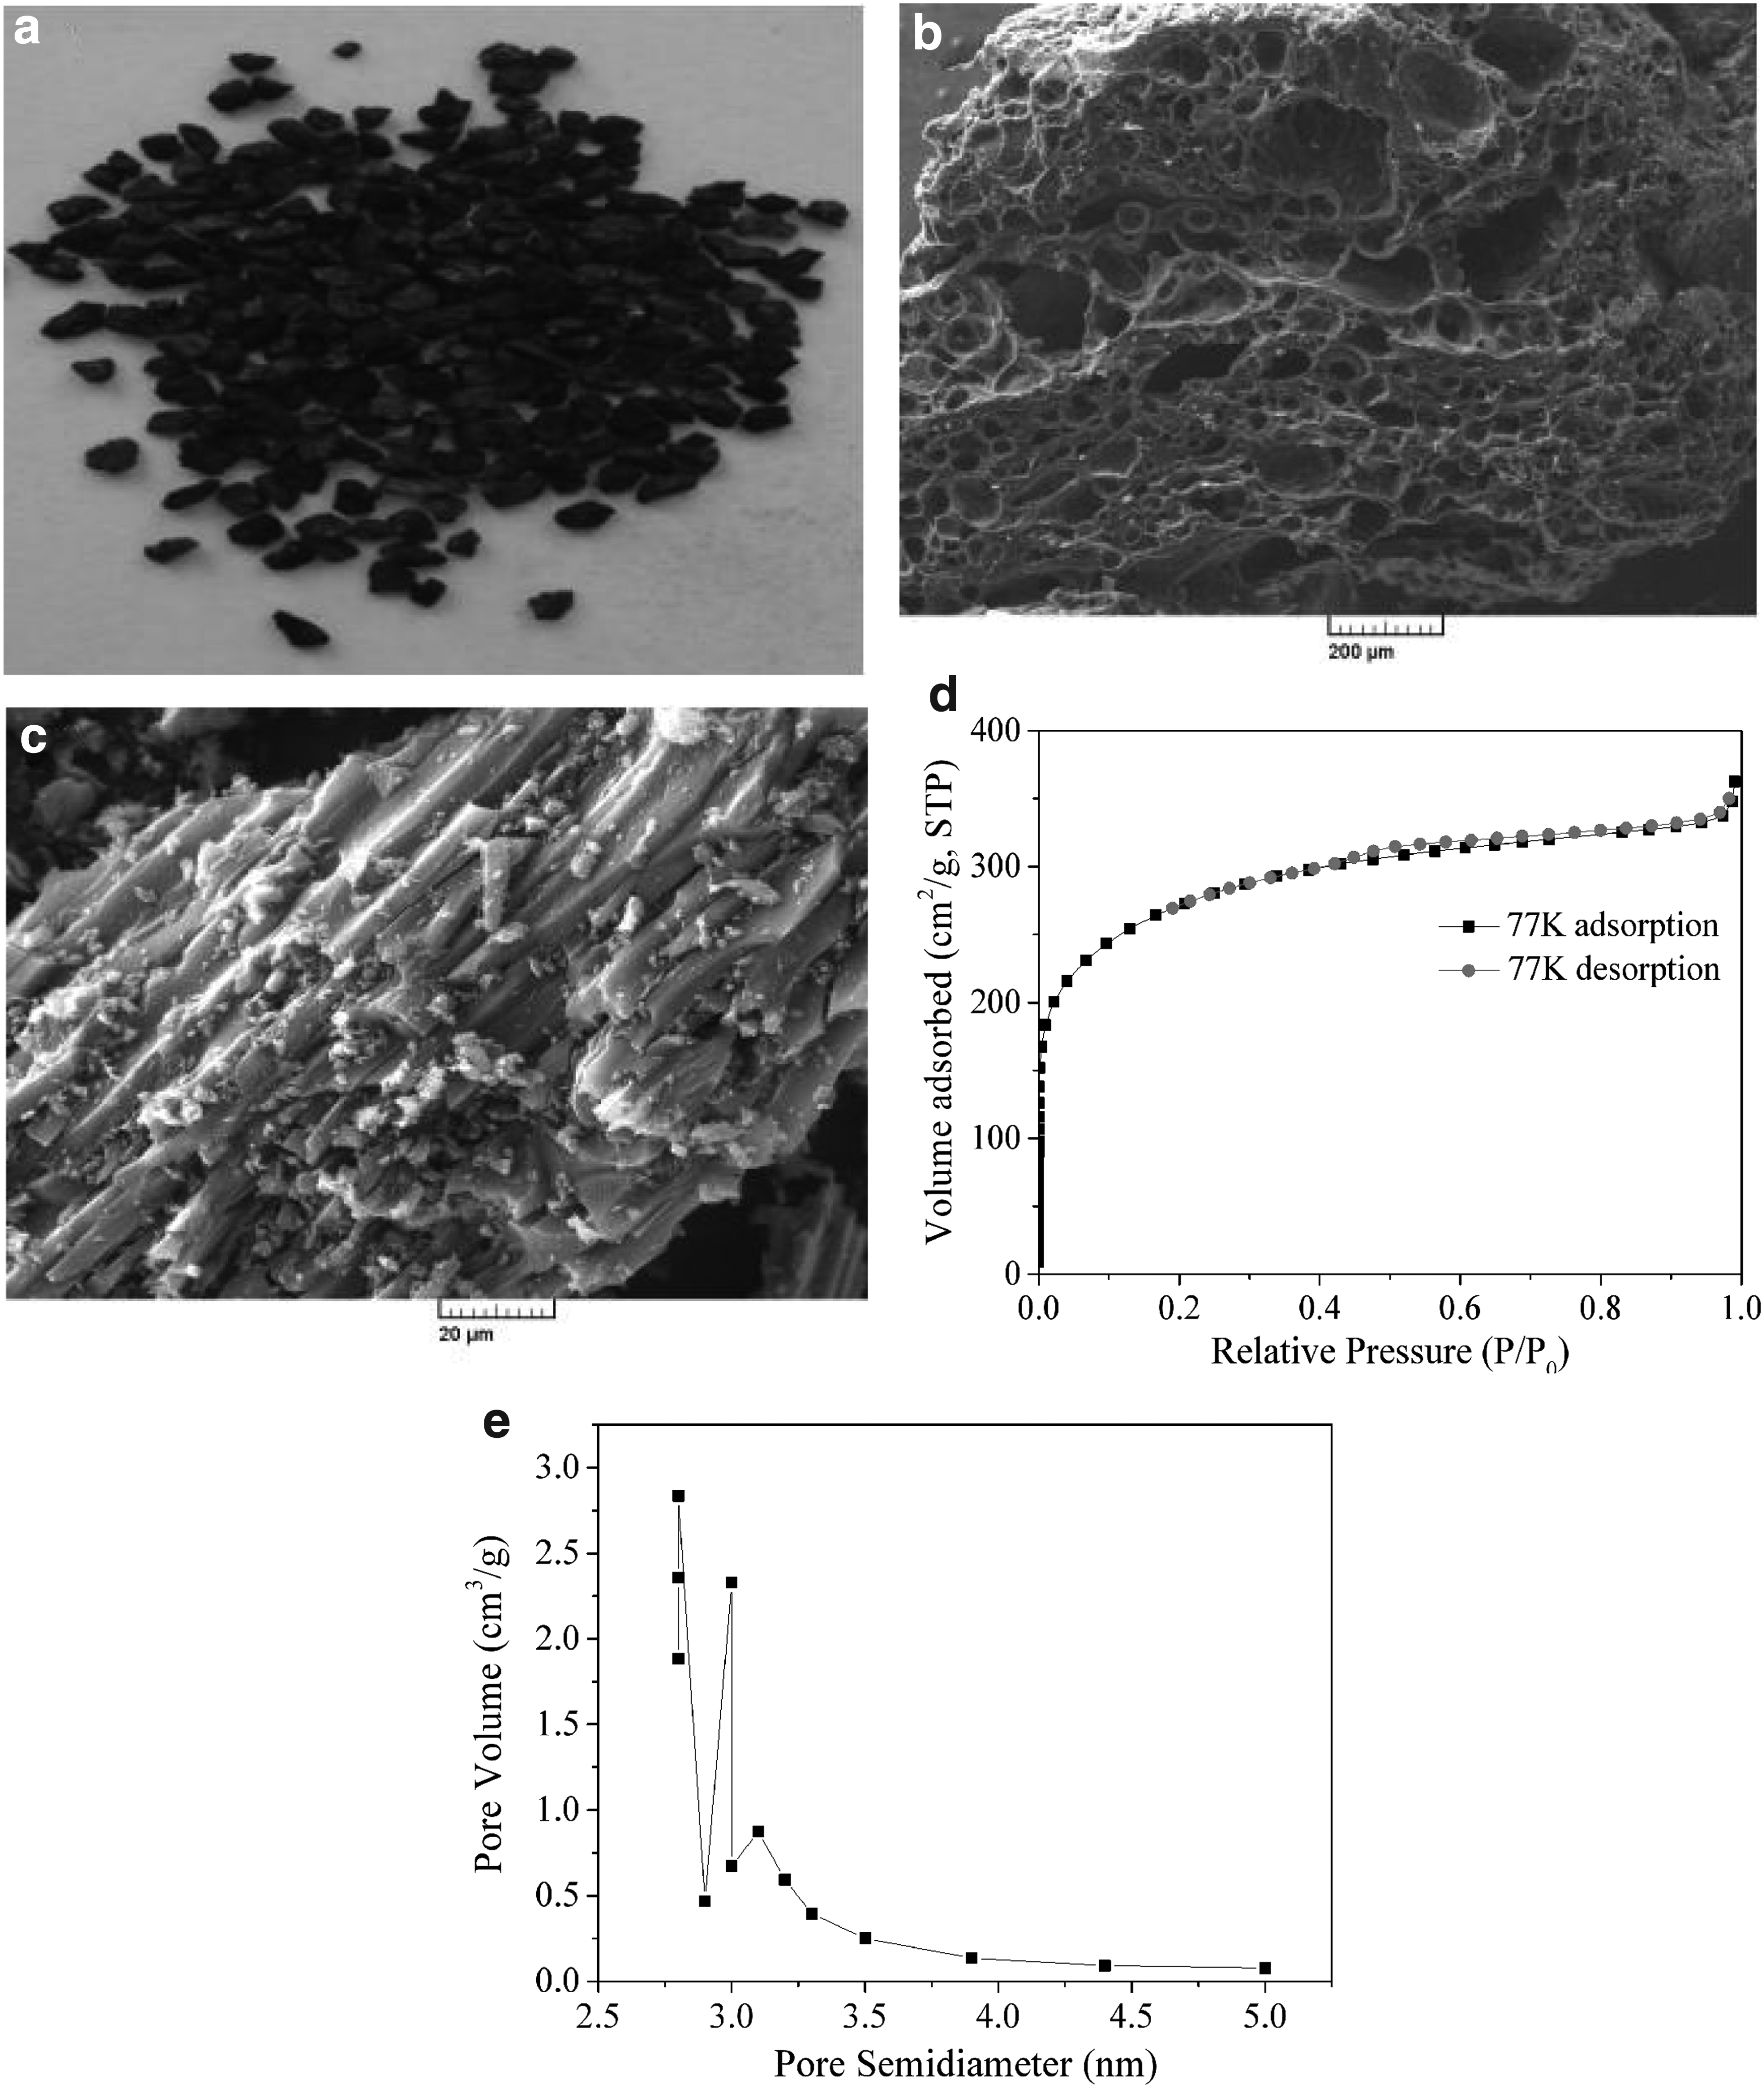
GAC was prepared from the cornstalk collected from Shaanxi Agricultural Technology Company (Xi'an, China). After air drying for 1 month, the cornstalk was cut into small pieces of ∼5 cm in length and put into an electric box resistance furnace (LNB4-13Y; Haozhuang Co. Ltd., Shanghai, China) under nitrogen atmosphere, in which the pieces of cornstalk were heated at 500°C for 2 h and then 700°C for 2 h. Physical activated treatment was done in an activation furnace (HHL-1; Huatong Co. Ltd., Henan, China) by using high-temperature superheated steam (600°C, 2.0 MPa) for 2 h to obtain the AC. The AC was washed with 1.0 M HCl-HF (1:1, vol/vol) solution three times and ultrapure water several times until the pH value reached 7.0. After washing, the AC was dried at 100°C for 15 h, and then pulverized and passed through a nylon mesh opening of 5.0 mm. Finally, the morphology of the AC was granular. The synthetic steps of GAC are shown in Fig. 1. Figure 2a shows the outlook of the as-prepared GAC with an average length of 1–2 mm and diameter of 1 mm.

Synthesis of cornstalk-based granular AC. AC, activated carbon.
Sorption experiments
The stock solution of IN was prepared by placing 1.000 g IN into 100 mL ultrapure water, and then transferring into a 1-L measuring flask. The final concentration of IN stock solution was 1.000 g/L. The DOX stock solution was obtained in the same way, and its final concentration was also 1.000 g/L. The stock solution of SMZ was prepared by dissolving 1.000 g of SMZ into 10 mL HCl. After dissolving, 1 mL of SMZ solution was transferred into a 1-L measuring flask in which the pH was adjusted to 7.00. The final concentration of SMZ stock solution was 0.100 g/L. Steps for the preparation of THI stock solution were the same as those observed for SMZ, except that DMF was used as a solvent. The testing solutions with different concentrations were obtained by diluting the stock solution with ultrapure water. As for the SMZ testing solution and the THI testing solution, the volume of HCl and DMF in it was <0.22 vol% to avoid cosolvent effect.
To investigate the sorption of IN onto the as-prepared GAC, batch experiments were carried out by using a 100-mL beaker containing 0.3600 g GAC and 60 mL IN testing solution with different initial concentrations. All the beakers were put into a thermostatic reciprocating shaker (CHA-S, Changzhou) agitated at 150 r/min and 25°C in dark. The sample was withdrawn by a 5-mL syringe from one beaker after shaking for 5 min, centrifuged (H-1650; Xiangyi) at 3,000 rpm for 5 min under 25°C, and passed through a 0.45-μm filter. The filtrate and the filter residue were collected for the analysis of IN concentration and the GAC-IN complex, respectively. Once the sampling was finished, the beaker was discarded. The sampling times were 5, 10, 15, 20, 30, 40, 50, 60, 80, and 100 min. Control and blank experiments were conducted. For control, 60 mL of IN testing solution with different concentrations without GAC was placed into a 100-mL flask. For blank experiments, 0.3600 g GAC with 60 mL water was placed into a 100-mL flask with ultrapure water. Control and blank experiments were operated under the identical conditions as described above. The objective of control was to investigate if other losses of antibiotics existed besides sorption on GAC such as evaporation. The objective of blank was to investigate besides sorption on GAC if there exited other factors that would interfere with the analysis of antibiotics concentration; that is, during the shaking process some unknown substances derived from GAC may be discharged into the solution. All experiments were performed in tripartite, and the mean value was reported. The same steps were carried out to investigate the sorption of SMZ, THI, and DOX on GAC, respectively.
Effects of GAC dosage, temperature, and pH
To evaluate the effects of GAC dosage, temperature, and pH on the sorption of IN by the prepared GAC, tests were conducted in a 100-mL beaker containing 60 mL IN testing solution of 20 mg/L. For GAC dosage, the amount of GAC ranged from 1.5 to 7.5 g/L, while the temperature was fixed at 25°C and pH of 7.00. For temperature effect, temperature changed between 15°C and 55°C, while the amount of GAC and the pH of solution were 6 g/L and 7.00, respectively. As for the effect of pH, its value varied from 3.00 to 11.00; the amount of GAC and the temperature were 6.0 g/L and 25°C, respectively. The same method was used to study how the three factors affected the sorption of SMZ, THI, and DOX on GAC, respectively. For all experiments, the shaking velocity was 150 r/min, and the sampling time was 100 min.
Analytical methods
The as-prepared GAC was characterized by a scanning electron microscope (TM-1000; Hitachi, Japan) to survey detailed surface morphology and microstructure. The point of zero surface charge (pHPZC) of the GAC was determined by using a Zeta-sizer Nano-ZS (Malvern, United Kingdom). The specific surface area and pore size distribution of the GAC were analyzed by physisorption analyzer (ASAP-2020; Micromeritics), operated at 77 K after the GAC sample was degassed at 200°C for 5 h. The specific surface area was calculated by the Brunauer–Emmett–Teller (BET) method, and the pore size distribution was counted by the Barrett–Joyner–Halenda (BJH) method. The residual concentrations of IN, SMZ, THI, and DOX in solution were measured by a UV-Visible spectrophotometer (SP-1915; Spectrum, Shanghai, China), in which the detection wavelengths corresponding to IN, SMZ, THI, and DOX were 262, 268, 225, and 270 nm, respectively. The standard curves of four antibiotics are presented in Supplementary Fig. S1 (Supplementary Data).
The GAC was grounded into powder, and then measured with KBr by a Fourier-transform infrared spectrometer (FTIR-650; Guangdong, China). As for the GAC–antibiotics complexes, they were dried in a vacuum drier at room temperature, and then mixed with KBr for FTIR analysis. The FTIR spectra were obtained after 32 scans with 4 cm−1 resolution. 2D-COS integrated with FTIR spectra was used to study the sorption mechanism of the four antibiotics on the GAC. The spectra of each sample should subtract the background signal (GAC with ultrapure water, as seen in the blank experiments of Sorption Experiments section) for 2D-COS analysis. Later, the 2D-Shige software (Kwansei-Gakuin University, Japan) was used to transform the data into a new spectral matrix for generating 2D-COS synchronous and asynchronous correlation spectroscopy maps. The mathematical forms of the 2D-COS (Chen et al., 2015b) are presented in Supplementary Data.
The sorption capacity of antibiotics onto GAC was obtained through the following equation:
where C0 is the initial concentration of the sorbate (mg/L) in the solution and C is the residual concentration (mg/L) after sorption experiments; V (L) is the volume of the solution; and M (g) is the mass of GAC.
Langmuir and Freundlich isothermal models were presented as follows:
where Ce (mg/L) is the residual concentration of sorbate at equilibrium; qe (mg/g) is the uptake of sorbate on per unit mass of sorbent; qm (mg/g) is the maximum sorption capacity; and KL (L/mg) is the Langmuir constant. KF (mg/L(1−1/n)·g) and 1/n are constants of the Freundlich model representing sorption capacity and heterogeneity factor, respectively.
Results and Discussion
Characterization of the GAC
As shown in Fig. 2b, the as-prepared GAC showed a porous structure with different sizes of pores, including macropores, mesopores, and micropores. These pores can act as channels for the sorbate to reach the interior and exterior surfaces of GAC. Figure 2c shows that the exterior surface of GAC was layered and rough, which contributed to increasing the specific surface area of GAC.
As presented in Fig. 2d, the pattern of N2 sorption/desorption isotherms belonged to type I. The adsorbed volume increased sharply at low pressure (P/P0 < 0.1), indicating that the GAC possessed micropores. The hysteresis loop closed at pressure of P/P0 = 0.2, suggesting the existence of mesopores. The pore size distribution curve (Fig. 2e) also verified the appearance of mesopores on the surface of GAC according to the two peaks at 2.5 and 3.0 nm. The total pore volume and micropore volume were calculated to be 0.5639 and 0.4245 cm3/g based on the BJH method, respectively. BET specific surface area was 944.708 m2/g. In conclusion, the GAC owned a relatively high surface area and large pore volume, which might be beneficial for antibiotic molecules transferring from water to the GAC surface.
Influence of GAC dosages, temperature, and pH
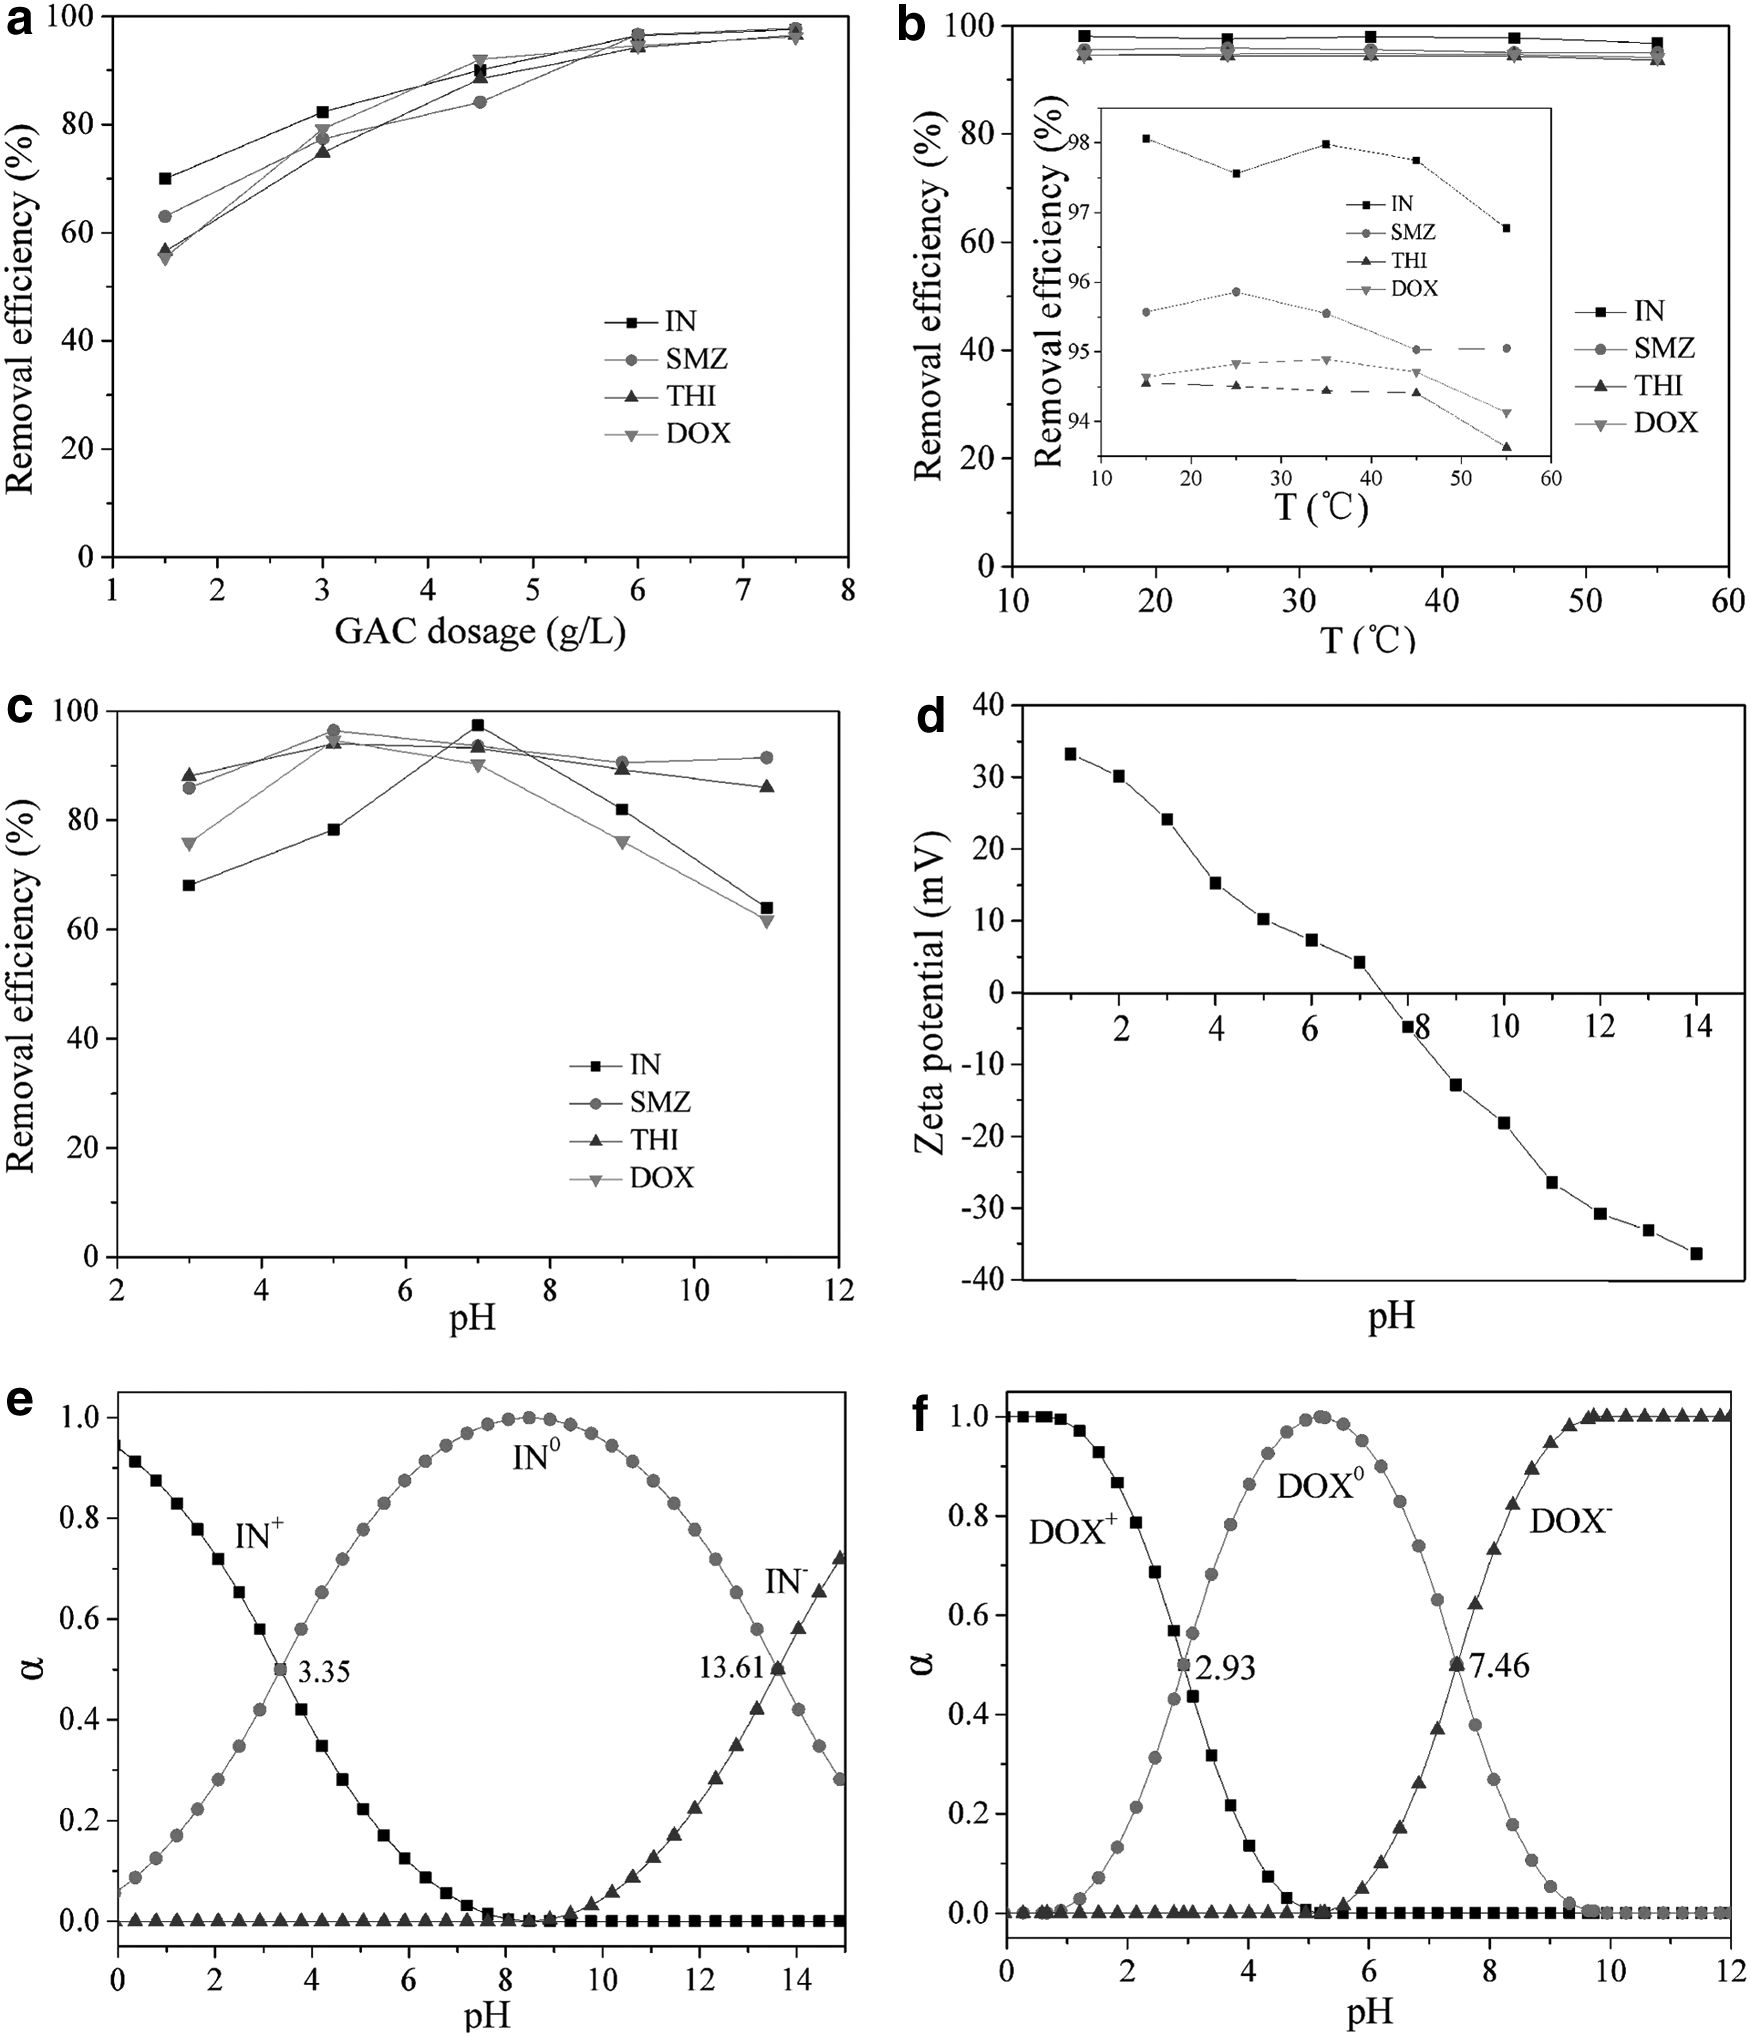
When the GAC dosage increased from 1.5 to 6.0 g/L, the removal efficiencies for the four antibiotics increased remarkably and then slightly from 6.0 to 7.5 g/L (Fig. 3a). A possible reason was that with an increase in the GAC dosage, the sorbent surface area, the number of sorption sites, and contact area also increased. In this study, considering the removal efficiencies and economic benefits, a GAC dosage of 6.0 g/L was selected as an optimum dosage.
Effects of
The removal efficiencies of the four antibiotics against temperature are plotted in Fig. 3b. It can be seen that the temperature had little effect on the removal efficiencies of the four antibiotics. From 15°C to 55°C, the removal efficiencies of the four antibiotics were all >90%. It suggested that the four tested antibiotics can be effectively removed by the prepared GAC at a wide temperature range.
Figure 3c shows the effect of pH on the sorption of four antibiotics by GAC. As for IN, when the solution pH increased from 3.0 to 7.0, the removal efficiency also increased from 68.05% to 97.45% and then decreased from 97.45% to 63.95% at pH of 7.0–11.0. From Fig. 3e, it is observed that IN was positively charged at a solution pH <3.35, and negatively charged at a solution pH >13.61. In addition, IN was neutral at a solution pH of 3.35–13.61. The pHPZC for the GAC was measured at 7.58 (Fig. 3d), meaning that GAC was positively or negatively charged when solution pH was lower or higher than 7.58. When the solution pH varied from 3.0 to 7.0, the surface of GAC carried positive charge. As for IN, its neutral species increase and simultaneously positive species decrease at a pH range of 3.0–7.0. It can be concluded that van der Waals force would overwhelm electrostatic repulsion. Therefore, the removal efficiency of IN presented an increasing trend at a pH range of 3.0–7.0. When the solution pH varied from 7.0 to 11.0, GAC was negatively charged. However, for IN its neutral species decrease and simultaneously negative species increase. It can be deduced that electrostatic repulsion would overwhelm van der Waals force, and consequently the removal efficiency of IN decreased.
As for DOX, the removal efficiency increased from 75.91% to 94.69% when the solution pH increased from 3.0 to 5.0, and then decreased from 94.69% to 61.77% when the solution pH increased from 5.0 to 11.0. A possible reason was that at a pH range of 3.0–5.0, the surface of GAC carried positive charges (Fig. 3d), and the neutral species of DOX overwhelmed its positive species based on Fig. 3f. It can be concluded that van der Waals force would exceed electrostatic repulsion. Therefore, the removal efficiency of DOX increased. When the solution pH changed from 5.0 to 7.0, the surface of GAC was positively charged (Fig. 3d). However, the neutral species of DOX began to decrease and its negative species began to increase, suggesting that van der Waals force declined and the electrostatic attraction raised. At such a pH range both electrostatic attraction and van der Waals force might contribute to the sorption, which can explain why the removal efficiency of DOX decreased slightly at a pH of 5.0–7.0. When the solution pH varied from 7.0 to 11.0, GAC was negatively charged and the negative species of DOX overwhelmed neutral species, so that electrostatic repulsion resulted in a sharp decrease in the removal efficiency. As for SMZ and THI, the plots of removal efficiency versus pH presented a similar trend to that of DOX. Their speciation under different pH values is shown in Supplementary Fig. S2 (Supplementary Data).
In summary, the optimal operation conditions for the follow-up experiments were determined as follows: solution pH 7.0, GAC dosage = 6.0 g/L, and temperature = 25°C. It was noted here that 25°C was selected as it is close to the ambient temperature and the removal efficiency of the four antibiotics within the temperature range from 25°C to 55°C showed no big difference.
Determination of the sorption equilibrium time
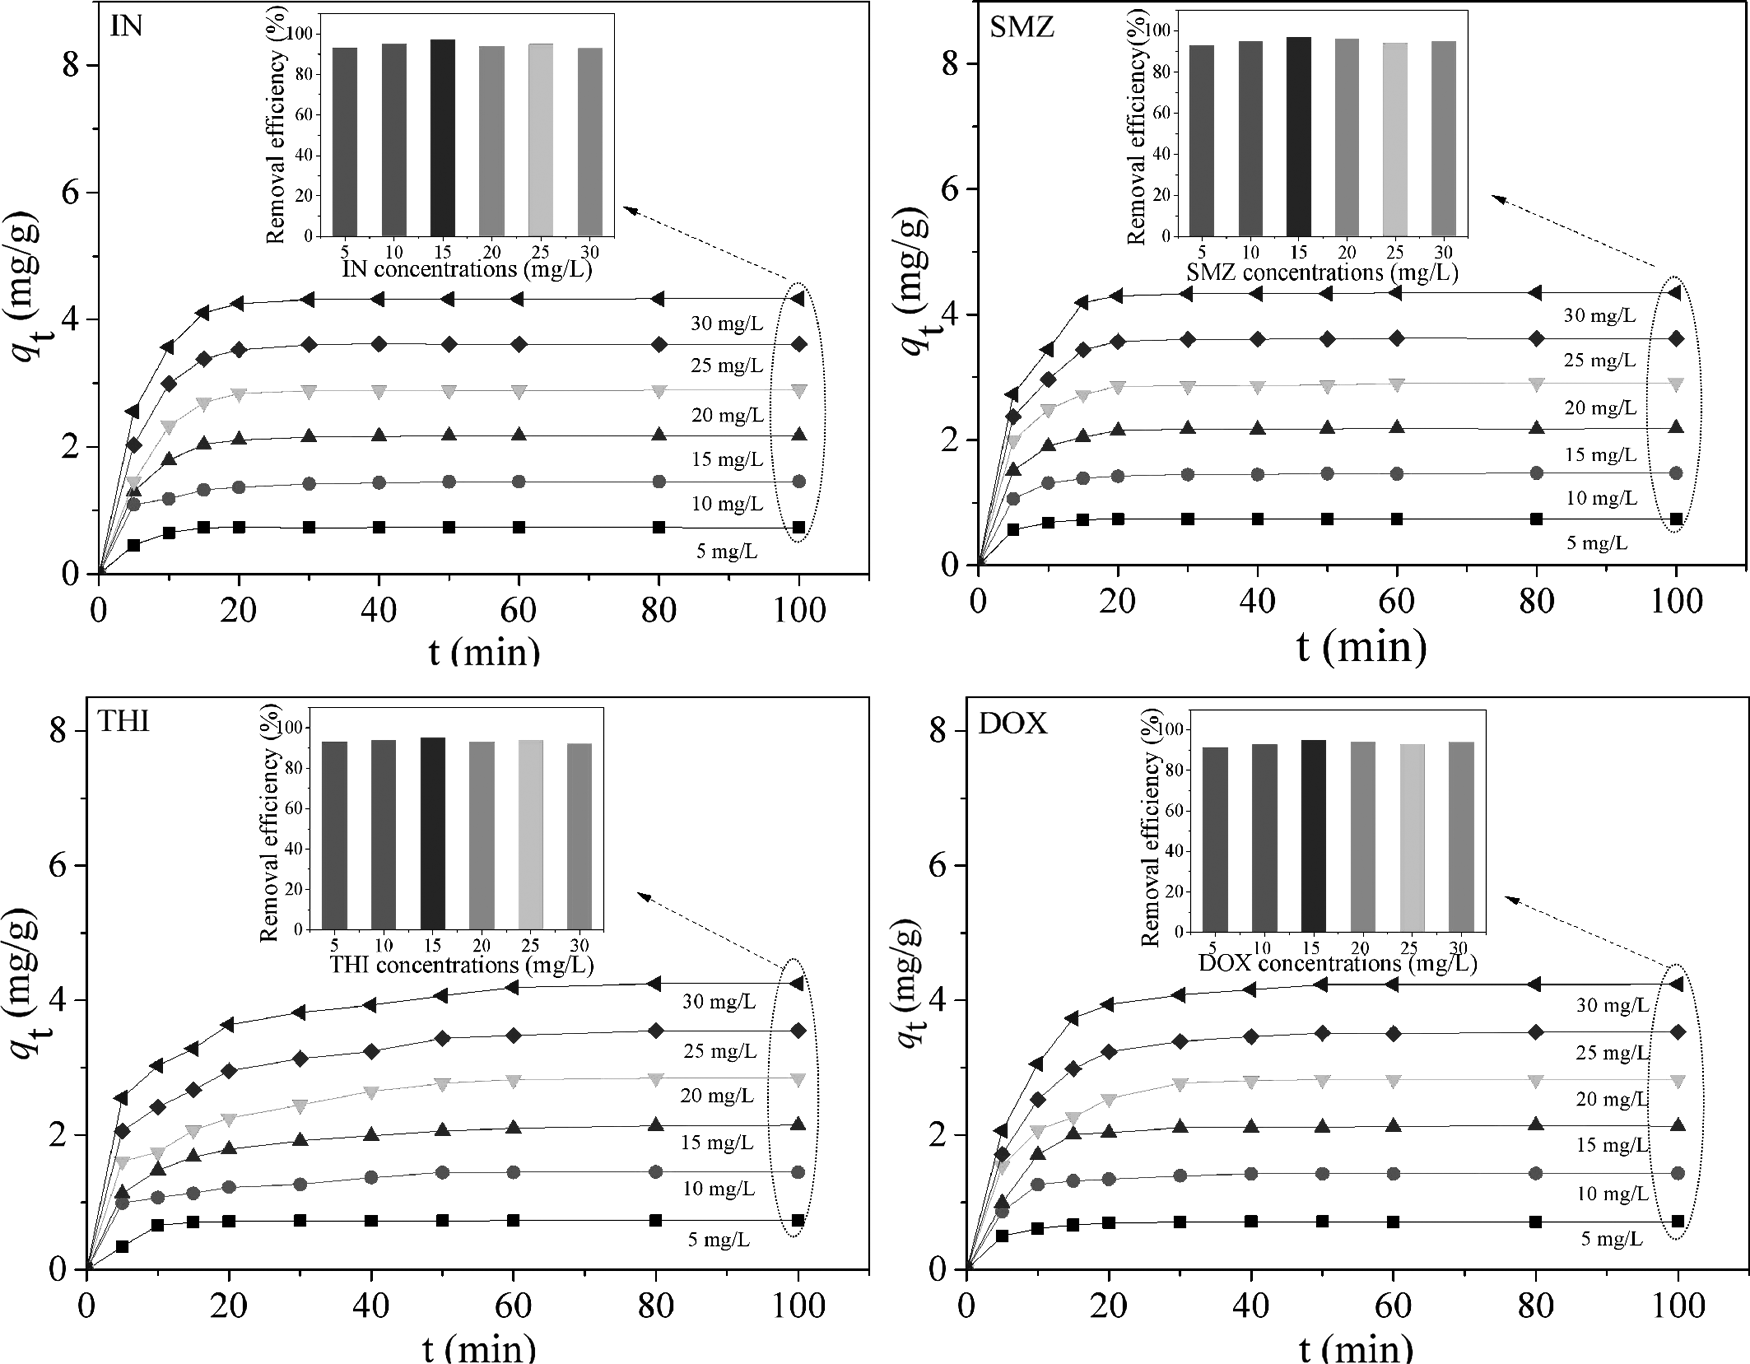
Sorption amounts (qt) of the four antibiotics at different initial concentrations against contact time (t) and the corresponding removal efficiency for each initial concentration are plotted in Fig. 4. It was observed that the values of qt for IN increased rapidly within the first 30 min and then slightly from 30 to 100 min. The rapid sorption at the initial contact time can be attributed to the availability of abundant active sites on the surface of GAC. As contact time was prolonged, the sorption sites became less and less, and sorption capacity of GAC gradually became saturated. The sorption curves of SMZ presented the same trend as IN. As for THI and DOX, slight increase in qt was observed after 60 min. According to Fig. 4, all the equilibrium times for the four antibiotics were set at 100 min, and all the equilibrium times were independent of the different initial concentrations. No decreasing trend for the four antibiotic concentrations in individual controls was found, which indicated only sorption processes during the batch sorption experiments.
Effect of contact time on the sorption of the four antibiotics by GAC at 25°C.
Sorption kinetics
The pseudo-first-order and pseudo-second-order kinetic models were applied to analyze all the data shown in Fig. 4, and the linearized forms of the two models are given in Supplementary Fig. S3 (Supplementary Data). The calculated kinetic parameters are listed in Table 2. Based on R2 and
Parameters of the Pseudo-First-Order and Pseudo-Second-Order Kinetic Models for Sorption of the Four Antibiotics onto Granular Activated Carbon at 25°C
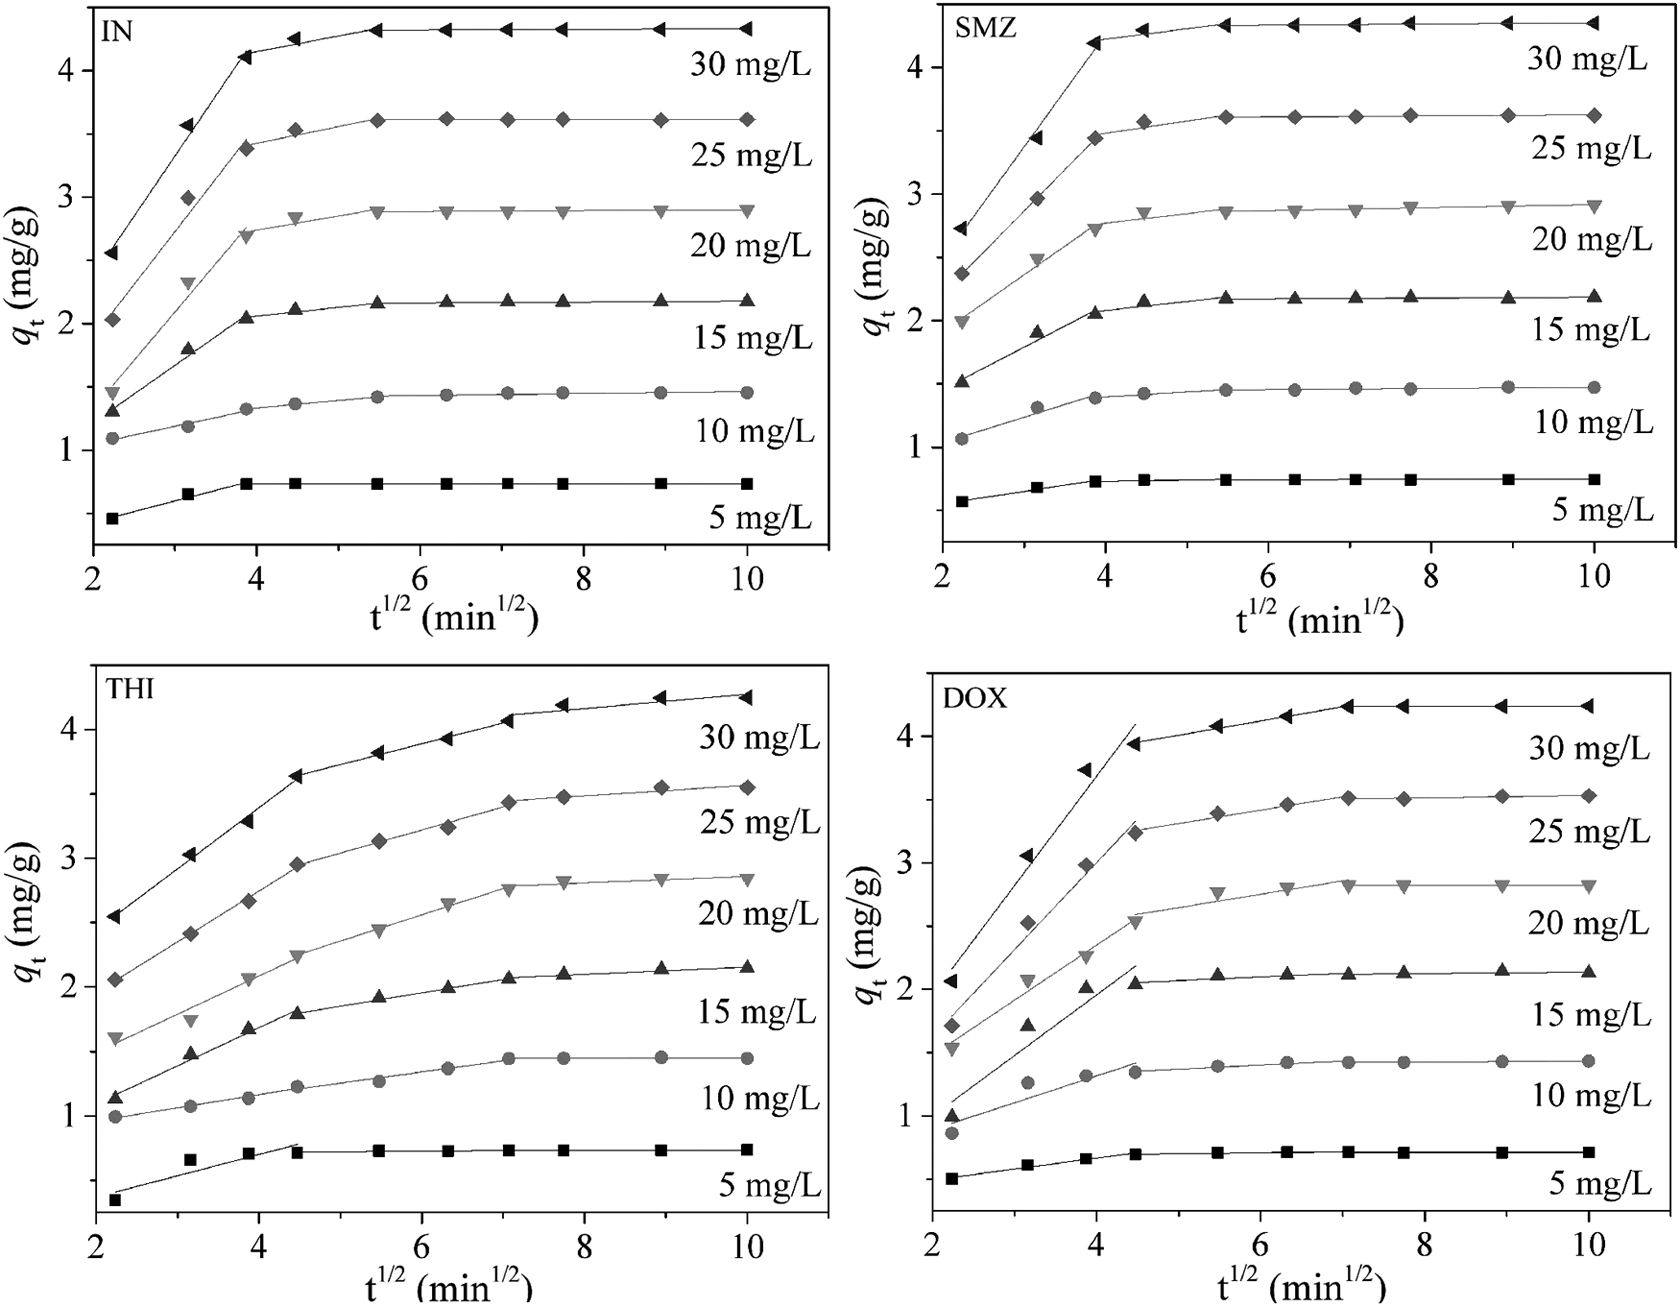
To better know the sorption mechanism, it is necessary to investigate the rate-controlling step. The Weber–Morris intraparticle diffusion model (Supplementary Data) was used. It is widely assumed that the sorption process involves three continuous steps: (1) transport of the sorbate molecules from aqueous solution to the sorbent exterior surface through boundary layer diffusion; (2) intraparticle diffusion of the sorbate molecules transferred into the sorbent pores; and (3) sorption of the sorbate molecules onto the interior surfaces of the pores and capillary spaces of the sorbent (Tang et al., 2012). According to the Weber–Morris intraparticle diffusion model, the overall sorption rate is dominated by the slowest step, which would be either film condensation diffusion or intraparticle diffusion or both as the third step is very rapid and considered to be negligible (Tang et al., 2012). Figure 5 shows the plots of qt versus t1/2 at different initial concentrations. It was found that all the fitted curves were divided into three different linear segments. The first segment presented a fast sorption at the time from 0 to 15 min for IN and SMZ (0–20 min for THI and DOX), the second segment lies in the range from 15 to 30 min for IN and SMZ (20–50 min for THI and DOX), and the last segment from 30 to 100 min for IN and SMZ (50–100 min for THI and DOX). The rate constants and intercept values are exhibited in Supplementary Table S1 (Supplementary Data). It can be seen that the intraparticle diffusion rate constant decreased (Kid1 > Kid2 > Kid3) as the contact time was prolonged, indicating the slow down of intraparticle diffusion (Tang et al., 2012).
Simulated plots of Weber–Morris intraparticle diffusion model for sorption of the four antibiotics on GAC at 25°C.
According to the Weber–Morris intraparticle diffusion model, the plot should produce a straight line and pass through the origin (I1 = 0) if intraparticle diffusion is the rate-controlling step (Chen et al., 2010). For IN, the values of I1 ranged from −0.1999 to 0.7731 (i.e., the values of I1 were not equal to 0), which meant that all the straight lines did not pass the origin. Thus, it can be concluded that the sorption was controlled by boundary layer and intraparticle diffusion; that is, intraparticle diffusion was not the only rate-controlling step (Sayğılı and Güzel, 2016). The same phenomena were also found for SMZ, THI, and DOX.
To further confirm the real control step of the sorption process, Boyd's film diffusion model (Supplementary Data), which assumes that the boundary layer surrounding the sorbent particle is the main resistance to diffusion, was utilized (Tang et al., 2012). On the basis of Boyd's film diffusion model, if the plot of Bt against t is linear and through the origin, it suggests that intraparticle diffusion controls the mass transfer process. When the plot is nonlinear or linear but does not go through the origin, it means that the sorption rate is dominated by film diffusion (Tang et al., 2012). Figure 6 shows the Boyd fitted curves for IN and SMZ in the first 15 min (20 min for THI and DOX). It was observed that all the experiment data were well conformed to this model, and the calculated parameters are displayed in Supplementary Table S2 (Supplementary Data). Obviously, all the intercepts of the plots were far away from the origin, demonstrating that the rate-controlling step for the four antibiotics on the GAC was boundary layer diffusion.
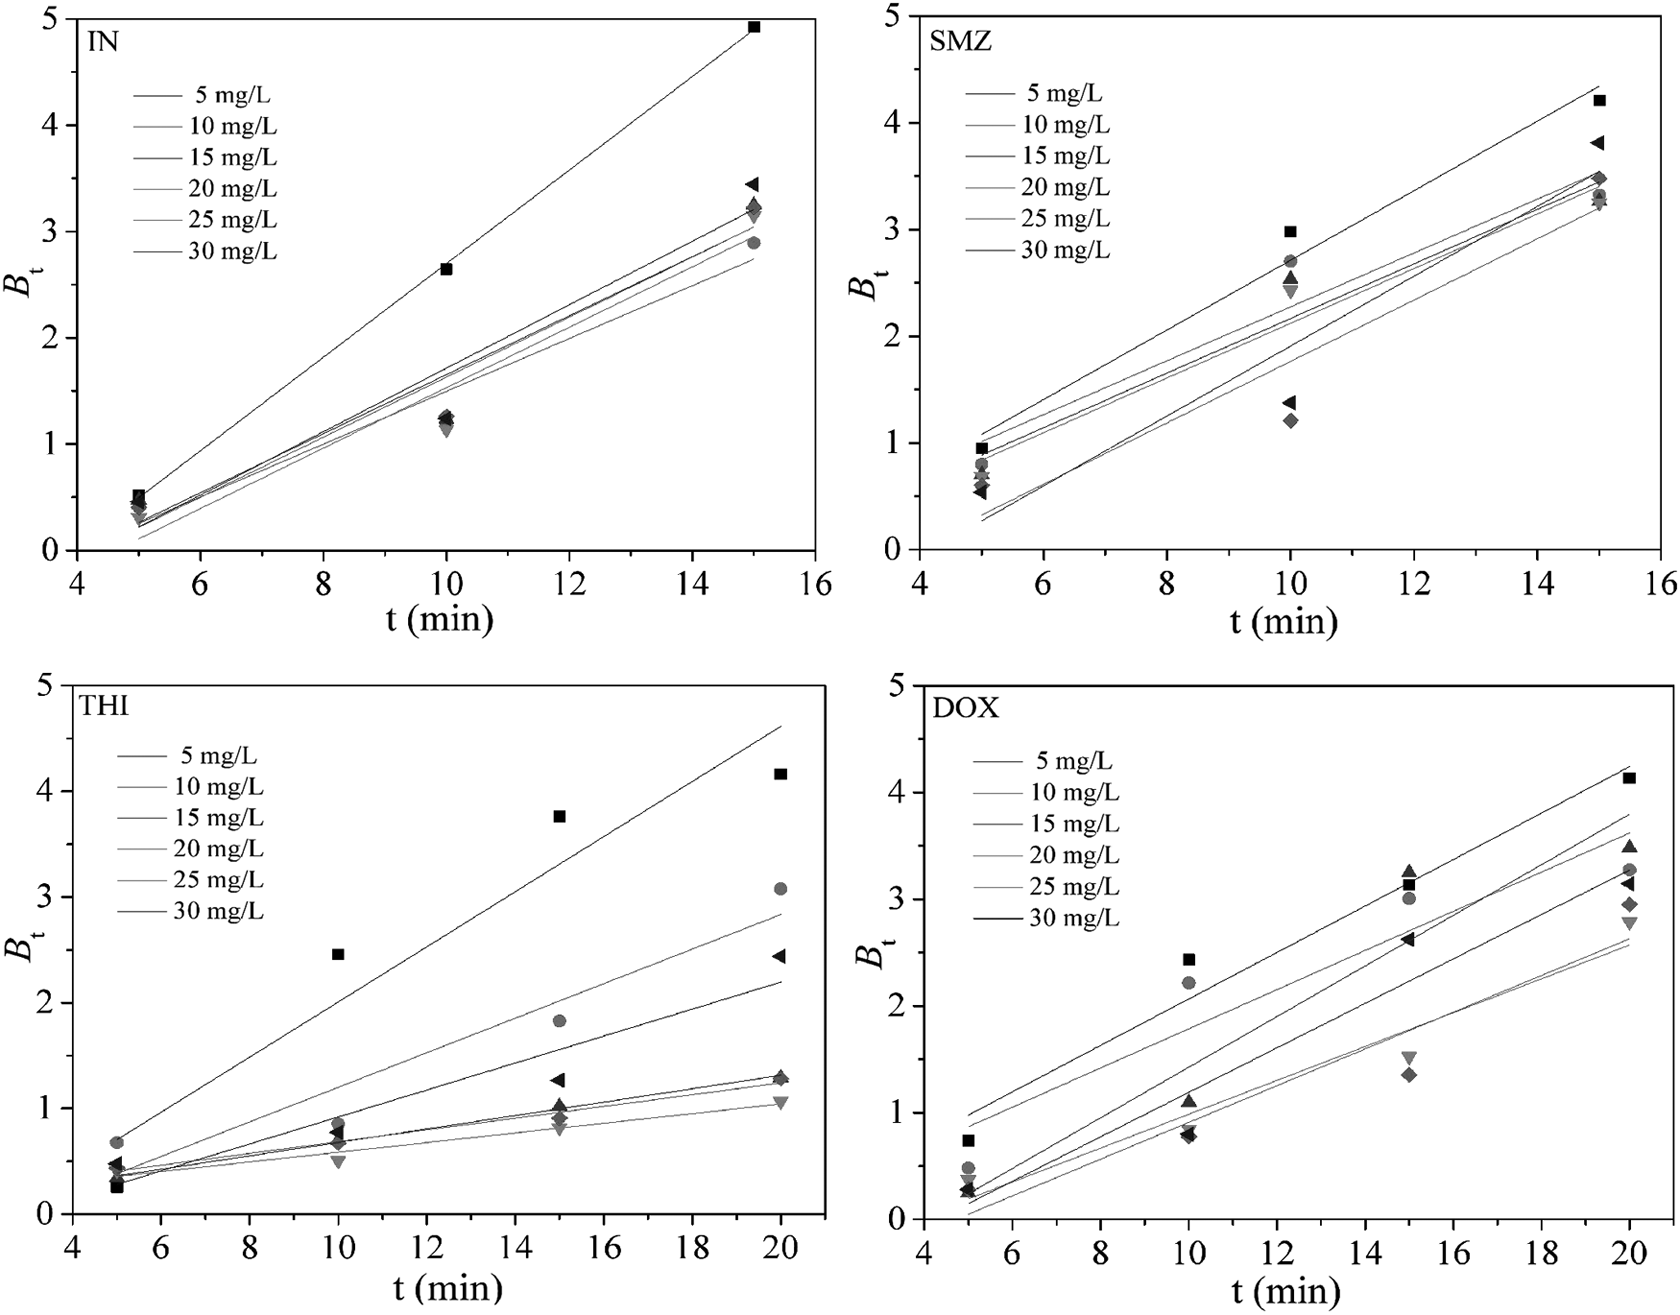
Simulated plots of Boyd's film diffusion model for the sorption of the four antibiotics on GAC at 25°C.
Sorption isotherm
Performance of the sorption process not only lies on the rate at which mass transfer but also on the equilibrium concentration of sorbent–sorbate. Thus, Langmuir and Freundlich models were employed to characterize the sorption isothermal data of the four antibiotics onto the GAC. As shown in Fig. 7, nonlinear fitting was applied to analyze all the isothermal data, and the calculated parameters are presented in Table 3. It was observed that the Langmuir model exhibited a better fit to the Freundlich model, which indicated that sorption of the four antibiotics onto the GAC was monolayer. Based on the values of qm, the maximum sorption capacity of the GAC toward the four antibiotics followed the order: SMZ > DOX > THI > IN, which was consistent with the trend of water solubility of the four antibiotics (Table 1). The parameter KL is related to the binding energy and partly corresponds to the sorption energy level. If the value of KL is larger, the degree of spontaneous reaction is more likely (Dai et al., 2009). Based on Table 3, it can be concluded that the sorption intensity of the SMZ onto GAC was higher than other three antibiotics, followed by IN, THI, and DOX. As for the Freundlich model, KF is a constant related to real sorption capacity (Dai et al., 2009). Based on Table 3, the values of KF for the four antibiotics followed the trend: SMZ > DOX > THI > IN, which was consistent with the results based on qm. The constant n values for the four antibiotics were greater than one unit, which indicated the favorability of the process of sorption (Dai et al., 2009).
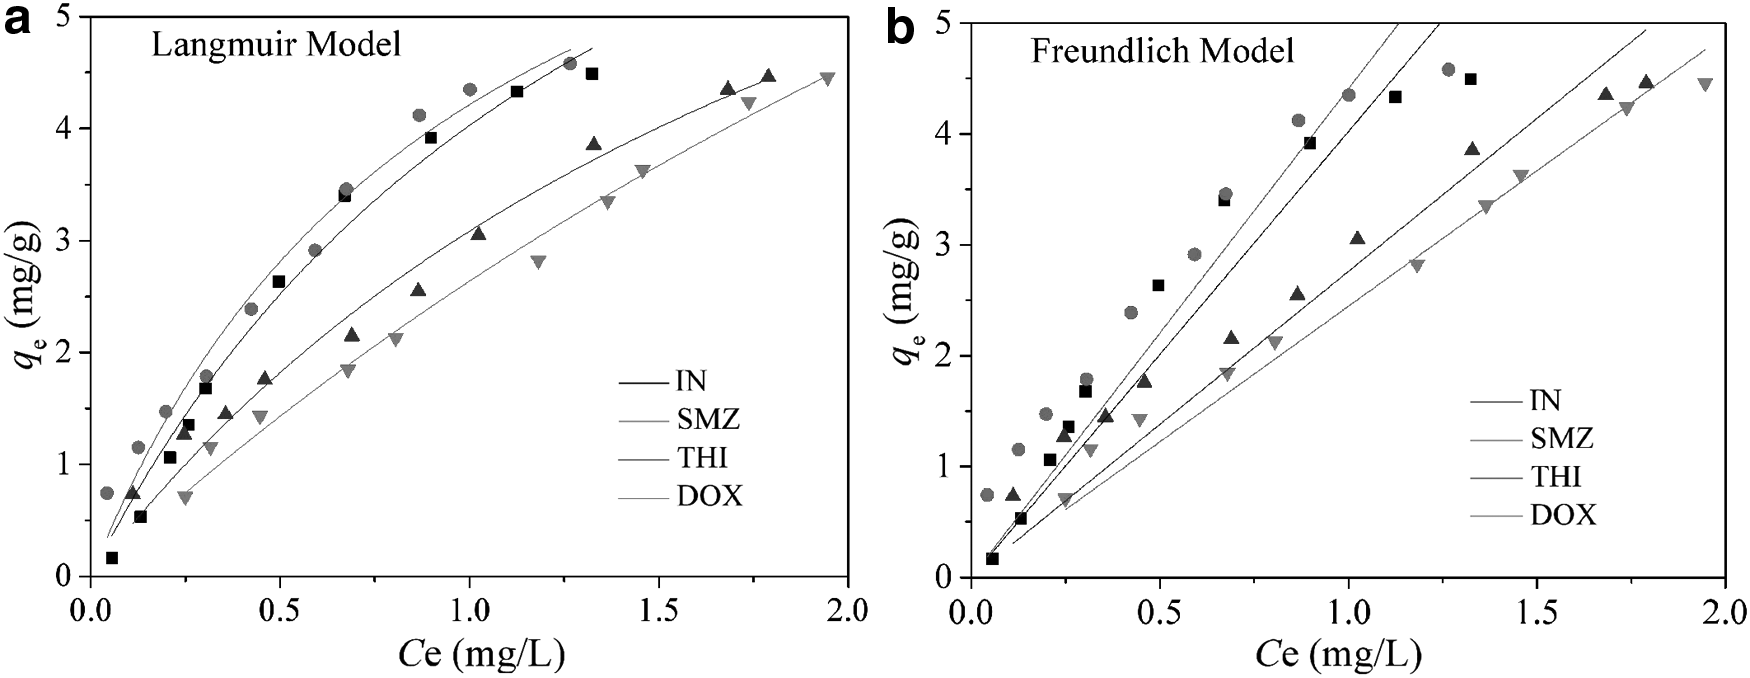
Parameters of Sorption Isothermal Models at 25°C
FTIR and 2D-COS analysis
FTIR spectra recorded the sorption process of IN onto the GAC (Fig. 8a), in which the black line referred to the GAC before sorption, while other three lines stood for the GAC–IN complexes at equilibrium when the initial concentrations of IN ranged from 5 to 20 mg/L. As for the GAC, the peaks at 1,557 and 1,090 cm−1 were attributed to C = O stretching vibration (Terzyk, 2001) and O-P-O symmetric stretching vibration (Lipiec et al., 2013), respectively. The peaks around 792 and 778 cm−1 were related to C–H bending vibration (Armynah et al., 2018), as well as the peak at 694 cm−1 was assigned to O–H bending vibration (Liu et al., 2018). It was found that after sorption, the peak intensities of the five peaks corresponding to the GAC–IN complexes under different initial concentrations obviously weakened, and simultaneously a new peak at 1,655 cm−1 emerged. This peak corresponded to C–N stretching vibration or N–H bending vibration (Tian et al., 2015). As shown in Table 1, IN possesses the functional groups of C–N and N–H. These results demonstrated that the binding interaction between the GAC and IN occurred. Similar phenomena were observed for the GAC–SMZ, GAC–THI, and GAC–DOX complexes. It was noted here that SMZ, THI, and DOX possess the functional groups of C–N and N–H as same as IN.

FTIR spectra recorded sorption
To identify the sequential order of any subtle spectral changes in response to the external perturbations, 2D-COS was used to analyze the 2,000–400 cm−1 region, and the synchronous and asynchronous maps of GAC sorption with the four antibiotics are shown in Fig. 9. In all the synchronous maps, four autopeaks at 1,557, 1,090, 792, and 694 cm−1 were positive, indicating that signals of functional groups did simultaneously change with each other as the change of the four antibiotics concentration. The sequential relationship of the main autopeaks was harvested by comparing the signs from synchronous and asynchronous maps (upper-left corner). If the corresponding intensities of synchronous and asynchronous maps at the same coordinate have the same sign, the variable on the horizontal axis always changes before that on the vertical axis; otherwise the variable on the vertical axis is preferred over that on the horizontal axis (Zhang et al., 2017). The detailed peak assignments and the relationship of the signs are shown in Table 4. According to Noda's rule (Sun et al., 2017), it can be concluded that the sequence of the binding affinities of the four antibiotics followed the order: O–P–O (1,090 cm−1) > C–H (792 cm−1) > O–H (694 cm−1) > C═O (1,557 cm−1).

Synchronous and asynchronous 2D-IR correlation maps derived from the FTIR spectra of GAC binding with IN
Two-Dimensional-Infrared-Correlation Spectroscopy Results on the Assignment and Sign of Each Peak in Synchronous (Φ) and Asynchronous (Ψ, in Parentheses) Maps of Granular Activated Carbon Binding with the Four Antibiotics
Signs are obtained in the upper-left corner of the maps: +, positive; −, negative.
Conclusions
Sorption performances of IN, SMZ, THI, and DOX by the cornstalk-GAC with high specific surface area and large pore volume were investigated in this work. It was found that the four antibiotics can be removed from aqueous solution by the as-prepared GAC under a relatively wide pH and temperature ranges. Equilibrium sorption data of IN, SMZ, THI, and DOX were well expressed by the Langmuir isothermal model, in which the maximum sorption capacity (qm) followed the order of SMZ > DOX > THI > IN. Pseudo-second-order kinetic model fitted the sorption process well, indicating the sorption of the four antibiotics onto GAC involving valency forces through sharing or exchange of electrons between sorbent and sorbate. Based on the Weber–Morris intraparticle diffusion and Boyd kinetic models, it was found that the boundary layer diffusion governed the overall sorption rate. FTIR analysis showed that the surface of GAC carried the functional groups C═O, O–P–O, C–H, and O–H, which contributed to the sorption of four antibiotics. 2D-IR-COS was used to analyze the FTIR data, in which the binding affinities of these functional groups for the four antibiotics followed the same order: O–P–O(1,090 cm−1) > C–H (792 cm−1) > O–H (694 cm−1) > C═O (1,557 cm−1). It can be concluded from these results that the GAC made from cornstalks might be an alternative sorbent for the treatment of antibiotics-loading wastewater.
Footnotes
Acknowledgments
This work was funded by the China Postdoctoral Science Foundation (2016M602830), Shaanxi Postdoctoral Science Foundation (2016BSHTDZZ02), and Fundamental Research Fund for the Central Universities (xjj2016046). We very much thank the editor and anonymous reviewers for their valuable opinions.
Author Disclosure Statement
No competing financial interests exist.
References
Supplementary Material
Please find the following supplemental material available below.
For Open Access articles published under a Creative Commons License, all supplemental material carries the same license as the article it is associated with.
For non-Open Access articles published, all supplemental material carries a non-exclusive license, and permission requests for re-use of supplemental material or any part of supplemental material shall be sent directly to the copyright owner as specified in the copyright notice associated with the article.