
Abstract
Abstract
Recent interest has arisen in the use of biochar as a low-cost adsorbent for control of organic micropollutants in water. However, compared with activated carbon (AC), biochar adsorption capacity is typically one to two orders of magnitude lower. This study reports batch mode adsorption of anionic (2,4-D, C0 100 μg/L) and neutral (simazine [SZN], C0 1.5 μg/L) herbicides from surface water containing dissolved organic matter at 4 mg/L total organic carbon concentration. Enhanced adsorption was observed by biochars generated from updraft gasifiers under conditions of simultaneous co-pyrolysis thermal air activation (CPTA). 2,4-D adsorption by ≥850°C CPTA biochars was more than 10 times greater on a mass basis compared with biochars generated from a conventional anoxic pyrolysis (CAP) reactor and was equivalent to AC reference adsorbents on a surface area normalized basis. Biochars generated at ≥850°C under CPTA conditions had similar micropore surface area to CAP biochars (∼330 m2/g) but about 2.5 times the mesopore surface area (∼110 m2/g CPTA, ∼40 m2/g CAP), suggestive of increased pore accessibility generated by thermochemical widening of pores and/or removal of pyrolysis tars by CPTA. 2,4-D adsorption from surface water was shown to correlate strongly with biochar H:C molar ratio within but not between biochars grouped by CAP and CPTA generation conditions. Comparing adsorption of 2,4-D and SZN by biochars generated from CAP and CPTA conditions suggested that herbicide interaction with biochar surface functional groups through formation of charge-assisted H-bonds did not play a significant role in herbicide uptake from surface water.
Introduction
Environmentally persistent micropollutants (MPs) such as pesticides, pharmaceutical and personal care product residues, industrial effluents, manufacturing additives, and waste breakdown products occurring at micrograms per liter and submicrograms per liter levels increasingly impact water resources and threaten ecosystems and public health around the world. Low-cost and environmentally benign technologies are needed for control of MPs. One option under current study is adsorption by biomass char (“biochar”) generated by pyrolysis. A recent life cycle assessment of biochar for control of MPs in wastewater (WW) effluent projected environmental impacts ranging from deleterious to beneficial (Thompson et al., 2016). The wide range of estimated environmental impacts derived from variation in biochar treatment capabilities, which ranged over a few orders of magnitude as a function of feedstock and production conditions. Biochar cost has been estimated at $350 to $1200 per tonne (Shackley et al., 2015). Whether biochar can be cost competitive with commercial mass-produced adsorbents such as activated carbon (AC) is indeterminate at present but likely depends heavily on sorption efficacy. Targeted innovation is therefore needed to optimize biochar production systems for generation of enhanced adsorbents while keeping costs and environmental impacts low.
Recent research has suggested that exposing biochars to heat and air can modify biochar pore structure and surface chemistry and increase sorption capacity for neutral and ionizable MPs. For example, Xiao and Pignatello (2016) exposed anoxically generated wood biochars to air while heating at 400°C for 0–40 min (“post-pyrolysis air oxidation” [PPAO]). This treatment increased total micropore volume by approximately a factor of 2–3, increased total mesopore volume by up to a factor of 18, roughly doubled the amount of carboxyl surface groups on biochars, and greatly increased adsorption of 12 compounds studied (6 of which were pesticides including 2,4-D). Suliman et al. (2016) generated PPAO biochars from wood and bark carbonized anoxically in a laboratory-scale “spoon” reactor at 350–600°C and exposed to air and heat (300°C) for 30 min. They did not quantify sorption of MPs but found PPAO to increase biochar CO2 surface area and micropore volume as well as O-bearing surface functional moieties. The strength of these effects diminished with increasing carbonization temperature (Suliman et al., 2016). Xiao et al. (2018) generated PPAO biochars from corncob carbonized at 300–700°C and then exposed to heat (400°C) and air for 0–60 min. They found that PPAO significantly increased char surface area, porosity, and capacity for sorption of neutral MPs (herbicides atrazine and prometon and the natural estrogen estriol). The effect of PPAO on pore development and MP sorption was greater for chars carbonized at higher temperatures. The authors attributed this to enhanced mesoporosity derived via a hypothetical “reaming effect,” in which oxygen volatilizes carbonaceous structures along pore walls, thereby increasing pore accessibility and facilitating intraparticle diffusion of adsorbate molecules (Xiao and Pignatello, 2016). PPAO imparted O-bearing surface functional groups to biochars made at low, but not high, carbonization temperatures. From this observation, the authors surmised that oxygen is not strongly reactive with the condensed polyaromatic structure of well-carbonized biochars (Xiao et al., 2018). They also found that open (aerobic) pyrolysis of corncob at 300°C and 400°C resulted in a char with low surface area and MP sorption capacity (Xiao et al., 2018).
These studies are promising but face a few important limitations. Biochars were produced from moisture-free and finely ground feedstocks and pyrolyzed under highly controlled laboratory conditions. Suliman et al. (2016) pyrolyzed wood and bark milled to a particle size of about 0.59 mm in a nitrogen-purged reactor. The chars studied by Xiao and Pignatello (2016) and Xiao et al. (2018) were likewise made from wood shavings and corncobs (CC) ground to a particle size of 0.4–2 mm and pyrolyzed in a tube furnace under N2. Feedstock grain size and moisture content and the sweep rate and composition of gases in the pyrolysis environment have been demonstrated to strongly influence biochar properties (Antal and Gronli, 2003). Therefore, laboratory-produced biochars might not be representative of biochars produced at the application scale.
Furthermore, target adsorbate concentration and background water chemistry strongly influence outcomes of batch adsorption studies. The presence, concentration, and characteristics of dissolved organic matter (DOM), which typically occurs at concentrations several orders of magnitude greater than MPs (mg C/L for DOM vs. μg/L and sub-μg/L levels for MPs), can constrict or block pores (“fouling”) and/or can engage in direct site competition with target adsorbates. The inhibitory effect of DOM on biochar adsorption of target MPs has been found to range from minimal (Kwon and Pignatello, 2005; Cornelissen and Gustafsson, 2006; Hale et al., 2011) to very strong (Teixido et al., 2011; Lou et al., 2013; Kupryianchyk et al., 2016b; Shimabuku et al., 2016), depending on target adsorbate, biochar characteristics, background water characteristics, and preloading versus simultaneous loading of DOM and target compounds. Studies have demonstrated reduced adsorption capacity and hindered kinetics in biochars exposed to model DOM compounds for 2,4-D (Qiu et al., 2009), propanil (Qiu et al., 2009; Xiao et al., 2012), polychlorinated biphenyls (Koelmans et al., 2009), and various other neutral organic compounds (NOCs) (Pignatello et al., 2006). However, to date, most (≥85%) (Kearns et al., in preparation) studies of organic compound adsorption by biochars use high (mg/L) adsorbate concentrations and organic-free background water matrices—conditions that are not representative of environmental or municipal water systems. For example, sorption studies with PPAO biochars by Xiao and Pignatello (2016) and Xiao et al. (2018) used herbicides in the tens-of-milligrams per liter range as single solutes in laboratory reagent water. Further research is therefore necessary to quantify MP sorption in relevant water chemistries by thermal air activated biochars produced at the application scale.
The primary objective of this study was to quantify batch mode uptake of 2,4-D herbicide (C0 = 100 μg/L) from surface water (containing DOM at a level of 4 mg/L total organic carbon [TOC]) by co-pyrolysis thermal air activated (CPTA) biochars. Herbicide uptake by CPTA biochars was compared with uptake by conventional anoxic pyrolysis (CAP) biochars produced from a furnace reactor as well as AC reference sorbents as described in a previous study (Kearns et al., 2015a). CPTA biochars were generated from several agricultural and forestry biowaste feedstocks using application scale top-lit updraft (TLUD) gasification pyrolysis reactors that are in widespread use globally as biomass cookstoves and in small farm biochar production (Roth et al., 2013). These reactors accomplish oxidation of biochars simultaneously with pyrolysis in contrast to the two-step pyrolysis and postoxidation (PPAO) process described by other researchers (Suliman et al., 2016; Xiao and Pignatello, 2016; Xiao et al., 2018). A specific objective of this study was to quantify herbicide uptake by CPTA biochars generated at high temperature (≥850°C) as adsorption by these materials has not been previously reported in the literature.
Biochar elemental composition (often expressed as ratios of hydrogen, oxygen, and carbon mol percentages) and surface area contained within micropores and mesopores have been shown to vary with pyrolysis conditions and correlate with CAP biochar sorption of organic compounds (Keiluweit et al., 2010; Kearns et al., 2014, 2015a, 2015b; Hale et al., 2016; Kupryianchyk et al., 2016a; Shimabuku et al., 2016). Therefore, an additional objective of this work was to quantitatively relate CPTA biochar production conditions, surface area in micropores and mesopores, elemental ratios [H:C, (O+N):C], and MP adsorption. The use of H:C ratio has been proposed as an index for sorption by CAP biochars. Here, we further qualify the utility of this screening method for biochar sorbents produced from other reactor typologies such as CPTA.
The presence of oxygen-bearing functional groups on the surfaces of carbonaceous adsorbents and the contribution from hydrogen bonding between these groups and target adsorbates to overall MP sorption is a complex matter under current investigation. Whether O-bearing groups facilitate or inhibit MP sorption and whether H-bonding provides a significant mechanism are topics of uncertainty and debate and are likely circumstance-specific (Li et al., 2002; Zhu and Pignatello, 2005; Chingombe et al., 2006; Sun et al., 2011, 2012, 2013; Teixido et al., 2011; Yao et al., 2012; Lian et al., 2014; Xiao and Pignatello, 2016). An objective of this study was therefore to advance the understanding of the role of H-bonding in uptake of herbicides from surface water by CPTA biochars, as elaborated in a later section.
Generating biochar involves a quenching step wherein hot biochar is cooled to handling temperature once pyrolysis is complete. At the application scale, this can be accomplished by sealing the reactor to prevent ingress of air (“dry quench”) or by dousing with water (“wet quench”). To our knowledge, the effect of quenching method on biochar adsorption properties has not been previously reported. Therefore, the effect of wet versus dry quenching on herbicide adsorption was investigated in a preliminary manner. Also relevant to the application-scale biochar production is the matter of variability of pyrolysis conditions within the reactor during batch production. A previous study found significant within-batch temperature variability in CAP biochar production that correlated with wide variation in sorption efficacy (Kearns et al., 2015a). Therefore, herbicide uptake by subsamples of CPTA biochar taken from upper and lower zones of the reactor was compared to provide a preliminary assessment of within-batch consistency of this mode of biochar production. Desorption of 2,4-D was also quantified for a subset of CPTA biochars, as MP leaching is a concern for implementation of water treatment systems employing biochar adsorbent.
Materials and Methods
The acronyms and abbreviations used in this article are summarized in Table 1.
Acronyms and Abbreviations Used in This Article
Biochar preparation
A 3.8 L (1 gal) TLUD cookstove gasifier operated in natural draft (ND) and forced draft (fan assisted, FD) modes was used to generate CPTA biochars over the temperature range of 600–900°C. Batch carbonization required 30–90 min in ND mode and 30–60 min in FD mode, depending on the feedstock. The feedstocks used were as follows: cherry pits (CHER), Jatropha presscake waste pellets (JAT), chopped bamboo pieces (BAM), sugarcane bagasse pellets (BAG), pine forestry waste pellets (PINE), and pecan shells (PEC). Biochars were obtained from BAG and JAT in ND mode only as char yield in FD mode was very low for these two feedstocks. One batch of PINE biochar was generated in the cookstove gasifier, ND mode, and quenched with surface water. Biochar samples were collected from this bulk material as well as from the top and bottom of the char bed to investigate within-batch heterogeneity. A 200 L (55 gal) drum oven gasifier operated in ND mode was used to generate biochars over the temperature range of 750–850°C from CC, BAM, and chopped eucalyptus branches (EUC) and was operated in FD mode for generation of biochar from hardwood pellets (HWP) at 900°C. Carbonization required 60–80 min for BAM and CC and 120–150 min for EUC and HWP. The naming convention for biochars is as follows: “C” or “D” signifying cookstove or drum oven, followed by ND or FD for mode of operation, followed by the abbreviation denoting the feedstock and the peak pyrolysis temperature. For example, C-ND-JAT-600 (cookstove, natural draft, Jatropha pellets, 600°C) and D-FD-HWP-900 (drum oven, forced draft, hardwood pellets, 900°C). The wet-quenched char nomenclature appends a “-W” and the bottom and top char samples a “-B” or “-T” (e.g., C-ND-PINE-625-W-T). Also included in this study is a sample of biochar obtained from a villager's residence in Vietnam produced from rice husk in a specially designed cookstove operated in FD mode (FD-RH). Pyrolysis temperature data are not available for the FD-RH biochar. 2,4-D adsorption by a reference thermo-series of CAP furnace reactor biochars is also discussed in this study. CAP biochar production details are reported in a previous study (Kearns et al., 2015a). Briefly, split bamboo (BAM) and eucalyptus (EUC), pine (PINE), and longan (LON) woods cut into slats (15 cm × 10 cm × 1 cm) were placed in a metal bin and covered with sand to exclude oxygen and heated using a programmable laboratory muffle furnace to 550°C, 700°C, or 850°C over a period of 8 h. EUC slats were also heated to 350°C for a period of 4 days and 600°C for a period of 3 days. Herein, CAP biochars are designated by an abbreviation denoting feedstock, retort (R), temperature, and heating duration if different from 8 h; for example, BAM-R-700 and EUC-R-600-3d. A further note on nomenclature used in this article: quantities presented in figures and discussed in the text pertain to properties of the overall bulk adsorbent (BA), meaning the carbonaceous material plus the mineral (ash) component, or specific to the carbonaceous matter (CM) component.
All biochars were ground by hand with a mortar and pestle to pass a U.S. standard 200-mesh sieve (0.074 mm) and dried at least overnight at 105°C before characterization and batch experiments. To measure ash content, around 1 g of each char was accurately weighed in a ceramic crucible and combusted at 550°C for 6 h, cooled to room temperature in a desiccator, and reweighed. Reported values are averages taken of triplicate measurements for each charcoal sample. Elemental (C, N, H) analyses of each charcoal sample were completed by the Analytical Services Laboratory at North Carolina State University using a CHN Elemental Analyzer (Perkin-Elmer model 2400) calibrated with an acetanilide standard. A reference coal (NIST, 1632c standard reference material trace elements in coal—bituminous) was included as a calibration standard. Oxygen content of each sample was estimated as the remainder of mass after subtraction of C, N, H, and ash components. Brunauer, Emmett, and Teller (BET) surface area was determined by N2 gas adsorption (Autosorb MP-1; Quantachrome Instruments). The contribution to total surface area by area within micropores (<2 nm) was determined using the “t-plot” statistical thickness method. “Mesopore” area was inferred by assuming that surface area in pores larger than micropores was predominantly located in pores 2–50 nm (i.e., the contributions to total surface area from macropores and particle external surfaces were small).
2,4-D was selected as a target compound because of its environmental relevance as one of the most widely used herbicides worldwide and one of the most commonly detected pesticides in environmental waters (Gilliom et al., 2006; Parsons et al., 2008), as well as for its human health implications as a potential carcinogen, suspected endocrine disruptor, and toxicant to the kidneys, liver, and reproductive and developmental systems (Gilliom et al., 2006; Parsons et al., 2008; PAN, 2013). 2,4-D (pKa 2.7) occurs predominantly in the anionic form at circumneutral pH values typical of environmental waters and thus is very water soluble, weakly adsorbing, and subjected to significant competition from small DOM fractions. Simazine (SZN) is similar in size to 2,4-D but is neutral and more strongly adsorbing (Kennedy et al., 2015). Compared with many other organic MPs (pesticides, pharmaceuticals, fuel and industrial compounds, and many of their residues and breakdown products), 2,4-D is more difficult to remove from water by carbonaceous adsorbents (Corwin and Summers, 2012). Thus, if a biochar effectively sorbs 2,4-D, it would be expected to remove many other organic pollutants. Batch adsorption experiments were conducted with biochar doses ranging from 2 to 200 mg/L (0.5–80 mg/L for SZN) in simulated natural water at pH 7 (maintained throughout using 20 mM phosphate buffer: 1.6 g/L KH2PO4 and 1.1 g/L Na2HPO4) containing background DOM isolated from a surface water source near Big Elk Meadows, Colorado, United States. This watershed is not impacted by agricultural runoff or WW discharge. A DOM concentration of 4 mg/L TOC was used and is representative of many surface waters. To determine herbicide uptake at environmentally relevant levels, 100 μg/L of 3H-labeled 2,4-D or 1.5 μg/L of 14C-labeled SZN (American Radiolabeled Chemicals, Inc.) was introduced to the initial DOM solution matrix and quantified by liquid scintillation counting (method detection limit 1 μg/L for 3H-2,4-D and 62 ng/L for 14C-SZN). The United States Environmental Protection Agency maximum contaminant levels for 2,4-D and SZN in drinking water are 70 and 4 μg/L, respectively (EPA, 2009), whereas the World Health Organization (WHO) Guideline Values are 30 and 2 μg/L, respectively (WHO, 2006). All suspensions were agitated for 2 weeks to reach adsorption equilibrium [contact time to equilibrium established previously (Kearns et al., 2014, 2015a, 2015b)] and filtered through prefired (550°C for 5 h) glass fiber membranes (1.2 μm Whatman GF/C) to remove the biochar before herbicide analysis. 2,4-D desorption was quantified for a subset of biochars by placing biochars recovered from batch uptake experiments on glass fiber membranes into 125-mL bottles filled with DOM solution (absent herbicide) and agitating for 4 weeks. The resulting suspensions were filtered again and 2,4-D in the filtrate was quantified.
Identical adsorption batch tests were carried out with granular activated carbon (GAC) and powdered activated carbon (PAC) using adsorbent doses of 2–8 mg/L. Norit 1240 GAC (N2 BET-specific surface area 979 m2/g) and Calgon WPH PAC (774 m2/g) were selected as widely used and highly effective bituminous coal-based ACs to provide an adsorption benchmark familiar to most AC researchers for comparison of herbicide uptake by biochars. GAC was ground by hand in a mortar and pestle to pass a U.S. standard 200-mesh sieve (<0.074 mm), and PAC was used as-received from the manufacturer (>90% passes U.S. standard 325-mesh [<0.045 mm] sieve).
Results and Discussion
Biochar characterization
Surface area and elemental content data are presented in Fig. 1, and the raw data are provided in Supplementary Tables S1a and S1b for CPTA biochars and in Supplementary Table S2b for CAP biochars. Dotted arrows in Fig. 1 indicate elemental content and surface area trends for feedstocks charred under different thermal and draft conditions: BAM, CHER, PINE, and PEC. Carbon content and polarity index [(O+N):C ratio] did not change markedly under different pyrolysis conditions. This is expected as chars used in this study were produced at ≥600°C and thus were all highly graphitized compared with chars generated at lower temperatures (Keiluweit et al., 2010). The C content of the CM component of all biochars ranged from ∼85% to 95%. H:C ratios declined with increasing pyrolysis temperature and draft. Declining H:C ratio and increasing surface area with increase in pyrolysis temperature have been reported in prior studies [as reviewed by Keiluweit et al. (2010)], and these parameters have been shown to correlate with organic compound sorption (Kearns et al., 2014, 2015a, 2015b; Hale et al., 2016; Kupryianchyk et al., 2016a; Shimabuku et al., 2016). A more pronounced trend was observed between N2 BET surface area and pyrolysis temperature. CM-specific surface area values were estimated by assigning a nominal surface area to the ash component of 10 m2/g, based on measurements reported previously by Shimabuku et al. (2016). Micropore surface areas increased with pyrolysis temperature for CAP and CPTA biochars and were similar for CAP and CPTA biochars produced ∼850°C (∼350 m2/gCM). Interestingly, “mesopore” surface areas declined slightly with pyrolysis temperature for CAP biochars (average 77 m2/gCM at 550°C to average 44 m2/gCM at 850°C) but increased substantially for CPTA biochars produced (average 46 m2/gCM at 600–650°C to average 114 m2/gCM at ≥850°C). Pore surface areas and elemental trends and how these relate to herbicide adsorption are discussed in detail in later sections.
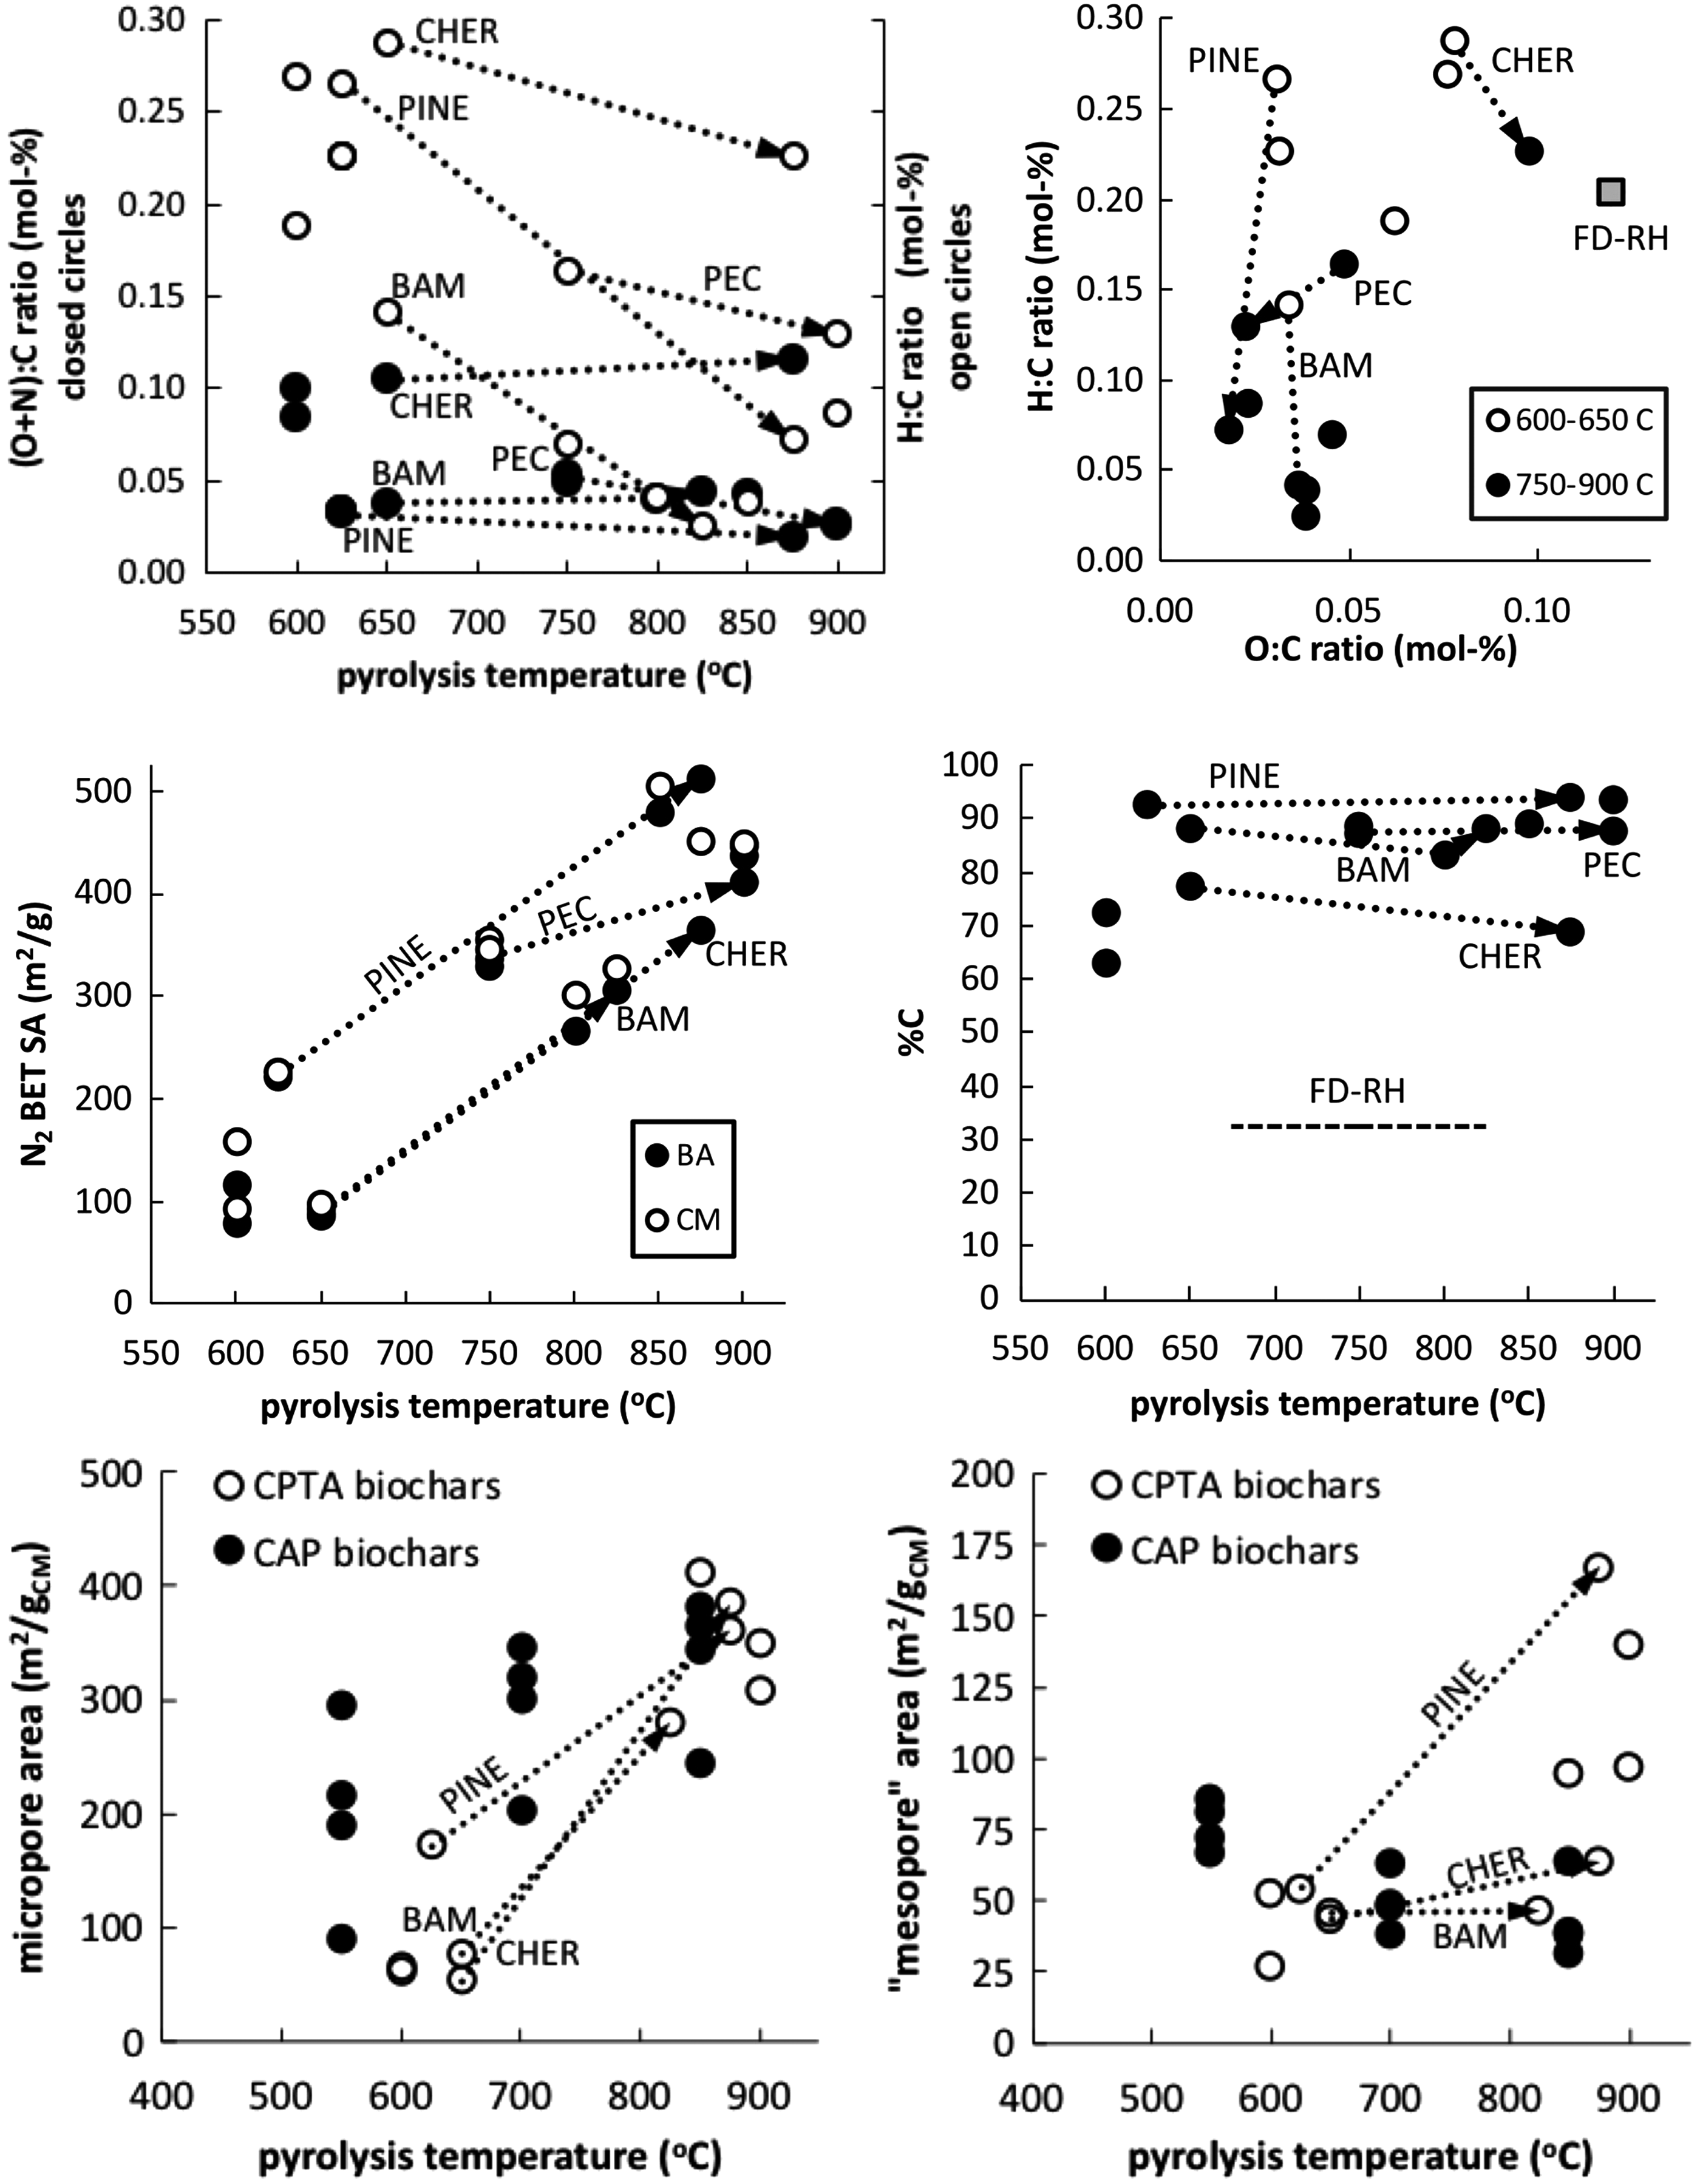
Surface area and elemental content trends for CPTA biochars. Feedstock series indicated by dotted arrows for chopped bamboo (BAM), cherry pits (CHER), pine pellets (PINE), and pecan shells (PEC). Pyrolysis temperature is not known for the rice husk biochar (FD-RH). N2 BET surface area values are given for biochars on a BA basis or specific to the CM content. “Mesopore” areas represent the sum of surface areas not only in micropores (<2 nm), which is likely dominated by mesopores, but also includes macropores and particle external surfaces. Data are provided in Supplementary Tables S1a (CPTA biochars) and S2b (CAP biochars). BA, bulk adsorbent; BET, Brunauer, Emmett, and Teller; CAP, conventional anoxic pyrolysis; CM, carbonaceous matter; CPTA, co-pyrolysis thermal air activation.
Herbicide adsorption from surface water
Supplementary Figure S1 displays dose–response data for uptake of 2,4-D by CPTA biochars, as well as PAC, GAC, and a subset of CAP biochar reference adsorbents made from EUC. A previous study established that the thermo-series of EUC biochars produced in a muffle furnace is representative of the range of 2,4-D adsorption by CAP biochars from reactors such as traditional charcoal kilns (Kearns et al., 2015a). Note that burying the feedstock in sand within the furnace-retort limited the ingress of air, thereby minimizing contact with oxygen and maintaining low-draft conditions during pyrolysis. The dashed line repeated in each panel of Supplementary Fig. S1 provides a visual reference: dose–response curves for 2,4-D uptake from the same surface water by CAP biochars fall to the right of this line (Kearns et al., 2015a). Under the study conditions, the ACs displayed approximately one to two orders of magnitude greater 2,4-D uptake on a per-mass basis than CAP biochars. This is expected as PAC and GAC are commercial adsorbents engineered for optimal adsorption capacity in water treatment applications. To assess the role of hydrogen bonding in 2,4-D uptake, adsorption of the neutral herbicide SZN, which cannot form hydrogen bonds, by a subset of CAP and CPTA biochars was quantified. Dose–response curves for uptake of SZN from surface water by CAP biochars W-R-600-3d and W-R-700, CPTA biochars C-ND-PINE-625, C-FD-PINE-875, D-ND-EUC-875, and D-FD-HWP-900, and GAC are given in Supplementary Fig. S2.
Figure 2 shows 2,4-D uptake isotherms—that is, equilibrium solid-phase concentrations (qe, mg/g) of 2,4-D as a function of equilibrium liquid-phase concentration (Ce, mg/L)—for CPTA biochars, PAC, and GAC. Figure 2 is separated into upper and lower panels for clarity. Left panels display isotherms plotted on a mass basis—qe in milligrams of 2,4-D per gram BA. Right panels display isotherms plotted on a surface area basis—qe in milligrams of 2,4-D per 103 m2 of CM. Data are circled as a visual guide for biochars produced under similar temperature regimens. A previous study (Kearns et al., 2015a) showed that mass-basis isotherms for 2,4-D uptake by CAP biochars fall below the dotted line (data omitted from Fig. 2 for clarity). Figure 2 illustrates that CPTA biochars produced at 600–800°C exhibited 2,4-D uptake capacity similar to CAP biochars produced at 550–850°C. 2,4-D uptake improved substantially when gasification draft and temperature were increased. Draft, temperature, and batch pyrolysis duration covary and cannot be controlled independently in simple cookstove and drum oven CPTA pyrolyzers. These production factors are influenced by feedstock size and shape—how the feedstock packs into the reactor determines draft permissivity—as well as feedstock energy and moisture content. As a basis for comparison of adsorbents, dose–response data (Supplementary Fig. S1) were used to estimate the adsorbent dose required to achieve a 2,4-D equilibrium concentration (Ce) of 30 μg/L (dose30). Corresponding values for surface loading of 2,4-D onto biochars at Ce = 30 μg/L (qe30) were estimated from Freundlich isotherm model fitted to data in Fig. 2 [Eq. (1)]. An equilibrium concentration of 30 μg/L was chosen because this is the Guideline Value for 2,4-D in drinking water set by the WHO (2006).
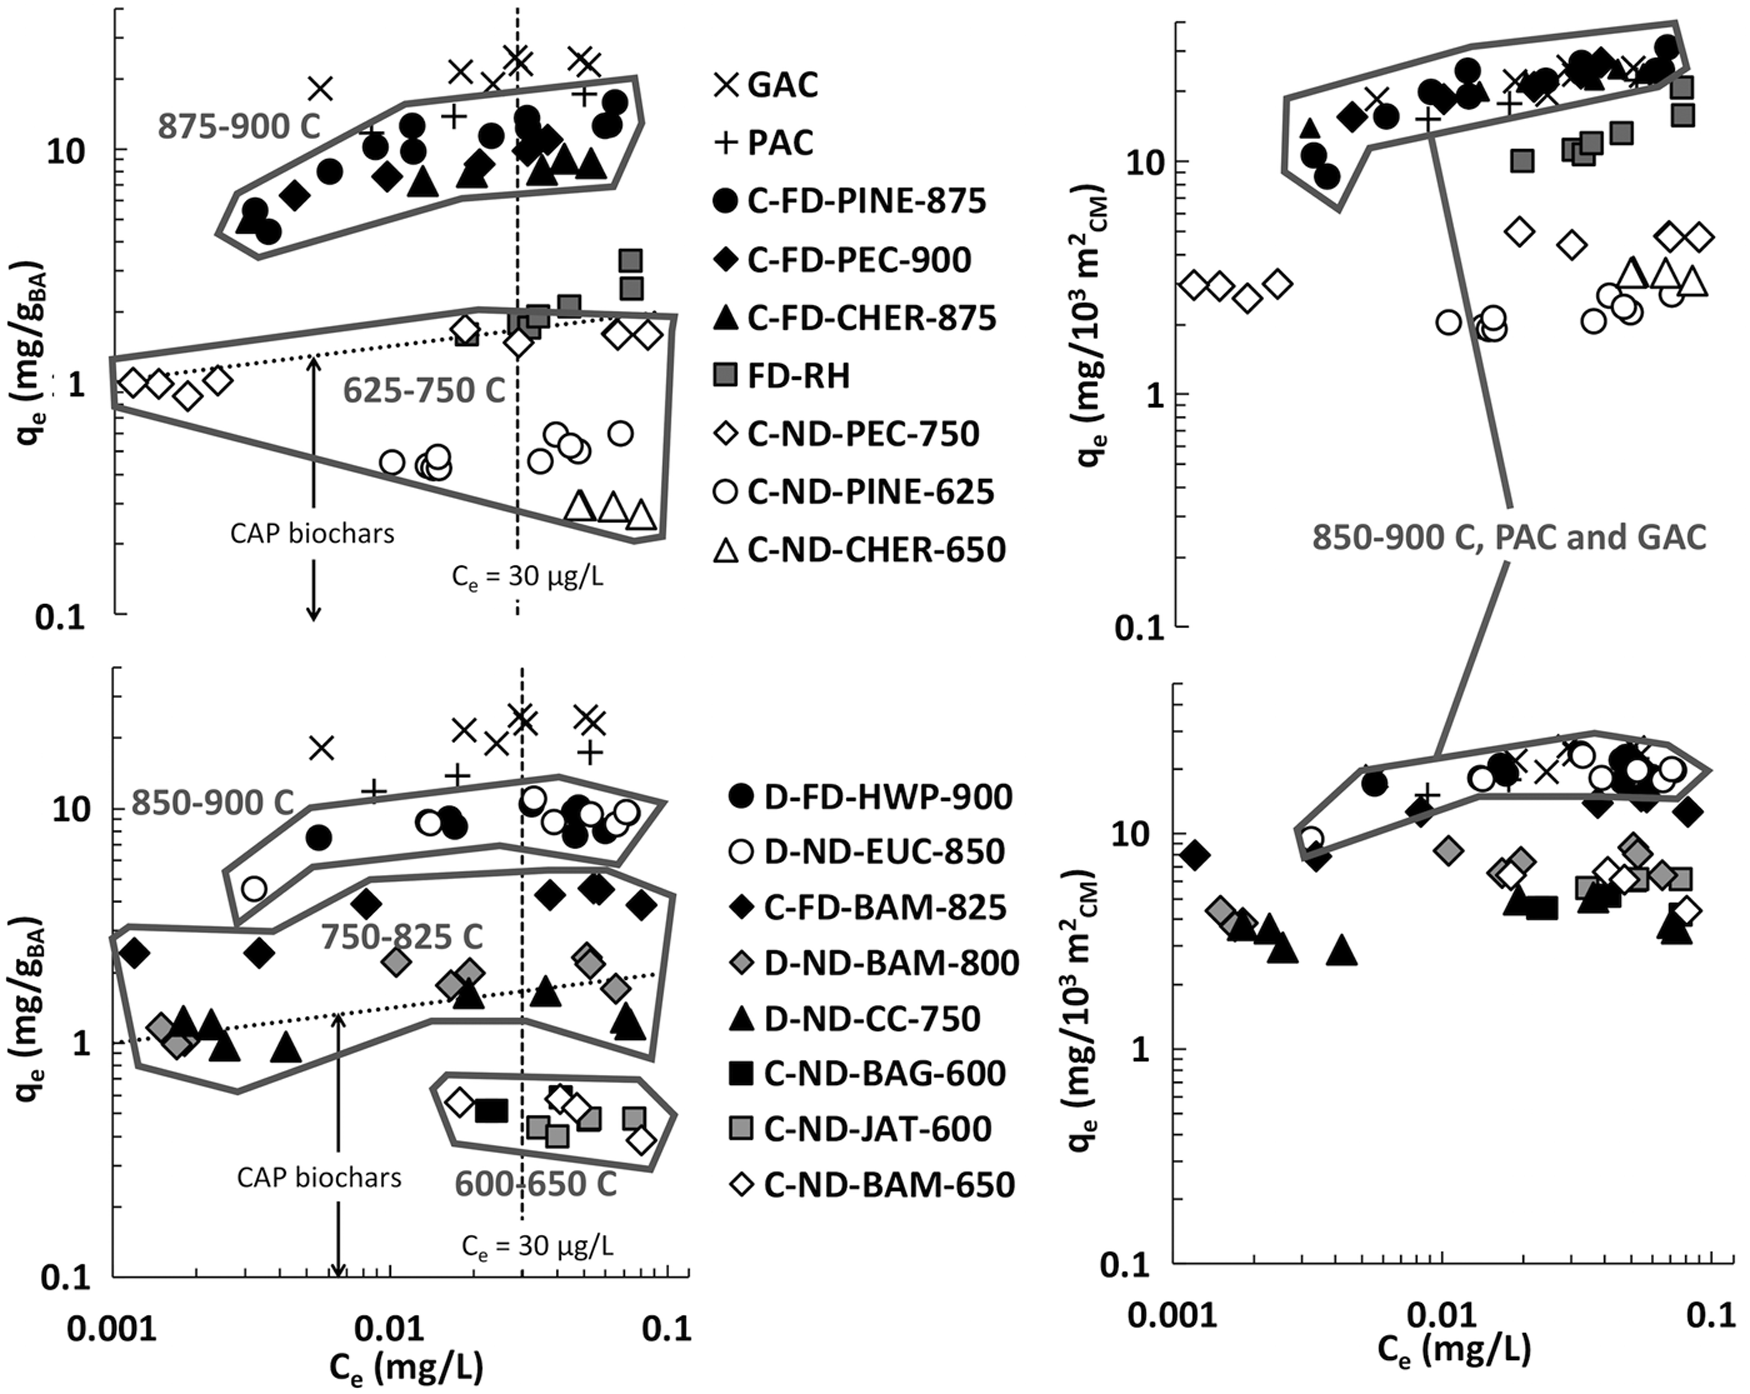
Isotherms representing 2,4-D uptake from surface water (2,4-D C0 100 μg/L, DOM concentration 4 mg/L TOC, pH 7)—that is, equilibrium solid-phase concentrations (qe, mg/g) of 2,4-D as a function of equilibrium liquid-phase concentration (Ce, mg/L)—for CPTA biochars, PAC, and GAC. Data are separated into upper and lower panels for clarity. Left panels display isotherms plotted on a mass basis—qe in milligrams of 2,4-D per gram BA. Right panels display isotherms plotted on a surface area basis—qe in milligrams of 2,4-D per 103 m2 of CM. Data are circled as a visual guide for biochars produced under similar temperature regimens. A previous study (Kearns et al., 2015a) demonstrated that mass-basis isotherms for 2,4-D uptake by CAP biochars fall below the dotted line (data omitted from the figure for clarity). Values for KF, 1/n, and correlation coefficient (R2) for isotherm model fits along with qe30 (i.e., 2,4-D solid-phase concentration at Ce 30 μg/L) values are provided in Supplementary Table S2a (CPTA biochars). CAP biochar qe30 values are provided in Supplementary S2b. DOM, dissolved organic matter; GAC, granular activated carbon; PAC, powdered activated carbon; TOC, total organic carbon.
KF is the Freundlich capacity parameter in units of (mg/g) (L/μg)1/n and 1/n is the Freundlich exponent (unitless). Values for KF, 1/n, and correlation coefficient (R2) for isotherm model fits, along with dose30 and qe30 values, are given in Supplementary Table S2a for CPTA biochars. For comparison, CAP biochar qe30 values from a previous study (Kearns et al., 2015a) are provided in Supplementary Table S2b. Figure 3 illustrates the relationship between qe30 and pyrolysis temperature for CPTA biochars compared with CAP biochars made from BAM, EUC, LON, and PINE. CPTA biochars generated at 600–650°C (excluding biochar sampled from the bottom of the cookstove pyrolysis reactor, C-ND-PINE-625-W-B, discussed below) exhibited qe30 values ranging from ∼0.3 to 0.7 mg/gBA. These values are similar to qe30 values for CAP biochars generated at 700°C (0.3–0.6 mg/gBA). The qe30 values for CPTA biochars generated at 600–650°C partially overlap with values for CAP biochars generated at 850°C (0.7–1.0 mg/gBA). CPTA biochars generated at 850–900°C exhibited qe30 values ranging from 8.1 to 11.9 mg/gBA. These values are approximately a factor-of-10 greater than the values for CAP biochars generated at 850°C and approach the qe30 values of PAC and GAC (15.3 and 22.3 mg/gBA, respectively). These results suggest that in addition to temperature, the role of draft and aeration during pyrolysis is important in the development of biochar sorption properties.

The relationship between qe30 (on a mass of BA—basis) and pyrolysis temperature for CPTA biochars compared with CAP biochars made from bamboo and eucalyptus, pine, and longan woods pyrolyzed at 550°C, 700°C, and 850°C for 8 h, and eucalyptus wood pyrolyzed at 600°C for 3 days (CAP biochar data from Kearns et al., 2015a).
Wet versus dry quench, within-batch adsorbent heterogeneity
As a brief exploratory experiment, 2,4-D adsorption was compared using CPTA biochars produced from PINE under ND conditions and either sealed and allowed to cool (“dry quench,” C-ND-PINE-625) or rapidly cooled using water (“wet quench,” C-ND-PINE-W). Under the study conditions, wet quenching had a beneficial effect on 2,4-D adsorption, as illustrated in Supplementary Fig. S1. Wet quenching increased qe30 and reduced dose30 by about 40% (Supplementary Fig. S1 and Supplementary Table S2a). When generating adsorbent biochar, especially at the drum oven scale, wet quenching affords additional benefits—for example, helping to wash out fines and ash and keeping down dust during biochar handling. It is safer and easier for operators and reduces cycle time during sequential batch production. Introducing water into the hot char bed produces ample steam—it is possible that steam helps to open biochar pores and/or remove residues and thereby increase adsorption capacity (Rajapaksha et al., 2014, 2015). At present, this is speculation and further research on quenching methods is needed.
For TLUD configuration reactors, it has been postulated that hot rising pyrolysis gases can cool and condense in upper regions of the char bed, thereby fouling pores and reducing adsorption capacity (Veksha et al., 2014). As a preliminary test of this hypothesis, the 2,4-D adsorption capacity of biochar samples collected from the top (T) and bottom (B) of one batch of wet quenched cookstove ND biochar made from PINE was compared (C-ND-PINE-625-W-T and C-ND-PINE-625-W-B). 2,4-D uptake by top char was similar to that observed for the bulk batch of wet quenched biochar (Supplementary Fig. S1). Bottom char exhibited ∼30% higher qe30 and lower dose30 than bulk biochar from the same batch (Supplementary Fig. S1 and Supplementary Table S2a). One explanation for bottom char exhibiting higher adsorption capacity might be greater exposure to oxygen relative to upper layers of the char bed due to its proximity to reactor air inlets. During pyrolysis, the highest temperatures are achieved at the bottom of the reactor where air enters, causing some of the bottom layer of biochar to combust. These conditions could result in a localized super-heated zone where pyrolysis gases are burned and prevented from condensing into biochar pores, although further research is necessary to verify this mechanism.
The influence of aerobic draft on biochar adsorption capacity I: The role of H-bonding
One mechanism by which the reaction of char with oxygen at elevated temperature can influence MP sorption is through the formation of O-bearing functional groups on the char surface. Some researchers have postulated that O-bearing surface functional groups benefit adsorption by providing sites for specific interactions with polar and ionizable adsorbates such as H-bond formation (Sun et al., 2011, 2012, 2013; Yao et al., 2012; Lian et al., 2014; Xiao and Pignatello, 2016). In contrast, other research indicated that O-bearing surface functional groups impair adsorption since these sites also form H-bonds with water molecules. The resulting water clusters impose steric restrictions and block pollutant access to micropores, prevent pollutant access to hydrophobic binding sites, and reduce the interaction energy between the pollutant and the adsorbent surface, as has been demonstrated for ACs (Li et al., 2002; Chingombe et al., 2006). This effect has also been observed for adsorption on biochars. A study by Zhu and Pignatello (2005) found that the removal of O functionality on biochar surfaces by a hydrogenation step during pyrolysis enhanced adsorption of both polar and nonpolar compounds (Ce ranging from ∼1 μg/L to 10 mg/L) to a similar extent by reducing competitive adsorption by water molecules. The authors concluded that polar interactions with surface O-groups were not a significant contributor to adsorption of neutral phenolic and nitro-aromatic compounds and might have suppressed adsorption at low equilibrium concentrations (Zhu and Pignatello, 2005). In contrast, other studies have concluded that the presence of surface O groups contributed to the enhanced sorption of ionizable weak organic acids such as the sulfonamide antibiotic sulfamethazine (Teixido et al., 2011) and 2,4-D (Xiao and Pignatello, 2016) through the formation of strong charge-assisted H-bonds (CAHB). Comparing uptake of 2,4-D and atrazine by biochars exposed to varying degrees of thermal air (PPAO) oxidation, Xiao and Pignatello (2016) found that on a surface area normalized basis PPAO increased 2,4-D adsorption significantly while atrazine adsorption remained constant. 2,4-D is capable of forming CAHB, whereas atrazine is not. This lent support to the hypothesis that surface H-bond sites play a role in enhancing the adsorption of ionizable MPs by biochars.
However, the present study does not support this conclusion under all circumstances. Figure 4 displays surface area normalized equilibrium solid-phase concentrations (qe, mg/m2) of 2,4-D and SZN as a function of equilibrium liquid-phase concentration (Ce, mg/L) for CPTA (C-FD-PINE-875, D-FD-HWP-900, D-ND-EUC-850) and CAP (W-R-600-3d, W-R-700) biochars. SZN is a neutral triazine herbicide that has a molecular structure very similar to atrazine. Although atrazine and SZN are capable of intermediate-strength H-bonding (Welhouse and Bleam, 1993), they do not form exceptionally strong bonds of the CAHB type (Xiao and Pignatello, 2016). In contrast to Xiao and Pignatello (2016) who studied the uptake of 2,4-D and atrazine at high concentration (Ce range ∼1–40 mg/L for 2,4-D and 1–20 mg/L for atrazine) from organic-free laboratory deionized (DI) water, this study found that the capability of 2,4-D, but not SZN, to form CAHB does not appear to have influenced herbicide uptake at micrograms per liter levels from surface water. If O-functional groups exerted a significant effect, sorption isotherms for CPTA and CAP biochars for SZN, but not 2,4-D, should collapse when normalized for adsorbent surface area. The significantly enhanced uptake of SZN by CPTA compared with CAP biochars shown in Fig. 4 must have occurred via mechanism(s) other than CAHB formation. Possible explanations for lack of influence by CAHB include that the low adsorbate concentrations (C0 in μg/L range) used in this study were not sufficient to compete with adsorbed water clusters for H-bond sites. This explanation is consistent with observations by Zhu and Pignatello (2005). Alternately or perhaps in addition to this explanation, it is possible that DOM, which was present at much higher concentration (4 mg/L TOC), outcompeted the herbicides for H-bond sites. Further study is needed to clarify the role(s) played by biochar surface functional groups and their potential contribution to adsorption of polar and ionizable MPs under environmentally representative solution conditions.
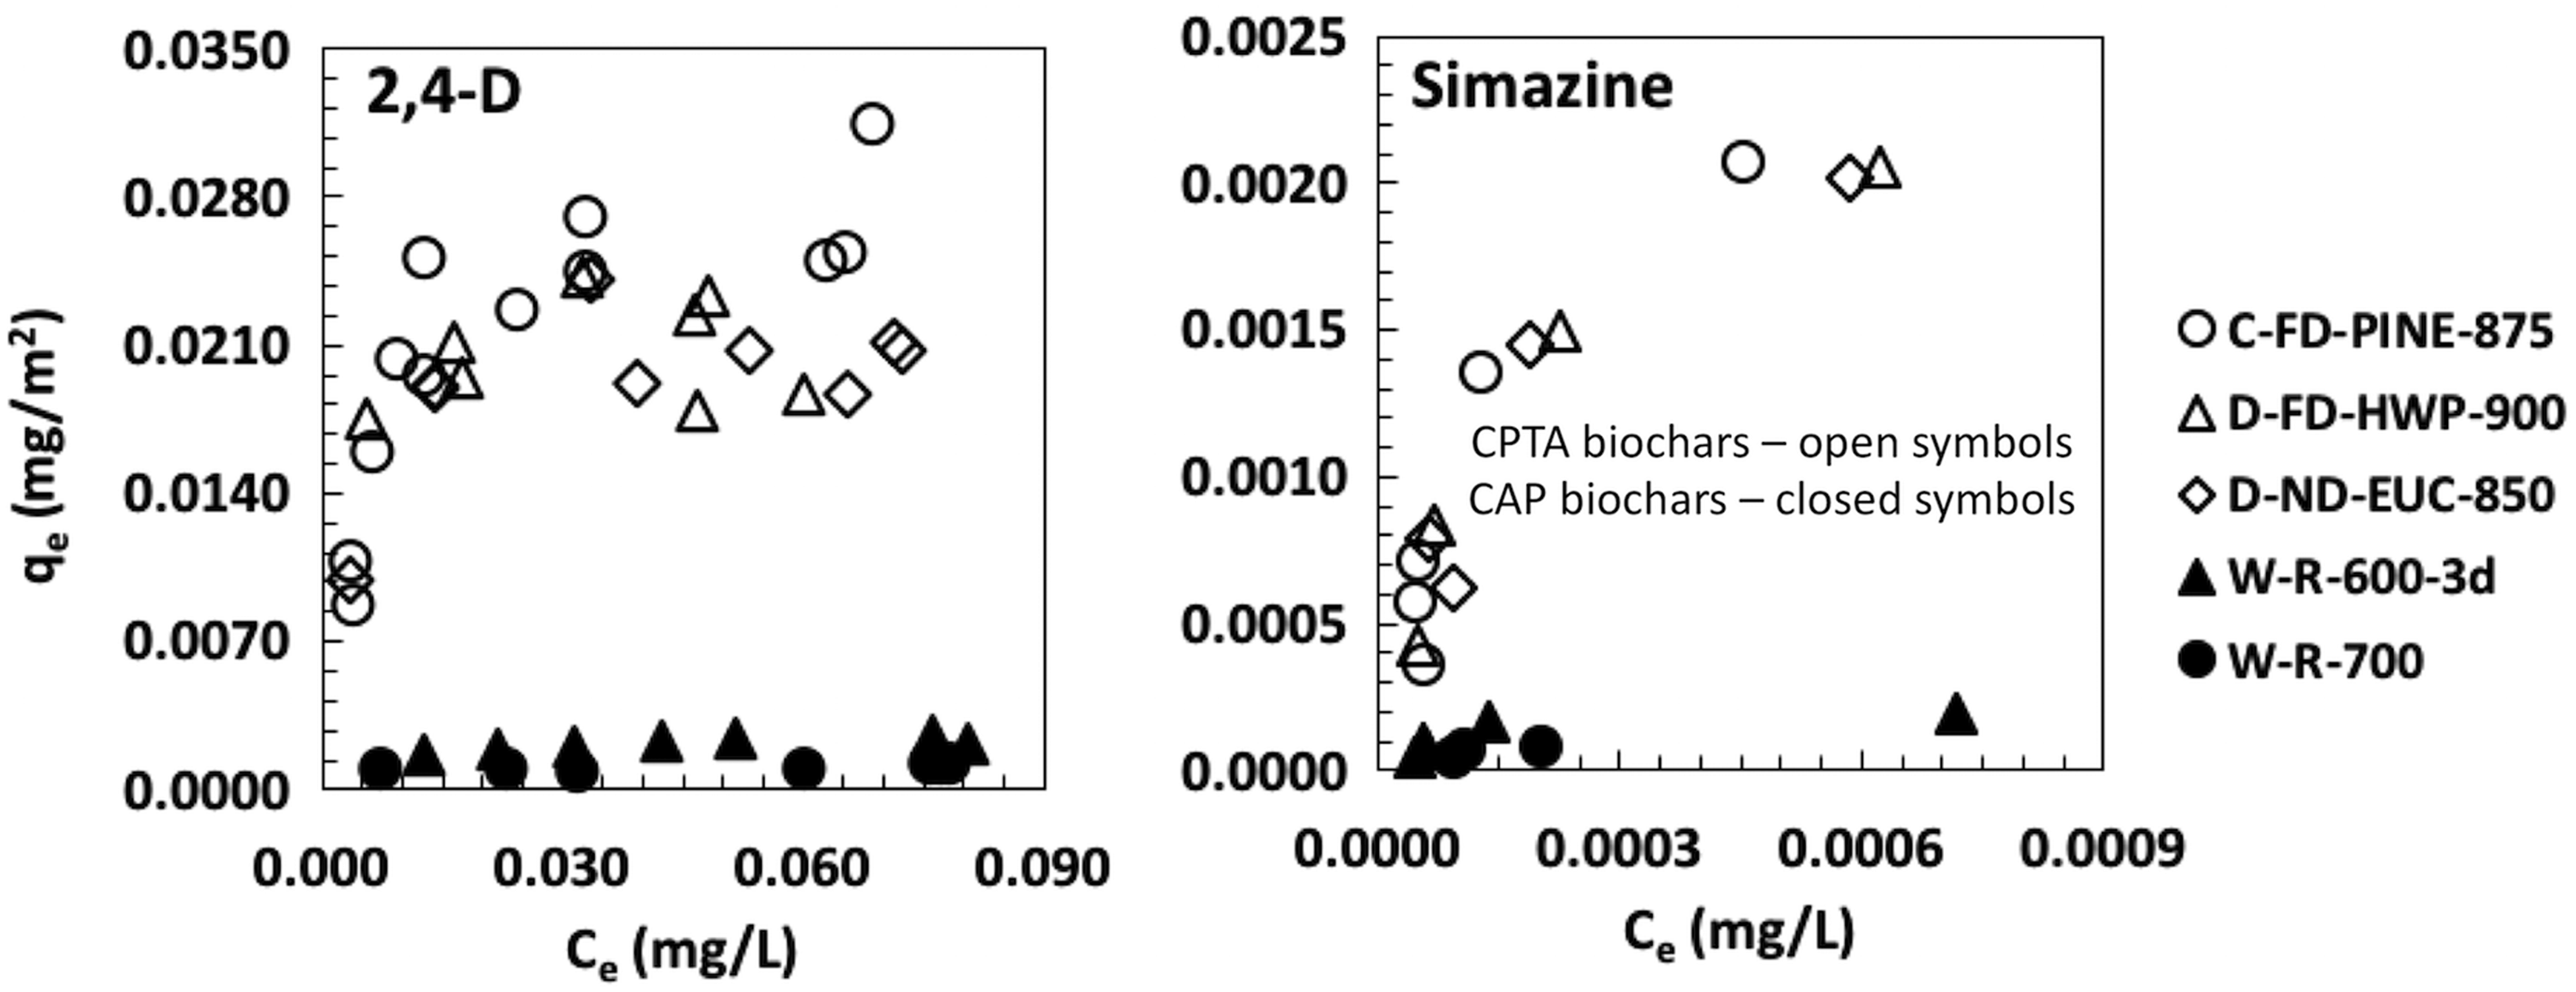
Surface area normalized equilibrium solid-phase concentrations (qe, mg/m2) of 2,4-D and SZN as a function of equilibrium liquid-phase concentration (Ce, mg/L) for CPTA (C-FD-PINE-875, D-FD-HWP-900, D-ND-EUC-850) and CAP (W-R-600-3d, W-R-700) biochars. SZN, simazine.
The influence of aerobic draft on biochar adsorption capacity II: The role of pore structure
Biochar total porosity and the distribution of pore volume between micropores (<2 nm) and mesopores (2–50 nm) are factors that influence MP adsorption, especially in the presence of DOM. Studies with AC have supported the hypothesis that greater mesoporosity can help to alleviate pore blockage and adsorbent susceptibility to DOM fouling (Pelekani and Snoeyink, 1999; Li et al., 2003). Mesopores appear to be important for facilitating diffusion of target compounds into pore networks and for providing pathways for molecules to access deeper and smaller pores (Xiao and Pignatello, 2015). Rajapaksha et al. (2014, 2015) observed an increase in mesoporosity and sulfamethazine uptake by biochars after steam activation and attributed this to improved pore accessibility. Lattao et al. (2014) and Xiao and Pignatello (2015) found that a model relating adsorption capacity to a weighted sum of microporosity and mesoporosity was more successful than surface area or elemental ratios for describing uptake of a range of neutral and ionized organic compounds by biochars. Xiao and Pignatello (2016) found that PPAO treatment of wood biochars increased micropore volume by a factor of ∼2–3, mesopore volume by up to a factor of 18, and significantly increased adsorption of five neutral nonpolar compounds and seven polar weak acids and bases. The authors postulated that PPAO could have facilitated the generation of new micropores, widened pore throats, improved pore connectivity, opened access channels to “blind” pores, and enlarged existing pores to generate increased mesoporosity through the etching of pore walls and removal of tarry substances deposited during pyrolysis (pore “reaming”) (Xiao and Pignatello, 2016). Modifying biochar pore structure in this manner is expected to increase pore accessibility and relieve steric hindrance to adsorption of MPs. A subsequent study (Xiao et al., 2018) found that PPAO treatment increased the surface area, porosity, and sorption capacity of neutral triazine herbicides (atrazine, prometon) and a natural estrogen (estriol) of biochars made from corncob pyrolyzed at 300–700°C. PPAO effects on pore development and organic compound sorption were modest for biochars pyrolyzed at low temperature and greater for chars made at 600°C and 700°C. PPAO increased the surface area of 600°C and 700°C chars from negligible to 300–350 m2/g. The authors found that organic compound sorption correlated well with surface area below but not above 300 m2/g. They speculated that mesoporosity developed during PPAO via the pore reaming effect was responsible for the increased uptake of organic compounds by chars with surface areas of >300 m2/g (Xiao et al., 2018).
Building on the available literature, the present study tested the hypothesis that a combination of high temperature and the presence of air/oxygen during pyrolysis could facilitate pseudo-activation conditions resulting in greater microporosity and mesoporosity and capacity for uptake of MPs by biochars. Figure 5 illustrates the relationship between 2,4-D surface loading onto the carbonaceous fraction of CPTA biochars, CAP biochars, and ACs at Ce 30 μg/L (qe30) and N2 BET surface area. 2,4-D surface loadings onto adsorbent CM are expressed on the basis of mass (mg/gCM) and surface area (mg/103 m2CM). Data are provided in Supplementary Table S2a. For comparison, CAP biochars generated from BAM, EUC, LON, and PINE at 700°C and 850°C for 8 h, and EUC at 600°C for 3 days, exhibited qe30 values ranging from 0.3 to 1.1 mg/gCM and surface areas ranging from 267 to 421 (average 366) m2/gCM (Supplementary Table S2b; data from Kearns et al., 2015a). CPTA biochars generated from BAG, BAM, CHER, JAT, and PINE under moderate-draft-moderate-temperature conditions (MDMTCPTA) at 600–650°C exhibited similar 2,4-D surface loadings (0.3–1.0 mg/gCM) (Supplementary Table S2a). However, surface areas of MDMTCPTA biochars ranged from 92 to 287 (average 173) m2/gCM (Supplementary Table S1a) and were about half those of CAP biochars. This suggests that, although MDMTCPTA biochars were generated at lower temperature and exhibited lower surface areas than the CAP biochars, a greater portion of the MDMTCPTA biochars' surface area was accessible to 2,4-D. This observation supports the hypothesis that the ingress of oxygen during pyrolysis can facilitate pore “reaming” and increase the accessibility for MPs.
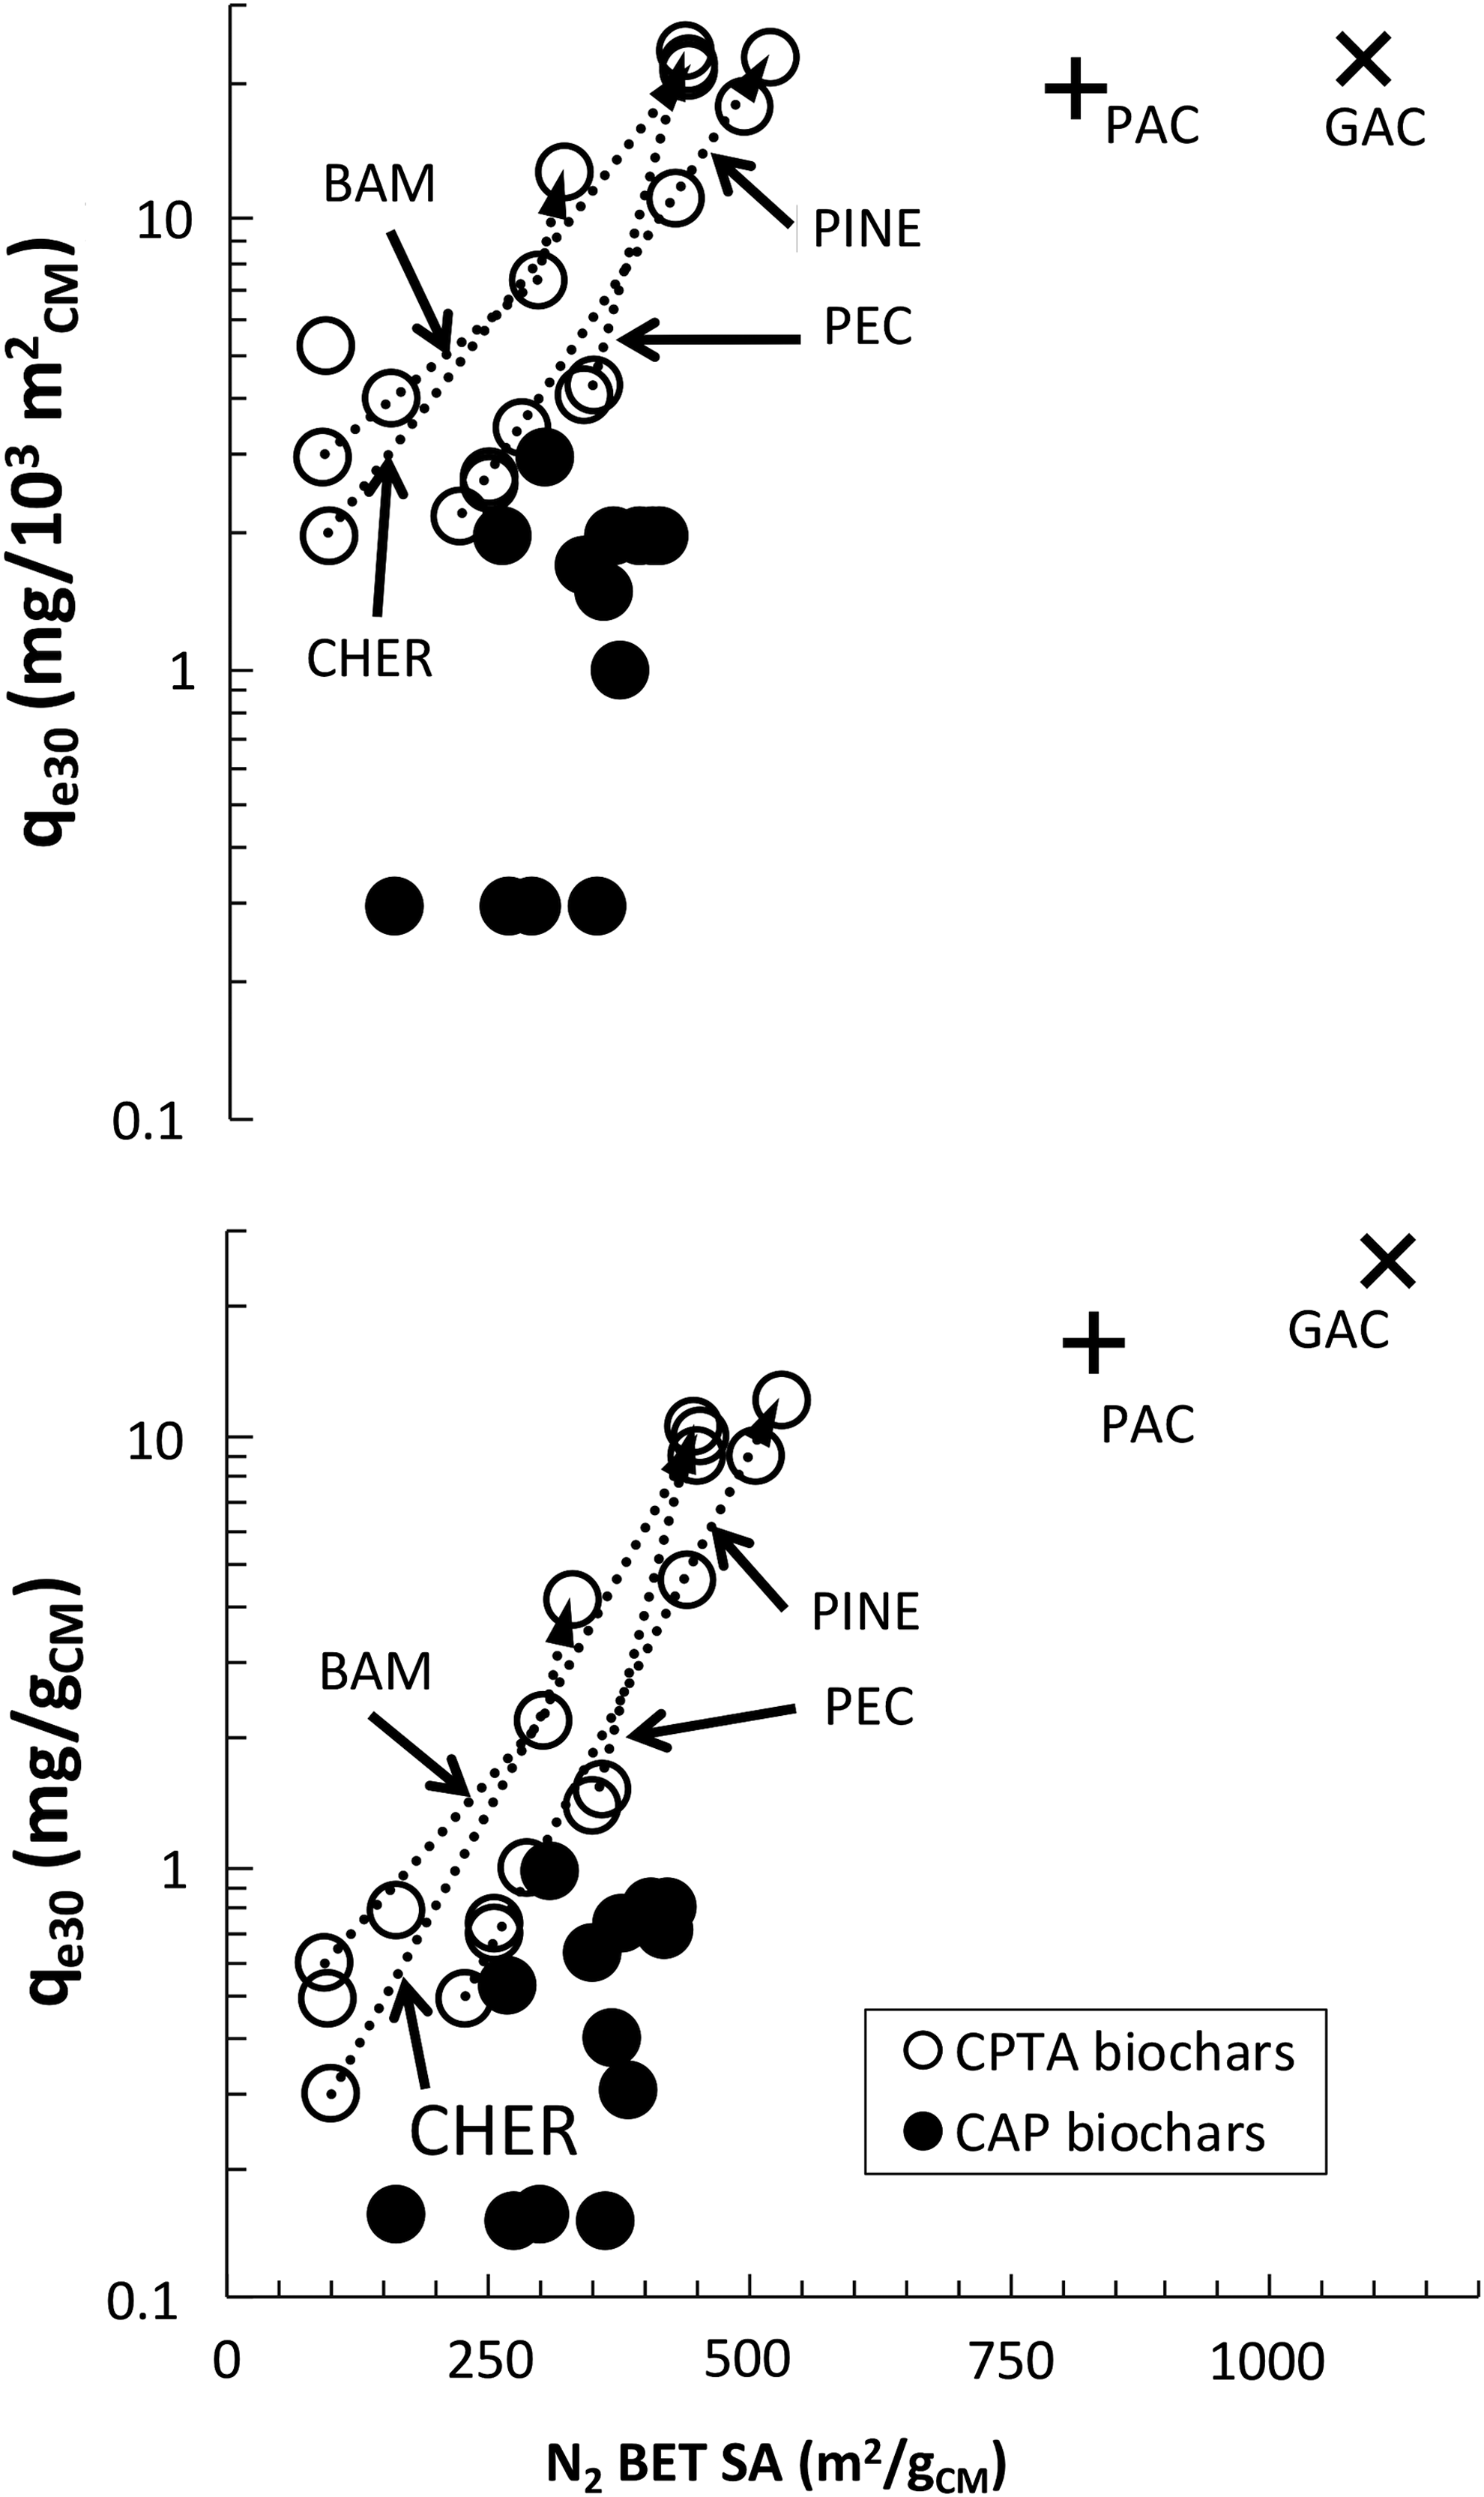
The relationship between 2,4-D surface loading onto the carbonaceous fraction of CPTA biochars, CAP biochars, and ACs at Ce 30 μg/L (i.e., qe30), and N2 BET surface area. 2,4-D surface loadings onto adsorbent CM are expressed on the basis of mass (mg/gCM) and surface area (mg/103 m2CM). Data are provided in Supplementary Table S2a. ACs, activated carbons.
As evident in Fig. 5 showing data reported in Supplementary Table S2a, CPTA biochars generated at 850–900°C (i.e., high-draft-high-temperature conditions, HDHTCPTA) from CHER, PEC, PINE, HWP, and EUC exhibited 2,4-D surface loadings of 9.0–12.3 mg/gCM and surface areas ranging from 446 to 529 (average 476) m2/gCM. In contrast, CAP biochars generated at 850°C (i.e., low-draft-high-temperature conditions, LDHTCAP) exhibited 2,4-D surface loadings of 0.7–1.1 mg/gCM and surface areas of 309–421 (average 378) m2/gCM. Thus, on average, HDHTCPTA biochars exhibited ∼1.25 times the surface area of LDHTCAP biochars and about 2.75 times the surface area of MDMTCPTA biochars, but more than 10 times the 2,4-D adsorption capacity. This observation lends further support to the hypothesis that the structure of pores formed during the HDHTCPTA process is important for adsorption of organic compounds from water.
The upper panel of Fig. 5 indicates that HDHTCPTA biochars exhibited similar 2,4-D surface loading at Ce 30 μg/L to ACs on a surface area-normalized basis: 17.8–23.8 mg/103 m2CM for biochars versus 19.8 and 22.8 mg/103 m2CM for PAC and GAC, respectively. Congruent with this, the right side panels of Fig. 2 show that the isotherms for HDHTCPTA biochars overlay with ACs when plotted on a CM surface area normalized basis. On a CM mass basis, PAC exhibited 1.7 times the surface area and 1.6 times the 2,4-D adsorption capacity as HDHTCPTA biochars. GAC exhibited 2.3 times the surface area and 2.5 times the 2,4-D adsorption capacity as HDHTCPTA biochars. This suggests that the pore accessibility for 2,4-D is similar for HDHTCPTA biochars and ACs. Greater 2,4-D uptake by ACs compared with HDHTCPTA biochars could be explained by AC possessing a greater number of ideally sized pores. As illustrated by Figs. 2 and 5, biochars generated under low-to-moderate temperature or draft conditions either did not develop a large population of pores sized appropriately for 2,4-D or generated such pores, but they were blocked by residual tarry matter that HDHTCPTA removed through oxidative thermochemical “reaming” (Xiao and Pignatello, 2016).
Biochar H:C ratio and MP adsorption
Based on a meta-analysis of 29 studies of NOC sorption by carbonaceous adsorbents, Hale et al. (2016) proposed H:C ratio (in units of mol-%) as a screening metric for biochar adsorption performance. H:C ratio provides an indicator of biochar aromaticity and declines with increasing pyrolysis temperature reflecting increased carbonization of the feedstock. Hale et al. (2016) found that NOC sorption correlated well with H:C ratios for wood-based (i.e., low-ash content) biochars but less so for high-ash biochars derived from diverse precursors including animal manure and sewage sludge. Using the anion sulfamethoxazole (SMX) as a target adsorbate, Shimabuku et al. (2016) also reported a strong positive correlation between H:C ratio and the dose of adsorbent CM surface area required to achieve 75% uptake (termed SAdose75%, in m2CM/L) from laboratory clean (DI) water for wood-based low-ash (≤6.3%) biochars. Shimabuku et al. (2016) also quantified SMX adsorption from surface water compositionally similar to the surface water used in the present study (SurW) and from WW. Graphical relationships between SMX SAdose75% and H:C ratio in DI, SurW, and WW are given in Supplementary Fig. S3 for reference. Fitted trendline slope factors and correlation coefficients (R2 values) are referred to as a basis for comparing adsorbent groups.
The high-ash biochars investigated by Shimabuku et al. (2016) were generated at 850°C from various WW solids, exhibited ash contents ranging from 54% to 82% (average 71%) and H:C ratios ranging from 0.18 to 0.42 mol-%, and evinced no relationship between H:C ratio and SAdose75% for SMX uptake from DI water (slope factor 0.2, R2 = 0.01). In SurW and WW, the slope factors were 0.9 and 0.4, respectively, and the R2 values were 0.05 and 0.01, respectively. Likewise in this study, for biochars ranging in ash content from 8.2% to 62% (average 21%), no relationship was observed between biochar H:C ratio and the adsorbent CM surface area dose required to achieve Ce = 30 μg/L 2,4-D (SAdose30, in units of m2CM/L) in surface water (Fig. 6; slope factor 1.9, R2 = 0.04). One reason for the lack of systematic relationship between H:C content and adsorption capacity in high-ash biochars is unsurprising is that adsorption takes place primarily in the CM fraction of the adsorbent (Shimabuku et al., 2016), while elements such as C, H, and in particular O are distributed between the CM and ash minerals (typically oxides, oxy-hydroxides, silicates, and carbonates). Quantifying the elemental constituents of the CM fraction alone presents methodological challenges as ash and CM are often intermingled and are not easily separable by chemical or physical processes without altering the CM (Lou et al., 2011; Zhang et al., 2013). Experimental error for low-ash biochars is proportionally smaller and thus permits better elemental trend resolution.
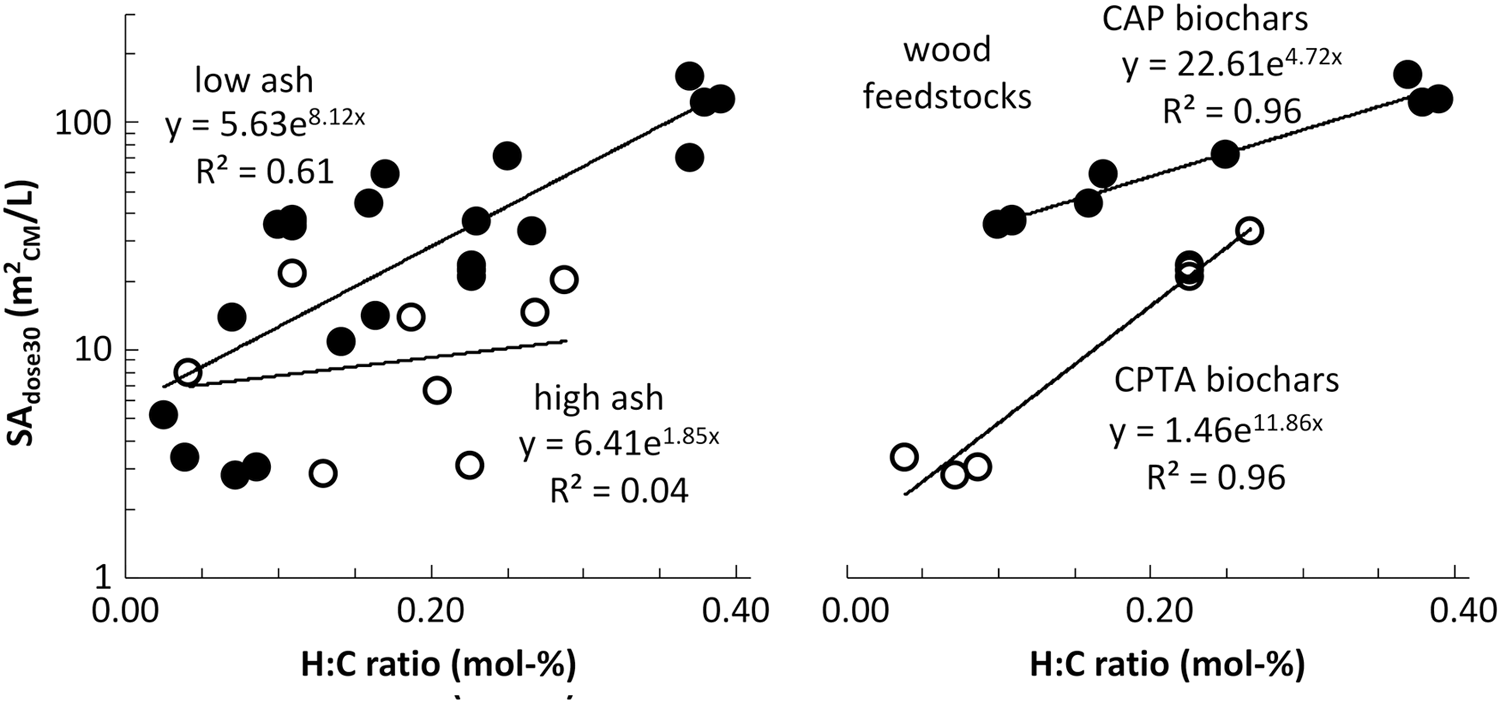
Relationships between 2,4-D adsorption (expressed as SAdose30, which is the SA—normalized dose of CM—required to achieve Ce 30 μg/L) and H:C ratio (mol-%) comparing low-ash (<7%) and high-ash (>7%) biochars (left panel) and comparing low-ash CPTA and CAP biochars (right panel). SA, surface area.
The wood-based biochars investigated by Shimabuku et al. (2016) included two CPTA biochars also used in this study (C-ND-PINE-625 and C-FD-PINE-875) and two CAP biochars referenced in this study and discussed in detail in a previous study (Kearns et al., 2015a) (W-R-850 and W-R-350-4d), as well as a commercial CAP biochar made from pine wood chips. While Shimabuku et al. (2016) reported a strong positive correlation between H:C ratio of low-ash adsorbents and SMX uptake from DI water (slope factor 8.9, R2 = 0.95), the relationship was weaker and the data more scattered for SMX uptake from water containing background DOM. In SurW and WW, the slope factors were 4.4 and 5.7 and the R2 values were 0.78 and 0.79, respectively (Supplementary Fig. S2, left panels). However, when the data for wood-based low-ash biochars are segregated by pyrolysis reactor type—CAP versus CPTA—distinct trends emerge (Supplementary Fig. S3, right panels). The study by Shimabuku et al. (2016) examined only two CPTA biochars, three CAP biochars in the case of SurW, and two CAP biochars in the case of WW. The slope factors were very different for the biochars produced from the two reactor types—9.5 (SurW) and 8.2 (WW) for CPTA biochars compared with 3.7 (SurW) and 2.7 (WW) for CAP biochars. The present study compared 2,4-D sorption by several wood-based low-ash (<7%) CAP biochars (PINE, EUC, and LON woods pyrolyzed at 550°C, 700°C, and 850°C for 8 h) and CPTA (PINE pellets generated in a cookstove gasifier under varying draft, temperature, and quenching conditions, and HWP and EUC in a drum oven gasifier). As a group, the low-ash biochars exhibited a relationship of moderate strength between 2,4-D uptake and H:C ratio (slope factor 8.1, R2 = 0.61; Fig. 6, left panel). Segregating the data into CAP and CPTA groups revealed distinct trends—slope factors were 11.9 and 4.7 and the R2 values were 0.96 for CPTA and CAP biochars, respectively (Fig. 6, right panel). Compared with H:C ratios, robust correlations were not observed between biochar O:C ratios and adsorption of 2,4-D from surface water or SMX from SurW or WW (R2 values 0.17–0.41; Supplementary Fig. S4).
These observations suggest that there are physical differences in the pore structures of biochars generated from different reactor types. As evidenced by their different slope factors (Fig. 6, right panel), it appears that increasing the degree of feedstock carbonization (indicated by decreasing H:C ratio) exerts a stronger effect on the development of adsorption capacity in CPTA biochars compared with CAP biochars. Mechanistically, this could be explained in a manner consistent with the oxidative thermochemical pore “reaming” hypothesis advanced by Xiao and Pignatello (2016), as well as previous work that suggested that pyrolysis conditions influence the generation of pores within a size range suitable for high-energy adsorption of target molecules such as 2,4-D (Kearns et al., 2014) and triazine herbicides (Xiao and Pignatello, 2015). It is noteworthy that different trends in elemental content emerge for CPTA and CAP biochars in water containing background DOM, but the adsorbent trends appear to align in “organic-free” background such as DI water (Supplementary Fig. S3, top right panel). A possible explanation for this observation is that while CPTA and CAP biochars generated at high temperatures exhibit significant microporosity, pore “reaming” that occurs during CPTA generates increased mesoporosity (Fig. 1, lower panels), which can mitigate the effects of DOM fouling as previously noted. Studies with ACs have demonstrated that sorbents with greater mesoporosity are less susceptible to reduction in MP adsorption capacity by DOM compared with sorbents that are more homogeneously microporous (Pelekani and Snoeyink, 1999; Matsui et al., 2002a, 2002b; Li et al., 2003). Substantiating this for biochar adsorbents requires further investigation, but the results presented here support this hypothesis.
In summary, previous studies (Hale et al., 2016; Shimabuku et al., 2016) have stated that using H:C ratio as a screening metric for adsorption capacity might only be valid for low-ash biochars and within compositionally homologous feedstock classes (e.g., woods). The present study indicates that the pyrolysis environment—in particular the extent of aerobic draft—could further constrain the application of H:C ratio as a robust adsorption screening metric within pyrolysis reactor typologies. In particular, the role of biochar pore structure in MP adsorption, especially in the presence of DOM, appears to be important and deserves further investigation.
Herbicide desorption
Figure 7 indicates the percentage of adsorbed 2,4-D remaining adsorbed after 4 weeks of agitation in surface water (initially absent 2,4-D) for 10 CPTA biochars. Values given are averaged from three or four 2,4-D-preloaded adsorbent doses for each biochar. 2,4-D surface loadings at the start of desorption experiments ranged from 0.3 to 9.4 mg/gBA. For a given biochar, 2,4-D retention did not vary substantially between adsorbent doses or surface loadings as reflected by error bars indicating one standard deviation in Fig. 7. 2,4-D retention values for individual adsorbent doses are given in Supplementary Fig. S5. Average 2,4-D retention by the adsorbents ranged from 76% to 99%. Eight of 10 biochars tested retained ≥90% of adsorbed 2,4-D after 4 weeks of agitation. C-ND-CHER-650 and FD-RH biochars exhibited 81% and 76% average 2,4-D retention, respectively. 2,4-D retention was slightly higher for BAM and CHER cookstove biochars generated at 825°C and 875°C (99% and 96%, respectively) than for BAM and CHER biochars generated at 650°C (92% and 81%, respectively). Desorption results reported here are preliminary and exploratory—further study is needed to assess the potential for pollutant desorption from different biochars and under different solution conditions.

Percent 2,4-D retained on biochar adsorbents after 4 weeks of agitation in surface water initially absent 2,4-D for select CPTA biochars. Values shown are averaged from three or four 2,4-D-preloaded adsorbent doses for each biochar; error bars indicate one standard deviation. 2,4-D retention values for individual adsorbent doses are given in Supplementary Fig. S5.
Conclusions
Under the experimental conditions studied here, increasing draft and temperature from 600–650°C to 850–900°C during aerobic gasification (CPTA) pyrolysis increased biochar surface area by a factor of 2.75 (from ∼175 to 475 m2/gBA) and increased 2,4-D adsorption capacity by more than a factor-of-10 (from ∼0.6 mg/gBA to 9.4 mg/gBA). Similarly, for biochars generated at ≥850°C under high aerobic draft compared with CAP conditions, high draft gave rise to a more than factor-of-10 increase in 2,4-D adsorption capacity (from ∼0.8 mg/gBA to 9.4 mg/gBA). CPTA biochars generated at 600–650°C exhibited ∼50% of the surface area of CAP biochars generated at 700–850°C but evidenced similar 2,4-D adsorption capacity. Slightly oxidizing conditions during pyrolysis, such as induced by high draft (either fan forced or naturally achieved) conditions, are postulated to facilitate “reaming” or thermochemical clearing of tarry matter, along with possibly widening pores and interconnecting pore networks. This appears to significantly facilitate biochar adsorption of trace organic compounds from water. Under environmentally relevant solution conditions (i.e., MPs at sub-μg/L to μg/L levels and in the presence of DOM at much higher concentrations), charge-assisted H-bonding to biochar surface functional groups did not appear to contribute significantly to 2,4-D adsorption.
HDHTCPTA biochars exhibited 42–61% the capacity of ACs on a per-mass (of BA) basis and approximately equivalent capacity (95–110%) on a surface area (of CM) normalized basis for uptake of 2,4-D at an initial concentration of 100 μg/L from surface water with a background TOC of 4 mg/L. Wet quenched biochar exhibited an ∼40% increase in herbicide adsorption capacity compared with dry quenched CPTA biochars; however, more investigation is necessary to validate preliminary observations of this study on quenching method effects. Biochars did not exhibit a large amount of 2,4-D desorption—8 of 10 biochars tested retained ≥90% of adsorbed 2,4-D after 4 weeks of agitation in surface water. This study provides support for the use of H:C ratio as a screening index for organic compound adsorption by biochars generated from compositionally homologous low-ash feedstocks. However, when background DOM was present, trends correlating H:C ratio with herbicide adsorption diverged for biochars produced via CPTA versus CAP conditions. Thus, H:C ratio might serve as an adsorption screening metric within but not between different pyrolysis reactor typologies. This study advances the potential for scalable production and application of enhanced biochar adsorbents under environmentally friendly and economically favorable conditions.
References
Supplementary Material
Please find the following supplemental material available below.
For Open Access articles published under a Creative Commons License, all supplemental material carries the same license as the article it is associated with.
For non-Open Access articles published, all supplemental material carries a non-exclusive license, and permission requests for re-use of supplemental material or any part of supplemental material shall be sent directly to the copyright owner as specified in the copyright notice associated with the article.