
Abstract
Abstract
In this study, the application mode and evaluation methods of green and sustainable remediation (GSR) were investigated in a soil remediation project. On-site equipment, materials, and energy usage were recorded, and environmental footprints were calculated using qualitative and semiquantitative methods. Replacement of equipment with appropriate power, reduction of redundant drive routes, increase of the reuse ratio of on-site and off-site materials, and optimization of remediation among other improvements should be implemented. Conventionally, the total air pollutant emission, water consumption, energy use, and greenhouse gas (GHG) emission were 1,682 kg, 3,093 t, 249.5 MWh, and 320 t CO2e, respectively. Furthermore, on basis of 10 best management practices (BMPs) selected, the all-life cycle of the project was optimized using the GSR concept by eliminating inappropriate practices; redundant drive route was reduced by 19.8% using ArcGIS and TravellerAPP, while the reuse ratio and remediation method were theoretically optimized. Environmental footprint and accident risk of remediation were sharply reduced based on a combination of BMPs and quantitative evaluation. Air pollutant emission, hazardous gas, water, and energy consumption were reduced by 46.2%, 50.8%, 28.3%, and 40.5%, respectively, and GHG emission decreased by 147.4 t. Finally, confronting barriers and recommendations for GSR administration particularly in developing countries were summarized. This study theoretically and practically applied the GSR concept to an actual project in China. Association of on-site data with remediation activities and its optimization can provide technical and administrative support for GSR development and engineering practices.
Introduction
Hazardous substances, such as heavy metals and organic pollutants, can contaminate soil and be harmful to artificial and natural environments through adsorption, desorption, leaching, evaporation, or direct contact. Currently, stabilization and chemical oxidation are widely used in both developed and developing countries to treat contaminated soils (Leštan et al., 2008). However, remediation itself may cause pollution, leading to extra greenhouse gas (GHG) emission and energy use, SO2 and NOx emission, additional water consumption, remediation agent preparation and application, land use for excavation and ex-situ remediation, and potential accident exposure to staff (Ellis and Hadley, 2009; Hou and Al-Tabbaa, 2014; Sheldon, 2014).
The green and sustainable remediation (GSR) concept may optimize remediation by advocating for the elimination of extra environmental footprints and negative benefits (Sheldon, 2014; Yasutaka et al., 2016). The key concept of GSR is that balance of economic, social, and environmental impacts, which are integrated into site management decisions, must be achieved through sustainable remediation. The total life cycle assessment of GSR can be divided into qualitative, semiquantitative, and quantitative classes of evaluation; social impacts, including human health and safety, community satisfaction, or end land use, are expected to be qualitative (ITRC, 2011).
Implementation of protection programs for sites contaminated by heavy metal and organic pollutant has been a great challenge in China, with a large number of contaminated farmlands yet to be resolved (Zhao et al., 2014; Yan et al., 2016). According to a recent survey, up to 16.1% of all soil and 19.4% of agricultural soil exceed soil quality standards (Hou and Li, 2017). Currently, remediation processes, particularly in developing countries, tend to be large in scale, extensive in operation, and inappropriately managed (Li and Jiang, 2004; Chen, 2007). Local governments have addressed only temporary situations, focusing more on the elimination of target pollutants; thus, there is minimal follow-up evaluation carried out after termination of a remediation project (Mengyao, 2010).
Although a comprehensive survey revealed that the awareness of sustainability remediation in China and other Asian countries is the highest in the world, many environmentalists and administrators fail to fully understand basic methods of GSR application, resulting in insufficient and ineffective programs; therefore, applying the GSR concept into engineering practices remains a problem in China (Hou et al., 2016). Currently, on-site data and environmental footprints have not been systematically reported, especially in developing countries, and the GSR concept has not been widely considered or used as an optimization tool in site remediation. Moreover, high cost, lack of regulation, and the need for expertise present additional barriers (Hou et al., 2016). A key challenge to the application of GSR is that social aspects are not incorporated into the method. Even in some developed countries like Japan, GSR evaluation and management face great challenges due to cultural and social norms (Sarra and Nakahigashi, 2012).
In 2016, the Action Plan for Soil Pollution Prevention and Control was issued by the State Council in China to serve as a guiding principle for site remediation. In the same year, perception of stakeholders and their influence on GSR (including those in China) were evaluated (Hou, 2016). The government has also called for a more thorough focus on information access and respective interests of targeted groups, including site owners, regulators, environmental consultants, contractors, and technological suppliers. Several researchers have directed their attention to GSR evaluation and application by focusing either on the assessment system or the case studies. A sustainability assessment system has been established on the basis of five agricultural land remediation practices, in which agricultural information was added to the traditional social, economic, and environmental index (Hou et al., 2017). Two other remediation technologies have been studied as a comparison in China using multicriteria analysis evaluation system and sensitivity analysis. The current administrative system is not preferable for GSR application in China and there is therefore a need to establish GSR framework within existing policy (Song et al., 2018).
In this study, development of a GSR concept and its management/application mode, along with the evaluation system throughout the world, were summarized. The green and sustainable index of a soil remediation cases were evaluated using qualitative and quantitative evaluation systems, mainly in terms of environmental benefits, while investment, remediation time and cost, and social benefits were also considered. A combination of best management practices (BMPs) and Spreadsheets for Environmental Footprint Analysis (SEFA) was used to evaluate environmental footprint reduction (U.S. EPA, 2013). Economical consideration was not quantified, but instead was combined in the strategy selection in BMPs. Risk assessment was calculated using Sitewise™, and the barriers and recommendation on GSR application in China were also presented. The main objective of this study was to reveal the effects of GSR application mode on a remediation project, reflect the optimization pattern under environmental consideration, and establish a feasible management system for GSR application to help provide technical and administrative support for the development and engineering practices of GSR.
Materials and Methods
Brief introduction of case study project
This soil remediation case study focused on a contaminated site located in the northwestern region of Shanghai, China, which contained industrial plants for steel producing and petroleum engineering application; other parts of this site were once used as farmland. This site is likely contaminated with heavy metals, petroleum hydrocarbon, and pesticides. The simplified layout of the original map is shown in Fig. 1 and Supplementary Fig. S1 (fuzzy treated). The remediation site is roughly divided into three parts by two interposing rivers; the area with the red outline was once allocated for residential use and the blue outline was allocated for industrial use; some residential buildings are located on the east of the three units. The total surface area is 10.879 ha.
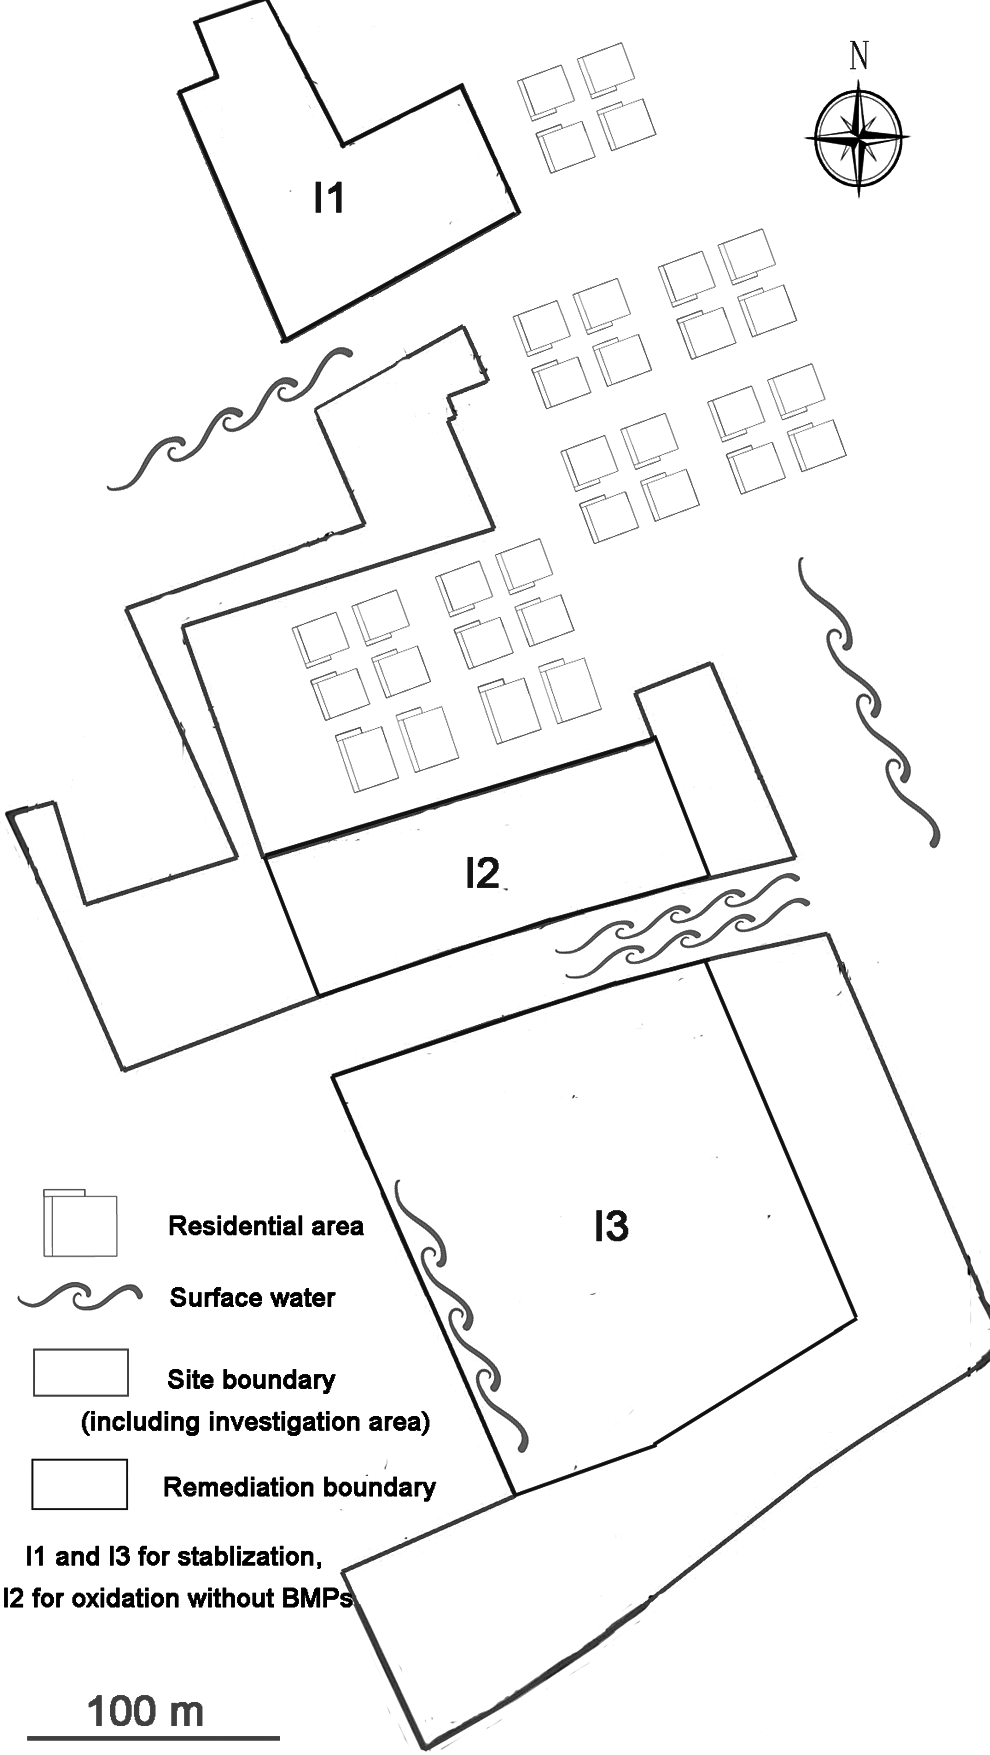
Layout of contaminated site and its unit division.
Area I2 is contaminated by organic pollutants (oil and pesticide) and Areas I1 and I3 are contaminated by heavy metals. The site investigation (SI) practices covered the whole area of the three units (red outline, Fig. 1), while the remediation and dismantling practices covered ∼10% of the whole industrial area (Areas I1, I2, and I3, respectively). The remediation land area, pollutants, and remediation methods are listed in Table 1, and the specific borders of I1, I2, and I3 are indicated by the blue outline in Fig. 1.
Pollution and Remediation Information on Contaminated Site
Data analysis and GSR evaluation
Data collection and analysis
The background information for this study was collected from engineering practices or simulation. Part of the equipment and power level were chosen from the SEFA list, while others not on the list, such as concrete surface drillers, direct push machines, and others, were added (U.S. EPA, 2013). Personnel transportation, electricity use, and other specific data were collected on-site or cited from the unpublished project completion report. Pollutant emissions (NOx, SOx, and particulate matter [PM]) were estimated by SEFA analysis based on previous data (fuel usage, loading factors, and operation time). The total pollutant emissions involved life cycle assessment-based impacts, and the on-site and total waste emission were simulated. Off-site impacts were correlated with material usage, including transportation of materials or waste from the contaminated site to the landfill, and were simulated using SEFA analysis. The manufacturing of materials used specifically for this project was considered, while that of equipment was not considered; however, the transportation of equipment outside the site was considered.
GSR evaluation
BMP evaluation was performed based on relevant studies, including pre-evaluation, prioritization, selection, and implementation (Fig. 2) (Petruzzi, 2011). Pre-evaluation of BMPs was chosen from relevant and recent research reports that provided a comprehensive list of BMPs in accordance with the GSR concept (EPA, 2008; ASTM, 2013). Seventeen BMPs were ranked by importance (from low to high priority) based on the policies and regulations in China. If selected, BMPs were in the same row in the third column. For step 4 (fourth column), future implementation of BMPs for the ongoing project was planned based on communication with the engineering group.
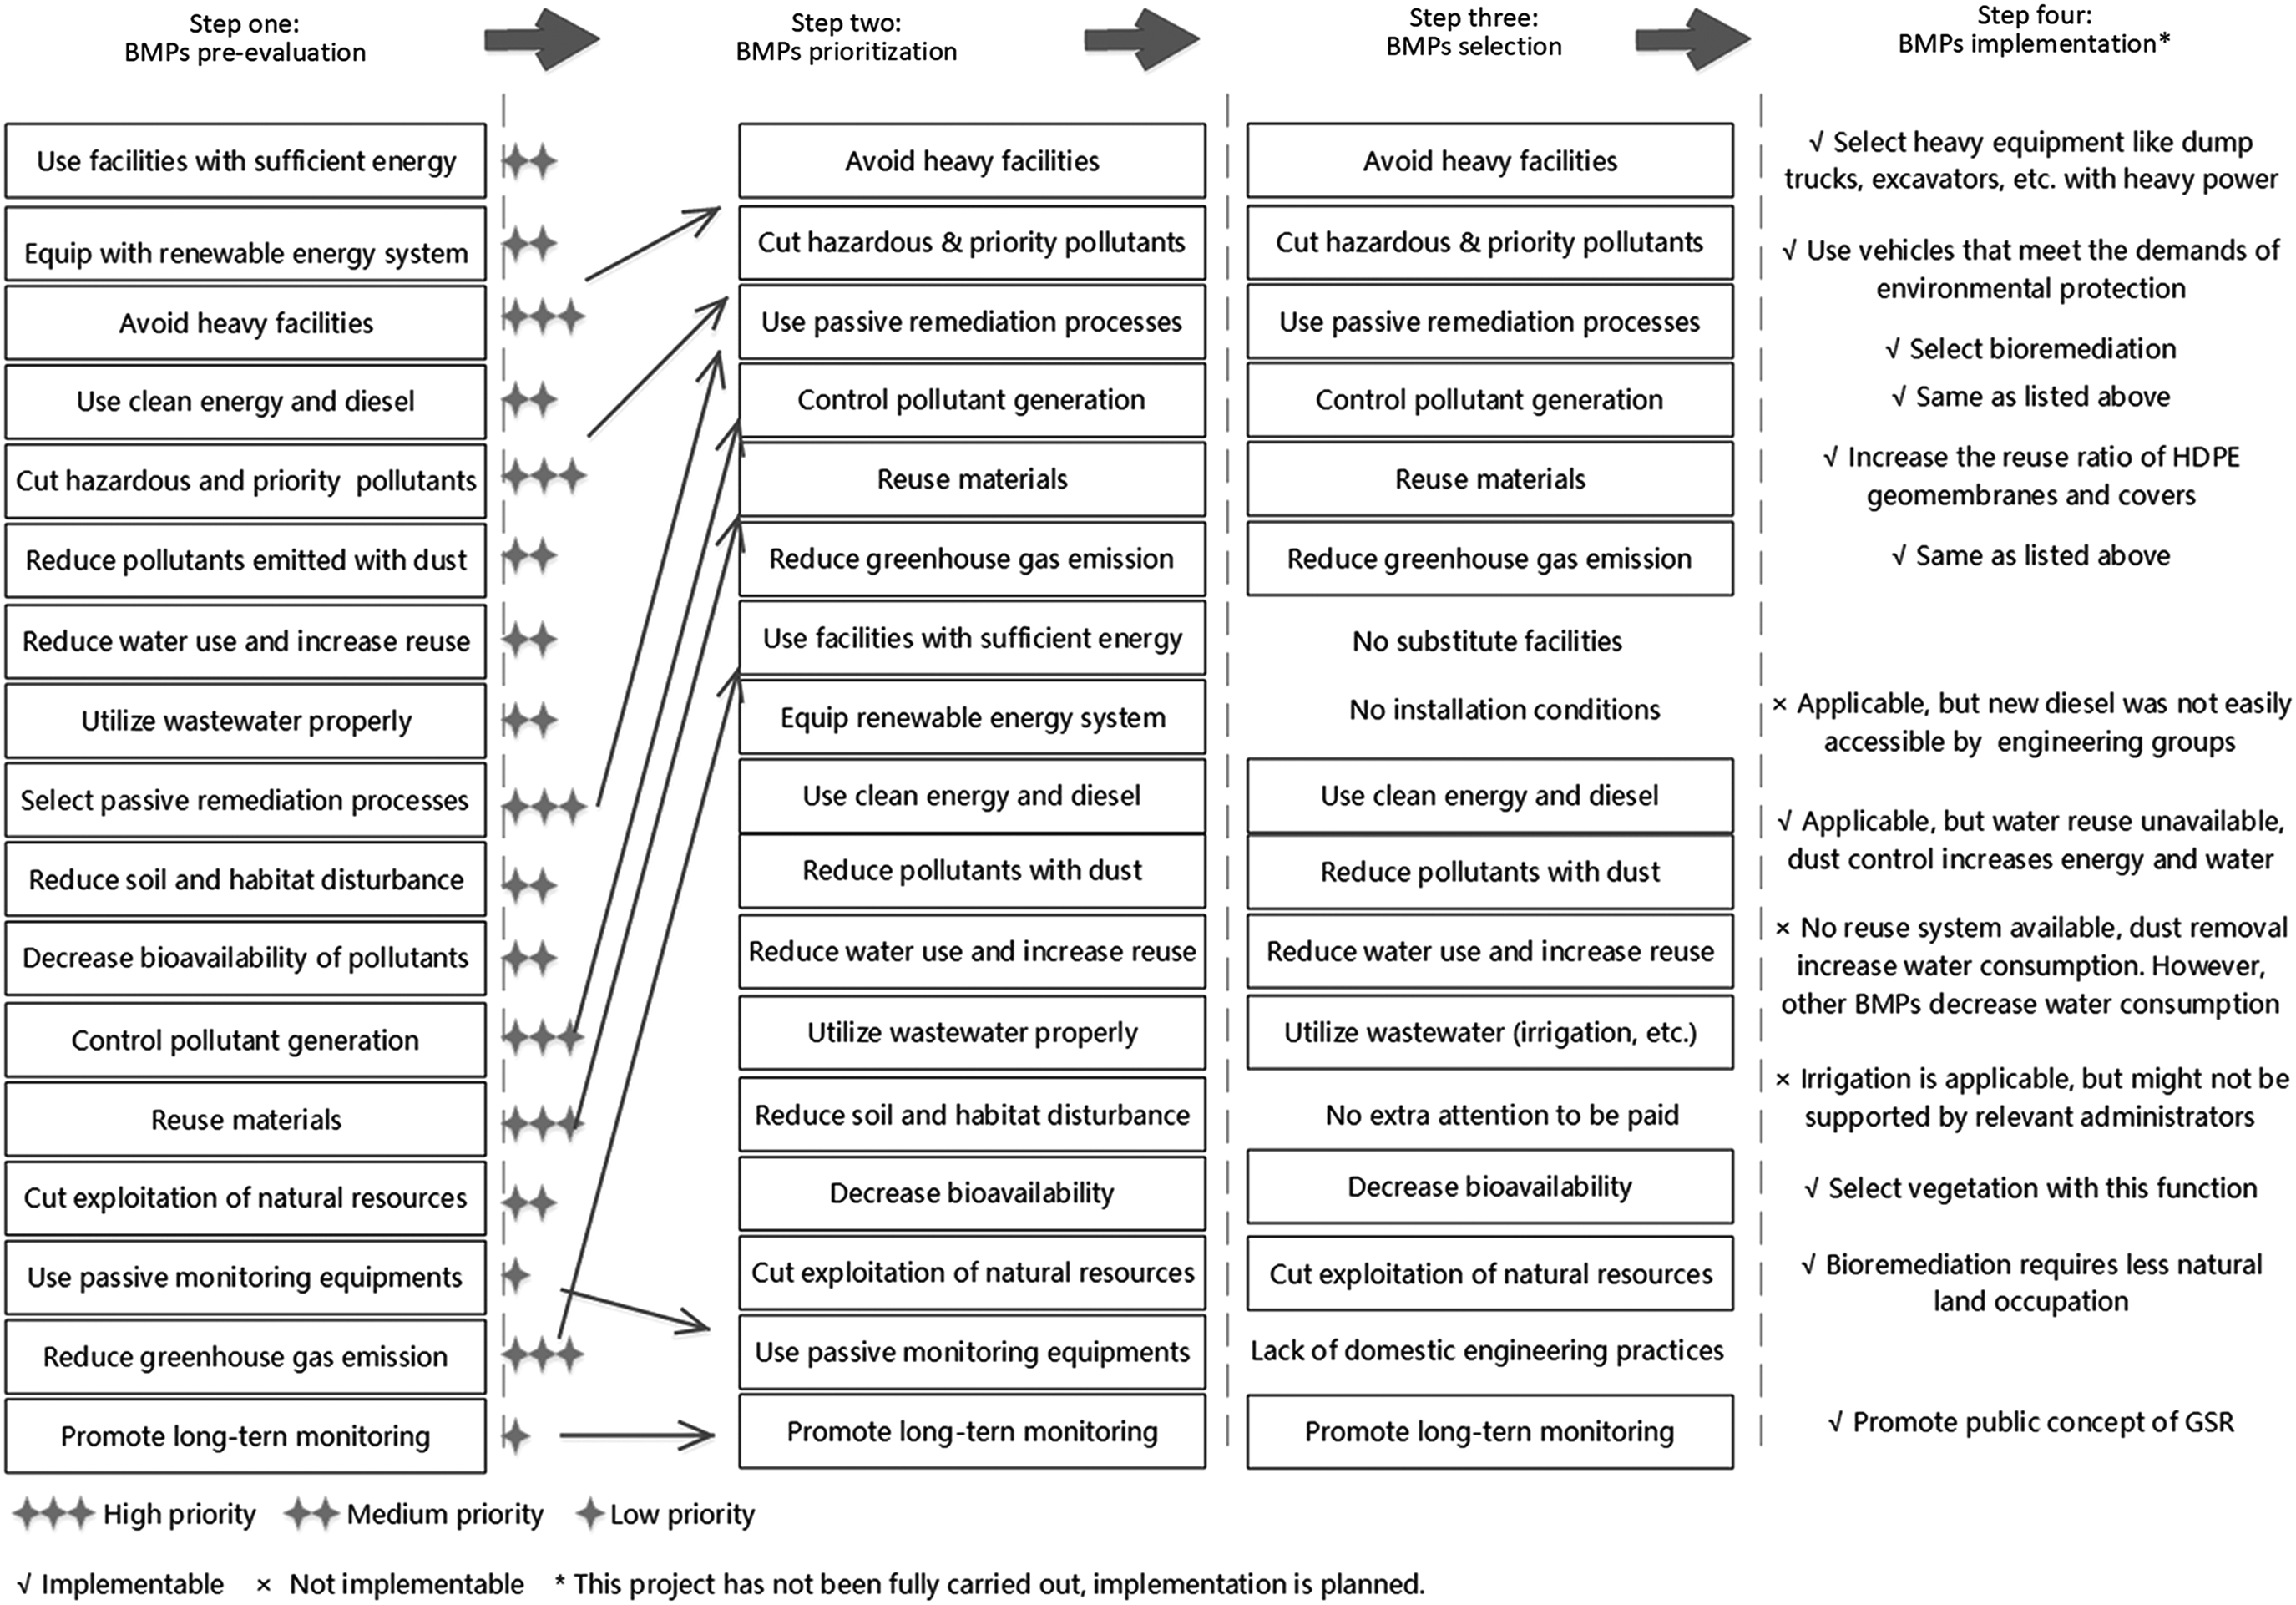
BMPs evaluation result of remediation project. BMPs, best management practices.
Site remediation was divided into SI, on-site remediation, and remediation completion (RC). The three phases were separately calculated and evaluated using SEFA based on personnel transportation, on-site equipment use and transportation, electricity use, material use, and water consumption. The remediation process was divided into two steps as follows: stabilization/immobilization for heavy metals and chemical oxidation for organic pollutants (see Brief Introduction of the Case Study Project section). Furthermore, Sitewise (version 3.1) was used to evaluate quantitative accident risk (fatality and injury). The detailed system boundary of footprint analysis, including equipment usage and material acquisition, is shown in Supplementary Fig. S2. Environmental footprints were based on the GSR concept, while economic and social aspects were partly reflected in the strategy selection and worker safety, respectively.
Site remediation practice and management optimization
GSR optimization
GSR optimization was conducted based on GSR evaluation. The results calculated by simulation methods were compared before and after GSR application, such that optimization effects could be reflected and qualified.
Route optimization for sampling during SI and remediation
Sampling points were set out primarily using Google Earth Pro (version 7.3.0.3830), while locations were modified using a GPS analyzer (TJSD-750, China). All GPS information was documented and transferred into decimal digital format. The sampling points with GPS coordinates were plotted into ArcGIS Desktop (version 10.2). The base map was saved with a length-width ratio of 1:1 to keep the relative position of each point and was then imported into GA TravellerApp (version 1.0) as a benchmark. A new map was then created by setting up the number of points and manually drawing the sampling points according to the base map. The optimized route can then be calculated based on genetic algorithm. As all coordinates in GA TravellerApp are normalized, the actual length of the route should be calculated using GPS information.
The beginning points were set nearest to the entry of the contaminated site that is accessible to the construction group responsible for the remediation practices, while the ending points were not set in the middle of the site. In addition, facilities should not cross the surface river among the three area segments; crossing straight through the nearby residential buildings was avoided. The turning radius of the facility was negligible compared to the total routine and is therefore not calculated. It is important to note that turning for transportation vehicles requires more energy, which cannot be reflected by distance; the amount of turning by the facilities was summed and compared separately.
Administrative analysis and recommendation
The administrative study was based on remediation project practice along with current research (Song et al., 2018). In addition, a project management department on site remediation was established in our institute in 2016.
Results and Discussion
Evaluation and optimization of a contaminated site project in China
Application of BMP evaluation
Seventeen BMPs were classified into four groups as follows: energy use, waste emission, material use, and ideology (Fig. 2). As high diesel use and low loading factors discharge air pollutants and PM, causing air pollution that poses great threat to local citizens, remediation processes with less contamination should be applied instead of traditional processes in developing countries (Haller, 2017). Reuse of plastic covers, high-density polyethylene (HDPE) geomembranes, and remediation agents is feasible and practical (Hinchee and Smith, 1992). Improvement in monitoring equipment and public concept was of low priority in this project, as long-term monitoring was not well established or managed. The other nine medium priority management practices should also be addressed.
Four management practices were not selected in this project, although three of them were of medium priority (Fig. 2, column 3). These four measures lacked the support of engineering practices and site conditions in China. Among them, installation of renewable energy systems has not been adequately applied to remediation facilities; however, reduction of traditional energy consumption should be a focus in the near future (Dellens, 2007). Thirteen BMPs were selected for this project and ranked by importance following this step.
Water reuse is not applicable due to a lack of wastewater systems, which also involves a large economical investment. Therefore, on-site dust removal through water spraying would result in additional fresh water consumption. Nonetheless, this technique should still be implemented, taking into consideration the proximity of nearby residential units (Fig. 1). Dust should be strictly controlled for public safety. While traditional energy sources like diesel also contribute to air emission, renewable energy systems are not accessible to the facilities and construction group. The local government also poses strict regulations on wastewater irrigation. Water from the remediation processes were collected and sent to the sewage plant as required by regulations. Except for 3 BMPs, the other 10 BMPs were implemented in this project (Fig. 2, right column), among which all 6 practices of high priority were all implemented.
Application of SEFA on environmental footprint evaluation in this project
Detailed background information on SI and on-site remediation is listed in Tables 2–4. Unless specified, all information was obtained or calculated from engineering conventions and similar projects. There were 47 sampling points during the SI phase. Taking into consideration accidental damage and duplicate sampling used for deep sampling, 200 tubes were required. Concrete surface drillers, direct push machines, and a mobile laboratory were the main facilities. Some waste HDPE geomembranes could not be recycled and were sent to landfill sites as solid waste following remediation. Foam machines were used specially in I2 for the prevention of organic pollutant volatilization.
Background Information of Project During Site Investigation
Refined materials are those produced off-site and used for on-site remediation, including plastic products, chemicals, metals, and cement.
SI, site investigation.
Background Information of Project During Heavy Metal Remediation
HDPE, high-density polyethylene.
Background Information of Project During Organic Pollutant Remediation
Most items are similar with heavy metal remediation. Only information different from Table 3 is listed here.
Prevention of organic pollutant volatilization, power: 10 kW, loading factor: 75%.
Mostly H2O2, the mass of agent was calculated based on previous projects in the institute.
A large quantity of water was consumed during RC for site and facility washing (Table 5). The main facilities used in phase 2 were excavators or backhoes. Operation time includes the entire phase of RC.
Background Information of Project During Remediation Completion
RC, remediation completion.
Figure 3 shows the total emission from air pollutants, including NOx, SOx, and PM (Fig. 3a), total on-site air pollutant emission (Fig. 3b), water consumption (Fig. 3c), energy consumption (Fig. 3d), and total life cycle GHG emission (Fig. 3e) simulated by SEFA analysis. Air pollutant emission during SI, stabilization of heavy metals, oxidation of organic pollutants, and RC phases is 12.4, 947.0, 671.1, and 51.7 kg, respectively. The total NOx generated across the four phases is 10.6, 353.8, 323.5, and 43.6 kg, respectively, while the total SOx is 1.5, 532.4, 276.5, and 5.2 kg, respectively (Supplementary Table S1).
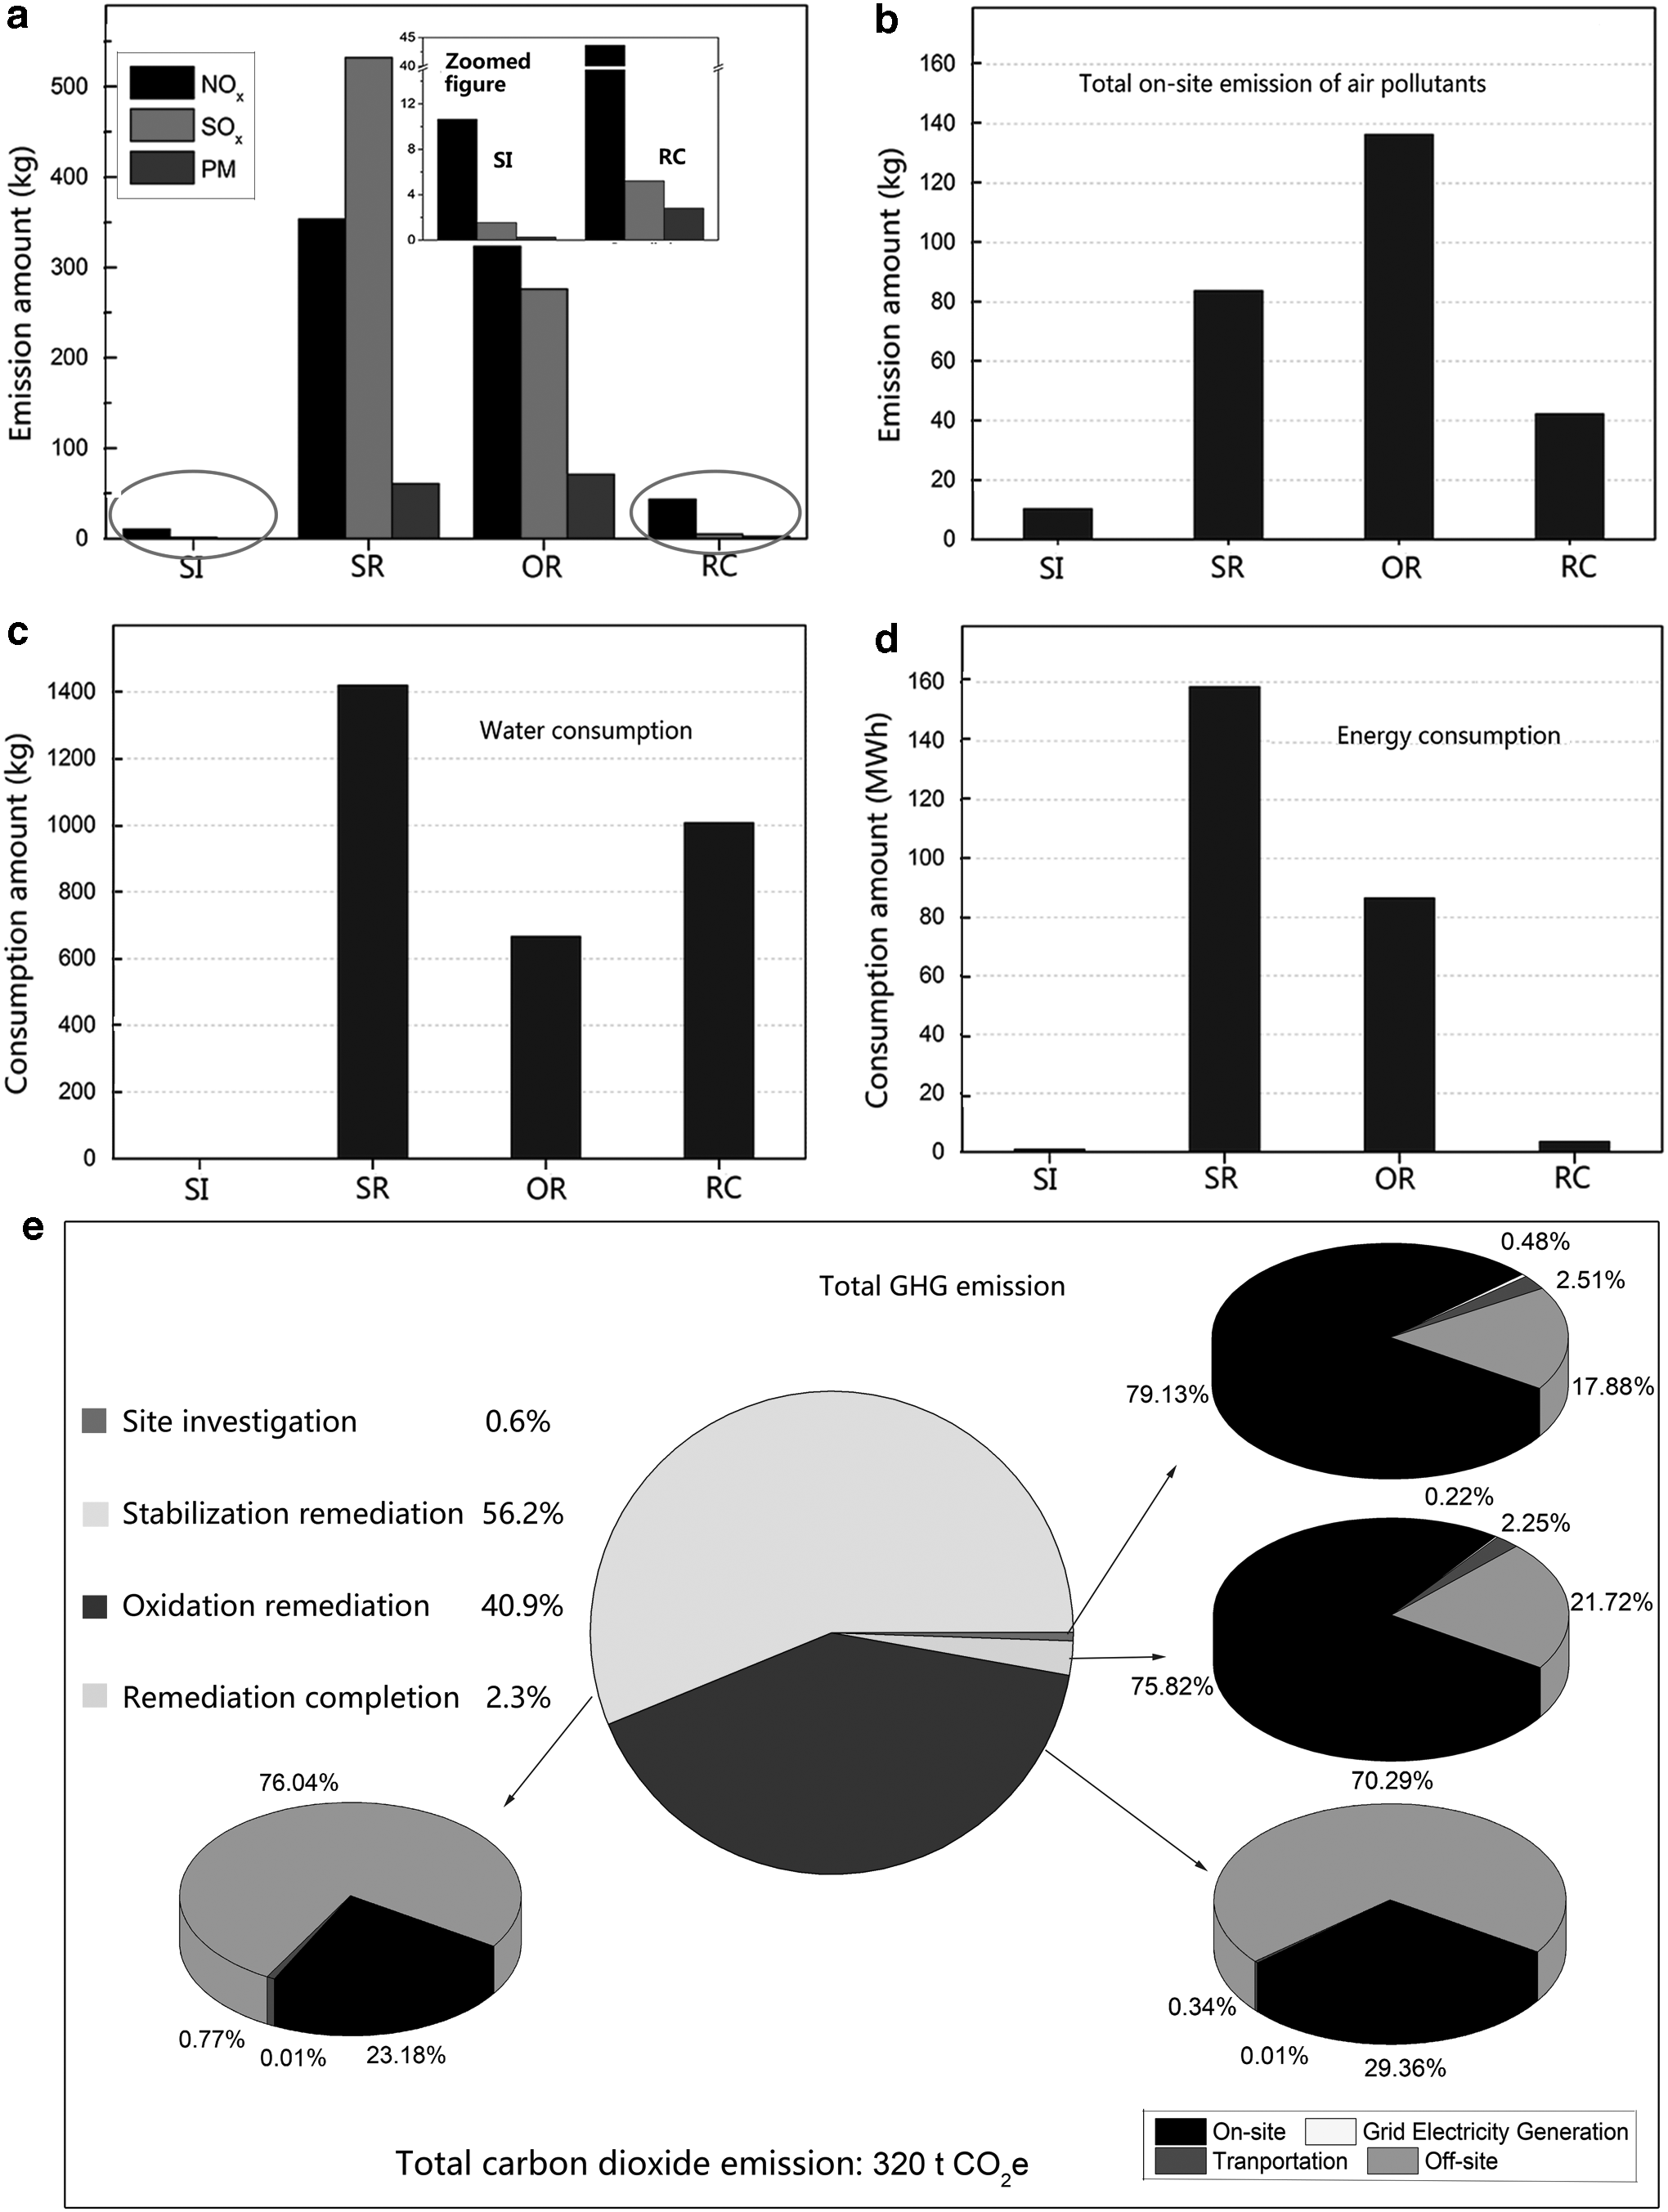
Environmental footprint generation from all phases within project.
Air pollutant emissions from the two remediation stages account for a dominant proportion of the total emission. Emission of SOx from stabilization remediation (SR) was much greater than that from oxidation remediation (OR), mainly due to a greater amount of remediation agents. Production of limestone involves excavation and crushing of raw ores, mixing of ore and coal, calcination, and washing, most of which contribute to SOx generation (Al-Shahrani et al., 2007; He et al., 2010). NOx emission was similar during SR and OR, as most NOx comes from the use of fuels that are correlated with the manufacturing processes of different agents. During SI and RC, SOx emission during SI and RC was relatively lower than NOx (Fig. 3a).
The on-site air pollutants emitted across the four phases were 10.3, 83.7, 126.2, and 42.2 kg, respectively (Fig. 3b). Unlike total air pollutant emission, OR had the highest quantities of pollutants, as fuel generation was caused mainly on-site. The longer remediation life cycle of OR increased the operation time of mechanical facilities and vehicles, which ultimately led to higher emission. Organic pollutants were volatilized and desorbed into the atmosphere during remediation and resulted in high hazardous gas emission.
The stabilization agent used during the SR phase was 33% higher than that during OR and required 1419.5 tons of water (Fig. 3c). During the RC phase, 1006.9 tons of water was used for facility, site, and soil washing on all sites (I1, I2, and I3); very little fresh water was required during the SI phase. Energy consumption during the SR phase was of a similar pattern to total air pollutant emission; 320 tons of GHG (CO2e) was generated throughout the whole project, of which SR and OR accounted for 97.1%. Material manufacturing along with transportation were most strongly correlated with GHG emission; however, no hazardous waste was produced or transported to hazardous landfill sites (Delucchi, 2003; Hondo, 2005). In Canada, a lot of fuel is used during GHG due to transportation accounting for 75.8% of the total GHG emission (Page et al., 1999).
Quantitative characterization of environmental footprint reduction by BMP application
Implementable BMPs and environmental footprint evaluation were investigated and summarized in this project. In this section, a feasible environmental footprint reduction system is proposed (Table 6).
Application of Best Management Practices on Environmental Footprint Reduction
Related to the right column of Fig. 2.
Related to Tables 2 to 5.
Estimated by the fuel consumption emission factors of various vehicles.
Calculated by SEFA.
BMP, best management practice; GSR, green and sustainable remediation; SEFA, Spreadsheets for Environmental Footprint Analysis; SR, stabilization remediation.
The optimized operation routine for both the surface driller and direct push machine is demonstrated in Fig. 4 (Supplementary Fig. S3). The surface driller is driven following the routine of the direct push machine, which was selected according to the order of sampling points; however, the arrangement of sampling points was not performed by the principle of practicality or cost saving, which resulted in the complication of working routine and increase of energy consumption. In this project, the sampling points S9, S10, and S11 were on the surface of the concrete road, while the S5 and S8 are next to the residential buildings at the border, all of which should be passed by the driller (Fig. 4). The traditional practical route and optimized route were calculated by distance. Results showed that by using route optimization, the total travel distance was reduced by 19.3% for the direct push machine. Moreover, the optimized operation routine largely reduced personnel redundant travel between the two machines (not reflected in Table 6 or Fig. 4). The optimization effect was slightly lower than the 23.9% route improvement on solid waste collection and transportation, in which the route was strictly based on the existing road (Karadimas et al., 2008). Few studies have focused on the open site for investigation and remediation.
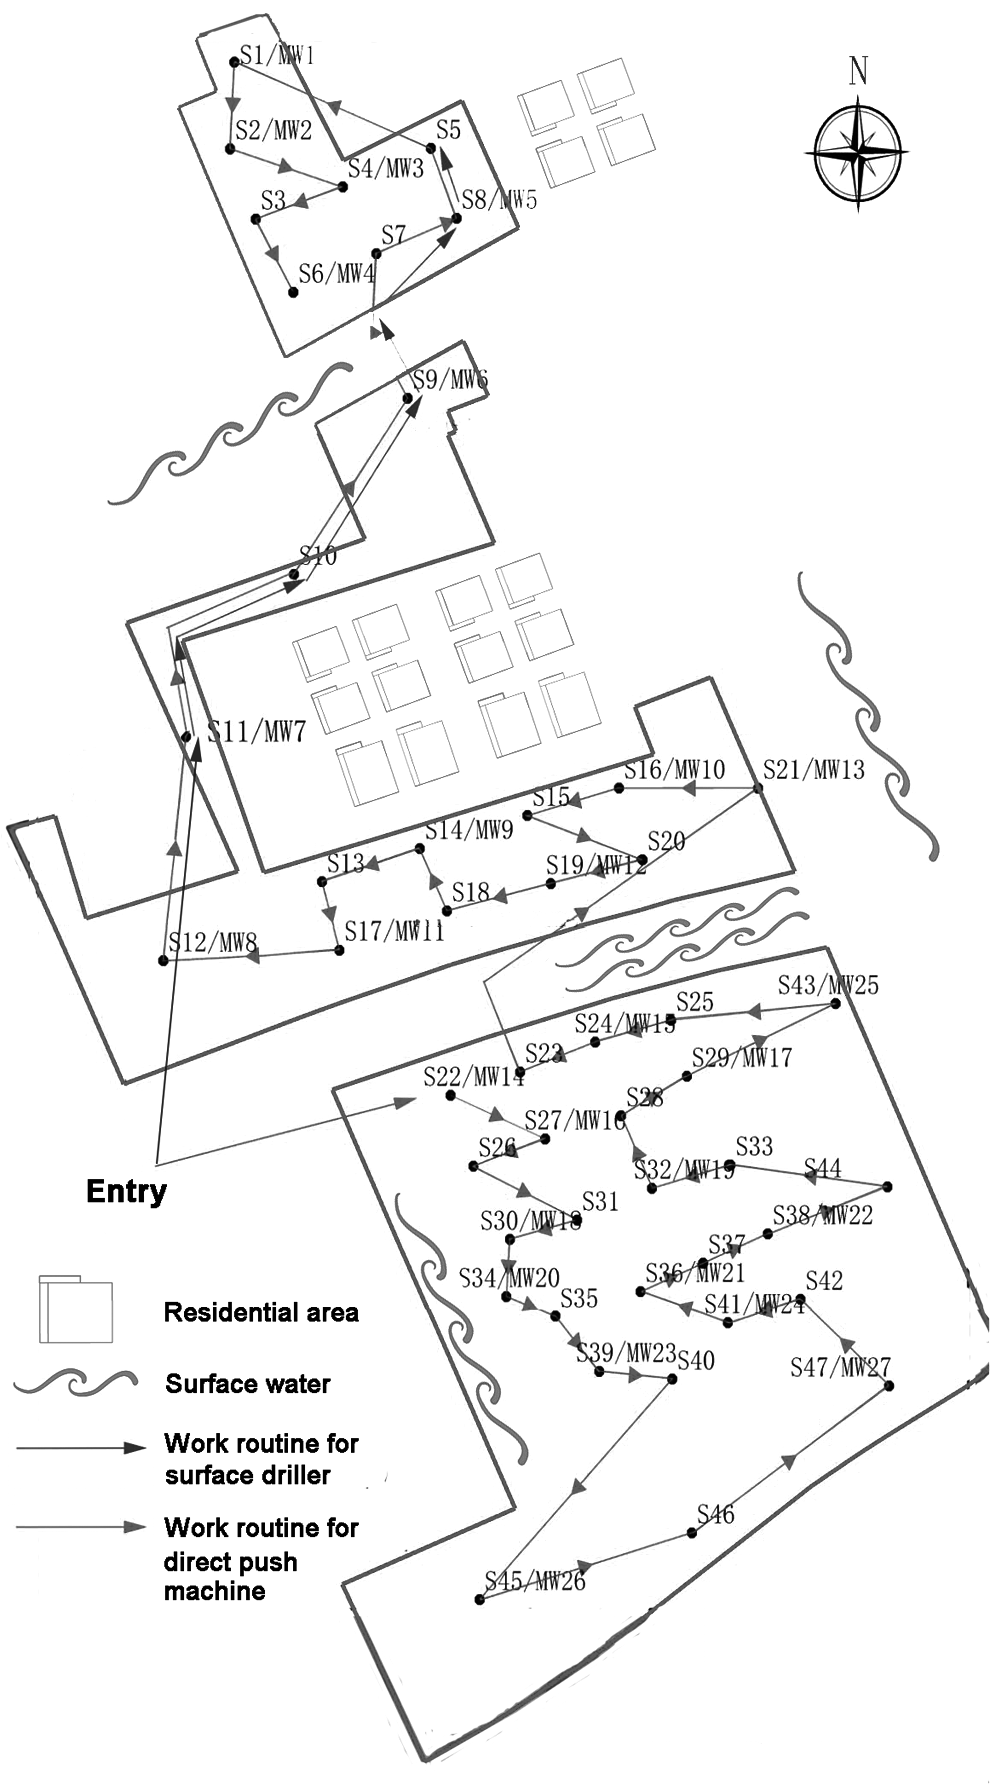
Application of greenest operation route using route optimization methods.
Other measures, including reduction of facility loading and air pollutant emission, increased material reuse and bioavailability of pollutants (Table 6). The reductive effects of environmental footprints and accidental risk due to BMP implementation in Table 6 are shown in Fig. 5 (Supplementary Table S2). Contributions to footprint reduction included reducing facility operating distance, facility load, and air pollutant emission, increasing the reuse ratio of HDPE geomembranes and covers, bioremediation, and choosing vegetation that reduces bioavailability and promotes the public concept on GSR.
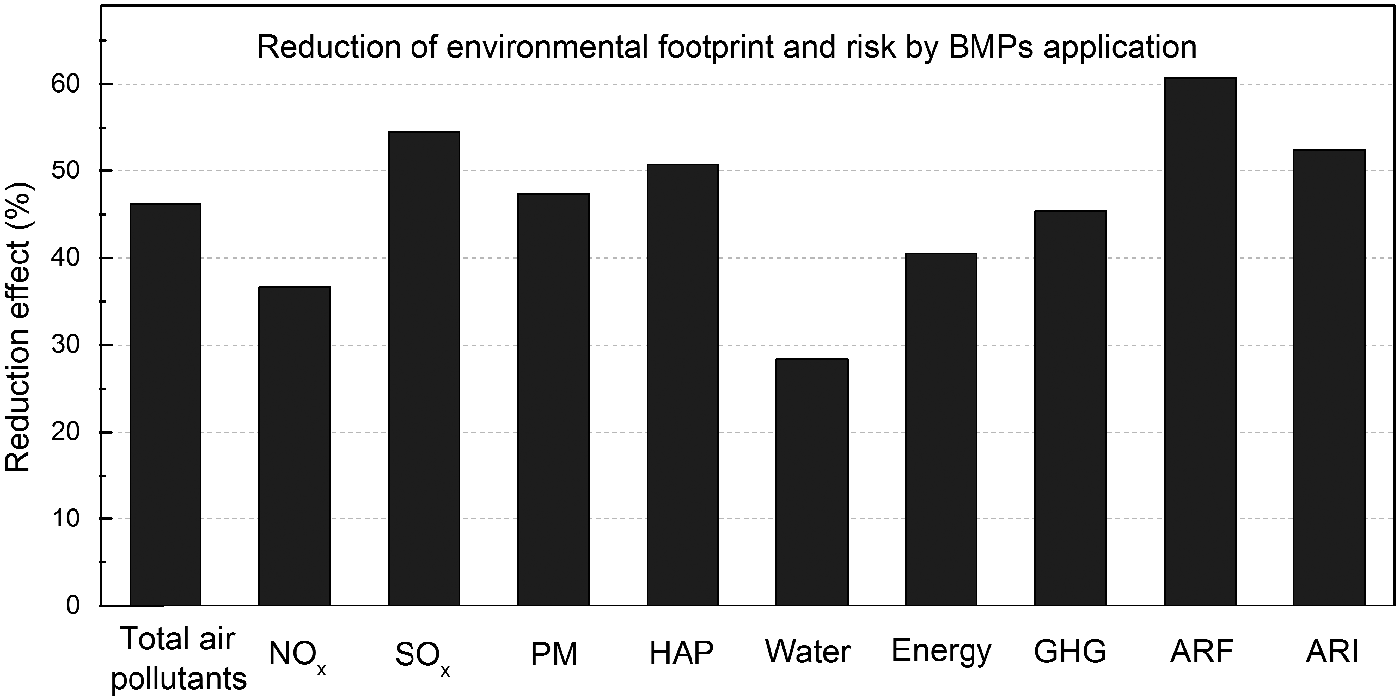
Reduction effects of the environmental footprint and accident risk by BMPs application in this project. ARF, accident risk fatality; ARI, accident risk injury.
The total emission of air pollutants was reduced by 46.2%, among which more than 50% of SOx emission was reduced, compared to remediation practices that did not use GSR application. By shortening operation time and distance, along with appropriate remediation methods, air pollutant sources could be largely controlled. Hazardous air pollutant quantities were reduced by 50.8%, while water and energy consumption was shortened by 28.3% and 40.5%, respectively. Fresh water usage was correlated to washing and agent solutions. Dust removal based on BMPs increased water consumption and the use of bio-humic acid eliminated the demand for stabilization agent solutions. As duration of washing during the completion phase was not shortened, water consumption reduction was not significant compared to other factors. The reduction in energy use was mainly reflected by equipment operation, and both route optimization and remediation improvement contributed to energy use reduction. Meanwhile, more than 147.4 t of GHG was controlled and the removal ratio reached up to 45.4%.
Accidental risk was also largely diminished, as the fatality of transportation personnel, transportation equipment/materials, equipment use, and residual handling after BMP application are 1.1 × 10⁻⁶, 1.6 × 10⁻⁷, 1.5 × 10⁻⁵, and 7.8 × 10⁻⁹, respectively. The risk associated with waste handling was sharply decreased for low waste generation during bioremediation. A similar pattern was seen for accidental risk injury, where injury risk was reduced by up to 52.5%, and injury risk during residual handling decreased from 5.0 × 10⁻⁵ to 6.3 × 10⁻⁷. Potential risk was reduced from “between the immediate and inaction categories” to “not scheduled,” according to a relative study on risk assessment (Leigh and Hoskin, 2000). Furthermore, excavation of contaminated soil and temporary storage on the ground increase risk for migration of pollutants to residents in the eastern region without BMP application (Fig. 4).
Confronting barriers and recommendations on GSR management in China
Many problems still must be addressed. First, general recognition by governmental administration and the public is necessary. Inadequate understanding of the GSR concept can impede its development in affected countries (Kibblewhite et al., 2016). Many remediation projects are implemented each year in China, but there are no reports on renewable energy system use, which might reflect the absence of GSR awareness and application. Second, the evaluation system should be improved. Most life cycle assessments focus on air pollutant emission, GHG emission, energy consumption, and material use, while detailed weight allocation for these aspects has not been proposed. A single, direct index for GSR evaluation should be established. Finally, the implementation and application of BMPs should be improved, as many BMPs are not employed practically. Existing administrative systems or engineering practices, including allocation of construction contracts, tasks, rights and responsibilities, and practical skills of engineering staff, inhibit the application of BMPs; for example, passive monitoring equipment and its management are not detailed in the engineering contract and are not delineated in the investment and environmental criteria. Application of passive monitoring equipment in these circumstances is inappropriate during engineering preparation.
More focus should be given to the administrative aspect in developing countries to promote GSR. A recommended administrative function division of GSR before site remediation in China has been proposed (Fig. 6). Establishment of a GSR research center must be given high priority as technological development, equipment introduction and manufacturing, and standard establishment are required for all GSR procedures. In addition, relative organizations directly under the State Council like Ministry of Agriculture should play a role in overseeing GSR in the case that a contaminated site is within their scope of jurisdiction.
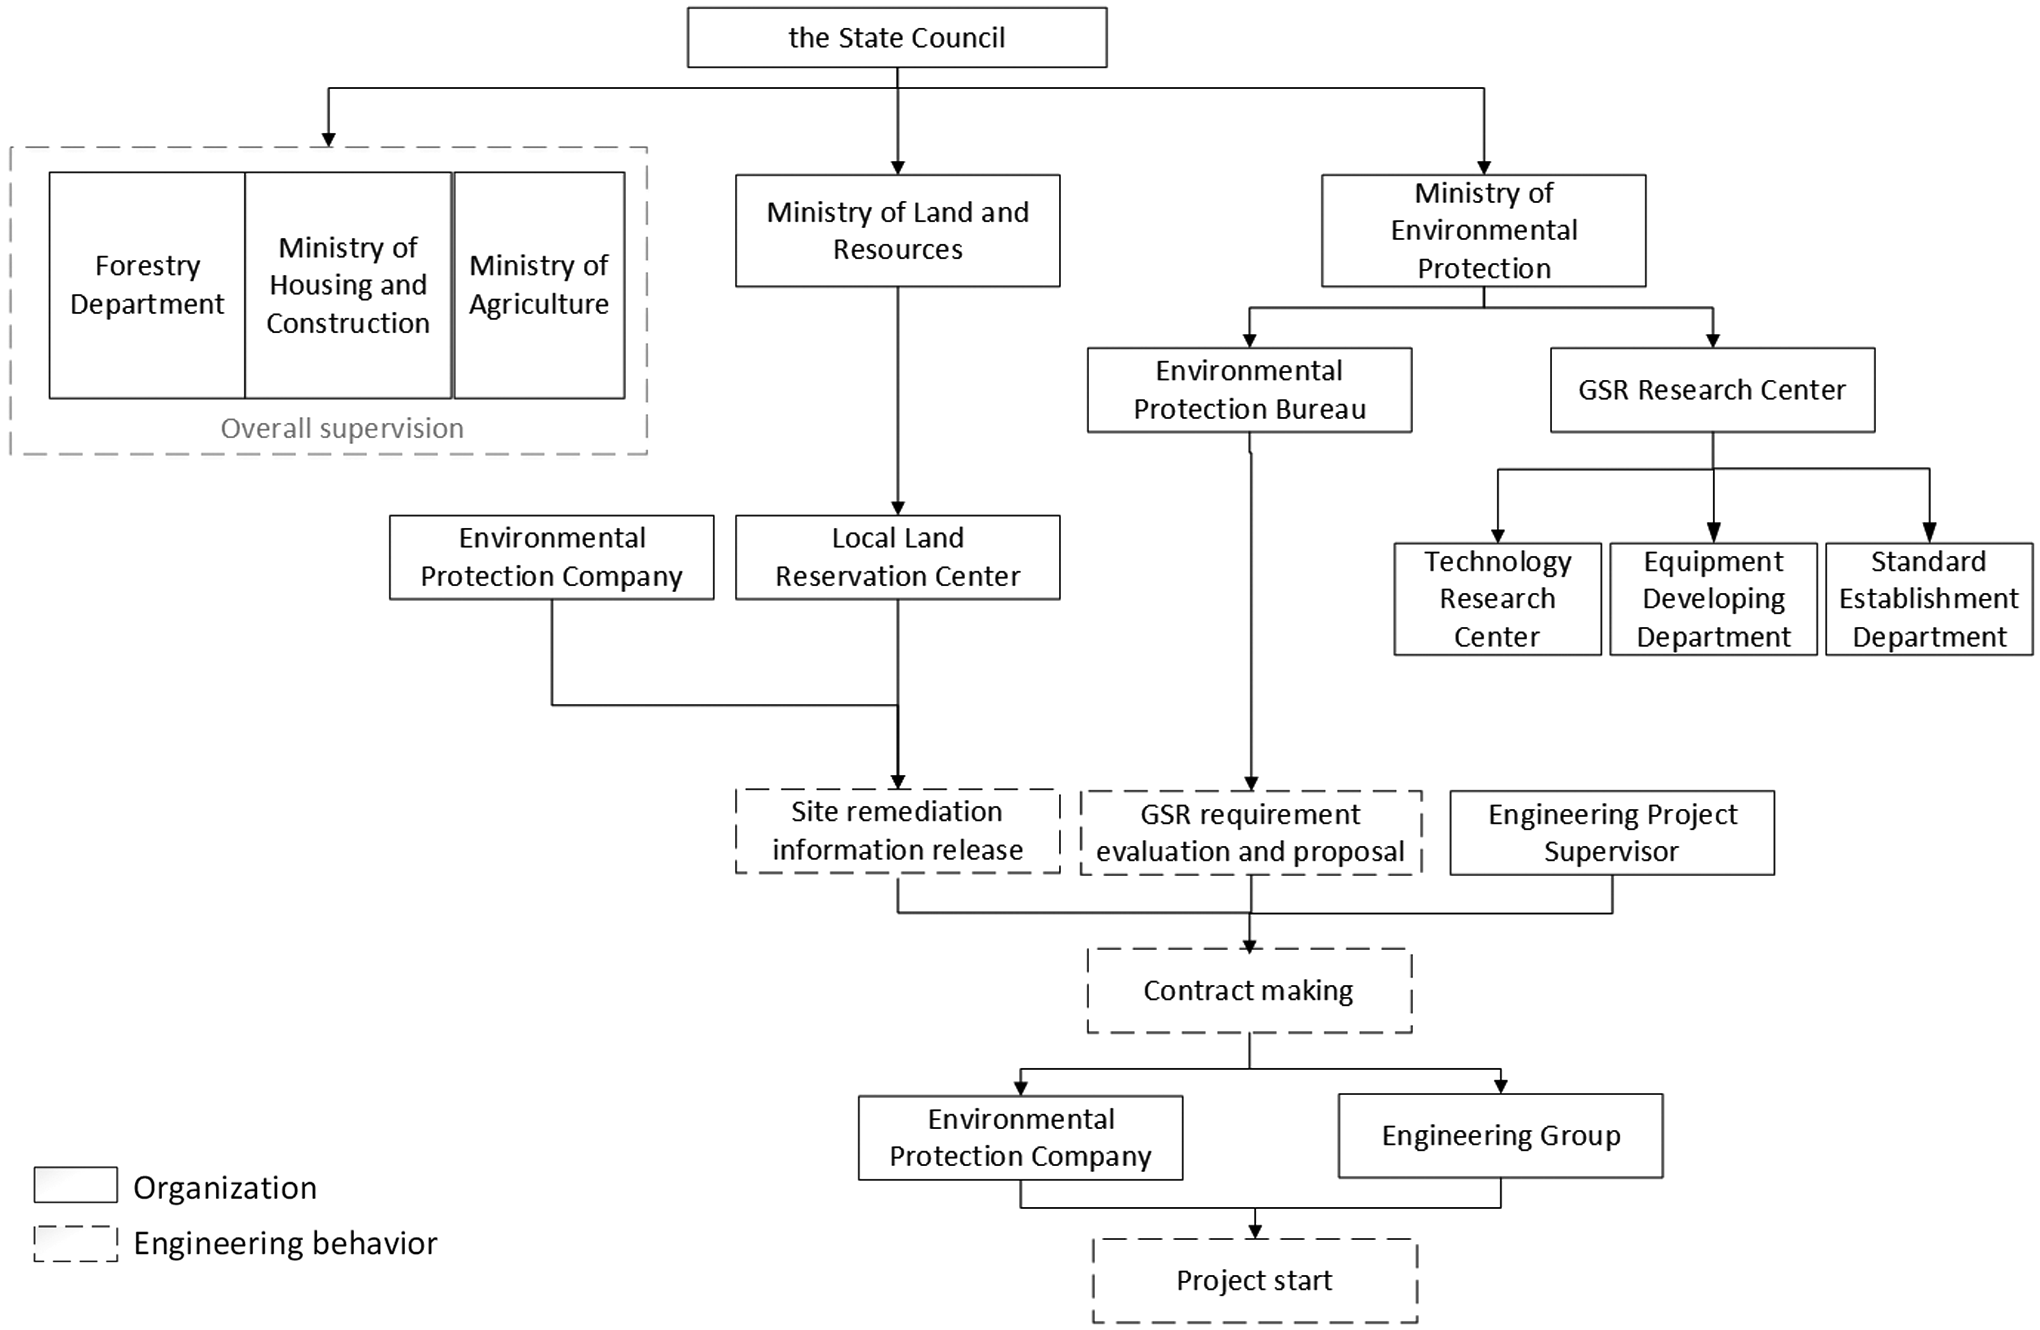
Recommendation on administrative function division of GSR before site remediation in China. GSR, green and sustainable remediation.
Conclusion
A site remediation project was thoroughly evaluated using a GSR concept to investigate and summarize the historical development, current evaluation system, and management in developed countries. Facilities with appropriate power consumption, reduction of redundant operation time and distance, increase of on-site and off-site material reuse, and optimization of remediation methods should be implemented within these projects, although some practices are limited due to current management and technology.
Detailed engineering behavior information was provided for footprint and risk calculation for quantitative evaluation, which reflects the environmental aspect of GSR. Conventional SI and two remediation processes (stabilization and oxidation) were evaluated, and the total and on-site air pollutant (NOx, SOx, and PM) emission, life cycle water consumption, energy use, and GHG emission were, respectively, calculated. Accident risk fatality and injury reached up to a “between the immediate and inaction categories” level for local workers and residents. The application of BMPs on this project and the resulting footprint and risk reduction results offered a developing direction for site GSR in developing countries. SI routine was innovatively optimized, while other measures, such as bioremediation practices and pollutant removal, were adopted. Based on quantitative analysis, more than 50% of the environmental footprint and up to 52.5% of injury risk were reduced following GSR application.
There are many obstacles to overcome when applying GSR in developing countries, including management and technological aspects. An administrative organization system can better promote GSR development and implementation in China and other developing countries. This study provides new insight into site remediation in developing countries, supports the engineering programming and practice through the case study, and promotes the development of GSR to minimize the negative impact of site remediation.
Footnotes
Acknowledgments
This study was sponsored by the Science and Technology Commission of Shanghai Municipality (No. 17210731100 and 18DZ1204303), Shanghai Sailing Program (19YF1445100) and Shanghai Rising-Star Program (19QB1405300).
Author Disclosure Statement
No competing financial interests exist.
References
Supplementary Material
Please find the following supplemental material available below.
For Open Access articles published under a Creative Commons License, all supplemental material carries the same license as the article it is associated with.
For non-Open Access articles published, all supplemental material carries a non-exclusive license, and permission requests for re-use of supplemental material or any part of supplemental material shall be sent directly to the copyright owner as specified in the copyright notice associated with the article.