
Abstract
Abstract
Catalytic activity of γ-Al2O3 catalyst modified with Ti (Ti-Al2O3) for hydrogen cyanide (HCN) removal was studied, and the TiO2 and γ-Al2O3 were tested as comparisons. It was found that Ti-Al2O3 showed a remarkable composite effect with superior HCN removal activity compared to TiO2 and γ-Al2O3, especially at low temperature range. HCN conversion efficiency improved with the increase of Ti content. Characterization results show that there is a strong interaction between TiO2 and Al2O3, and TiO2-anatase is well dispersed on γ-Al2O3, which gives more active site for HCN. The high catalytic activity was attributed to the combined action of high pore volumes and surface area, as well as abundant hydroxyl groups of composite catalyst (Ti-Al2O3).
Introduction
Hydrogen cyanide (HCN) is a highly toxic gas, which may lead to suffocation because tissue cells that cannot utilize oxygen for the CN− will combine with Fe3+ in the cytochrome oxidase and block the electron transfer of Fe3+ in the process of oxidation. One minute exposure to concentrations of ca. 300 ppm is lethal (Osińska, 2013). HCN usually exists in reductive gas such as yellow phosphorus tail gas (Wang et al., 2011), closed calcium carbide furnace tail gas (Jiang et al., 2014; Zhou et al., 2014), coal gas (Xu et al., 2016), and petroleum refineries (Wei, 2015). Besides, HCN in these gases usually convert to NO x in the combustion process or after emission. For its high toxicity and a major precursor of nitrous oxides, more and more attention of HCN treatment was attracted.
Methods of absorption, adsorption, combustion, and catalysis were investigated for removing HCN (Nanba et al., 2000; Ning et al., 2013; Zhao et al., 2015; Hsiao et al., 2016). Catalysis shows superiority for it can reduce toxicity and has less secondary pollution. Catalysts based on carbon (Wang et al., 2016), molecular sieve (Song et al., 2016; Hu et al., 2018), aluminum, and titanium (Ma et al., 2017) materials were found effective to remove HCN. TiO2-anatase had a high HCN hydrolysis activity and can remove HCN 90% above 400°C (Kröcher and Elsener, 2009). Marsh et al. (1952) investigated the hydrolysis of HCN on γ-Al2O3, in which the conversion of HCN was about 80% at 300°C (Marsh et al., 1952). Nanba removed HCN over H-ferrierite (SiO2/Al2O3 = 17) with conversion efficiency of ∼80% at 500°C (Nanba et al., 2000). Pt/Al2O3 for HCN removal catalyst was studied by fractional factorial design and was found that temperature and gas hourly space velocity (GHSV) had the most significant effects on HCN conversion (Zhao et al., 2006). In our preliminary work, HCN can be converted completely with Al-Ti-Ox at 250°C. It has been proved that both TiO2 and Al2O3 catalysts are effective for removing HCN. While there could be room for improvement of conversion efficiency, the operational temperature could be lowered to reduce the energy consumption.
In this article, γ-Al2O3 was modified with Ti by our own created methods to prepare catalysts for removing HCN. The activity and characterization of the materials were examined and discussed.
Experimental Section
Preparation of catalyst
Al2O3 used in the experiment is γ-Al2O3 in the market (Shandong Zibo Bell Chemical Technology Co., Ltd.). TiO2 is prepared by hydration and roasting of titanium butoxide (Tianjin Kemiou Chemical Reagent Co.). The method is as follows: an appropriation of titanium butoxide was added to absolute ethanol and with magnetic stirring for 30 min. Then water was added into the mixture slowly and drop by drop, accompanied with stirring. The product was hydrated for 1 h at room temperature and then dried in an oven at 100°C for 12 h. The following calcination in a furnace at 500°C for 3 h afforded the catalyst. Ti-Al2O3 was prepared by the following steps: an appropriation of titanium butoxide was added to absolute ethanol and with magnetic stirring for 30 min, followed with an addition of γ-Al2O3. Then the mixture was mixed well and let to sit for 4 h. Subsequently, water was added into the mixture drop by drop and accompanied with stirring. The product was hydrated for 1 h at room temperature and then dried in an oven at 100°C for 12 h. The following calcination in the furnace was at 500°C for 3 h to gain the Ti-Al2O3.
Characterization
To study the characterization of materials, a series of measurements were used, including N2 adsorption/desorption, X-ray diffraction (XRD), Ramon, high-resolution transmission electron microscopy (HR-TEM), X-ray photoelectron spectroscopy (XPS), and in situ diffuse reflectance infrared fourier transform spectroscopy (in situ DRIFTS) analysis of hydroxy content with NH3 as the probe molecule.
N2 adsorption/desorption was applied to determine the surface area, pore size distribution, and total pore volume with a TriStar II 3020 3.02 (Micromeritics Instrument Corporation). The specific surface areas were determined using the Brunauer-Emmett-Teller equation. The pore size distribution was calculated with the Barrett-Joyner-Halenda method. XRD measurements were performed by a Bruker D8 Advance (Bruker) operated at 40 mA and 40 kV. The angle range scanned was 5–90° with a counting step of 0.05°. Raman spectrum spectroscopy was performed by LabRAM HR800 Raman microscope and spectrometer (HORIBA Scientific) using a 325 nm diode laser excitation. HR-TEM was analyzed on an FEI Tecnai G20 (FEI) operated at 200 kV. XPS analyses were conducted on a Thermo ESCALAB 250XI spectrometer (Thermo Fisher Scientific) using an Al-Kα (hv 1486.6 eV) at 150 W. XPS spectra were calibrated using the main C 1s feature resulting from adventitious C at 284.8 eV. In situ DRIFTS analysis of hydroxy content with NH3 as the probe molecule was investigated by NEXUS 670-FTIR instrument (Nicolet) equipped with a smart collector and a MCT/A detector cooled with liquid nitrogen. Thirty micrograms of catalysts were put in the in-situ tank reactor and pretreated at 400°C for 30 min in the air. When the temperature decreased to 30°C, the catalysts were purged with high purity N2 for 30 min and collected in the background with Fourier-transform infrared spectroscopy. Then gas of NH3 (500 ppm) balanced with nitrogen balance was led to the catalysts for adsorption for 1 h to saturation. After that, the catalysts were purged with high purity N2 for 30 min again. All spectra were collected in the 4,000–400 cm−1 frequency ranges at a resolution of 4 cm−1. A total of 100 scans were averaged for each spectrum.
Catalyst activity tests
Catalyst tests were carried out in a fixed-bed flow reactor. The reaction gas was composed of 100 ppm HCN with nitrogen balance. Water was added into the gas according to part of nitrogen flowed through water setup, and gas achieved moisture of 0.024% finally. The mix gas was introduced to the catalyst bed at a flow rate of 200 mL/min. The reaction occurred in a quartz column reactor with 7 mm inner diameter with temperature controlling equipment. Specifically, 200 mg of each catalyst was used in the catalyst test. The GHSV was ∼42,000 h−1. HCN and NH3 were measured by a mass spectrometer (MAX300-LG; Extrel). N2O, NO x , CO, and CO2 were measured by gas chromatography (GC-97902; Fuli Instruments). To guarantee a steady gas flow rate and to avoid adsorption disturbance, the reaction was run 1 h before detected gas.
Results and Discussion
Results of activity test
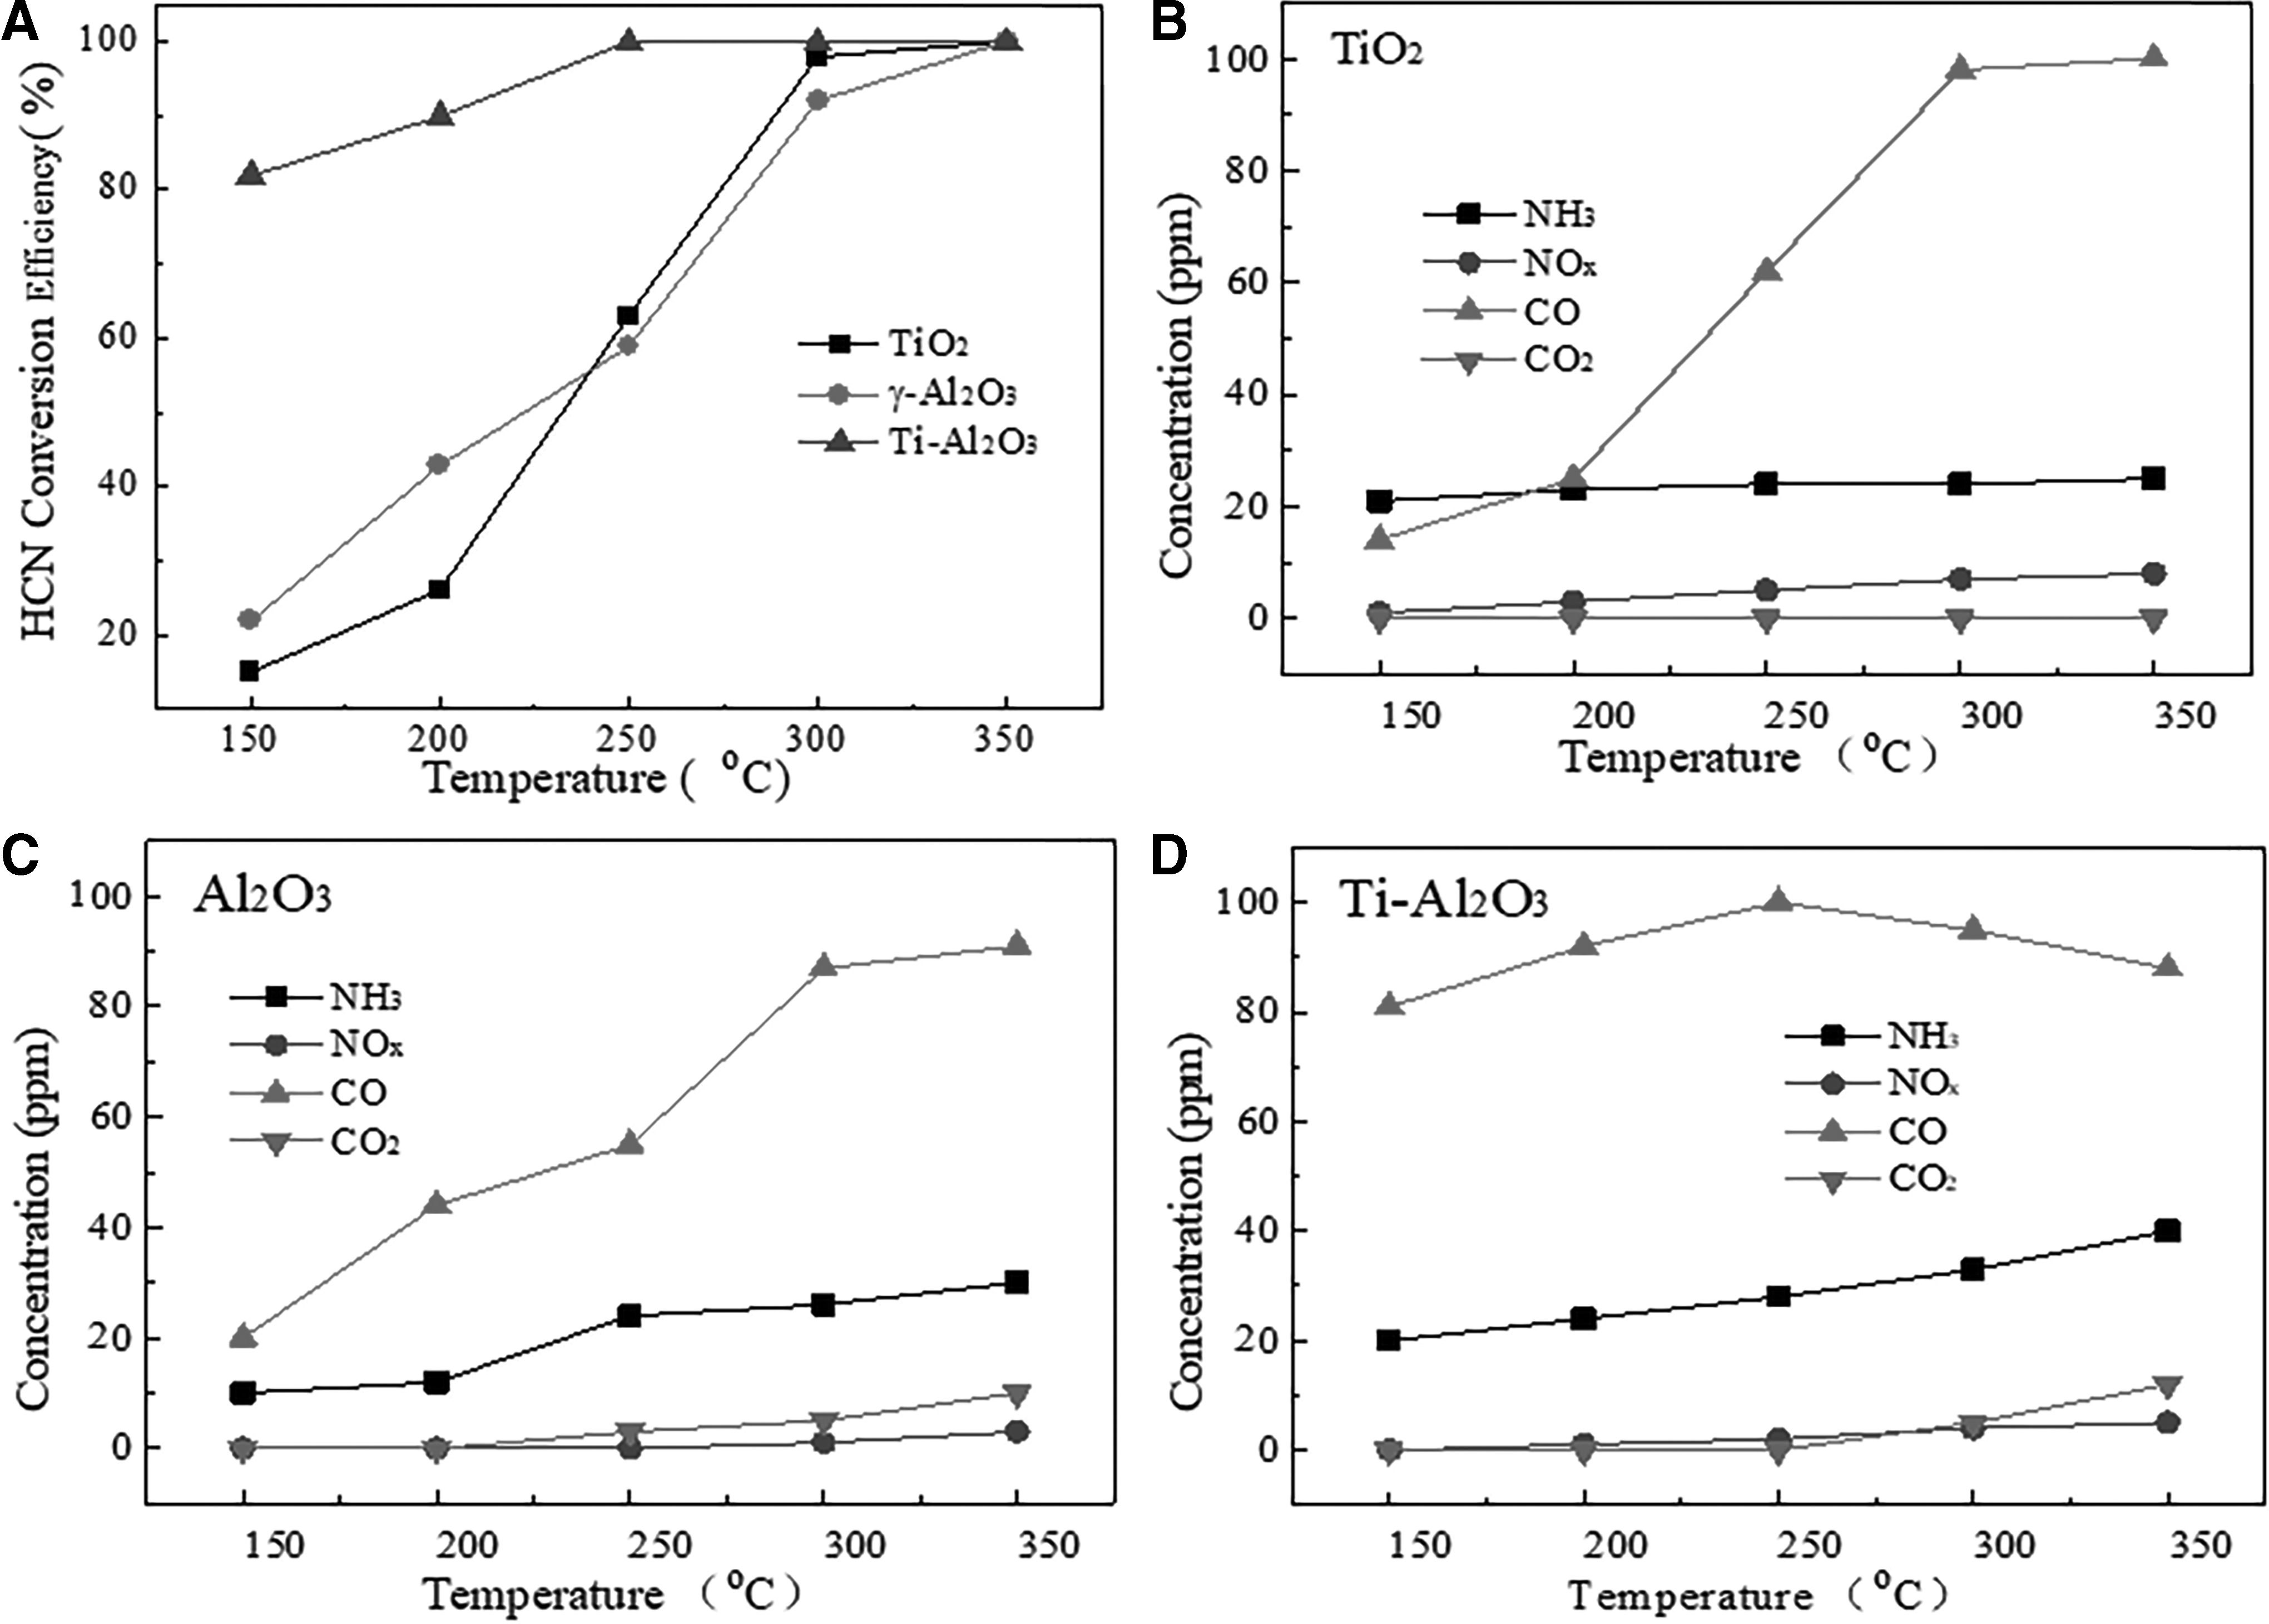
Conversion efficiency and products of HCN treated by TiO2, γ-Al2O3, and Ti-Al2O3 (the content of TiO2 was controlled as 25% in the experiment) were tested, which are presented in Fig. 1.
Results of activity tests,
From Fig. 1A, all the materials are effective for HCN conversion, and the conversion efficiency of HCN increases with temperature. It also can be seen that Ti-Al2O3 is superior to TiO2 and γ-Al2O3 for HCN conversion, especially at low temperature. The conversion efficiency of HCN with Ti-Al2O3 reaches 82%, which are 15% and 22% for TiO2 and γ-Al2O3 at 150°C. When the temperature went up to 250°C, HCN was converted completely by Ti-Al2O3. Conversion efficiencies of HCN treated by TiO2 and γ-Al2O3 are under 70% at the same temperature. The reaction temperature should be above 350°C to achieve 100% conversion when HCN was treated by TiO2 and γ-Al2O3. The Ti-Al2O3 showed higher activity for HCN at lower temperature.
NH3, NO x , CO, and CO2 can be detected in outlet gas of reactor, the concentrations of them are showed in Fig. 1A–C. Combined with conversion of HCN, it can prove that the C of HCN was converted to CO and CO2 no matter with which material. There was no CO2 generated in the reaction on TiO2, that is, all the C of HCN was converted to CO. When HCN was treated by Ti-Al2O3 and γ-Al2O3, both CO and CO2 can be found, but CO2 began to generate only when the temperature was above 250°C and 300°C, respectively. And higher the temperature was, the more the CO2 was generated. However, production of CO occupied an absolutely dominant position. N in the HCN was converted to NH3, NO x , and N2, which are hard to detect. NH3 and NO x can be measured in every reaction of HCN with TiO2, γ-Al2O3, and Ti-Al2O3; the masses increased with the increase of temperature, and NO x topped out at 8 ppm. The changes of CO2 and NO x with temperature indicate that stronger oxidizing reaction happened at a higher temperature.
Characterization
N2 adsorption–desorption isotherms and corresponding pore size distribution of TiO2, γ-Al2O3, and Ti-Al2O3 are illustrated in Fig. 2A and B. And related porosity parameters are gathered in Table 1. The N2 adsorption–desorption isotherms of γ-Al2O3 and Ti-Al2O3 belong to the type-IV isotherms with hysteresis loops of H3 type, which shows that microstructures with plate-like particles forming slit-like pores are the main pore structure of them (Kruk and Jaroniec, 2001). The nitrogen adsorption–desorption isotherms of TiO2 present the feature of type-IV isotherms with hysteresis loops of H4, which indicates that TiO2 own narrow slit-like pores collapse of lamellar structures (And et al., 2000). Pore size distribution of γ-Al2O3 and Ti-Al2O3 ranged from 0.6 to 50 nm with large mass; the peaks centered around 3 and 4 nm, respectively. Pore size of TiO2 mainly distributes between 2 and 6 nm, and the mass is very low. This meets the N2 adsorption–desorption isotherms in Fig. 2A and the dates in Table 1. It is clear that γ-Al2O3 and Ti-Al2O3 have high surface areas with 328.7 and 263.2 m2/g, while the surface areas of TiO2 are fairly poor. The situation of total pore volumes for TiO2, γ-Al2O3, and Ti-Al2O3 are exactly analogous to surface areas. The average diameters of them are close to around 4.5 nm.

N2 adsorption–desorption isotherms
Porosity Parameters of Different Samples
From the results of N2 adsorption/desorption, it can be learned that the pore structure of pure TiO2 is not abundant, which is very different from γ-Al2O3 and Ti-Al2O3. Modifying Ti on γ-Al2O3 by the prepared method will block some pores and lead to decrease of the surface areas and pore volumes to a certain extent, but Ti-Al2O3 still keeps high surface areas and pore volume. γ-Al2O3 provides rich surface areas and pore volume for active component Ti, which benefit adsorption and reaction.
Figure 3 shows the XRD patterns of TiO2, γ-Al2O3, and Ti-Al2O3. It can be seen that a strong peak appears at 25.48° 2θ, a minor peak at 48.25° 2θ, and other several clear peaks on XRD patterns of TiO2 (Khalilzadeh and Fatemi, 2016). These peaks are characteristic of TiO2-anatase, and there are no peaks corresponding to TiO2 rutile or brookite, that is, pure TiO2-anatase is formed by the prepared method. The pattern of γ-Al2O3 shows no sharp peaks and a grossly amorphous line with broad maxima around the positions of the diffraction lines for γ-Al2O3 (Öhman and Paul, 2002). For Ti-Al2O3, the peaks that belong to TiO2-anatase and Al2O3 appear, but the crystalline degrees decrease. Another, the full width at half maxima of TiO2 increases and decreases for Al2O3, that is, the grain size of TiO2 decreases and the grain size of Al2O3 increases in the Ti-Al2O3 compared with simple TiO2 and γ-Al2O3. The decrease of TiO2 grain size demonstrates that TiO2-anatase is well dispersed on γ-Al2O3, which gives more active site for HCN conversion. The increase of Al2O3 grain size in the Ti-Al2O3 resulted from recrystallization in the calcination process.
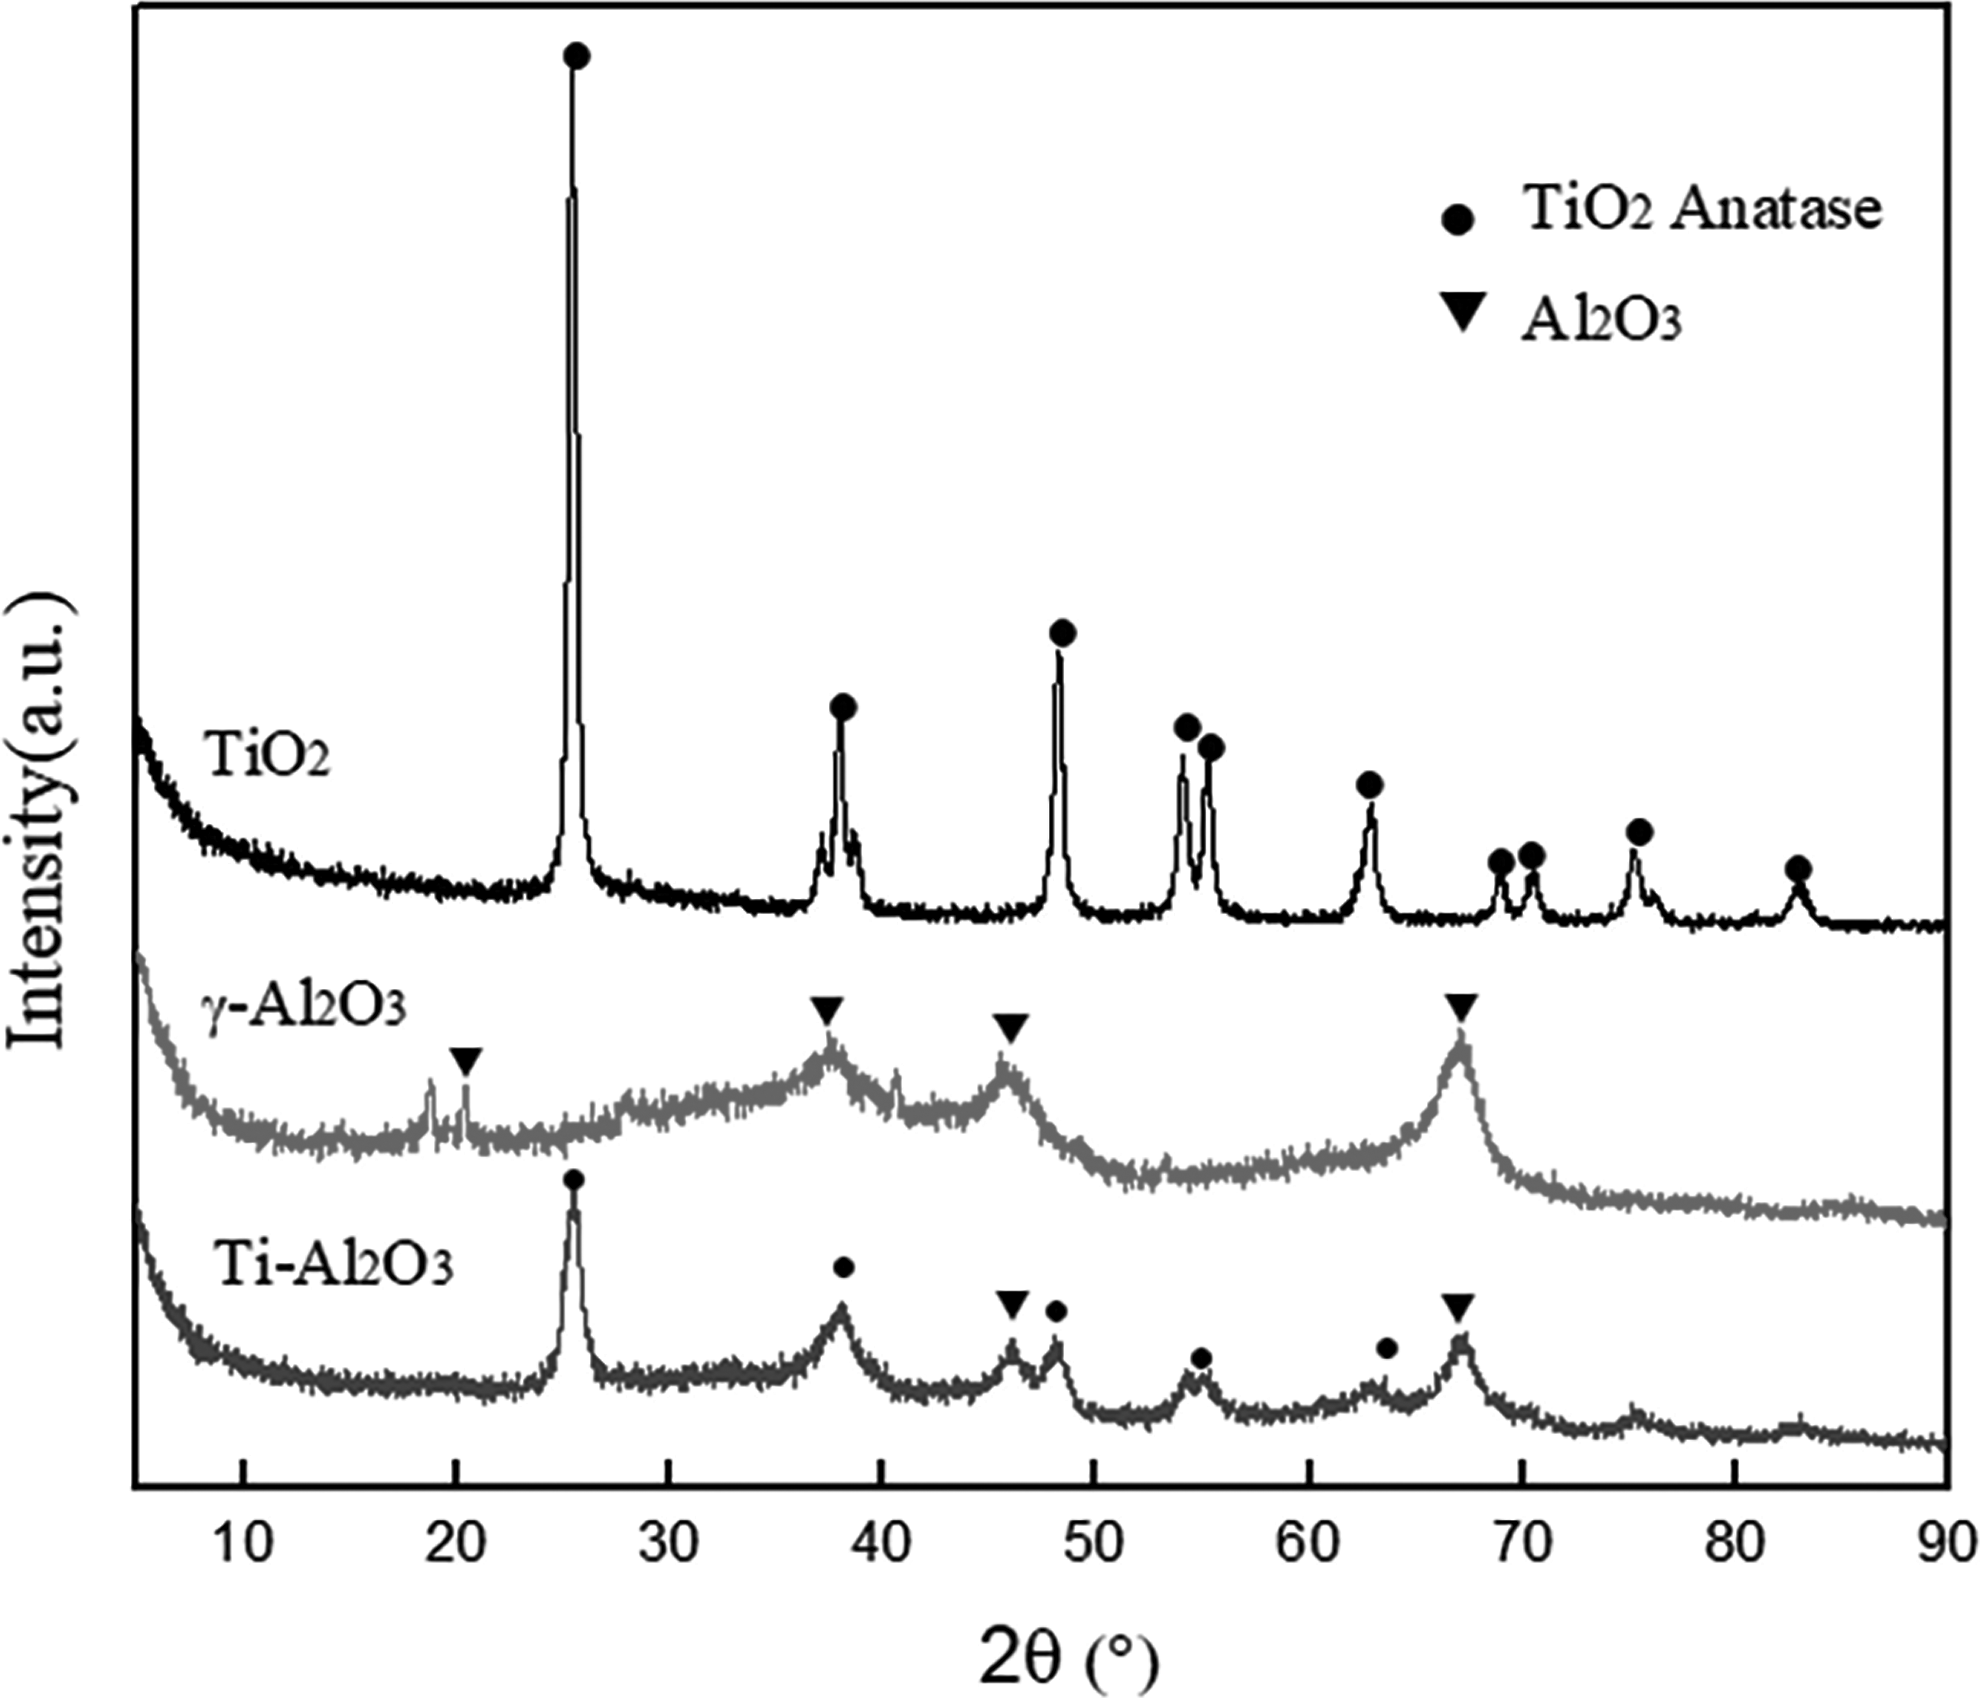
X-ray diffraction patterns of TiO2, γ-Al2O3, and Ti-Al2O3.
According to Fig. 4 five bands are observed for TiO2 at Eg (144 cm−1), Eg (195 cm−1), B1g (400 m−1), A1g (516 cm−1), and Eg (638 cm−1) corresponding to the active modes of the TiO2-anatase phase (Fagan et al., 2016; Ledesma et al., 2016). Peaks appeared on the patent of Ti-Al2O3 at the same position, but the intensities of them are much weaker. There is no peak found on the patent of γ-Al2O3 because its grossly amorphous. The results of Raman spectra well meet the results of XRD.

Raman spectra of samples.
HR-TEM images of TiO2, γ-Al2O3, and Ti-Al2O3 are shown in Fig. 5. TiO2 is in a larger particle size and with serious aggregation when comparing Fig. 5A with Fig. 5B and C. These may be the reason for TiO2 to have low pore volume and surface area. In the Fig. 5B, image of γ-Al2O3 presents dispersiveness, which is the important factor for own high pore volume and surface area in above measure. It can be observed that the TiO2 particles are well distributed on the γ-Al2O3, and the particle size decreases dramatically as shown in Fig. 5C. The introducing of TiO2 in γ-Al2O3 leads to decrease of pore volume and surface area, and the decreasing amplitude is small because of TiO2 well distribution so that Ti-Al2O3 not only kept high pore volume and surface area but also achieved TiO2 well distribution.
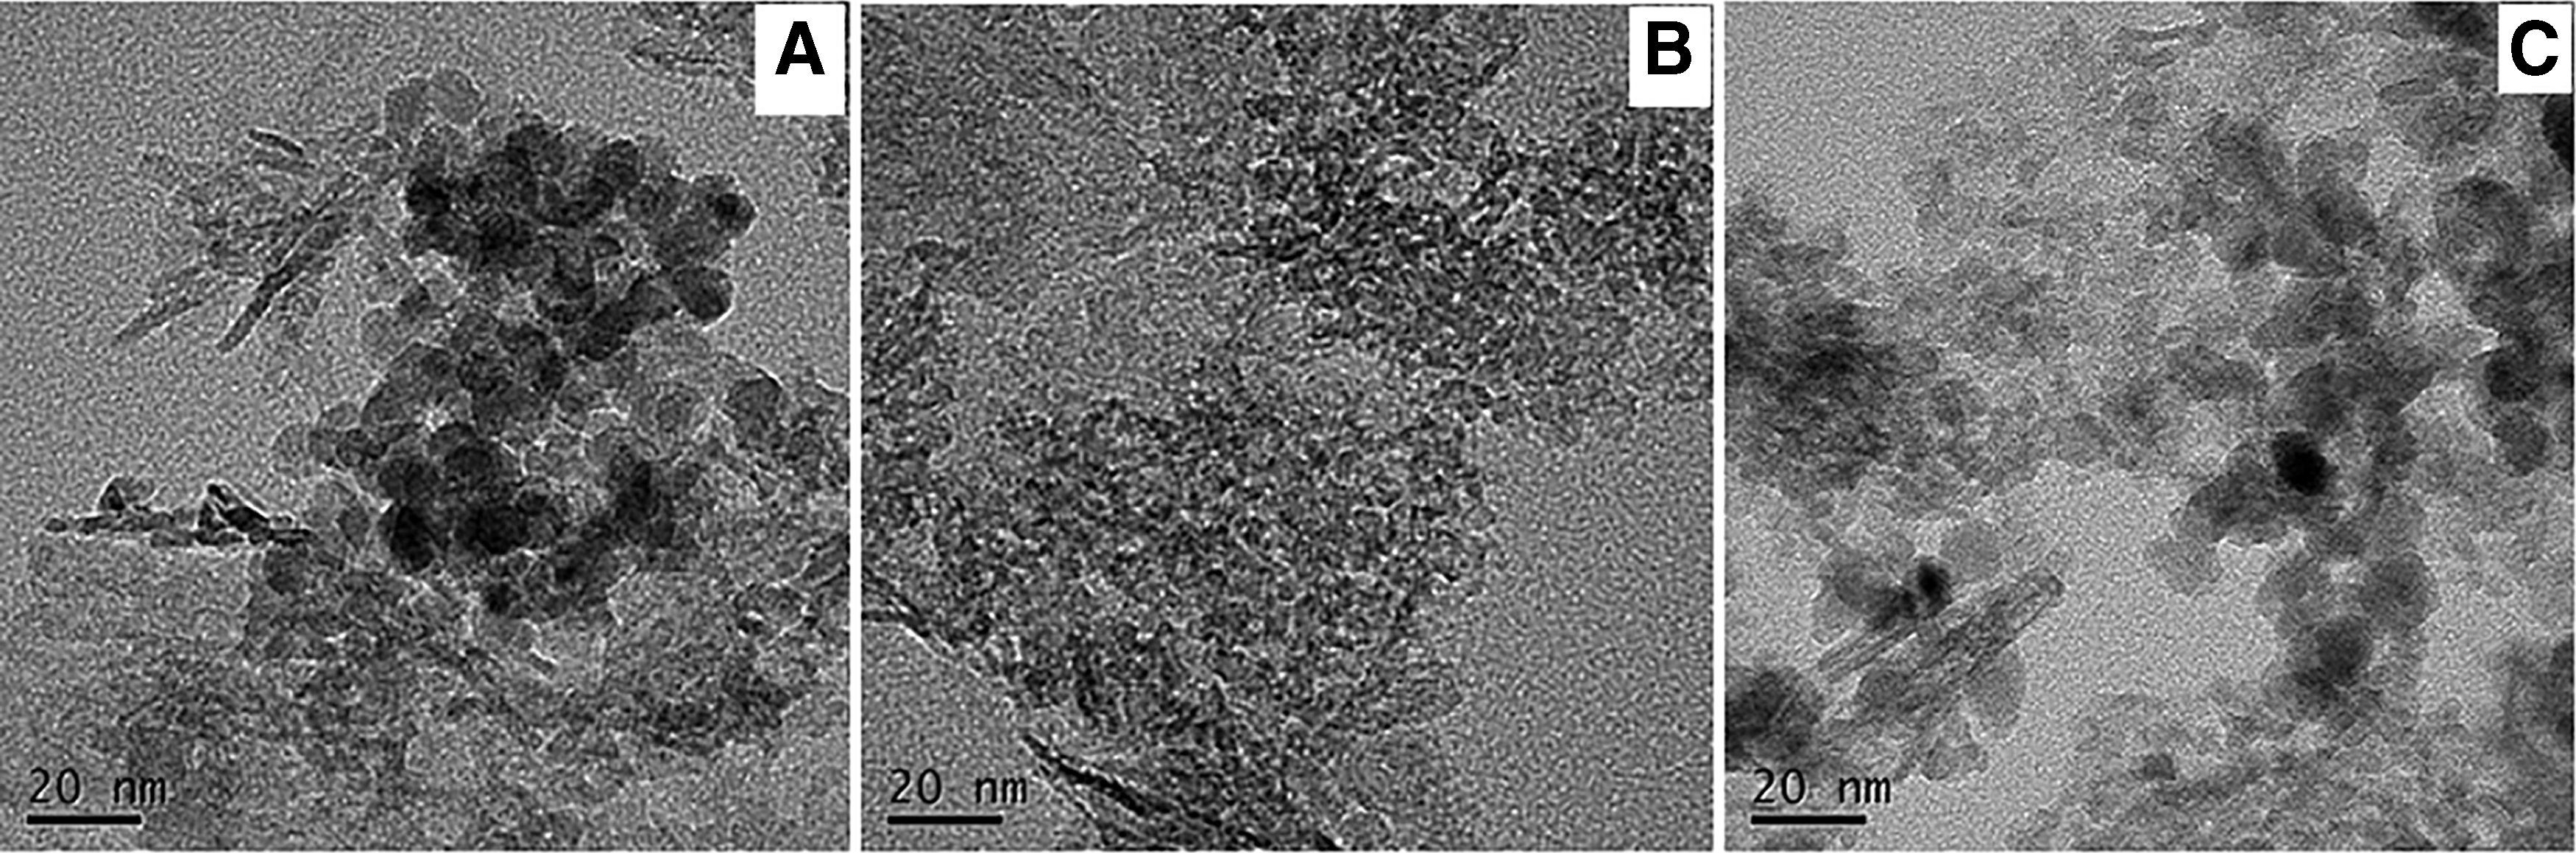
High-resolution transmission electron microscopy of samples,
The XPS spectra of Al 2p, Ti 2p, and O1s were conducted to study the binding energy, as showed in Fig. 6. The Al 2p peaks were found at 74.25 and 74.55 eV on patent of γ-Al2O3 and Ti-Al2O3, which are characteristic for oxidized aluminum (Xu et al., 2016; Bing et al., 2017). A positive shift in Al 2p was observed on Ti-Al2O3 indicating electron transfer between the Ti and Al. As can be seen from Fig. 6B, two peaks attributed to TiO2 are detected between 457 and 460 eV (Ti2p 3/2) and 462–467 eV (Ti2p 1/2) both on TiO2 and Ti-Al2O3 (Moakhar et al., 2017). But it is obvious that peak center of each region on Ti-Al2O3 move to lower binding energy. From XPS spectra results of O1s in Fig. 6C, peaks at 531.05 eV and a minor peak at 531.35 eV in the O1s spectra of TiO2 and Ti-Al2O3 corresponded to the lattice oxygen of TiO2 (Su et al., 2013; Santos et al., 2015) and Al2O3 (Xu et al., 2016), respectively. XPS spectra of O1s on the Ti-Al2O3 show two binding energies at 529.62 and 531.35 eV assigned to TiO2 and Al2O3. There is a remarkable negative shift for Ti-O-Ti on Ti-Al2O3. From all the results of XPS spectra, positive or negative binding energy shift occurred in Al 2p, Ti 2p, and O1s for Ti-Al2O3 compared with TiO2 and γ-Al2O3, which infer that strong interaction happened between Al and Ti, and electron density had changed in the preparation process.

X-ray photoelectron spectroscopy spectra of TiO2, γ-Al2O3, and Ti-Al2O3,
Hydroxy contents of the catalysts were investigated by in situ DRIFTS analysis with NH3 as the probe molecule. The results of NH3 adsorption are showed in Fig. 7. The negative peaks round 3,750, 3,680, and 3,620 are hydroxyl consumption, which were the results of interacting between NH3 and surface hydroxyl groups (Primet, 1971; Hernández-Alonso et al., 2013; Zhang et al., 2017). The area of peaks mirrors the mass of hydroxyl; it is obvious that Ti-Al2O3 owns highest hydroxyl with OH area of 9.85, the next is γ-Al2O3, and TiO2 is least. From this knowledge, the modification of Ti to γ-Al2O3 could add surface hydroxyl even though it decreases the surface area. The strong interaction that happened between Al and Ti in Ti-Al2O3 (results of XPS) would lead to lattice imperfection, which may benefit to generate surface hydroxyl (Orge et al., 2011).

In situ diffuse reflectance infrared fourier transform spectroscopy analysis of hydroxy content.
Activity of catalysts in different Ti contents
According to the results above, it could be preliminarily inferred that the addition of TiO2 would affect the characteristic of γ-Al2O3 and it may be the key active component. So Ti-Al2O3 with different contents of TiO2 was tested for HCN conversion, including 10%, 20%, 30%, and 40%. The results are showed in Fig. 8.
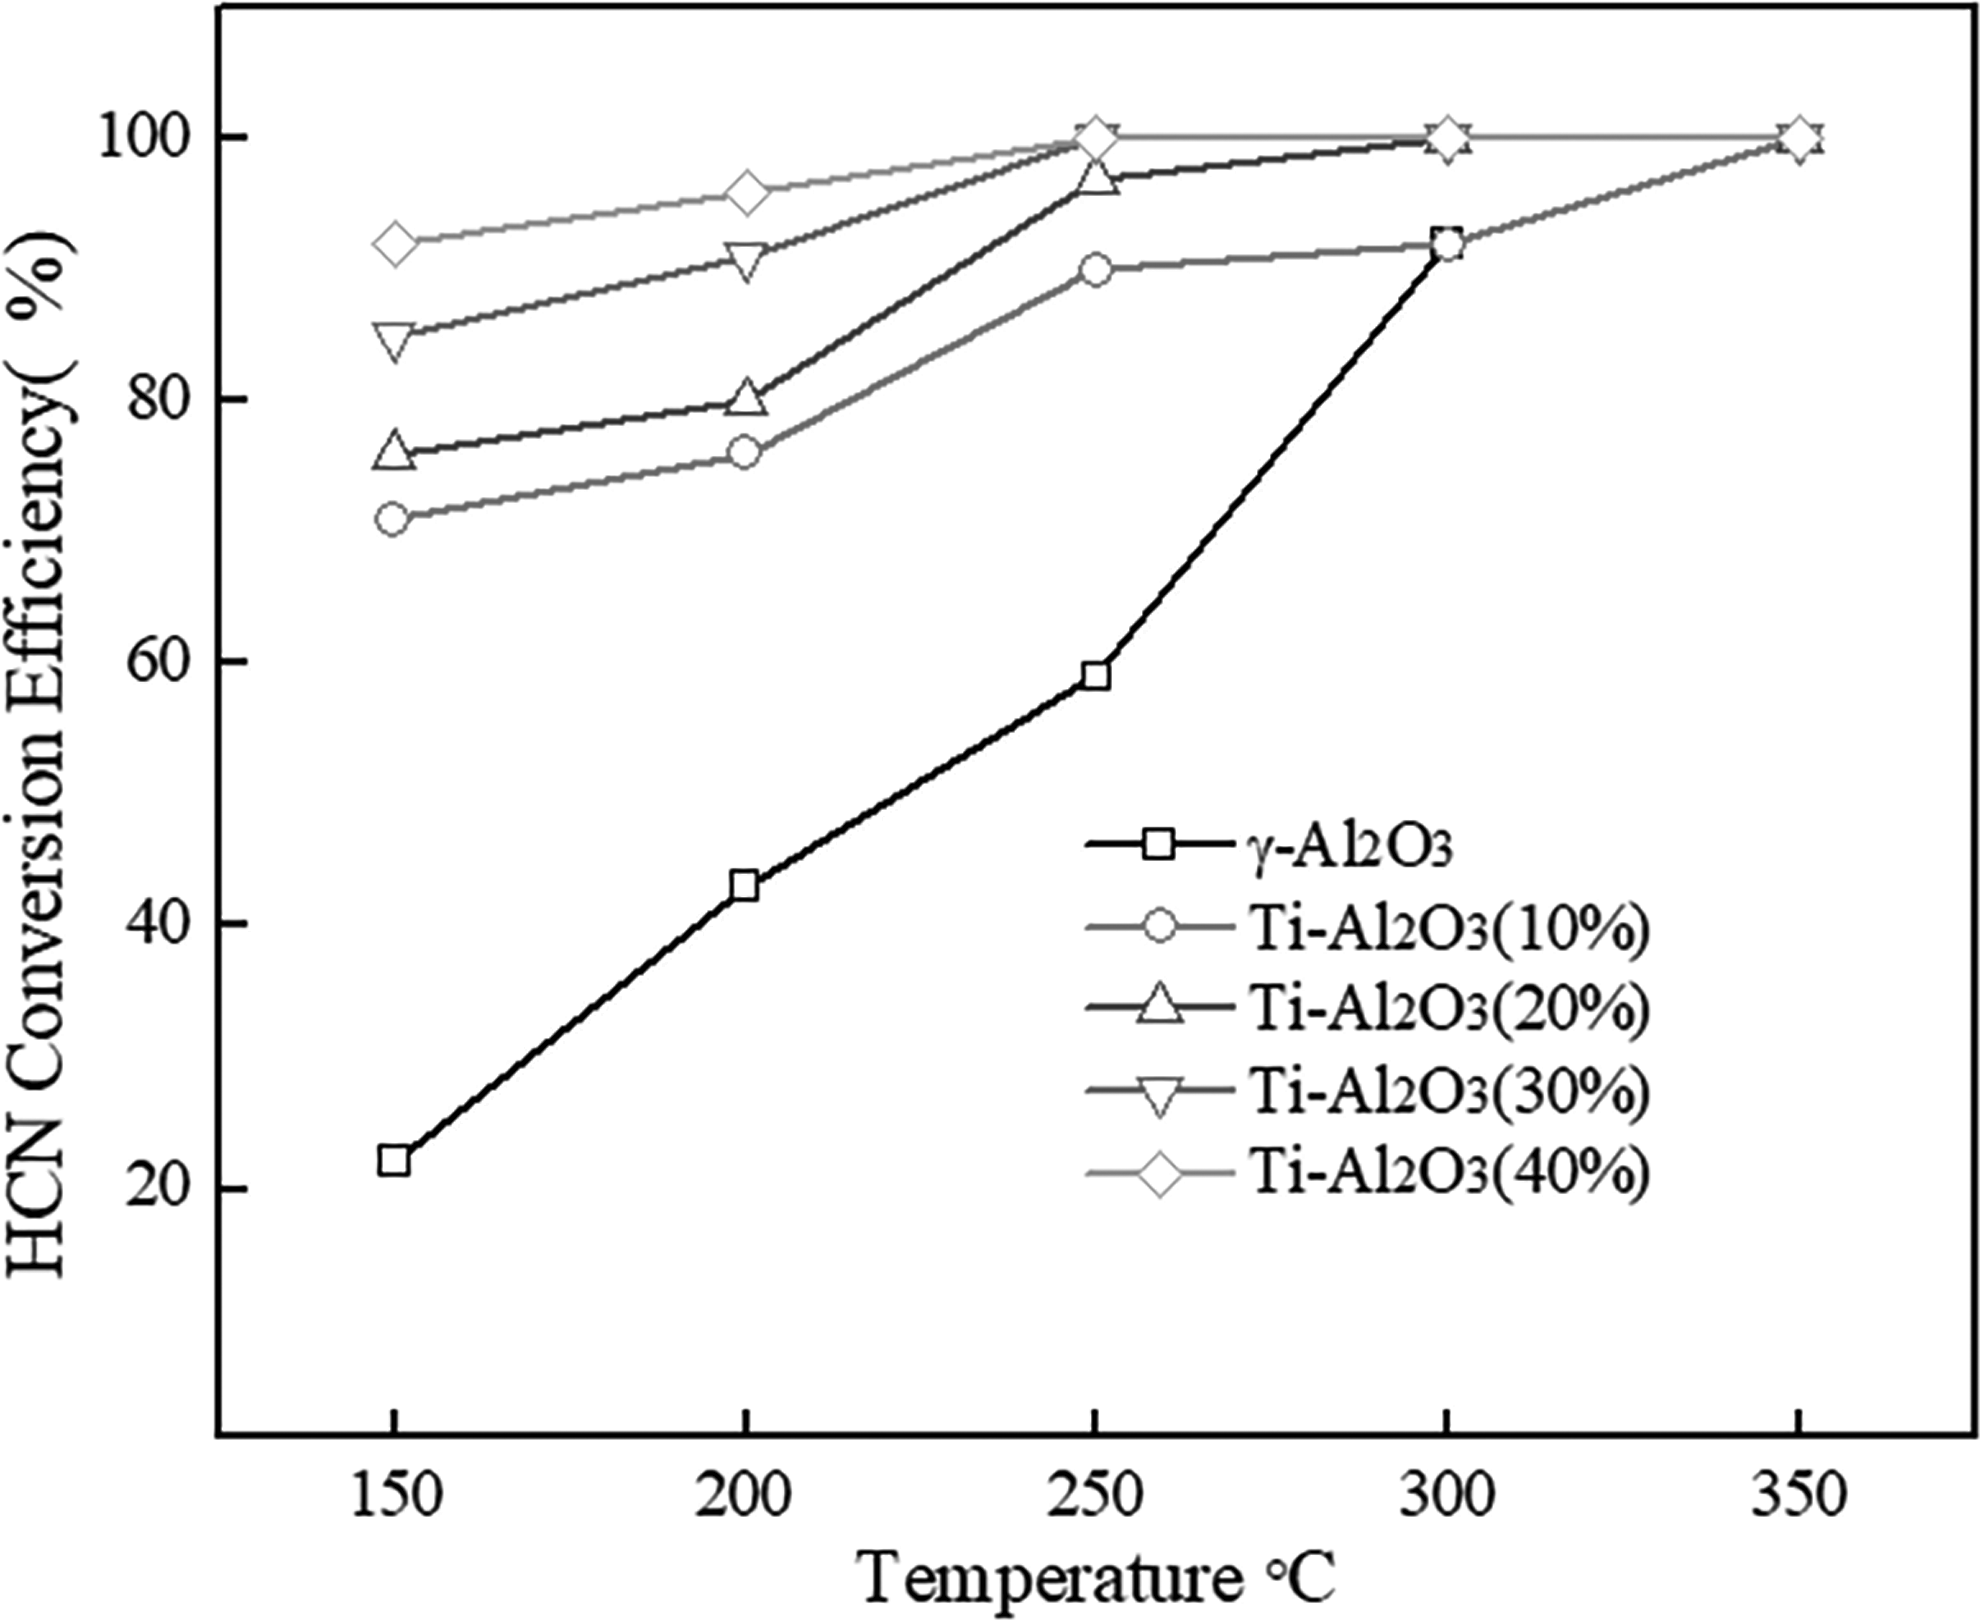
Conversion of HCN with different Ti contents.
Whatever the TiO2 content is, the materials of Ti-Al2O3 showed significantly higher conversion efficiency compared with γ-Al2O3. At the temperature of 150°C, HCN conversion efficiency by γ-Al2O3 with 10% TiO2 reached to 71%, which is only 22% for γ-Al2O3 without TiO2. The higher the TiO2 content was, the higher HCN conversion efficiency was achieved. When the TiO2 content was 40%, the HCN conversion efficiency was above 90% at 150°C, which is a gratifying result. The results also illustrate the key role of Ti in HCN conversion.
Discussion
Based on the experiment and characterization of catalysts, conversion ways of HCN may be as follows:
According to section “Results of activity test”, CO and NH3 are the dominant products of HCN. It can be inferred that Equations (1) and (2) are main conversion way of HCN conversion; CO2 and NO x were formed at higher temperature.
From the experiment result, both the TiO2 and γ-Al2O3 can convert HCN effectively as long as the reaction temperature is high enough. But the HCN conversion improved dramatically at lower temperature when adding Ti to γ-Al2O3 by the preparation method. Ti plays the crucial role in the conversion of HCN. Based on the results of XRD and Raman, TiO2-anatase was formed, which often achieved higher catalytic activity than rutile TiO2 and brookite TiO2 (She et al., 2016; Zhao et al., 2016). The porous structure of pure TiO2 is very poor with low total pore volumes and surface area. That may give few exposure opportunities for HCN, thereby hindering the conversion of HCN on TiO2. For Ti-Al2O3, Ti was loaded on γ-Al2O3, which own abundant pore volumes and surface area. It can be confirmed that TiO2 particles were well distributed on the γ-Al2O3 according to the HR-TEM images, and the TiO2 particle size decreases dramatically. The introduction of TiO2 would decrease pore volumes and surface area, but not too much. So the contact area and the conversion probability were significantly enhanced that benefitted improving the activity of Ti-Al2O3.
Water and hydroxyl groups are important in the conversion process of HCN. TiO2 has strong hydrophilicity, so H2O can be attached on TiO2 in terms of molecule and dissociation. From the results of in situ DRIFTS analysis with NH3, Ti-Al2O3 own abundant hydroxyl groups, which may have resulted from strong interaction that happened between Al and Ti in Ti-Al2O3 from the XPS analysis. In addition, hydroxyl groups can promote the adsorption of HCN as the first step of reaction plus the higher surface area and well distribution of Ti; Ti-Al2O3 showed that high activity at lower temperature resulted from its comprehensive characteristic.
Conclusion
γ-Al2O3 modified with Ti was prepared for HCN conversion in this study. Ti-Al2O3 achieved high pore volumes and surface area with TiO2-anatase being well distributed. More surface hydroxyl was formed because of strong interaction that happened between Al and Ti in Ti-Al2O3. By the contribution of these characteristics, HCN was converted by Ti-Al2O3 effectively. The conversion efficiency of HCN with Ti-Al2O3 reached 82% at 150°C and 100% at 250°C. In the reaction, HCN was converted to NH3, NO x , CO, and CO2; more NO x and CO2 were generated at a higher temperature. The content of Ti has a remarkable impact on HCN conversion that the higher the Ti content was, the higher HCN conversion efficiency was achieved. The HCN conversion efficiency could be above 90% at 150°C when the Ti content was 40%. The selectivity of products and the controlment of reaction path were worth being investigated further for drastically hazard-free treatment of HCN.
Footnotes
Acknowledgments
This work was supported by the National Natural Science Foundation of China (No. 21876071, 51868030) and National Key R&D Program of China (No. 2018YFC1900200, 2017YFC0210503).
Author Disclosure Statement
No competing financial interests exist.