
Abstract
Abstract
Azo dyes play an important role in the printing and dyeing industry. Acid Black 2 dye is one of the most representative dyes with significant toxicity on human health and aquatic organisms. Accordingly, appropriate technologies are needed to efficiently remove these compounds from aqueous environment. In this study, we examined the electrochemical oxidation (EO) of Acid Black 2 on a boron-doped diamond anode. A Box–Behnken design was used to determine experimental factors, namely current density (A), electrolysis time (B), pH (C), and electrolyte concentration (D), and optimize responses to chemical oxygen demand (COD) removal (R1), current efficiency (R2), and energy consumption (R3). Based on obtained models, a desirability function approach to multiresponse optimization was used to optimize response values. The results of response values, R1 = 90.01%, R2 = 80.77%, and R3 = 83.51 kWh/kg (COD), were obtained at optimized conditions. Furthermore, the influence of interactions among operating parameters on responses was analyzed using analysis of variance and three-dimensional surface plots. Finally, an Acid Black 2 degradation pathway was proposed according to intermediates detected by HPLC-MS. In short, these results have certain guiding significance for the energy conservation, technology development, and practical engineering application of EO.
Introduction
With societal progress and development, dye industries make human life beautiful and the environment gorgeous. During production, dyes are used to color clothing, food materials, beverages, and even medicine (Khan et al., 2016). Research has revealed that more than 10,000 commercially available dyes and 700,000 tons of dye are produced annually worldwide (Nidheesh et al., 2018). Approximately 10–15% of dyestuffs have been discharged into the environment; hence, adverse effects such as carcinogenicity and mutagenicity caused by chronic exposure to dye compounds have been increasingly reported, even at rather low concentrations (Wang et al., 2002).
Azo dyes are currently the largest variety of dyes with significant toxicity on human health and aquatic organisms. Various treatment techniques, including anaerobic (reduction) degradation (Sen and Demirer, 2003), adsorption, coagulation, ozonation, photocatalysis (Chen and Liu, 2017; Chen et al., 2019), and electrochemical oxidation (EO) (Martínez-Huitle and Brillas, 2009), have been proposed for dyestuff removal from wastewater. Conventional methods (e.g., anaerobic degradation, adsorption, and coagulation) cannot achieve satisfactory removal efficiency as they are not specifically designed for dyestuff treatment. Although high total organic carbon removal efficiency can be achieved in the photocatalysis process, relatively high cost might be a reason to limit their application in actual engineering (Chen et al., 2017, 2018). Ozonation is an effective method for removal of organic matter, as it exhibits high oxidation performance. However, the degradation of macromolecular organic matter into short-chain carboxylic acids but not completely into CO2 and H2O is a major drawback of Ozonation. Therefore, efficient methods are sorely needed to prevent dangerous accumulation of dyestuffs in solutions.
EO has been shown to be effective at removing a broad array of organic matters due to its ease of operation, economic pricing, and environmental sustainability (Dirany et al., 2010; Steter et al., 2014; He et al., 2018; Jager et al., 2018; Klidi et al., 2018). In EO, organic pollutants are either removed by direct oxidization (i.e., electrons are transferred to the anode directly) or by indirect oxidization (i.e., some hydroxyl radicals are generated and act as mediators in the degradation process) (Song et al., 2010; Särkkä et al., 2015; Salazar et al., 2017; Gurung et al., 2018). EO is a thoroughly examined advanced oxidation process for various wastewater applications, with most studies concerning either anode material or reactor design (Pérez et al., 2017; Xie et al., 2017; Wang et al., 2018). The performance of EO is highly dependent on the activity and stability of the anode. Various anodes such as PbO2, dimensionally stable anodes, and boron-doped diamond (BDD) have shown superb removal efficiency for organic matter (Madsen et al., 2015; Dai et al., 2016a; Cotillas et al., 2018). However, the possibility of releasing lead ions during the EO process is a major drawback of the PbO2 anode. The BDD anode seems to be the best choice, as it exhibits the highest oxygen evolution reaction overpotential and better oxidation performance than alternative approaches.
Apart from anode material, the characteristics of current density, pH, supporting electrolytes, and dye structure also play key roles in the EO of dyes in aqueous solution (Elmolla et al., 2010; De Amorim et al., 2013; Särkkä et al., 2015). The conventional single factor experiments fail to consider interactive and synergistic effects among the factors. Besides, few studies have focused specifically on optimizing relevant parameters and predicting results to reach optimal conditions. Response surface methodology (RSM) is an efficient and flexible experimental design technique for problem modeling and analysis when the response is influenced by several variables (Madadi et al., 2015; Li et al., 2017). Compared to the conventional optimization method, RSM can decrease the number of necessary experiments considerably while also obtaining richer information. RSM based on a Box–Behnken design is the most widely used method for building a second-order response surface model. Given the advantages of RSM, the interactive and synergistic effects among experimental variables can be described along with optimization of operating conditions (Zhang et al., 2011; Wang et al., 2016).
In this study, the BDD electrode and Acid Black 2 solution were selected as anode and synthetic dye wastewater, respectively. The performance of the electrochemical process was evaluated by four parameters, namely current density, electrolyte concentration, solution pH, and reaction time, as the input variables. Chemical oxygen demand (COD) removal, current efficiency, and specific energy consumption were selected as responses. To obtain maximum COD removal and current efficiency at the lowest energy consumption, the desirability function approach for multiresponse optimization was applied in this study. Finally, an Acid Black 2 degradation pathway was proposed according to the intermediates detected by HPLC-MS.
Materials and Methods
Reagents and materials
All reagents were of analytical grade, and all solutions were prepared with ultrapure water (Milli-Q™ system, resistivity = 18/(MΩ·cm) at 25°C). Acid Black 2(C22H14O9N6S2) was purchased from Qingdao Double-peach Specialty Chemicals Group Co, Ltd. (Qingdao, China). The structural formula is shown in Fig. 1.
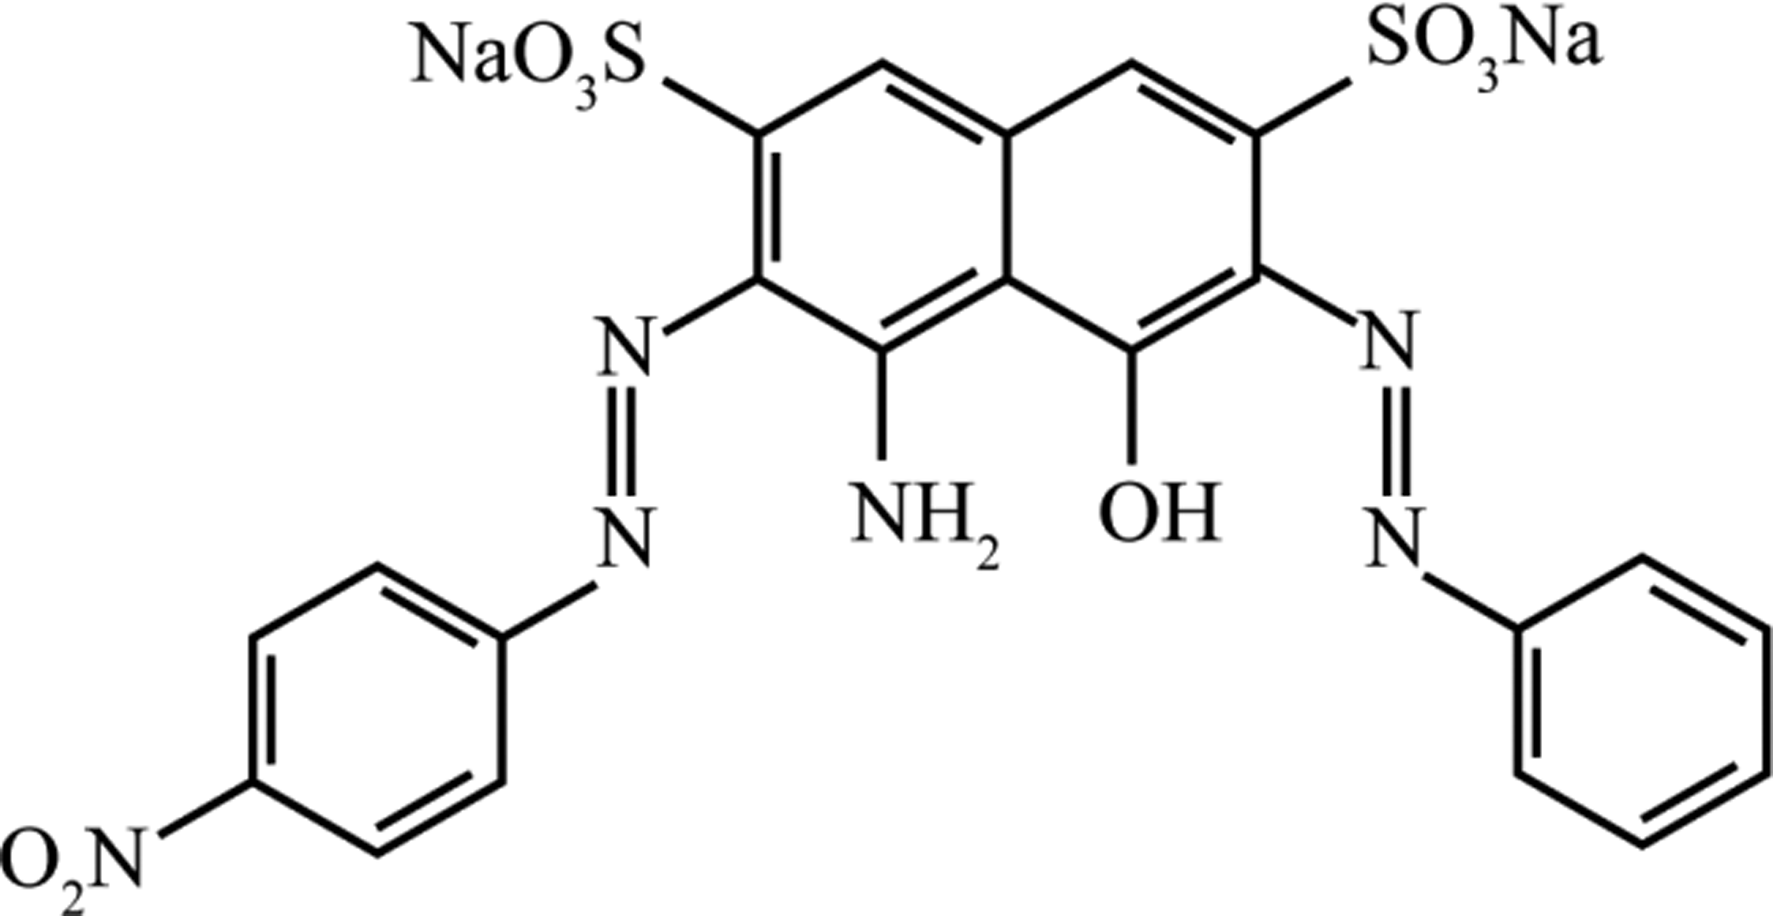
Structural formula of Acid Black 2.
Experimental procedure
EO processes of Acid Black 2 were carried out in an electrochemical system with an effective volume of 100 mL. A 1.5-mm thick BDD electrode with dimensions of 10 cm (length) × 5 cm (width) was selected as the anode, and same-sized stainless-steel plates (SS304) were used as cathodes. Electrode spacing was maintained at 15 mm. A 1,000-mL reservoir contained the test solution, which was in a constant state of flow due to pumping through the electrochemical system before being returned to the reservoir (Fig. 2). In each experiment, samples were taken from the reservoir at predetermined time intervals.

Configuration of electrochemical oxidation experiments.
Experimental design and statistical analysis
To investigate the effects of operating factors on COD removal efficiency (R1), current efficiency (R2), and specific energy consumption (R3), the Box–Behnken design was applied to determine optimal levels of significant parameters and the interactions of those factors. As shown in Table 1, the current density (A) ranged from 20 to 80 mA/cm2, the electrolyte concentration (B) ranged from 0.05 to 0.15 mol/L, the solution initial pH (C) ranged from 4 to 10, and the electrolysis time (D) ranged from 60 to 120 min.
Range and Levels of Independent Variables
RSM responses included COD removal, average current efficiency (ACE), and specific energy consumption (Esc), respectively. ACE and Esc were calculated using Equations (1) and (2) (Kapałka et al., 2008; Zou et al., 2017).
where
A second-order equation, including the interaction terms, was used to calculate the predicted response as shown in Equation (3) (Wu et al., 2012).
where Y is the predicted response,xi,
Analytical methodologies
A double-beam UV visible spectrophotometer (INESA, L8) was used to determine the COD of the samples (American Public Health Association and American Water Works Association, 1989). EEN fluorescence spectroscopy was used to measure the location and intensity of fluorophores in a 1-cm quartz cell using a spectrophotometer (Jobin Yvon Fluorolog 3-21) with a xenon lamp as the excitation source at ambient temperature. Scanning wavelengths were set at emission wavelengths from 200 to 550 nm at 5-nm increments by varying the excitation wavelengths from 200 to 400 nm at 2-nm increments (Bu et al., 2010). The concentration of inorganic substances (SO42−, NO3−, NH4+) was detected by an ion chromatograph (Techcomp 1000, China) with the mobile phase of sodium carbonate (1.8 mM) and sodium bicarbonate (1.7 mM) at a flow rate of 1.0 mL/min. To determine intermediates using HPLC-MS, a 10-μL sample was injected into an HPLC equipped with a Syncronis C18 column 5-μm (250 nm × 4.6 mm) column at 30°C using multistep gradient elution with a mixture of water (A) and methanol (B) (1:4, v/v). The flow rate was adjusted at 0.2 mL/min. The HPLC eluate was further analyzed by MS equipped with an electrospray ion source, which was used in negative mode with a capillary voltage of 4,500 V at 200°C. Spectra were acquired within the m/z 50–600 range.
Results and Discussion
Parameter optimization
The design matrix was used to determine the R1, R2, and R3 responses during the EC process. Findings from a run of 29 experimental sets, as suggested by Box–Behnken design models of RSM, were analyzed by software. Subsequently, ANOVA, regression coefficients, and a polynomial regression equation were obtained. The design and results are listed in Table 2. To reduce systematic bias from extraneous factors, experiments were performed in a random manner.
Design and Results Based on Box–Behnken Response Surface Methodology
COD, chemical oxygen demand.
The quadratic regression model analysis considered all linear terms A, B, C, D; interaction terms AB, AC, AD, BC, BD, CD; and quadratic terms A2, B2, C2, D2 as relevant parameters for responses R1, R2, and R3. The quadratic regression model coded factors for responses as follows:
As shown in Table 3, the ANOVA results demonstrated that the F values for the models of R1, R2, and R3 were 162.18, 210.54, and 81.36, respectively. The value of “Prob > F” for the response was less than 0.05 (<0.0001), indicating that the models were significant with only a 0.01% chance that “Model F value” had occurred due to noise. The ANOVA of significant models had the characteristic of lower p-values (p < 0.0001) and higher F values. Generally, the value of “Prob > F” suggested whether the model was statistically significant; F values for lack of fit implied if the true surface shape could be represented by the calculated response surface. In this work, the F values for lack of fit were 0.9919, 0.8845, and 0.2472, respectively, indicating that both models possessed predictability. In addition, the coefficient of determination (R2) and “Adeq Precision” are other criterions for assessing the degree of fit and the signal-to-noise ratio in the model (Anupam et al., 2015). For the model of COD removal, the values of R2 and “Adeq Precision” were 0.9939 and 45.118, respectively; hence, the model had a high degree of fit, and the signal-to-noise ratio was adequate (>4). For the models of the other two responses (current efficiency and energy consumption), similar conclusions were drawn.
Analysis of Variance for Optimized Response Surface Methodology Model
Furthermore, the values of “Prob >F” could serve as the basis for evaluating whether the model terms were significant. Values less than 0.05 indicate significance, and values greater than 0.10 indicate nonsignificance (Anupam et al., 2011). The detailed results of three responses are listed in Supplementary Tables S1, S2, S3. The significant model terms were ordered as follows: B > A > C > D, B2 > C2 > A2 > D2, AB > CD (R1); C > D > B > A, C2 > B2 > D2 > A2, AB > AC > BD > BC > CD (R2); and B > D > A > C, B2 > C2 > A2, BC > BD > CD (R3). After eliminating insignificant terms from the regression equation and refining the model, the regression equations could be simplified as follows:
The adequacy of developed mathematical models was evaluated by constructing diagnostic plots. Predicted values of the model response versus actual values are shown in Fig. 3. The predicted response values agreed well with the actual values. The data points were closely scattered and demonstrated a linear relationship. The R2 values for three responses were 0.9939, 0.9953, and 0.9879, respectively, further confirming that the RSM model fit the experimental date excellently.
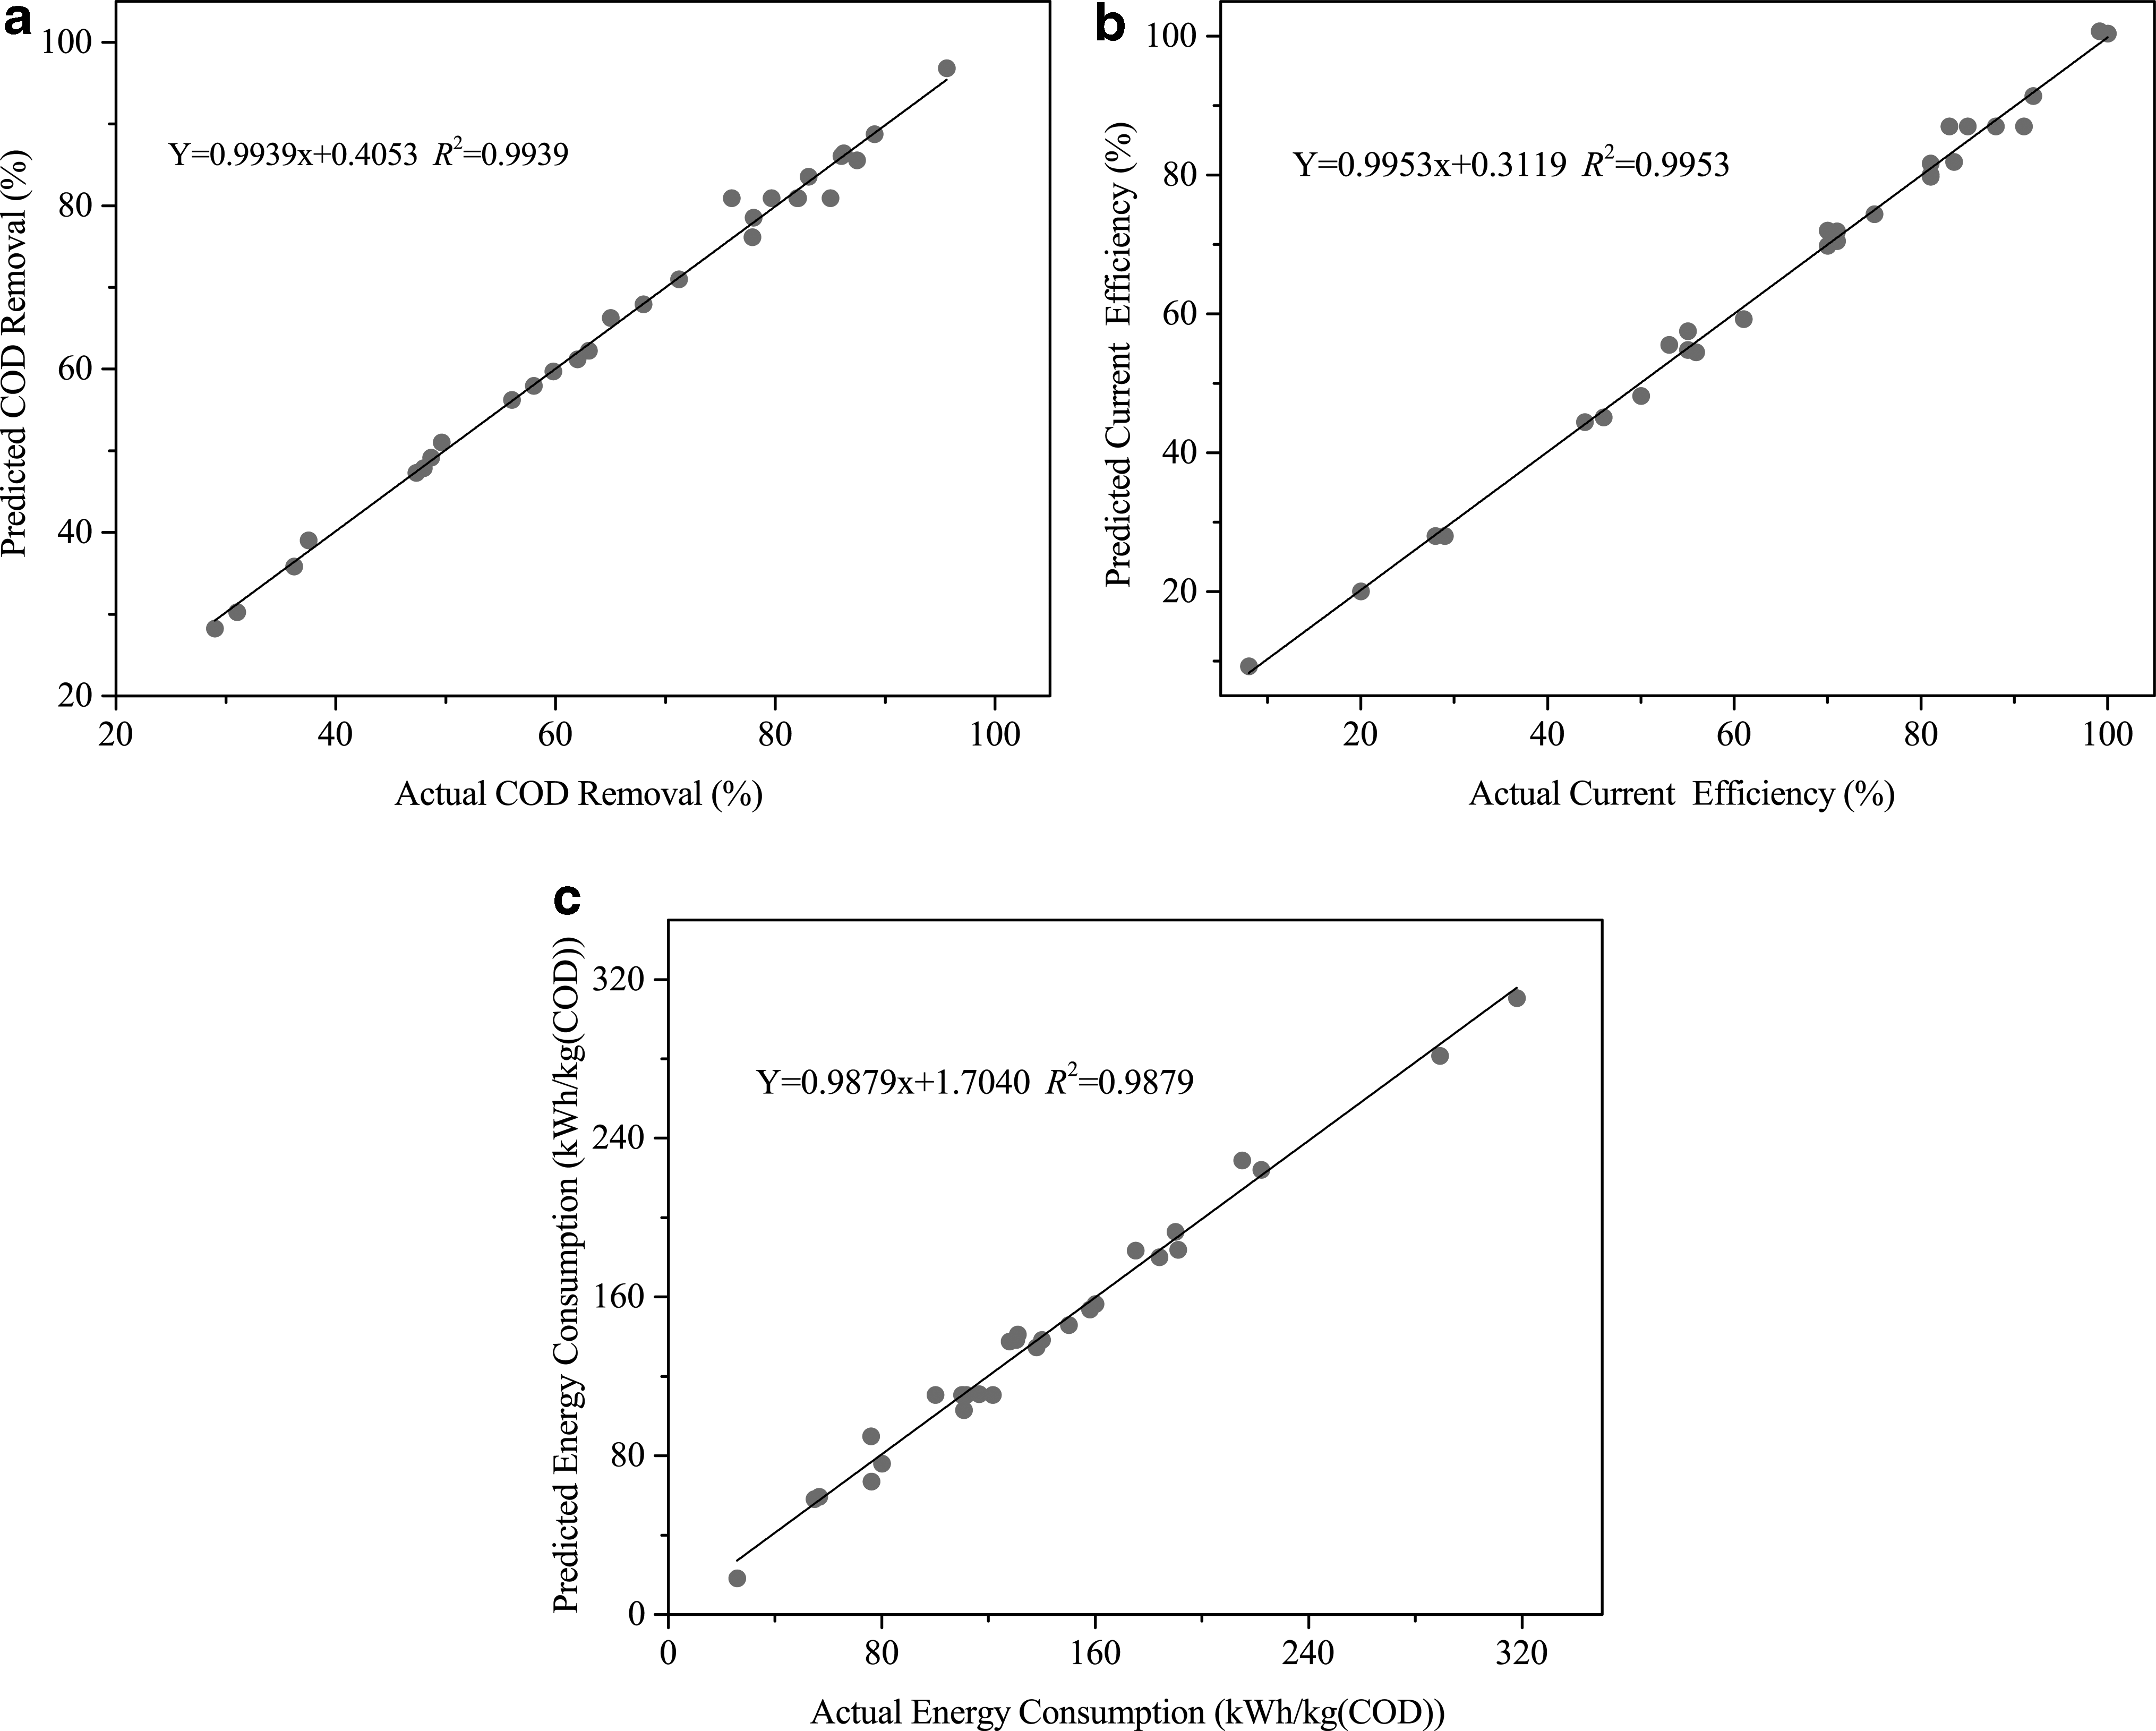
Actual values plotted against predicted values derived from the model for
Effects of process parameters on response
Interactive relationship on COD removal response
According to the ANOVA results, AB and CD were significant terms for the model of COD removal. The interactive relationships among current density and time, pH value, and NaCl dose could thus substantially influence the response trend associated with COD removal. Figure 4 presents three-dimensional (3D) response surface graphs for the response of COD removal and illustrates the interactive relationship among current density and time, pH value, and NaCl dose. As shown in Fig. 4a, increasing the current density and electrolysis time led to an increase in COD removal efficiency. That is, with a rise in current density, the electron speed increased and provided more hydroxyl radicals (Costa et al., 2009; Aquino et al., 2012; Sales Solano et al., 2013). Figure 4b depicts the interactive relationship between solution pH and NaCl concentration, where an increasing pH value and NaCl dose contributed to better COD removal. The EO mechanism in the presence of NaCl is relatively complex. As reported in previous studies, the reactions of water and chloride oxidation coexist in the electrochemical process and are affected by solution pH; a high pH is expected to yield more hydroxyl radicals through oxidation of water, whereas lower pH is expected to favor chloride oxidation and thus enhance organics abatement by active chlorines (Rajkumar and Kim, 2006; Mijin et al., 2012). Moreover, active chlorine species can be determined by the solution pH. HClO is the predominant species responsible for organics oxidation, mainly existing within a pH range from 3 to 8 (Moreira et al., 2017).

Interactive relationships between
Interactive relationship on current efficiency response
Figure 5a illustrates the effect of the interactive relationship of AB on current efficiency response. Current efficiency increased with current density and reaction time; however, current efficiency ceased to increase when the electrolysis time extended to 105 min. Scholars have found current efficiency to decline with an increase in current density because high current density can improve cell voltage, compromising current efficiency. The same phenomenon has been reported in other studies (Dai et al., 2014). Figure 5d describes the response increase with NaCl doses at different reaction times, attributable to enhanced solution conductivity and collision probability among the particles. The current efficiency was not much higher when the NaCl concentration exceeded 0.13 mol/L, likely because a layer of salt was formed on the surface of the anode and exerted a negative influence on direct and indirect oxidation (Dai et al., 2016b). Electrochemical process performance has been found to exhibit a pivotal relationship with solution pH.
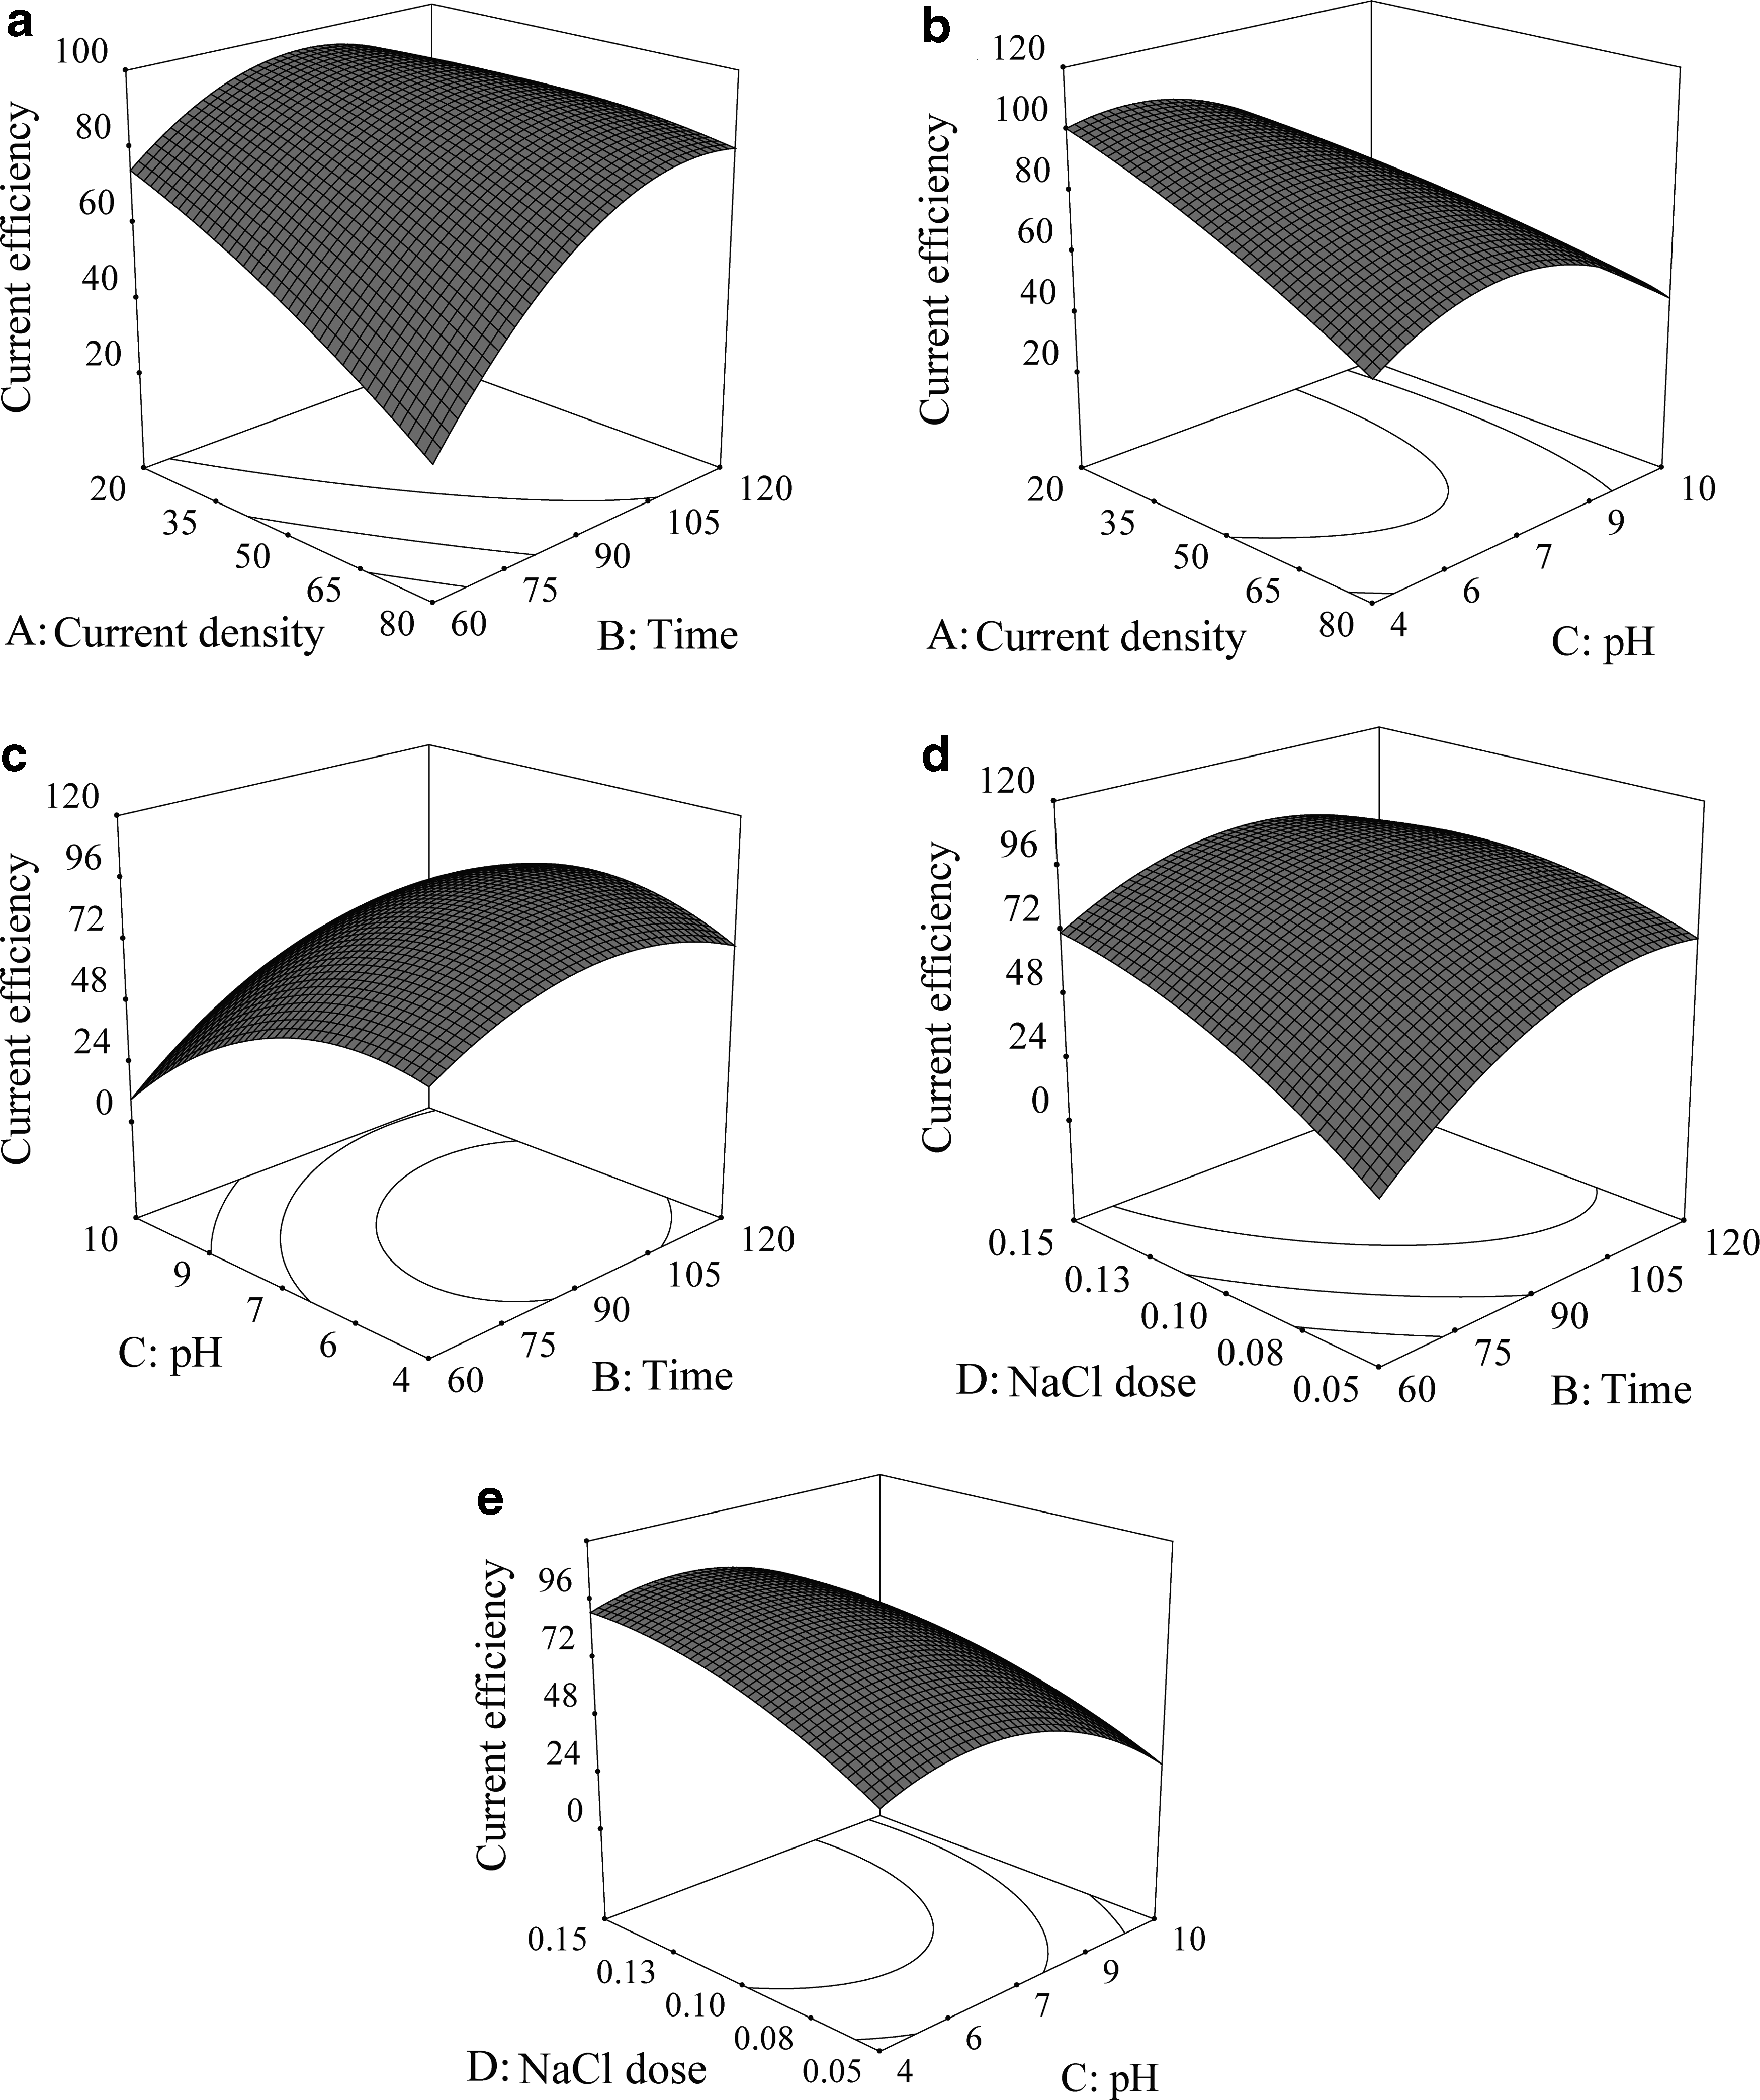
Interactive relationships between
Figure 5b, c, and e shows the interactive relationship between AC, BC, and CD. Among pH ranging from 4 to 10, the value of current efficiency increased with a reduction in the solution pH at different current densities, reaction times, and NaCl doses, respectively. At a lower pH (4 ≤ pH ≤ 7), increasing the solution pH led to a gradual decline in the response value, whereas at a higher pH (7 ≤ pH ≤ 10), an increased pH greatly reduced current efficiency. At a low pH, the concentration and oxidation of active chlorine species can be enhanced as mentioned above. Moreover, current density, reaction time, and NaCl concentration can also affect active chlorine species. For example, at a high current density (or long reaction time or high NaCl concentration), chloride oxidation results in the formation of hypochlorite, which then tends to form other oxidants (ClO2−, ClO3−, ClO4−) whose contribution to organics degradation is expected to be negligible and thus reduce current efficiency.
Interactive relationship on specific energy consumption response
Figure 6 illustrates the effect of the interactive relationship of BC, BD, and CD on the response of specific energy consumption. In Fig. 6a and c, the energy consumption value increased with a decline in the initial solution pH at different reaction times and NaCl doses, respectively. This result is presumably due to the concentration and oxidation ability of active chlorine species at different pH conditions as mentioned earlier. A high degradation ability is conducive to reduced energy consumption in the electrochemical process. Figure 6b illustrates that an increase in NaCl concentration and reaction time reduces energy consumption. On one hand, increasing the NaCl dose is conducive to reducing the cell voltage and therefore saving energy; on the other, with an increase in reaction time, organics in wastewater decline and help to generate competition reactions (e.g., O2 evolution) that waste energy.

Interactive relationships between
Desirability function for response optimization
Response values, namely maximum COD removal, current efficiency, and minimum energy consumption, were optimized using the desirability function approach for multiresponse optimization. The equation of one-side desirability (di) in this study is as follows (Mondal et al., 2012; Bhatnagar et al., 2014):
where r is the positive weight constant of the desirability scale, and Ri, Ri − max are the maximum and minimum response values of three responses. In addition, the overall desirability (D) is evaluated by the geometric mean of all individual desirability functions as follows:
where k is the number of responses (k = 3 in this work). To achieve better performance, we considered COD removal (R1); the current efficiency (R2) was taken as the maximum value, and energy consumption (R3) was taken as the minimum value. In this study, the minimum and maximum acceptable values for R1 and R2 responses were 29.36% and 95.60% and 8.23% and 100.00%, respectively. The minimum and maximum acceptable values for R3 were 25.77 and 318.01 kWh/kg (COD). The form of d3 was slightly different from other one-sided desirabilities due to different desirable values, with the relationship as follows:
Based on new desirability D, the pertinent parameters of the EO process were optimized using Design-Expert software. The operating conditions of the optimized solution were obtained assuming maximum D = 0.938, current density = 53.36 mA/cm2, reaction time = 99.50 min, pH 5.68, and NaCl dose = 0.15 mol/L. The response values indicated COD removal of 90.01%, current efficiency of 80.77%, and 83.51 kWh/kg (COD) of specific energy consumption. Test results were close to the predicted values. The validation indicated with this method can ideally be used to optimize the related parameters and predict anticipated results with acceptable accuracy.
Degradation mechanisms of Acid Black 2
EEN fluorescence spectra change during treatment
Figure 7 depicts the 3D fluorescence spectrum (3DEEM) analysis of EO Acid Black 2 under optimal conditions: current density of 53.36 mA/cm2, reaction time of 99.50 min, pH of 5.68, and NaCl dose of 0.15 mol/L. Figure 7 shows eight principal fluorescence EEM peaks distributed in the tyrosine, tryptophan, and humic acid regions in the Acid Black 2 aqueous solution. After undergoing EO for 120 min, only a few fluorescence peaks remained in the tyrosine and fulvic acid regions. Moreover, fluorescence intensity declined substantially when the blued fluorescence peaks shifted simultaneously, indicating that the aromatic protein species and tryptophan protein species were degraded to simple aromatic protein and humic acid organics. In addition, the removal ability of tryptophan, soluble microbial by-products, and humic acid organics was much better than other species for EO technology. These findings suggest that the dye molecule was degraded to many simple intermediates.

3DEEM of Acid Black 2 during electrochemical oxidation process. 3DEEM, 3D fluorescence spectrum.
Determination of primary intermediates proposed in possible reaction pathway
To better elucidate the mechanism of EO of Acid Black 2, an ion chromatograph and HPLC/MS were used to identify products and intermediates. As shown in Fig. 8, SO42−, NO3−, and NH4+ were detected, and no NO2− was produced in the process. Within 120 min, ∼99% of S atoms were recovered as SO42−. The NO3− concentration first increased from 0 to 1.98 mg/L within 40 min and then declined to 0.73 mg/L. NH4+ concentration also increased throughout the EO process. As for total nitrogen (TN), within 120 min, the concentration declined gradually from 12.5 to 6.9 mg/L. NO3− was reportedly reduced to N2, N2O, and NH3 at the cathodes, which contributed to a decline in TN.

Concentrations of NH4+, NO3−, TN, and SO42− during Acid Black 2 electrochemical oxidation on the BDD anode. BDD, boron-doped diamond.
The organic intermediates of EO of Acid Black 2 are shown in Table 4. The possible degradation pathway of Acid Black 2 was proposed based on the above results, as shown in Fig. 9. Acid Black 2 has four types of functional groups, namely a sulfonic acid group, nitro group, amine group, and azo group, which can be easily attacked by ·OH or active Cl in the EO process. The degradation of Acid Black 2 dye began with initial cleavage of the azo bond, similar to previous studies (Zhou and He, 2007; Rahmani et al., 2010). According to Chem3D version 16.0, among azo bonds (–C–N = N–), the lengths of the bond of C (1)–N (2), N (2)–N (3), and N (3)–C (4) were 1.260, 1.248, and 1.260 A°, respectively, suggesting that C (1)–N (2) or C (8)–N (7) was vulnerable to attack. The ·OH and active Cl radical could attack this site and result in the formation of M1, M2, and M3 and the release of nitrogen elements (Spadaro et al., 1994). Then, M2 would be further degraded to form benzoquinone (M5). M3 could be further oxidized to yield M7 through a series of complicated degradation reactions that cannot be identified in detail. In subsequent steps, the aromatic compounds underwent ring cleavage to form low-molecular matter, including maleic acids, oxalic acids, and ethanol. Finally, these matters were oxidized into CO2 and H2O.

Acid Black 2 electrochemical oxidation pathways on the BDD anode.
Main Degradation Intermediates of Acid Black 2 Electrochemical Oxidation on the Boron-Doped Diamond Anode
Conclusion
In this study, degradation of Acid Black 2 in aqueous solution by EO was modeled and optimized with a Box–Behnken design and desirability function approaches. Selected factors were current density, electrolyte concentration, solution initial pH, and electrolysis time; responses were COD removal efficiency (R1), current efficiency (R2), and specific energy consumption (R3). ANOVA results revealed a high correlation coefficient for R1 (R2 = 0.9939 and Adj-R2 = 0.9877), R2(R2 = 0.9953 and Adj-R2 = 0.9905), and R3 (R2 = 0.9879 and Adj-R2 = 0.9757), suggesting acceptable alignment of the quadratic polynomial response model with the experimental data. The maximum 90.01% COD removal, maximum 80.77% current efficiency, and minimum 83.51 kWh/kg (COD) energy consumption were obtained with an overall desirability of 0.938 under optimal conditions: A = 53.36 mA/cm2, B = 99.50 min, C = 5.68, and D = 0.15 mol/L. Intermediates generated by EO of Acid Black 2 were identified using IC and HPLC/MS. A potential degradation pathway of Acid Black 2 was proposed. From these results, EO by BDD anodes appears to be an effective treatment of wastewater containing this dye class.
References
Supplementary Material
Please find the following supplemental material available below.
For Open Access articles published under a Creative Commons License, all supplemental material carries the same license as the article it is associated with.
For non-Open Access articles published, all supplemental material carries a non-exclusive license, and permission requests for re-use of supplemental material or any part of supplemental material shall be sent directly to the copyright owner as specified in the copyright notice associated with the article.