
Abstract
Residual biosolids from wastewater treatment facilities and the organic fraction of municipal solid waste (OFMSW), such as food and yard wastes (FW and YW), are difficult to manage due to increased waste generation and recent stringent regulations. This study investigated the effect of substrate to inoculum ratio (S/I) on biochemical transformation mechanisms and biomethane production during high solids anaerobic digestion of FW, YW, and biosolids. Biochemical methane potential (BMP) assays were set up under mesophilic conditions at S/I of 1.0, 2.0, and 3.0 g OFMSW total solids (TS)/g inoculum TS. BMP with the lowest S/I (1.0) produced the highest cumulative CH4 yield of 126 mL CH4/(g VSadded), with 90% of its maximum yield by day 37, and a hydrolysis rate constant (Khyd) of (0.06 day−1). S/Is 2.0 and 3.0 resulted in higher volatile fatty acid release than S/I 1.0. This led to pH-induced inhibition of methanogenesis, longer lag phases (S/I 2.0 = 12 days and S/I 3.0 = 26 days)], and lower cumulative CH4 yields [S/I = 2.0 at 45.6-mL CH4/(g VSadded); S/I = 3.0 at 6.75-mL CH4/(g VSadded). The results show that accumulation of inhibitory intermediates can cause system failure due to mass transfer limitation under low moisture conditions when S/I > 1.0 based on TS. Results from this work assist in developing best solid waste management practices for OFMSW and resource recovery.
Introduction
The organic fraction of municipal solid waste (OFMSW) includes mixed organics, such as food waste (FW) and yard waste (YW), as well as paper products (Campuzano and González-Martínez, 2016). In many countries, the most common disposal alternative for OFMSW is in landfills, which have high land requirements, emit greenhouse gases, and produce leachate with high concentrations of ammonia and recalcitrant organic matter (Kjeldsen et al., 2002; Aghdam et al., 2019). Handling OFMSW is becoming more expensive and complex due to increased tipping fees, banning of organic waste disposal in landfills, and mandated source separation of organic wastes (Linville et al., 2015; Hinds et al., 2018).
Landfills are a depletable resource and need to be replaced when they become full (Ready and Ready, 1995). Community anaerobic digestion systems are being studied at many U.S. universities such as the University of South Florida, University of California Davis, University of Michigan, and Princeton University. Policies are being developed in the United States to use anaerobic digestion systems to remove organic waste away from landfills (Edwards et al., 2015). The U.S. EPA has made changes to the renewable fuel standard to include biogas as a fuel to meet renewable volume obligations. As part of zero waste goals, the cities of Madison, WI, and San Francisco, CA, restrict organic waste incineration and landfilling. Currently, there are 25 states that have bans on landfill disposal of YW (Linville et al., 2015). Management of residual biosolids from wastewater treatment facilities is also a significant problem due to concerns over excess nutrients, pathogens, odors, vector attraction, and limited capacity for resource recovery from the waste (Seiple et al., 2017). It is thus critical that alternative organic waste management solutions are explored, which contribute to waste minimization and resource recovery, while reducing greenhouse gas emissions.
Anaerobic digestion of OFMSW and biosolids is an alternative waste management strategy that includes recovery of CH4 for energy production and digestate for fertilizer. There are two main types of anaerobic digesters, wet [<15% total solids (TS)] and dry (15% ≥ TS) (Brown et al., 2012). In the United States, most anaerobic digesters are wet (EPA, 2019), but dry or high solids anaerobic digesters (HS-AD) are becoming an attractive alternative worldwide due to lower water requirements, reduced leachate production, smaller digester size, lower heating needs, and reduced maintenance requirements (Kayhanian, 1995; Chynoweth et al., 2001; Karthikeyan and Visvanathan, 2013; Chen et al., 2014). OFMSW and biosolids are a readily available source of organic substrate and co-digestion of these wastes can improve the economics of HS-AD projects (Ergas et al., 2018).
Anaerobic digestion of readily biodegradable organic matter, such as FW, can result in rapid production of long-chain fatty acids and volatile fatty acids (VFAs) that can exceed the utilization rate of methanogens, resulting in decreased reactor pH and microbial inhibition (Khanal, 2011). This is a particular concern in HS-AD, as the low water content and heterogeneous mixing in these reactors result in low mass transfer rates of intermediates to microbial communities, resulting in formation of microniches where VFAs can accumulate (Karim et al., 2005).
The selection of an appropriate substrate to inoculum ratio (S/I) is critical for preventing VFA accumulation during anaerobic digestion with the intention of maximizing methanogenic yield. Too high of an S/I overloads microbial populations, while an S/I that is too low results in large reactor volume requirements and less CH4 (Hinds et al., 2018). S/I of FW to anaerobic digested sludge at 0.3 in Hobbs et al. (2018) study was close to reaching CH4 saturation by the end of the test, but produced the least amount of CH4 compared to 1.0 and 2.1 during wet AD. Higher S/I of OFMSW may lead to increased production of CH4 due to OFMSW buffering capacity.
The first-order kinetic phenomena for municipal solid waste can be described for wet AD of OFMSW (Boulanger et al., 2012; Trzcinski and Stuckey, 2012). Trzcinski and Stuckey (2012) studied the effect of S/I on wet anaerobic digestion of FW, paper waste, and garden waste at ratios of 0.4, 0.2, and 0.07 based on VS and observed the highest CH4 yield at an S/I of 0.4. The highest S/I 0.4 had a hydrolysis constant of 0.112 day−1 compared to 0.151 and 0.221 day−1, compared to the other two ratios (Trzcinski and Stuckey, 2012). Although HS-AD studies have assessed S/I ranging from 0.25 to 16.67 for multiple substrates investigating parameters that influence performance (Boulanger et al., 2012; Trzcinski and Stuckey, 2012; Li et al., 2018), literature is limited on hydrolysis of HS-AD of FW, YW, and biosolids and S/I that may yield higher methane. Thus, a study focusing on the effects of S/I for OFMSW in HS-AD and its hydrolysis may provide insight for managing the largest waste products in the United States.
This research is centered around the impact of S/I ratio on mesophilic high solids anaerobic co-digestion of FW, YW, and biosolids in Hillsborough county, FL. Currently, the county utilizes the substrate to substrate ratio. The overall goal of this work is to contribute to the understanding of the reactor's parameters required to maximize bioenergy production from HS-AD of OFMSW and biosolids. Biochemical methane potential (BMP) assays were carried out with varying S/I. Measurements of chemical parameters, including pH, VFA, NH3-N, and alkalinity concentrations, were used to elucidate biochemical mechanisms. Hydrolysis rate constants were calculated to interpret kinetics based on cumulative CH4 production (Koch et al., 2015).
Results from this study have implications for reducing OFMSW and biosolids disposal in landfills, increasing CH4 produced for bioenergy generation, and producing fertilizer or soil conditioner from digestate.
Materials and Methods
Materials
The inoculum used in this study was dewatered sludge from a wet anaerobic digester at the City of Clearwater Northeast Advanced Wastewater Treatment Facility (Clearwater, Florida). The facility digests a mixture of primary and waste activated sludge (WAS) under mesophilic conditions at a solid retention time of 21 days. The inoculum was centrifuged at the plant to achieve ∼20% TS content. Before the start of the experiment, inoculum was acclimated for 21 days at 35°C with the experimental substrates and solid-phase alkalinity sources (described below).
Synthetic FW and YW were used in this study to obtain repeatable results (Table 1). The FW mixture was based on a typical FW composition (Ariunbaatar et al., 2014). YW composition was based on feedback from a waste management facility in Hillsborough County Florida (United States). The primary composition of YW was oak leaves, pine needles, grass cuttings, and wood. FW ingredients were processed using a Hamilton Beach model 70725A series A5351CE food processor (Miami Lakes, FL) for 30–60 s, and then sieved through a 3 × 3-mm mesh. YW was prepared as described by Hinds et al. (2016) and sieved through a 3 × 3-mm mesh.
Food and Yard Waste Composition by Mass Fraction
FW, food waste; YW, yard waste.
Municipal biosolids consisted of dewatered (by screw press) WAS from the Falkenburg Advanced Wastewater Treatment Plant (WWTP) (Tampa, FL). Biosolids were dewatered at the facility with the addition of SNF Polydyne SE-1012 Polymer. A mixture of NaHCO3 and crushed oyster shells was added to achieve 3 g/L of added alkalinity (as CaCO3). Crushed oyster shells were purchased from a local feed store and sieved through a 3 × 3-mm mesh. The mixture was based on preliminary experiments (Ergas et al., 2018) that showed a mixture of 33% NaHCO3 (Arm & Hammer Baking Soda, Princeton, NJ) and 67% crushed oyster shells provided a good mix of fast acting and slow-release alkalinity.
BMP assays
BMP assays were performed based on methods as described by Angelidaki et al. (2009) and Chynoweth et al. (1993). Substrates were mixed with acclimated inoculum and deionized water to achieve 15% TS and added to 250 mL glass serum bottles to yield S/I shown in Table 2. For the different S/I ratio mixtures, the substrate, inoculum, and water amounts changed to yield the same total mass (100 g wet weight) and TS content (15% TS) added to each of the reactors. Note that inoculum-only blanks were adjusted from the “as received” value to 19% TS on day 10. S/I values used in this study were based on a literature review of previously studied S/I for similar substrates (Chen et al., 2014; Liao et al., 2014; Hobbs et al., 2018). BMP assays were carried out in triplicate along with five inoculum-only blanks run in parallel. Blanks were used to determine CH4 production from the inoculum. The inoculum was degassed to remove residual material. After the S/I material was added, bottles were flushed with N2 gas, to remove headspace gases, and placed in a 35°C thermostatically controlled room for 24 h.
Experimental Setup by Total and Volatile Solids
S/I, substrate to inoculum ratio; TS, total solids.
Analytical methods
Biogas samples were collected every 2 days from each digestion bottle headspace using a 50-mL frictionless syringe (5157; Cadence Science, Inc.) equipped with a 25-gauge needle (Z192406-100; BD Precisionglide). Digestion bottles were shaken vigorously before each measurement to dislodge trapped gas bubbles. The CH4 content of the biogas was measured by dissolving 20 mL of the collected biogas into a 3N NaOH barrier solution and measuring the remaining gas volume (ASTM D1827-92, 2002). Note that this method assumes that biogas consists of CH4 and CO2, with negligible quantities of other inert gases (e.g., N2 H2). Biogas and CH4 volumes were adjusted to standard temperature and pressure (STP: 273.2 K and 101.3 kPa).
BMP experiments ran for 47 days, starting with nine reactors per S/I ratio. Solid and liquid chemical analyses were performed weekly on the BMP digestate using one sacrificed BMP assay from each S/I digestion set. Inoculum-only blanks were sacrificed for analysis every 2 weeks. TS and VS were measured according to Standard Methods (2540B and E) (APHA et al., 2012). Liquid extracts were prepared with 15 g of wet sample diluted with 30 mL of deionized water, vortexed for 3 min, and centrifuged at 4,500 rpm for 10 min using an Eppendorf 5810 Centrifuge (Hauppauge, NY) (EPA Method 9045D; USEPA (Agency, 2007). Standard Methods (APHA et al., 2012) were used to measure the liquid extract pH (4500-H+B), soluble chemical oxygen demand (sCOD) (5200B), and alkalinity as CaCO3 (2302B). HACH test kits (HACH, U.S. TNT 872) and a HACH DR2800 Spectrophotometer (Loveland, CO) were used to measure total VFA as acetic acid (HAc). A Timberline Instruments model TL-2800 Ammonia Analyzer (Boulder, CO) was used to measure total NH3-N (TAN).
Data analysis
CH4 yield was calculated by dividing the cumulative CH4 production (mL) (corrected to STP) by the mass of VS:
CH4 production data were analyzed using paired t-tests comparing the means of the replicate data (significance level is α = 0.01) (Washington et al., 2010). As samples were sacrificed throughout the experiment, the degrees of freedom for the experimental sets changed, which were taken into consideration to determine significance.
Hydrolysis of complex organic matter to soluble compounds can be a rate-limiting step for CH4 production (Pavlostathis and Giraldo-Gomez, 1991; Bolzonella et al., 2005). First-order hydrolysis model was used to interpret the hydrolysis kinetics from the cumulative CH4 production:
For this equation, Y = cumulative CH4 production from the BMP assay at time t (mL), Ymax = ultimate CH4 yield from the BMP assay at the end of the incubation time (mL), t = time (day), and khyd = first-order hydrolysis rate constant (day
In this equation, the slope is the hydrolysis rate constant (khyd).
The differences between S/I khyd were statistically analyzed using the paired t-test in Microsoft Excel 2019.
Results and Discussion
Cumulative CH4 generation and yield
CH4 generation from the inoculum-only blank demonstrated that acetoclastic methanogens (methanogenesis from acetate) were present, since no soluble organic molecules (sugars, amino acids, and/or fatty acids) were added (Fig. 1a). A lag time of at least 9 days was observed, after which gas production for S/I = 1.0 increased linearly and S/I = 2.0 increased exponentially. Ninety percent of the maximum CH4 production for S/I = 1.0, 2.0, and 3.0 was obtained on days 37, 45, and 22, respectively. Over the length of the experiment, ratio 1.0 produced significantly greater overall CH4 volume (2.320 mL CH4) and a significantly higher methanogenic yield (126 mL CH4/(g VSadded) than the other to S/Is (Fig. 1b). In contrast, S/I = 2.0 produced 824 mL CH4 [(45.6 mL CH4/(g VSadded)] and S/I = 3.0 produced 159 mL CH4 [(6.75 mL CH4/(g VSadded)] by day 47 of the experiment. Ratio 2.0's CH4 production increased on day 31. Ratio 3.0 never transitioned into a rapid phase of CH4 production.
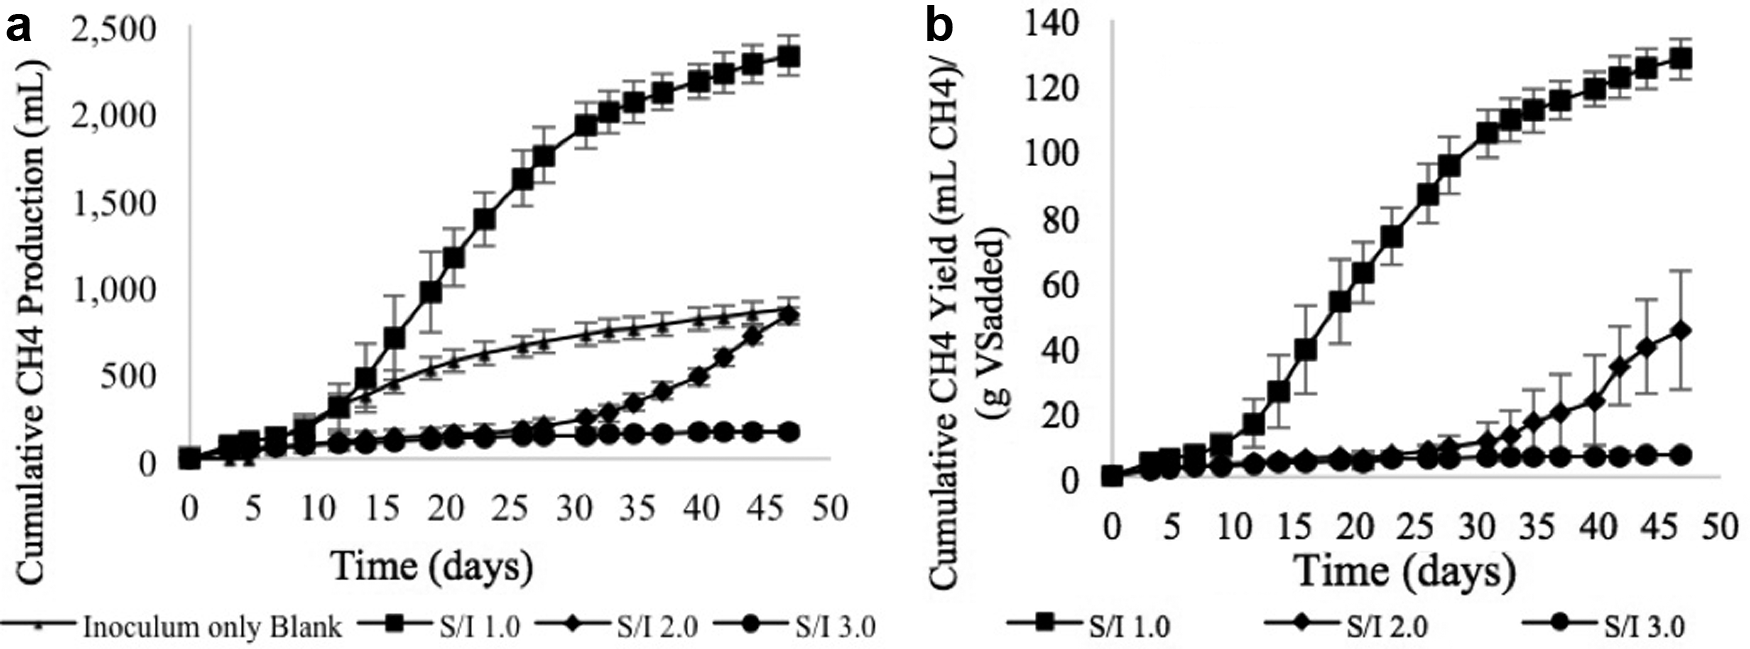
BMP assays at S/I = 1.0, 2.0, and 3.0 g substrate TS/g inoculum TS.
BMPs with S/I = 1.0 transitioned into a rapid phase of CH4 production after 9 days. This performance is likely due to the high amount of inoculum, which resulted in reactor parameters in the optimal range for methanogenic activity. BMPs with S/I = 2.0 eventually began to yield CH4, but had a long lag phase, incomplete conversion, and did not reach saturation by the end of the experiment. Results from S/I = 3.0 imply that a low inoculum concentration results in substrate overload. Due to the CH4 measurement method used, there may have been some H2 present that was accounted for as CO2. Kim et al. (2004) and Lay et al. (1999) observed H2 production at high S/I and minimum CH4 production. The results show that increased CH4 production is achieved with more balanced S/I. The findings are similar to Lopes et al. (2004) and Hobbs et al. (2018) who studied S/I for wet anaerobic digestion.
Chemical characteristics of S/Is
Initial pH readings for the inoculum-only blank, S/I 1.0 mixture, 2.0, and 3.0 were 8.70, 8.08, 7.82, and 7.50, respectively. As S/I increased, final alkalinity and pH decreased (Fig. 2). This trend indicated that greater alkalinity consumption occurred with higher substrate fractions. Consequently, this led to pH-induced suppression of methanogenesis for ratio 3.0, which negatively impacted CH4 production (Fig. 1a, b). The high alkalinity and pH for ratio 1.0 coincide with the greatest amount of CH4 production compared to ratio 2.0 and 3.0 (Fig. 2).
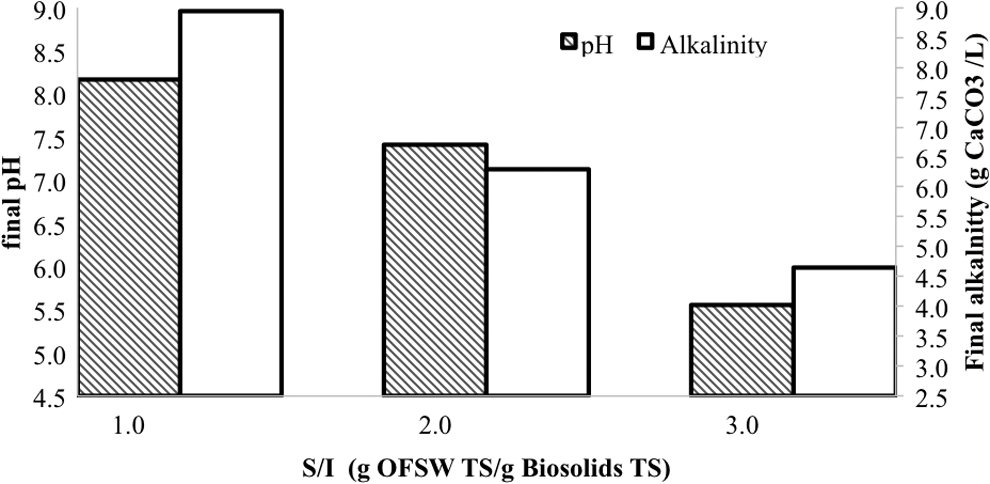
Final pH and alkalinity for BMP assays at S/I = 1.0, 2.0, and 3.0 g substrate TS/g inoculum TS.
pH measurements can be used as indicators of acid-induced microbial inhibition that causes reactors to produce negligible amounts of biogas and CH4. Guan et al. (2015) stated that HS-AD microbial inhibition occurs in anaerobic digesters at pH values <6.0.
Figures 3 and 4 illustrate VFA and TAN concentrations throughout the duration of the experiment. From day 0 to 6, all S/I VFA and TAN concentrations increased due to the high quantity of easily degradable substrates present. Through day 20 until the end of the test, VFA concentrations remained high for S/I values of 2.0 and 3.0, while concentrations of VFAs decreased for ratio 1.0.
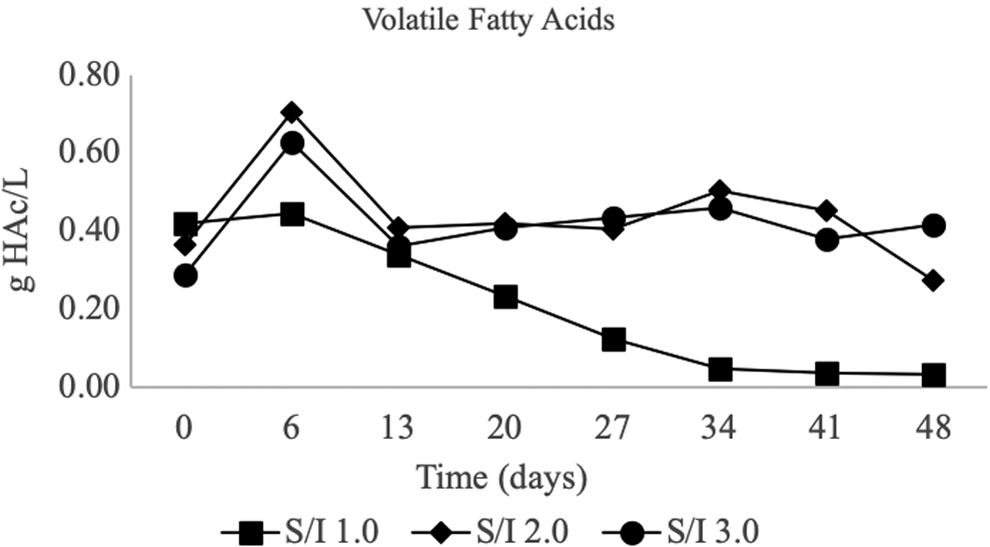
Variations in VFA concentrations versus time for BMP assays at S/I = 1.0, 2.0, and 3.0 g substrate TS/g inoculum TS. VFA, volatile fatty acid.
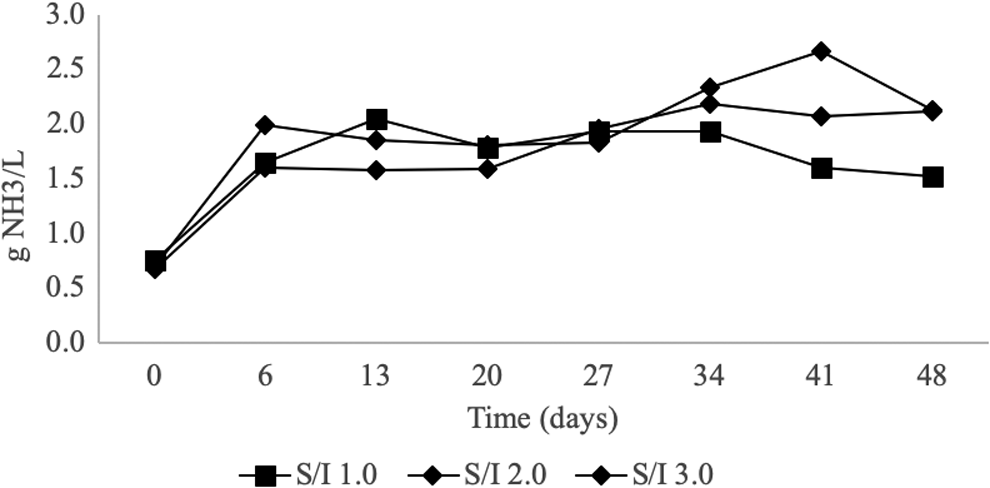
TAN versus time for BMP assays at S/I = 1.0, 2.0, and 3.0 g substrate TS/g inoculum TS. TAN, total ammonia nitrogen.
When the S/I is too high, it can lead to the rapid degradation of carbohydrates and overload the system with high concentrations of VFAs. For example, S/I = 3.0 had the highest VFA concentration and produced the least amount of CH4 over the length of the experiment. On the contrary, ratio 1.0 had the least amount of VFAs and produced the most CH4. This is most likely due to the high concentration of the inoculum's active methanogens. In addition, although high TAN concentrations result in the inhibition of methanogenesis (Hinds et al., 2018), levels of TAN below 3.5 g/L are tolerable for HS-AD as NH3 contributes buffering capacity and metabolic stability (Ahring and Westermann, 1988; Bujoczek et al., 2000).
Brown and Li (2013) stated that pH and VFA/alkalinity ratios are common stress indicators in the AD process. Khanal (2011) determined that VFA concentrations exceeding 10,000 mg/L can cause microbial inhibition. HS-AD systems sometimes experience acidic microbial deficiencies when the microbial communities in the system are not balanced or when an easily degradable substrate, such as FW, is introduced into the system, resulting in VFA accumulation (Forster-Carneiro et al., 2008).
Figure 5 shows the weekly sacrificed reactors sCOD concentrations and VFA:sCOD ratios. As the S/I increased, the initial sCOD concentrations increased, which highlighted the substrate's bioavailability. Final sCOD was lower for S/I 1.0 at 0.82 g/L compared to 1.74 and 1.73 g/L sCOD for S/Is 2.0 and 3.0. These final values imply that stabilization was incomplete for S/I 2.0 on day 48 and S/I 3.0 experienced accumulation of VFA. VFAs were 33%, 16%, and 24% of the sCOD on day 48 for S/I = 1.0, 2.0, and 3.0 respectively. At S/I 3.0, VFA were produced faster than consumed. This acid accumulation for S/I 3.0 corresponds with the low pH value, leading to minimal CH4 yield and fermentation products. The S/I 3.0 VFA:sCOD demonstrates that this BMP was most likely still in the acidogenesis phase at the end of the study.
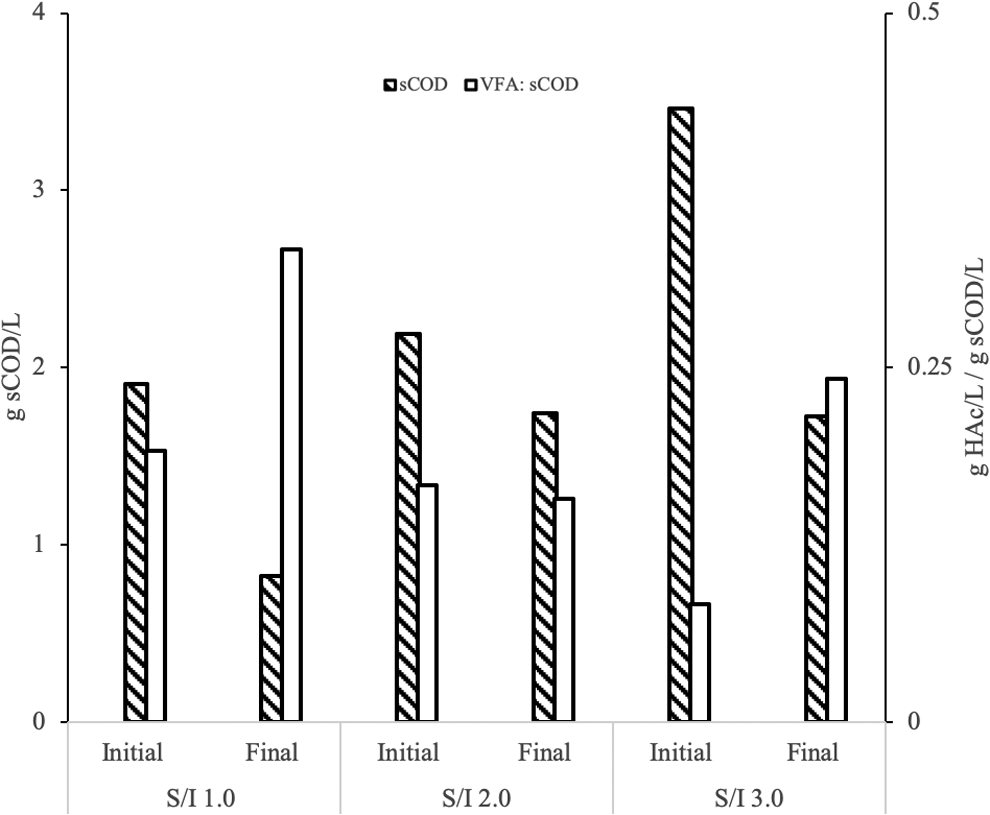
Initial and final sCOD and VFA: sCOD ratio for BMP assays at S/I = 1.0, 2.0, and 3.0 g substrate TS/g inoculum TS. sCOD, soluble chemical oxygen demand.
Hydrolysis constant
A first-order hydrolysis model with respect to CH4 was simulated to estimate Khyd using the various S/I BMP assay data (Fig. 6). The simulated data showed a relatively good fit to experimental data from CH4 with R2 > 0.8 for S/I 1.0 and 3.0. The R2 for S/I 2.0 was 0.68 lower than the other two S/Is. The goodness of fit for S/I 2.9 was affected by increased production toward the end of the test, causing incomplete CH4 stabilization on day 47. A lag phase was observed for all S/I values indicating that the rate-limiting step was likely hydrolysis based on previous studies (Pavlostathis and Giraldo-Gomez, 1991; Bolzonella et al., 2005; Bakhov et al., 2014). S/I 1.0 had significantly higher Khyd of 0.06 day−1 compared to S/I 3.0 at 0.007 day−1 (p-value, 0.03) and the Khyd for S/I 2.0 (0.02 day−1) was an order of magnitude higher than S/I 3.0. For comparison, Tandukar and Pavlostathis (2015) reported Khyd of ∼0.10 day−1 for dewatered fat, oil, and grease and gum waste. Interestingly, as the S/I ratios increased, the Khyd decreased. This suggests that too high sCOD depresses bioavailability. In this study, S/I 3.0 produced high concentrations of VFA that the inoculum could not remove properly, hence producing low CH4.
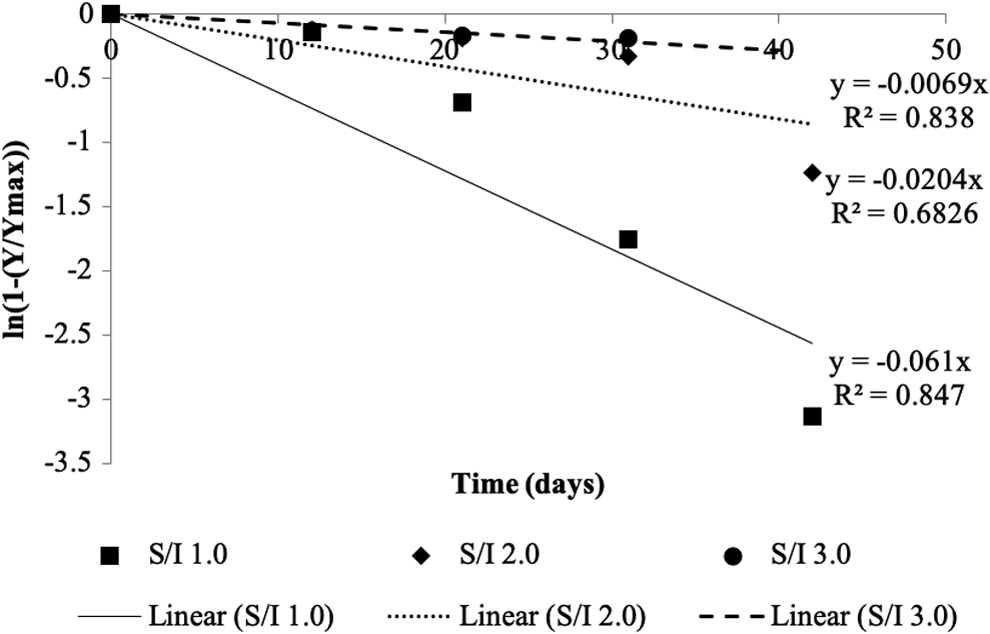
Linear regression fit for estimating hydrolysis constant for BMP assays at S/I = 1.0, 2.0, and 3.0 g substrate TS/g inoculum TS.
Conclusions
HS-AD facilities may be a viable option for processing and managing OFMSW in the United States due to its ability to decrease substrates and produce resources. This study identified the feasibility of co-digesting OFMSW with biosolids and processes that must be considered for achieving high CH4 yields under HS-AD. Results from S/I 1.0, 2.0, and 3.0 g of substrate TS/g inoculum TS demonstrate that concentrations of VFA and TAN initially increased due to high quantity of easily degradable substrates present. However, at high S/I of 2.0 and 3.0, VFA accumulation and low pH led to limitations that resulted in long lag phases, and negatively impacted CH4 yields. While sCOD may be higher for S/I 2.0 and 3.0, high concentrations of VFAs impeded progression to methanogenesis. S/I 1.0 corresponded with high CH4 yield from HS-AD along with a high Khyd and a short lag time. The stability of HS-AD and components depends on the production of sCOD, pH, and VFAs along with alkalinity generated by TAN from the substrates. The conditions are required to maximize bioenergy production from co-digesting OFMSW and biosolids are important to successful HS-AD operation. This research suggests that S/I 1.0 may be a viable ratio for digestion of OFMSW in municipal facilities. More research should be done to test the financial feasibility to construct more HS-AD and its life cycle impacts. Implications of this study diversify current waste management strategies and assist municipalities in meeting goals of diverting organic wastes from landfills and incinerators and expanding energy mixes.
Footnotes
Author Disclosure Statement
No competing financial interests exist.
Funding Information
This material is based upon work supported by the Hinkley Center for Solid and Hazardous Waste Management and the National Science Foundation under Grant No. 1243510.