
Abstract
Abstract
This study is focused on reactive absorption of nitrogen oxides created during calcium nitrate fertilizer production. A functional mathematical process model was set up to verify the process by experimental data and to devise modifications of a real plant with this technology. Suggestions for nitrogen oxide removal efficiency improvement, including changes in operational parameters and plant layout were simulated in Aspen Plus, to achieve compliance with the European legislative emission limit of 300 ppm (mg/m3) of NOx in the off-gas released to the atmosphere. Neither of the suggested process modifications, be it an increase in column packing specific area, increase in packing height, liquid recycles cooling to ambient temperature or make-up absorbent flow rate increase led to sufficient NOx concentration decrease. Addition of a H2O2 solution into the second column was proposed to scavenge the remaining NO as it contributes mostly to the overall NOx emissions. Simulation results indicate this as a viable option to both meet the legislative criteria and to avoid liquid streams' contamination so they can be reprocessed instead of being dealt with as waste.
Introduction
The typical calcium nitrate fertilizer production process comprises the reaction of lime with nitric acid. Nitrogen oxides and carbon dioxide are created during this process as by-products as stated in Laue et al. (2002). As NOx are harmful for the environment it is necessary to control their emissions from stationary and mobile sources as observed by the United States Environmental Protection Agency, 2009. De Paiva and Kachan (1998) and Chung et al. (2009) describe reactive absorption as the most common way to decrease the NOx concentration in off-gases in fertilizer production plants.
The presence of nitrogen oxides in the atmosphere may cause global warming, acid rains, and health issues like breathing problems. These are the most important reasons why it is necessary to control the amount of released NOx. The most common source of nitrogen oxides is the traffic as NOx are products of the combustion process. Yildirim et al. (2012) state that the second biggest producer of NOx is the industry. Table 1 provides an overview of basic nitrogen oxides' properties with source data being extracted from United States Environmental Protection Agency (1999).
Nitrogen Oxides
Reactive absorption describes gas absorption into liquid solution accompanied by chemical reactions in a single device, which according to Yildirim et al. (2012), is a very important industrial process for the production of basic chemicals as HNO3 and H2SO4, purification of gases, and removal of harmful substances. Studies on cleaning gases and off-gases from both mobile (Yang et al., 2018) and stationary sources (Liu et al., 2010; Xu et al., 2013; Zheng et al., 2014; Zhao et al., 2017) yielded further improvement in the cleaning process efficiency. Simulated flue gas composition obtained by mixing pure model gases may serve equally well for experimental studies as gas samples from real processes as demonstrated by Deshwal et al. (2008) and Mondal and Chelluboyana (2013).
Simultaneous removal of several harmful components from flue gas besides nitrogen oxides, has also gained attention as well, for example, sulfur oxides (Liu et al., 2010; Mondal and Chelluboyana, 2013; Adewuyi et al., 2018; Yang et al., 2018), carbonaceous substances (Xu et al., 2013), or other organic and inorganic substances as studied by Zhao et al. (2017). Recent literature pays attention predominantly to the treatment of flue gas from combustion processes. Modeling the NOx removal process applied to off-gas from a fertilizer production plant has thus still the potential to yield novel findings and contribute to more sustainable fertilizers' production and its decreased environmental impact.
Absorption media and conditions applied vary according to individual applications. Ammines (Fine and Rochelle, 2014), peroxides (Baveja et al., 1979; Liu et al., 2010; Ghriss et al., 2019), ozone (Skalska et al., 2012), limestone slurry (Zheng et al., 2014), or other substances and their combinations (Deshwal et al., 2008; Wang et al., 2016; Adewuyi et al., 2018; Wang et al., 2018; Deshwal and Kundu, 2018) are intensely studied. Oxidative behavior of the applied absorbents enhances the nitrogen oxides chemisorption process (Skalska et al., 2012; Li et al., 2018; Yan et al., 2018).
While several absorbents based on inorganic salts, proposed in Deshwal et al. (2008), Wang et al. (2016), Deshwal and Kundu (2018), Wang et al. (2018), are effective in nitrogen oxides removal, liquid waste streams result from their application. This is an undesired situation in case of fertilizer production plants. The applied absorbent must not contaminate the produced fertilizer since the saturated absorbent is recycled to the production process to improve material efficiency of the plant and decrease waste production (De Paiva and Kachan, 1998; Liémans and Thomas, 2010; Ghriss et al., 2019). This limits the absorbents just to substances routinely used in fertilizer production (e.g., nitric acid) or to such that are likely to decompose during the absorption process (e.g., hydrogen peroxide or ozone).
Reactive absorption is a complex process with several components, where it is necessary to consider mass transfer, heat transfer, hydrodynamics of column, thermodynamics of the process, and chemical reaction kinetics to create a reliable mathematical model. The equilibrium model which assumes that gas and liquid phases leaving the stage are in equilibrium cannot be used for this system as the system is far from the thermodynamic equilibrium. The more consistent rate-based model is required. This model, proposed by Vaidya and Kenig (2007), is based on the two-film theory, which assumes that mass transfer resistance is only in the thin film close to the phase interface.
Much effort is invested in finding a reliable way to predict behavior in NOx reactive absorption columns to achieve better efficiency of this process, as the columns design is nowadays still based mostly on practical experience. The rate-based model has been used to create basic model equations in the related literature. Kenig and Seferlis (2009) applied the rate-based model using orthogonal collocation on finite elements, whereas Hüpen and Kenig (2005) used Aspen Custom Modeler for simulations. Wiegand et al. (1990) introduced a new computation method for tray columns where one stage consists of a combination of a bubble column and an adiabatic plug flow reactor connected in series. Numerical methods, such as the Newton-Raphson or Gauss-Jordan ones, were used by Suchak et al. (1991) to solve such complicated differential equations.
A later study by Ramanand and Phaneswara Rao (1996), employed the fourth order Runge Kutta Gill method to solve the same problem. They all verified the results of their simulations for packed and tray columns with experimental data published in Suchak et al. (1991), where three pilot-scale columns connected countercurrently were presented. Based on the literature survey, it can be concluded that a reliable and robust model of the NOx reactive absorption process is the key to successful process design.
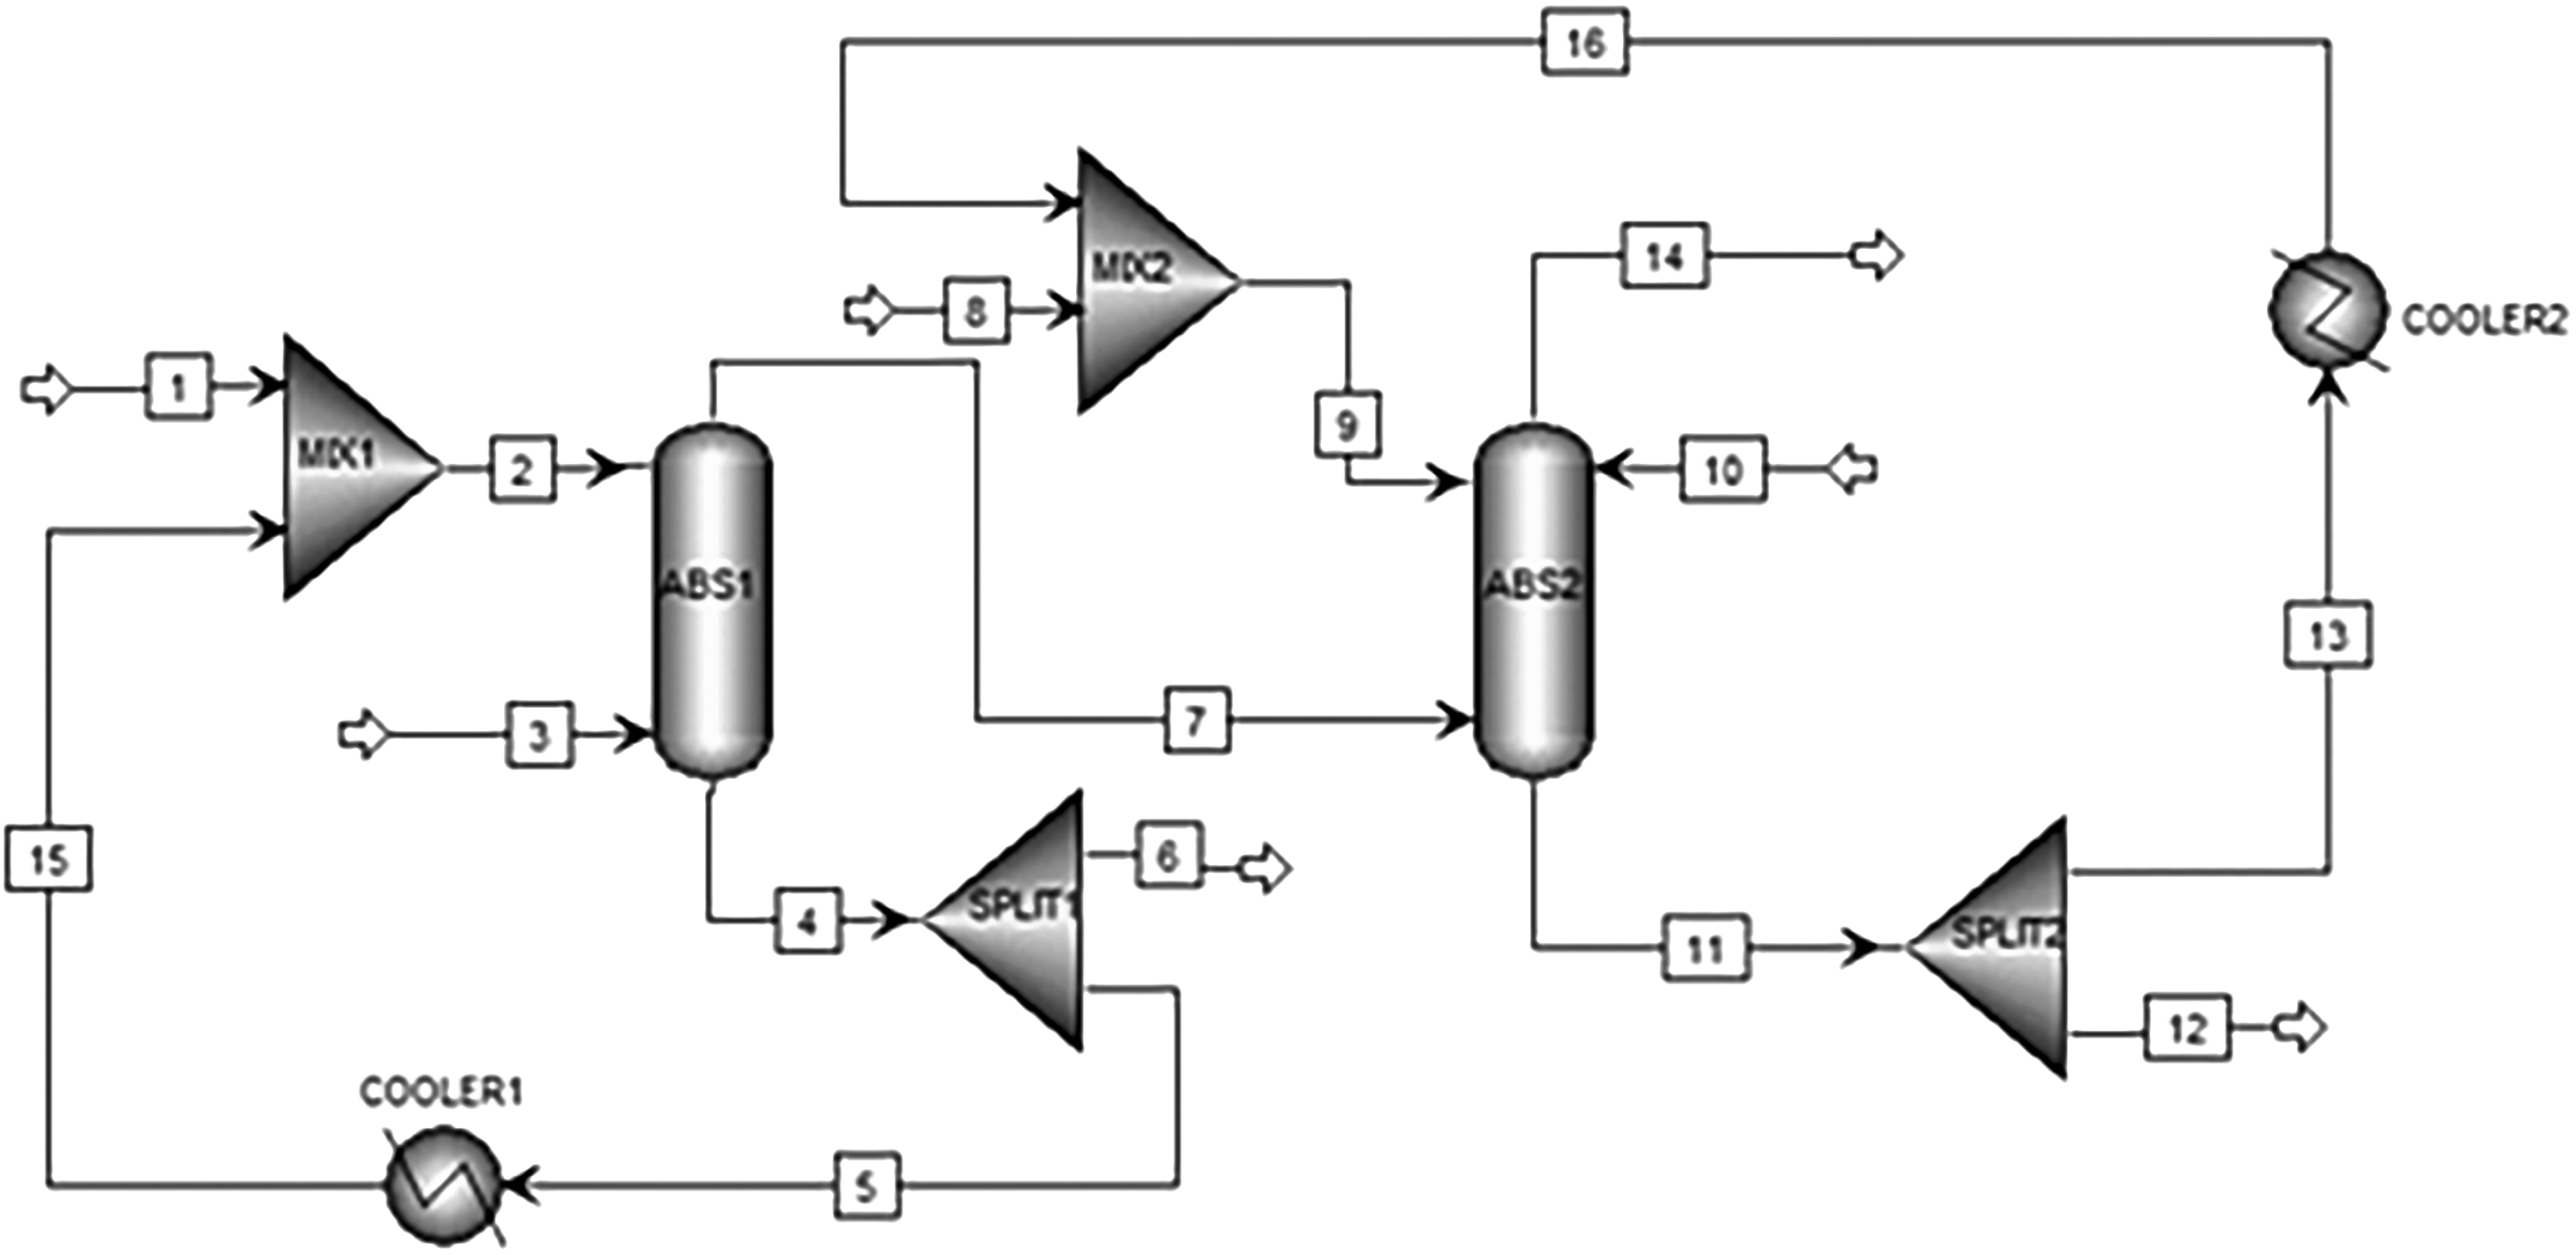
A real plant for fertilizer production has been chosen as an example for our study. Its flow diagram is depicted in Fig. 1. Currently, the off-gases processing unit is its problematic section, as it does not meet the legislative NOx emissions limit. This currently represents 500 ppm (mg/m3) but will further be reduced to 300 ppm as set by European legislation transposed into national ones such as Slovak law, 137/2010 and Slovak regulation, 410/2012. Study objectives are as follows:
propose, discuss, and test the impact of changes of key operational technology parameters as well as equipment design on the final NOx concentration in the off-gas exiting the purification process
discuss the obtained results and propose reasonable means of sufficient NOx emission reduction

Two absorption columns with liquid phases recycling (streams: 1—fresh water, 2—liquid phase to ABS1, 3—off-gas from production technology, 4—liquid phase from ABS1, 5—recirculated liquid stream for ABS1, 6—salt concentrate from ABS1, 7—off-gas to ABS2, 8—fresh HNO3 solution, 9—liquid phase to ABS2, 10—demister, 11—liquid phase from ABS2, 12—salt concentrate from ABS2, 13—recirculated liquid stream for ABS2).
Aspen Plus was chosen as suitable commercially available simulation program. Studied technology flow scheme was transposed to its calculation environment with customized parameters and equations as discussed in “Model specification,” “Chemical reactions,” and “Kinetics of Chemical reactions” chapters. Simulations of actual technology operation were performed and the results verified by comparison with measured emissions, providing a sound simulation platform to test and evaluate proposals for nitrogen oxides' removal efficiency improvement.
The article structure copes with the employed methodic. First, a brief overview of the technology is given; followed by the formulation of model equations that include mass and heat balance, mass transfer, and chemical reaction kinetics. A base case simulation is presented and its results are compared with real NOx emissions. Proposals for operation parameters and equipment changes are formulated and the related simulation results are discussed. Finally, conclusions on the existing technology limits and drawbacks of its current design and operation are drawn.
Separation Technology
Absorption of NOx proceeds in two packed columns with countercurrent flow connected in series. The ventilator placed behind the second column draws off the off-gas from production technology and leads it through both columns in the separation part. The off-gas contains not only NOx, oxygen, nitrogen, and water vapor, but also carbon dioxide and ammonia, used for neutralization in calcium fertilizer production. Three sets of measured off-gas composition and amount value were provided by the plant staff and are shown in Table 2. These were used to verify the mathematical model and as input for the following calculations. The total amount of nitrogen oxides in the off-gas is summarized and represented by NO2 only. The share of individual nitrogen oxides on the total NOx amount was not provided by the industrial partner.
Parameters of Inlet Off-Gas
All nitrogen oxides are summed up and expressed as NO2.
The majority of NOx in the inlet off-gas should be removed in the first absorption column. Rich absorbent is recycled to a great extent and only a small amount of fresh water is continually added to this column. At the same time, CO2 is also partly absorbed.
The second column is used for the absorption of remaining NH3 into a 60% wt. solution of HNO3. The sour liquid phase is also recycled. Basic column specification is provided in Table 3. Due to the presence of NH3 in the gas phase, NH4+ in liquid phase, and ammonia salts, respectively, can be formed in both columns.
Absorption Columns Parameters
Model Specification
Aspen Plus was used as the simulation program in this study. Due to the complexity of the process it was necessary to use the rate-based model based on the two-film theory (Fig. 2) so the bulk and the thin film of both phases are balanced. The two-film theory supposes existence of equilibrium on the phase interface meaning the phase interface does not contribute to mass and heat transfer resistances.

Scheme of mass transfer considering two-film theory as depicted in Vaidya and Kenig (2007).
The basic material and energy balance equations for bulk phases, films, and phase interface are shown in Table 4. All these equations, stemming from the two-film theory, are predefined in Aspen Plus, 2000. Steady-state calculations were performed only.
Basic Balance Equations Used by Aspen Plus
Further equations employed by Aspen Plus are provided in Aspen Physical Property System (2001). All parameters required as inputs for these equations were obtained from the Aspen Plus Database.
Due to the presence of ions in the liquid phase, which may substantially influence the whole process, Aspen Plus Electrolyte was chosen as the simulation environment. As it is known, the presence of charged species in electrolyte solutions causes extremely nonideal behavior of these solutions. In the simulation program, the ELECNRTL property method was chosen as it is the most versatile electrolyte property method enabling to handle mixed solvent system at any concentration.
ELECNRTL calculates the liquid phase properties from the Electrolyte-NRTL activity coefficient model. Vapor phase properties are calculated from the Redlich Kwong equation of state. For detailed information about the model, model parameters, and used constants, see Aspen Physical Property System (2001).
Chemical Reactions
Complexity of NOx absorption into water is enhanced by a number of different chemical reactions simultaneously running in both liquid and gas phase. The most important reactions considered in the simulation are shown below.
Due to missing basic properties of HNO2 in the simulation program Aspen Plus, the summary reaction (23) was used in the liquid phase. Standard Gibbs formation energies were compared for HNO2 (−43.9 kJ/mol) and HNO3 (−79.9 kJ/mol); their difference of +36 kJ/mol indicates the feasibility of such simplification. Initial attempts were performed to define HNO2 as a new compound in Aspen Plus and to specify all the properties needed to run the simulations. With scarce experimental data presented in available literature several properties were estimated by available correlations. Simulations run with HNO2 incorporated in the model repeatedly did not converge.
Kinetics of Chemical Reactions
Information about ionic reactions was obtained directly from the databases of Aspen Plus Electrolyte. Three most relevant and most commonly considered reactions in gas phase (21) to (23) (Wang et al., 2018; Ghriss et al., 2019) were added to the simulation by the user so it was necessary to define the related reaction kinetics. Table 5 shows the applied reaction kinetics equation and constants, extracted from Wiegand et al. (1990) and Hüpen and Kenig (2005).
Reaction Kinetics for Chemical Reactions (21–23)
Crystallization of Ammonia Salts
Due to the presence of NH4+ in the liquid phase, ammonia salts of nitric acid and carbonic acid can be formed and crystallize above a certain concentration. As the liquid phase in both columns is not pure water but acid or base, solubility of NH4HCO3 in a 2% wt. ammonia solution and that of NH4NO3 in a 10% wt. HNO3 solution was estimated experimentally in-house and is presented in Table 6.
Measured Solubility of Salts in Solution (g/100 g of Solution)
Based on the experimental results, the concentration of salts in both columns was controlled to keep the liquid streams undersaturated. Liquid streams from the columns are reprocessed and retrieved salts are reused in the fertilizer production technology; thereby, the production costs and waste amount are reduced.
Simulations
A scheme of the presented technology created in Aspen Plus is depicted in Fig. 1. This will further be referred to as “base case.”
Simulation results were verified by comparing the NOx concentration in stream 14 with real measured NOx emissions of the plant. These results for each of the three data sets are shown in Table 7. Both “measured emissions” and “simulation results” in Table 7 as well as in all further tables and figures, are recalculated to standard state and dry gas conditions, as required by the corresponding legislation (Slovak regulation, 410/2012).
Mathematical Model Verification
Relative difference between real NOx emissions measured in the off-gas leaving the second column and NOx concentration in simulated stream 14 is around 5%, which makes the presented model sufficiently accurate to get reliable results from modification simulations. This, at the same time, leads to a conclusion that neglecting HNO2 as reaction intermediate discussed in the “Chemical reactions” chapter did not cause considerable discrepancy between measured and simulated purified off-gas nitrogen oxides content.
Various suggestions to improve the efficiency of this process comprising changes in the key operational parameters and certain design features have been proposed. The modifications were simulated only for case 1, which is considered to be the most common at the observed plant. The final concentrations of NOx in the gas phase at the ABS2 outlet for each modification were compared with the base case.
Modifications
Seven modifications, A–G, aimed at mass transfer enhancement by reasonable operational and design parameter changes were considered and simulated. Their short overview is presented below.
A—structured packing
The packing type used in the columns belongs to the basic ones and its specific area is around 2.1 cm2/cm3. The packing in the simulation was switched to structured type with the specific area of 5 cm2/cm3.
B—cooling streams 5 and 13
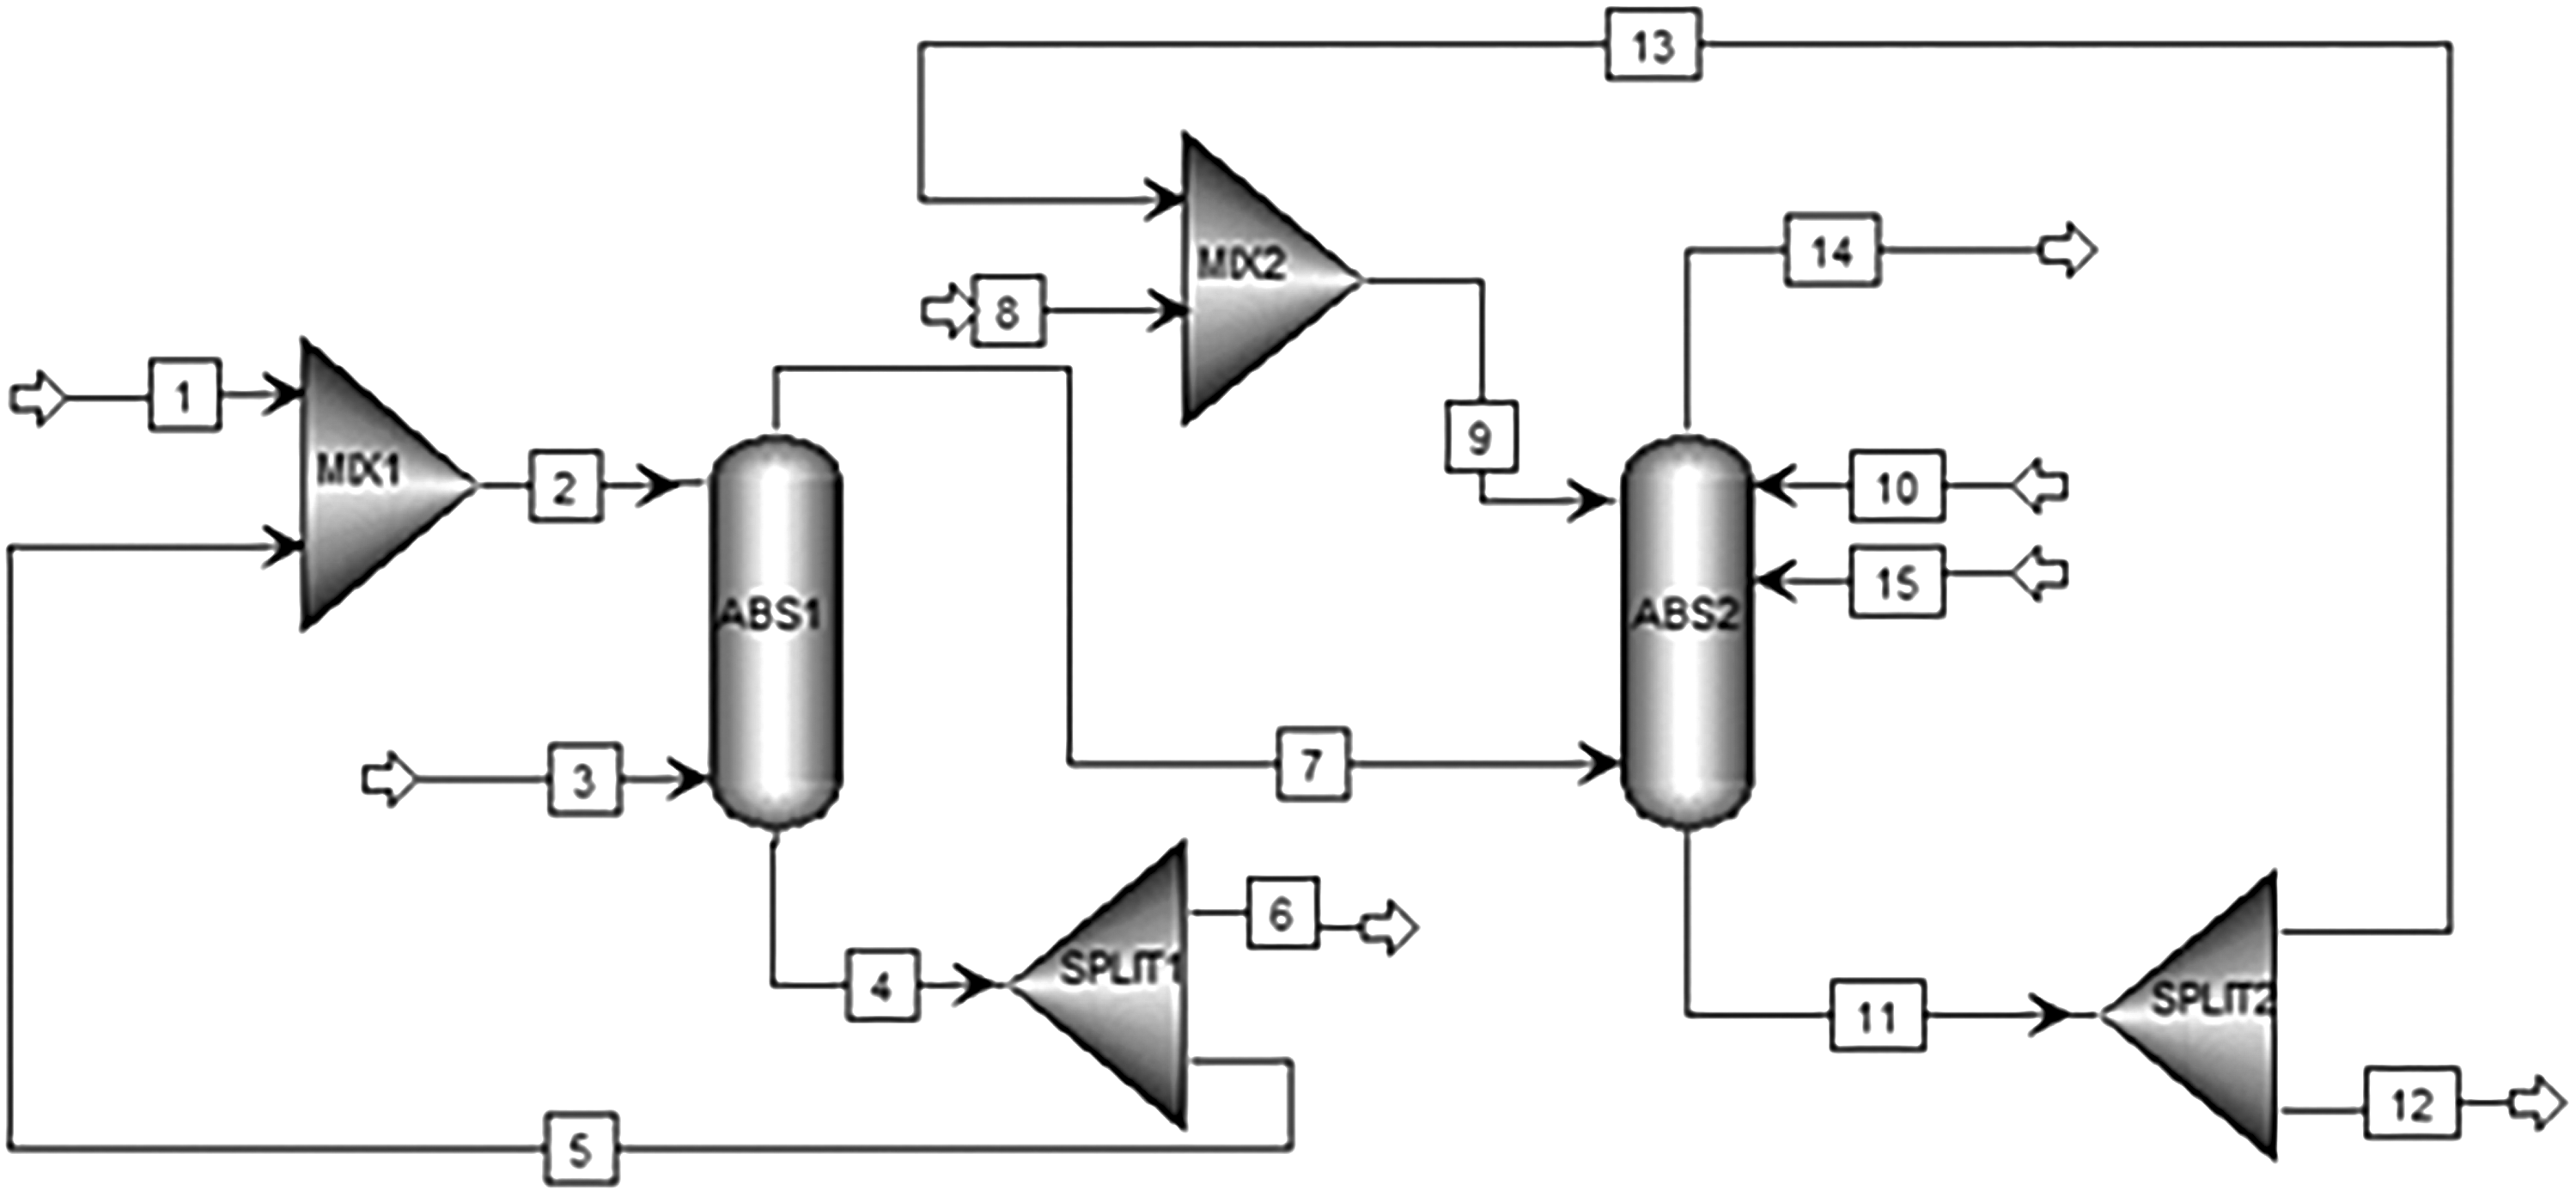
The second very important parameter that influences the absorption efficiency is temperature. Temperature of water used as the absorbent in columns gradually increases due to recirculation considering the impact of the absorption process, including chemical reactions. The inlet off-gas flowing from another part of the technology also has relatively high temperature, 60°C. Two heat exchangers for liquid phases cooling back to 20°C were added to the simulation (Fig. 3).
Two absorption columns with liquid phases recycling and cooling (streams: 15, 16—liquid recirculated stream with the temperature of 20°C).
C—cooling of stream 5 only
The simulation was repeated with employing a recycle cooler just in the first column, as the temperature difference of the liquid phase along the second column was only 6°C. A scheme of this modification is provided in Fig. 4.

Two absorption columns with liquid phases recycling and cooling only of the first recycle.
D—decreasing liquid flow rate
Flow rate of the liquid phases was decreased from 10,000 to 9,000 kg/h to increase their residence time in the columns, while the make-up absorbent flow rate was maintained. Further decrease was not possible due to technological restrictions imposed on salt contents in liquid phases.
E—increasing flow rate of stream 1
Flow rate of new water continually added to the system can be adjusted to improve the efficiency of the first column; however, the interval for this change is limited by salt concentration and technological parameters of the system. The flow rate was increased by 100 kg/h.
F—addition of one more packing segment
One more packing segment with parameters identical to the existing ones was added to each column.
G—increasing diameter
Diameter of each column was increased by 0.1 m to extend the residence time of the vapor phase.
Results and Discussion
All modifications of the technology were simulated in Aspen Plus. Results for each one of them were compared based on the NOx concentration in stream 14 shown in Table 8.
Final Concentration of NOx in Considered Simulation Modifications
The switch to structured packing resulted in the final NOx concentration of 860 ppm, which looks promising; with additional system adjustments it is not sufficient for meeting the legislation requirement as a stand-alone modification.
The final NOx concentration decreased to 790 ppm by implementation of both liquid phases cooling to 20°C. The problem occurred in the salt concentration, as this decreased below the acceptable level due to water condensation in the columns. Solutions with such low concentrations cannot be processed and reused in the technology.
The final NOx concentration achieved in modification C was 836 ppm. The decrease in final NOx concentration achieved by modifications B and C compared with the base case is sizeable. The considerable impact of stream 15 temperature on the final NOx concentration is shown in Fig. 5.
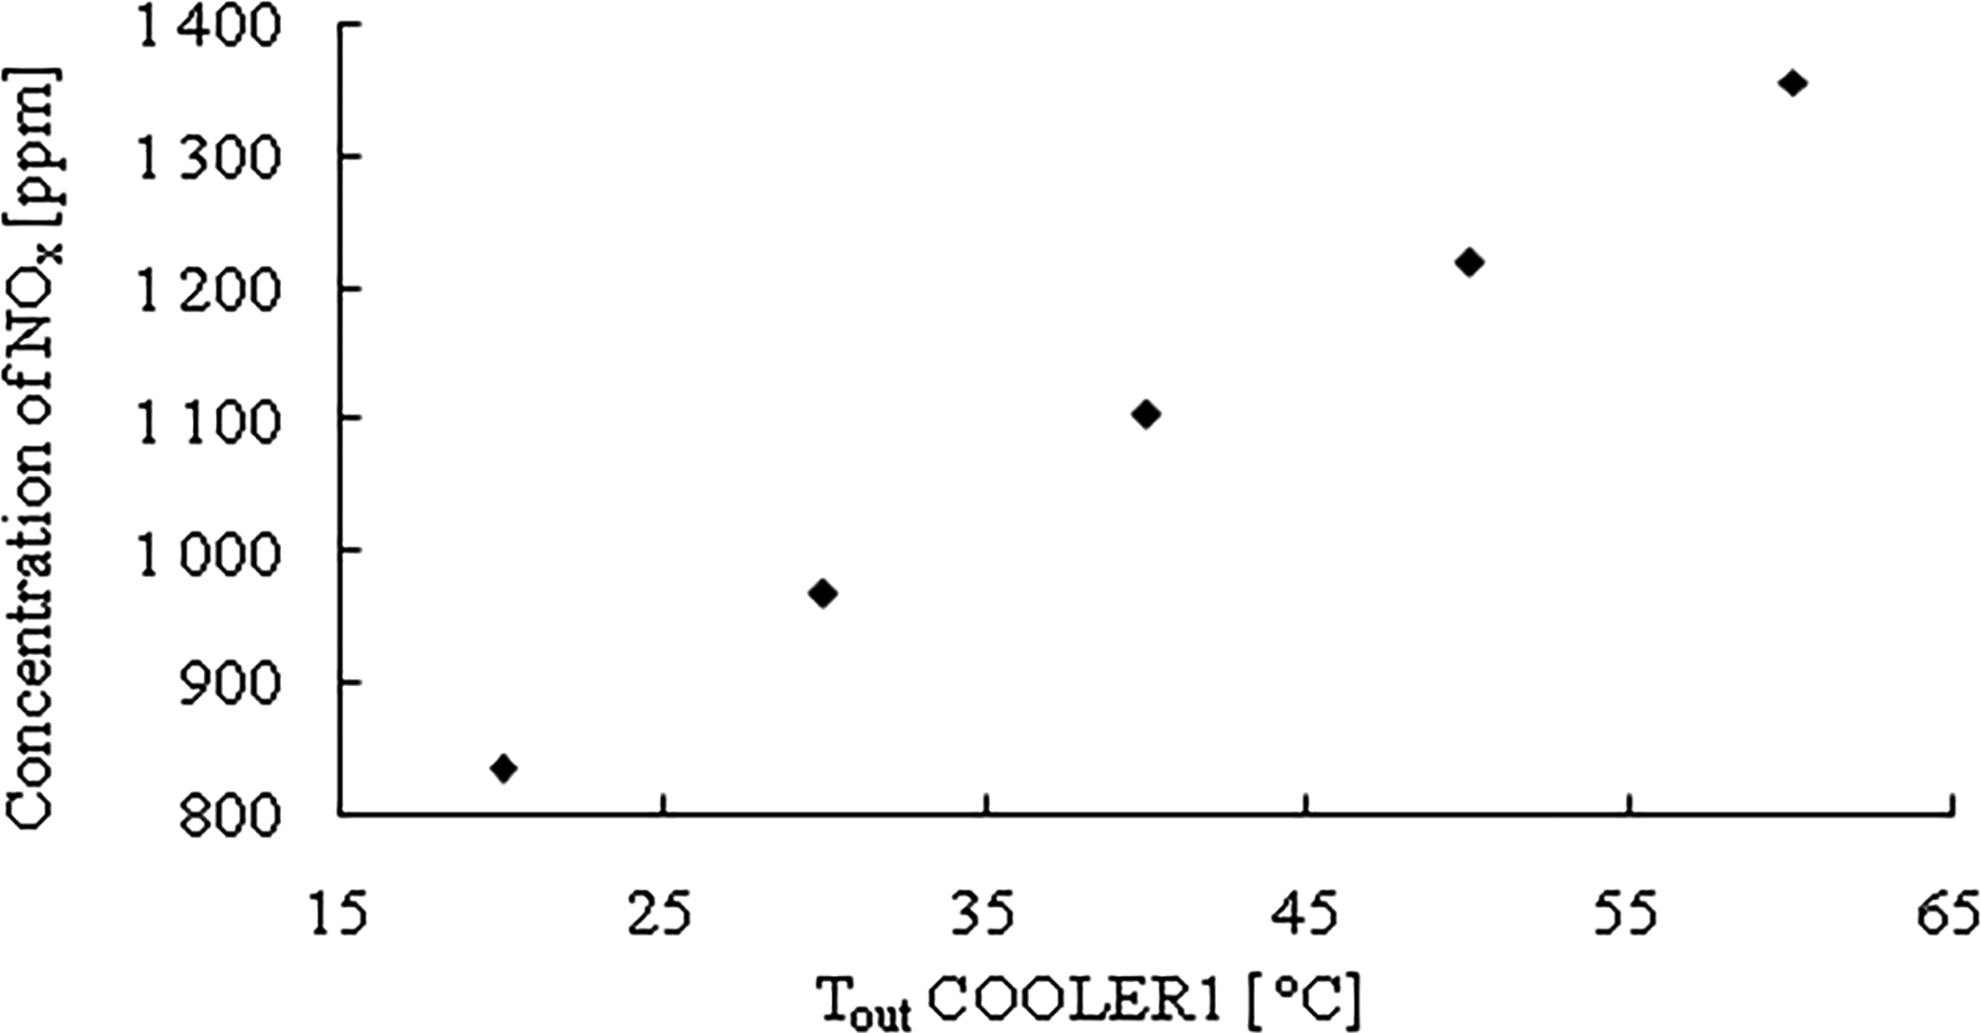
Dependence of final NOx concentration on the temperature of stream 15.
Other modifications yielded only small changes in the final NOx concentrations. To document this finding, Fig. 6 shows the dependence of final NOx concentration on the flow rate of stream 5. Its mass flow difference of 12,000 kg/h resulted only in a 75 ppm difference in the final NOx concentration.
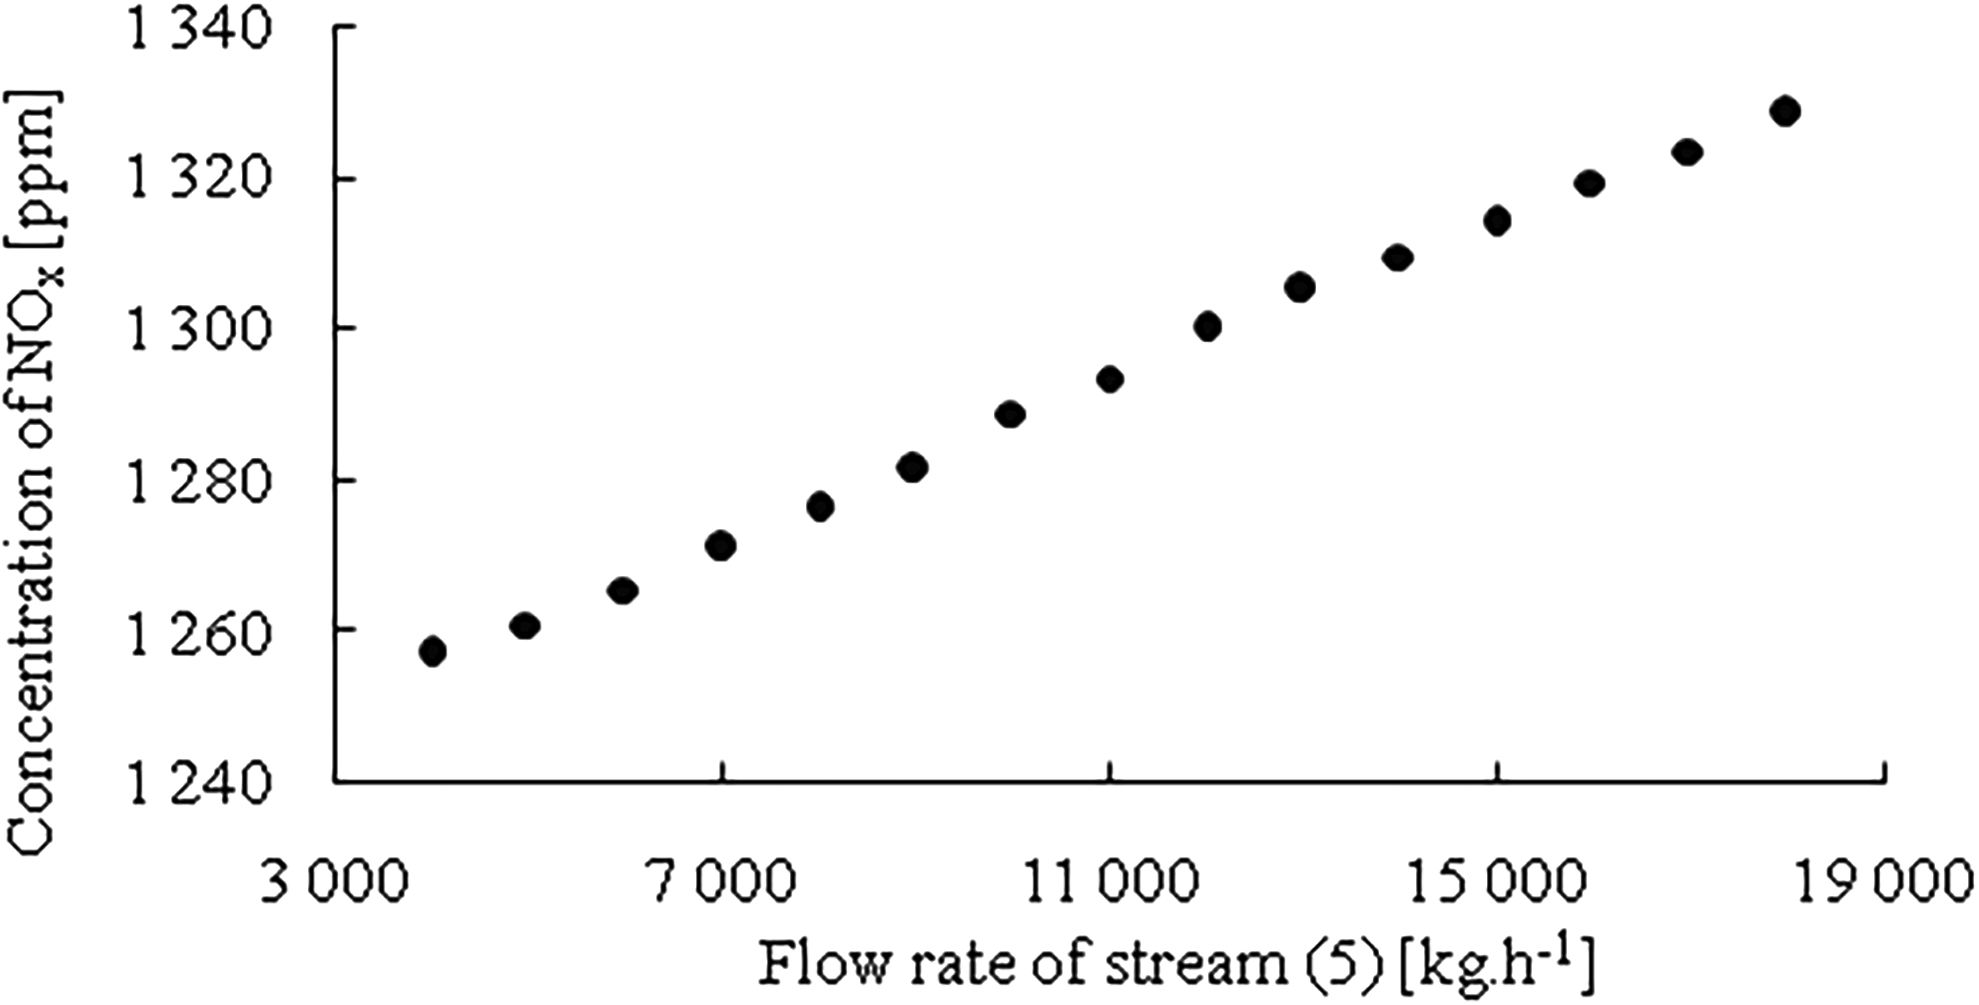
Dependence of final NOx concentration in stream 14 on the flow rate of stream 5.
In the next step, modifications yielding the largest NOx concentration decrease—switching the packing type and cooling the liquid streams—were combined. Results of these simulations are shown in Table 9. Even these combinations did not decrease the final NOx concentration below 740 ppm, which is still far above the acceptable 300 ppm level.
Final Concentration of NOx in Considered Combinations of Modifications
A comparison of the NOx molar flow rate change due to different modification is shown in Table 10. It can be said that the molar flow of NO in the exiting off-gas is almost constant in each case and obviously it is the major contributor to the total NOx emissions. Based on this comparison, the reaction of NO with O2 was assumed as the rate-controlling step for this process and another means of NO removal from the off-gas to reach the emission limit were sought.
Molar Flow Rate of NOx in Purified Off-Gas for: 1: Base Case, 2: A+B
Addition of H2O2 to the second column
Previous research published by Baveja et al., 1979; de Paiva and Kachan, 1998; and Skalska et al., 2012 showed that NO reacts quickly with hydrogen peroxide in the liquid phase (30). This information was used in the next simulation as none of the previous modification simulations led to sufficient NOx emissions decrease.
Kinetics of this reaction was obtained from Baveja et al. (1979) and its parameters are provided in Table 11.
Kinetics of Reaction (30)
Only switching the packing type was considered for the simulation simultaneously with H2O2 addition to the second column as the cooling system for liquid phases increases the operational expenses. The scheme of this system is shown in Fig. 7.
Effect of H2O2 addition to ABS2 (stream 15—30% wt. H2O2).
The impact of H2O2 addition to the second column on the final NOx concentration is shown in Fig. 8.
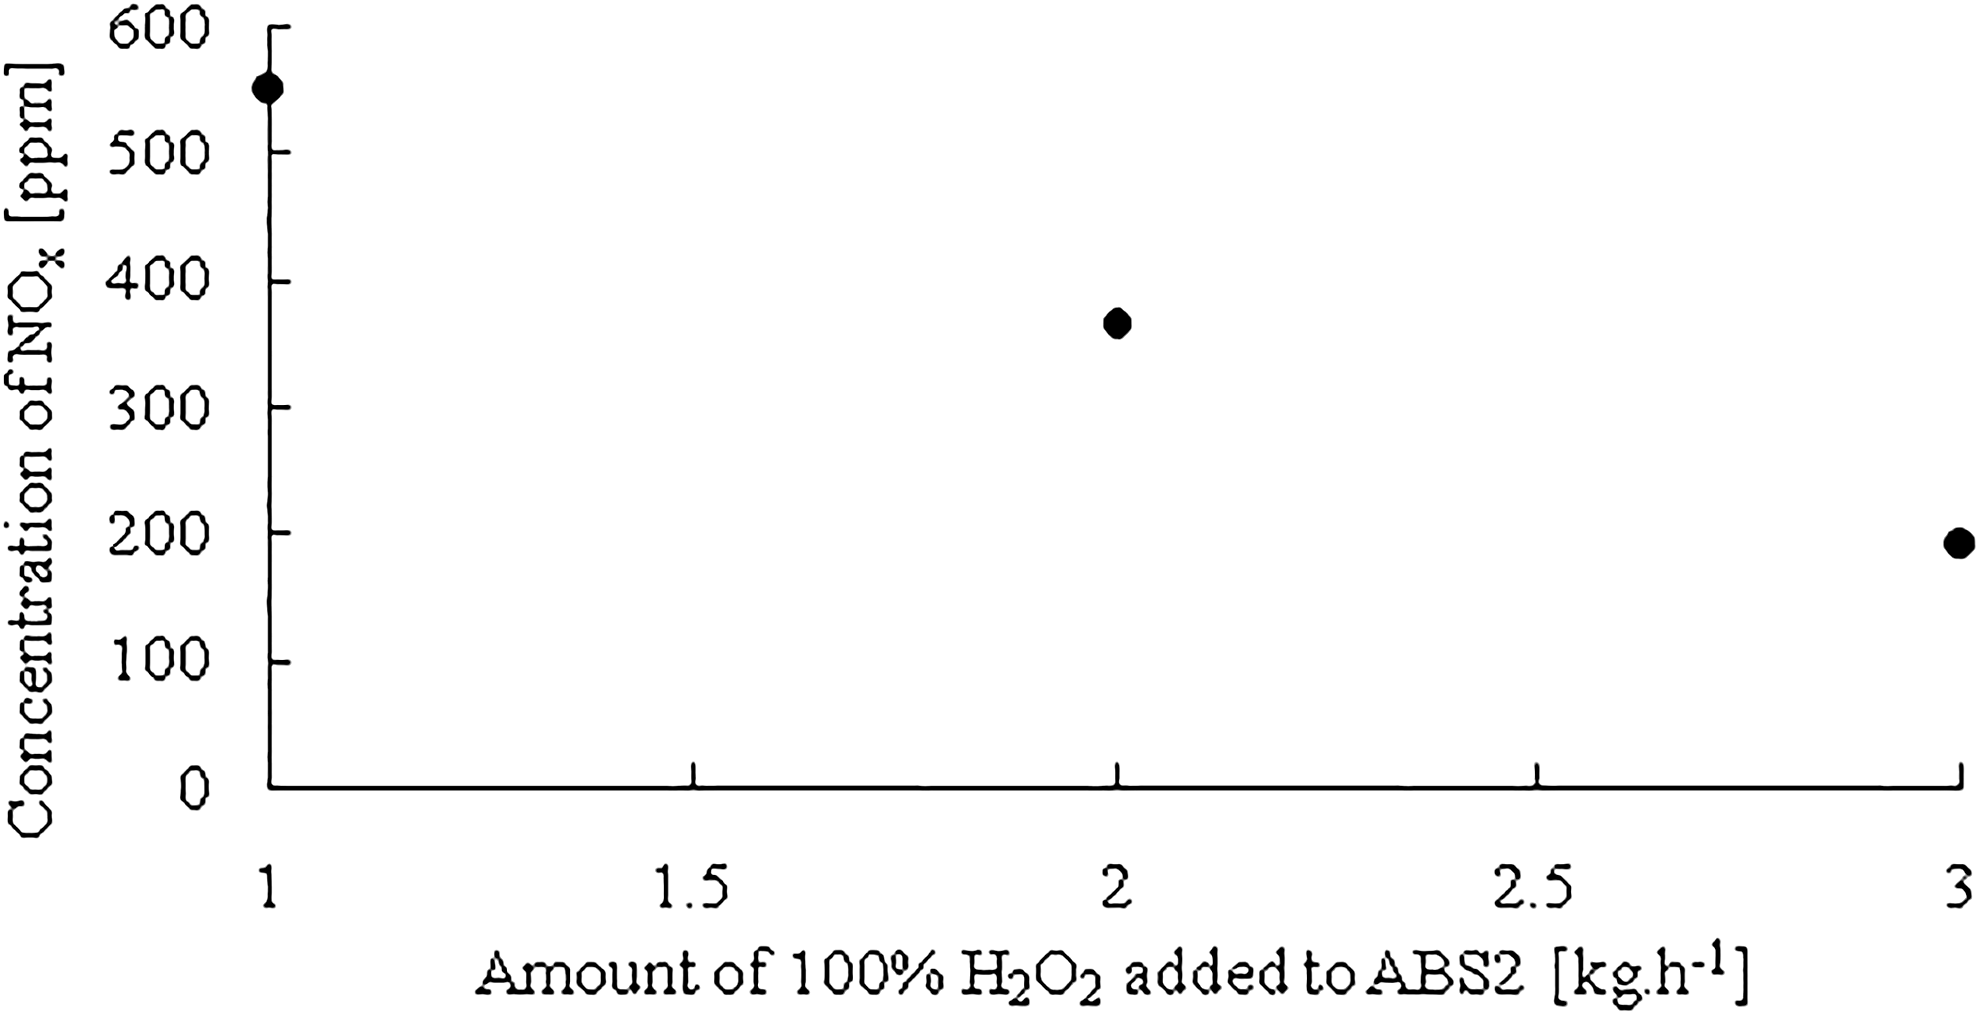
Final NOx concentration in stream 14 for different H2O2 amounts added to ABS2.
Based on the simulation, only 7.5 kg/h of pure H2O2 (= 25 kg/h of 30% wt. aqueous H2O2 solution) is necessary to achieve sufficiently low final emissions of NOx.
The effect of H2O2 addition on the recycling of the liquid phase from the second column back to the fertilizers production technology has not been considered relevant. It appears that its reaction with NO in the liquid phase is sufficiently fast, thus its build-up in the system is negligible and should therefore not hinder recycling of excess liquid streams back to the technology. The accompanying addition of around 18 kg/h of water as a part of peroxide solution to the second absorber does not change its water balance significantly; the amount of fresh water supplied to the demister (stream 10 in Fig. 2) is more than 10-fold.
Conclusion
Reactive absorption of NOx into water was used to decrease NOx emission concentrations in a plant for calcium nitrate fertilizer production. In this work, a functional mathematical model for this process was set up in Aspen Plus Modeler and modifications of the actual technology were devised and tested to comply with the strict European legislative NOx emission limit of 300 ppm. Model results were verified by comparison with measured off-gas NO concentrations at three distinctive plant operational states. The relative differences between measured and simulated concentrations were around 5% in all three cases, which allows considering the presented model sufficiently accurate to get reliable outputs from the proposed technology modifications.
Process intensification proposals focused on increasing the interfacial area, residence time, and decreasing the temperature to shift the absorption equilibrium were simulated. Neither of the suggested modifications in the system led to sufficient NOx concentration decrease due to the slow oxidation of NO. Therefore, the addition of a H2O2 solution into the second column was proposed to enhance its oxidation and thus to scavenge the remaining NO in the liquid phase. Based on the simulation, only 7.5 kg/h of 30% wt. H2O2 has to be added to achieve sufficiently low final emissions of NOx. Despite the simulation results, where the addition of H2O2 to the system seems to be a simple and inexpensive solution, it is suggested to test this option in laboratory conditions first.
Footnotes
Author Disclosure Statement
No competing financial interests exist.
Funding Information
This work was financially supported by the Slovak Scientific Agency, grant no. VEGA 1/0659/18 and by the Slovak Research and Development Agency, grant no. APVV-15-0148. This contribution/publication is the partial result of the Research & Development Operational Programme for the project University Scientific Park STU in Bratislava, ITMS 26240220084, supported by the Research 7 Development Operational Programme funded by the ERDF.