
Abstract
Abstract
Mineral nanoparticles (NPs) can play important roles in metal fate and transport; yet, they often exhibit different behaviors with respect to metal sorption, especially when NP size drops below a few tens of nanometers. Studies of NP size effects on metal uptake often compare sorption “edges” for different NPs at a given metal concentration over a range of pH values. Because surface area increases dramatically as NP size decreases, failure to normalize to particle surface area (rather than mass) in “edge” experiments can lead to different metal- to mineral-surface ratios in reaction vessels. We explored the effects of hematite NP size (8, 40 nm) on cadmium (Cd) uptake in systems near Cd mineral (super)saturation, comparing mass-normalized (MN) and surface area-normalized (SAN) approaches. An ∼1 pH unit shift in sorption edge was observed as a function of NP size, regardless of approach. Effects of experimental approach on mechanism were most pronounced at pH 9.0, where adsorption and minor precipitation were observed for 8 nm NPs, a more balanced mixture of adsorption and precipitation on 40 nm SAN NPs, and substantially more precipitation on 40 nm MN NPs. Experimental results thus reconfirm that NP size can affect metal sorption, underscoring the need to design experiments that explicitly account for NP surface area differences. Results also suggest that development of conceptual and quantitative models for the effects of NPs on metal mobility will need to take into account the potential effects of NP size on reactivity.
Introduction
Fe oxide minerals are important reactive surfaces in the environment, often controlling the fate and transport of trace metals, radionuclides, and organic compounds (Brown and Parks, 2001; Hochella et al., 2005, 2008; Theng and Yuan, 2008; Hua et al., 2012; Zhang et al., 2016; Kefeni et al., 2018). Fe oxide structure (Waychunas et al., 2005; Hochella et al., 2008), stability (Navrotsky et al., 2008), and reactivity with respect to environmental processes such as sorption (Madden et al., 2006; Ha et al., 2009; Zeng et al., 2009; Barton et al., 2011; Hua et al., 2012; Liang and Zhao, 2014; Zhang et al., 2016; Kefeni et al., 2018) and dissolution (Dehner et al., 2010; Barton et al., 2012; Peijnenburg et al., 2015) may be different when particle size is below a few tens of nanometers, that is, in the nanoparticle (NP) range (Hochella et al., 2008). Recent research (Madden et al., 2006; Ha et al., 2009; Barton et al., 2011; Huang et al., 2018) has suggested that surface-site structures and densities may be different on hematite (α-Fe2O3) NPs less than ∼10 nm in size, leading to size-dependent effects on sorption affinities. Barton et al. showed, using X-ray photoelectron spectroscopy (XPS) and thermogravimetric analysis, that, despite retaining X-ray diffraction patterns indicative of hematite, hematite NPs exhibit an increase in (near-) surface hydration and/or hydroxylation with decreasing particle size. Hematite NPs were found to have increasingly goethite-like rather than typical hematite-like surface XPS spectra as particle size decreased, especially to <10 nm.
Research on sorption to Fe oxide NPs often compares metal sorption densities and mechanisms for a given metal on NPs of different sizes by using a sorption edge approach, in which batch samples of the different NPs are reacted with a given total metal concentration and ionic strength, over a range of pH values. For example, Madden et al. showed that the affinity of Cu(II) for hematite decreased as NP size increased and suggested that smaller NPs might have more reactive surface sites associated with particle edges and other topographic features. However, given that NP-specific surface area (in m2/g) increases dramatically as particle size decreases, it can be difficult in sorption edge experiments to discern whether observed particle size-dependent differences in sorption affinity and/or mechanism are due to variations in surface reactivity versus surface area, alone.
Barton et al. showed that comparisons of metal sorption edges (i.e., sorption as a function of pH) for differently sized hematite NPs can be sensitive to whether experiments are performed using the same mass of mineral NPs (“mass normalized” [MN]; same g/L) versus the same total surface area (“surface area normalized” [SAN]; same m2/L) within batch reaction vessels. Experiments to discern NP size effects on sorption edges are often conducted by adding the same mass (or weight) of different NPs to reaction vessels and then accounting for differences in specific surface area by normalizing to surface area mathematically, after an experiment has been completed. However, the problem with this approach is that because NP size affects specific surface area, the ratio of adsorbate (metal) to adsorbent (mineral) surface area in the reaction vessels can be substantially different as a function of NP size. Accounting explicitly for specific surface area within reaction vessels, by running SAN experiments, is needed to isolate effects of surface reactivity versus surface area, alone (Barton et al., 2011).
This work was designed to determine, for sorption edge experiments, whether not only the extent of sorption to NPs but also the detailed sorption “mechanism” might be sensitive to whether experiments are run under SAN or MN conditions. The system conditions were selected specifically to be circum-saturation with respect to cadmium (Cd)-bearing mineral phases so that we could probe whether NP size affected Cd uptake mechanism (i.e., adsorption vs. precipitation). This distinction is important because adsorption and precipitation are fundamentally different mechanisms that could substantially affect Cd mobility. Macroscopic measurements of Cd sorption to 8 and 40 nm hematite NPs in batch experiments (22°C, 0.01 M NaNO3, at pH 4.0 to 9.5) were coupled with X-ray absorption spectroscopy (XAS)—X-ray absorption near-edge structure (XANES) and extended X-ray absorption fine-structure (EXAFS) analysis. An initial aqueous Cd concentration ([Cd]) of 134 μM was chosen so that solutions would be either slightly (at pH 7.5) or more fully (at pH 9.0) supersaturated with respect to potential Cd-bearing precipitate formation so that we could determine whether particle size and experimental design (SAN vs. MN) affected the extent of adsorption versus precipitation as primary uptake “mechanism”.
Although we performed modeling with Visual Minteq® 3.1 to determine solution saturation state, we purposely chose not to perform surface complexation modeling (SCM) at this time as the particle sizes were on the order of the thickness of the double layer. Classical SCMs are not designed for modeling sorption to particles that are themselves about the size of the double layer. The (near)surface structures of hematite NPs appear to be different from those of either larger particles of hematite or other Fe (hydr)oxides like goethite; moreover, Fe oxide NPs <10 nm in size are unlikely to represent anything close to equilibrium assemblages. The study described here was designed to provide a detailed understanding of how mineral NP size may affect both the extent and mechanism of metal sorption. This research represents a necessary first step toward ultimate development of new quantitative models to address the potentially unique effects of mineral NPs on metal fate and transport.
Experimental Protocols
Hematite NPs
Hematite NPs of 8 and 40 nm average size were synthesized (Barton et al., 2011). It is important to note that the different sizes of NPs were observed to be of different shapes; 8 nm NPs were rounded hexagonal and 40 nm NPs were rhombohedral (see Supplementary Fig. S1 for transmission electron microscopy (TEM) images), with specific surface areas (As) of 119 and 45 m2/g, respectively (Barton et al., 2011). The hematite NPs exhibit an increase in (near-) surface hydration and/or hydroxylation with decreasing particle size (Barton et al., 2011). After purification by dialysis, NPs were stored in suspension in the dark for up to 16 weeks with no change to measured surface area and TEM-determined mean particle size or structure as analyzed by X-ray diffraction (XRD).
Batch sorption experiments
Batch Cd sorption edge experiments were performed in 15 mL acid-washed polypropylene tubes (see Supplementary Data). Briefly, hematite NPs were added to tubes containing 134 μM Cd and 0.01 M NaNO3. At each pH value, three samples were prepared and the pH values were adjusted using 0.1 M HNO3 and NaOH to the following (within ±0.1 U): 4.0, 5.0, 6.0, 7.0, 7.5, 8.0, 8.5, 9.0, and 9.5; final pH values were also recorded. By adjusting the total weight of hematite NPs added to reaction vessels, both MN (0.19 g/L of 8 or 40 nm, yielding 22.3 m2/L and 8.3 m2/L, respectively) and SAN (0.19 g/L of 8 nm and 0.50 g/L of 40 nm; 22.3 m2/L for each) experiments were conducted.
Following reaction, sorbed [Cd] was calculated as the difference between initial [Cd] of 134 μM and [Cd] remaining in solutions following filtration (0.02 μm Anotop syringe filters; see Supplementary Data).
Estimation of initial solution saturation states
Visual Minteq 3.1 (Gustafsson, 2012) was used to model Cd species distributions in the initial solutions, in the absence of NPs as a function of pH to determine whether initial solutions were supersaturated with respect to any Cd-bearing solid phases. In the presence of NPs, any adsorption would decrease dissolved [Cd], so the calculated values should represent maximum potential saturation states. Solutions were modeled under ambient conditions (CO2 partial pressure 380 ppm) with initial [Cd] = 134 μM at pH 6.5–10.0. Cd oxides, hydroxides, carbonates, and mixed anionic solids were allowed to precipitate in the model, if supersaturated. Saturation indices (Supplementary Data) were calculated as follows:
where Ksp is the mineral solubility product and IAP is the ion activity product.
EXAFS sample preparation and measurements
Based on results of macroscopic sorption experiments, XAS data analysis was performed on samples at pH 7.5 and 9.0 because at lower pH, there was too little sorption for reliable XAS analysis. XAS sample preparation is described in the Supplementary Data. Commercially available crystalline solid samples of CdCO3, Cd(OH)2, and CdO were used as standards (see Supplementary Data). Data reduction and XANES linear combination analysis (LCA) were performed using the program ATHENA (Ravel and Newville, 2005), which internally uses IFEFFIT (Newville, 2001), whereas EXAFS data fitting was performed using ARTEMIS (Ravel and Newville, 2005) in the IFEFFIT suite.
Results and Discussion
Cd-mineral saturation states
Results of thermodynamic modeling (Supplementary Table S1) of initial solutions (without NPs) revealed undersaturated conditions with respect to Cd(OH)2(s) at all pH (6.5–10.0) values and supersaturation with respect to otavite (CdCO3) at pH >7.0, with nearly 100% of the initial Cd predicted to precipitate at pH >8. These initial conditions were in the absence of hematite NPs; any adsorption to NPs would decrease solution [Cd] and hence lower saturation state.
Cd sorption results: macroscopic observations
Cd sorption density on 8 and 40 nm NPs increased with pH, showing typical metal cation “sorption edge” behavior (Fig. 1). Less than 20% of initial Cd sorbed at pH ≤6, but ∼100% sorbed at pH 9. Values of pH50 (i.e., the pH at 50% sorption; Supplementary Table S2) are ∼7.3 for 8 nm NPs and ∼8.6 and ∼8.4 for MN and SAN 40 nm NPs, respectively. The ∼1 pH unit shift for the 8 nm NPs suggests that there are size-related differences in the hematite NP properties that control sorption. Since this shift occurs for both MN and SAN 40 nm samples, it is not the result simply of differences in total mineral surface area in the suspensions, as might occur in classical experiments that use the same mass of different NPs within reaction vessels. SAN within actual reaction vessels is needed to account for NP size effects on surface-area-to-solution-volume (or sorbent to sorbate) ratios and hence to isolate size-dependent effects on surface reactivity (Barton et al., 2011).

Sorption edges for Cd (initial [Cd] = 134 μM) on 8 nm and 40 nm MN, and 40 nm SAN hematite. Vertical error bars represent the combination of standard deviation of triplicate measurements on triplicate reaction vessels and ICP-OES calibration curve errors on the measurements. Horizontal error bars range from 0.02 to 0.07 and are not shown for clarity. Cd, cadmium; [Cd], Cd concentration; ICP-OES, induced coupled plasma optical emission spectroscopy; MN, mass normalized; SAN, surface area normalized.
The maximum observed sorption densities (∼6 μmol/m2), which represent ∼100% Cd sorption, are similar for the 8 nm NPs and the 40 nm SAN NPs, even though the sorption edge is shifted to the left by ∼1 pH unit for the 8 nm sample. However, maximum (also 100%) Cd sorption for the 40 nm MN experiment corresponds to considerably higher sorption density (∼15.7 μmol/m2), which is consistent with the fact that the 40 nm MN experiments contain considerably less total NP surface area (8.3 vs. 22.3 m2/L for 40 vs. 8 nm NPs, respectively).
Cd sorption results: spectroscopic observations
Filter membranes for samples prepared with Cd (at pH 7.5 and 9.0), but without NPs, were examined by XAS to check for the presence of a potential Cd-bearing precipitate. Although solutions at pH 7.5 and 9.0 were predicted to be supersaturated with respect to otavite (Supplementary Table S1), no Cd XAS signal was detected for these control samples. This suggests that either precipitation was kinetically limited over the course of the experiments or that any potential precipitate was so tiny that they passed through the filters. The absence of a precipitate in the controls suggests that if any precipitate was observed in hematite NP-containing samples, the precipitates were likely induced by the presence of the hematite. The presence of an existing surface can help to promote precipitation, especially when a solution is not highly supersaturated, by lowering surface free energy for nucleation (Maurice, 2009).
XANES results
The most noteworthy XANES and EXAFS results are described in detail in the following three sections. Additional detailed data are provided in the Supplementary Data section (see Figures S2–S10 and Tables S1–S5).
Spectral features in the XANES region are indicative of the coordination environment around a Cd atom, serving as a qualitative “fingerprint” for different types of Cd species. Qualitatively, the K edge XANES spectra of the solid mineral standards contain four different features (labeled A, B, C, and D in Fig. 2). CdCO3 has its most intense peak around 26,718 eV (feature A), whereas for CdO and Cd(OH)2, the most intense peak appears at higher energy and is broader. In addition, CdCO3 exhibits a feature around 26,728 eV (feature B) that is not present in the other two Cd-bearing solid standards. CdO and Cd(OH)2 have a similar feature around 26,733 eV (feature C); this feature is slightly shifted to the right and is broader in CdO than in Cd(OH)2. In addition, CdO shows a broad peak around 26,758 eV (feature D) toward the upper end of the XANES region.
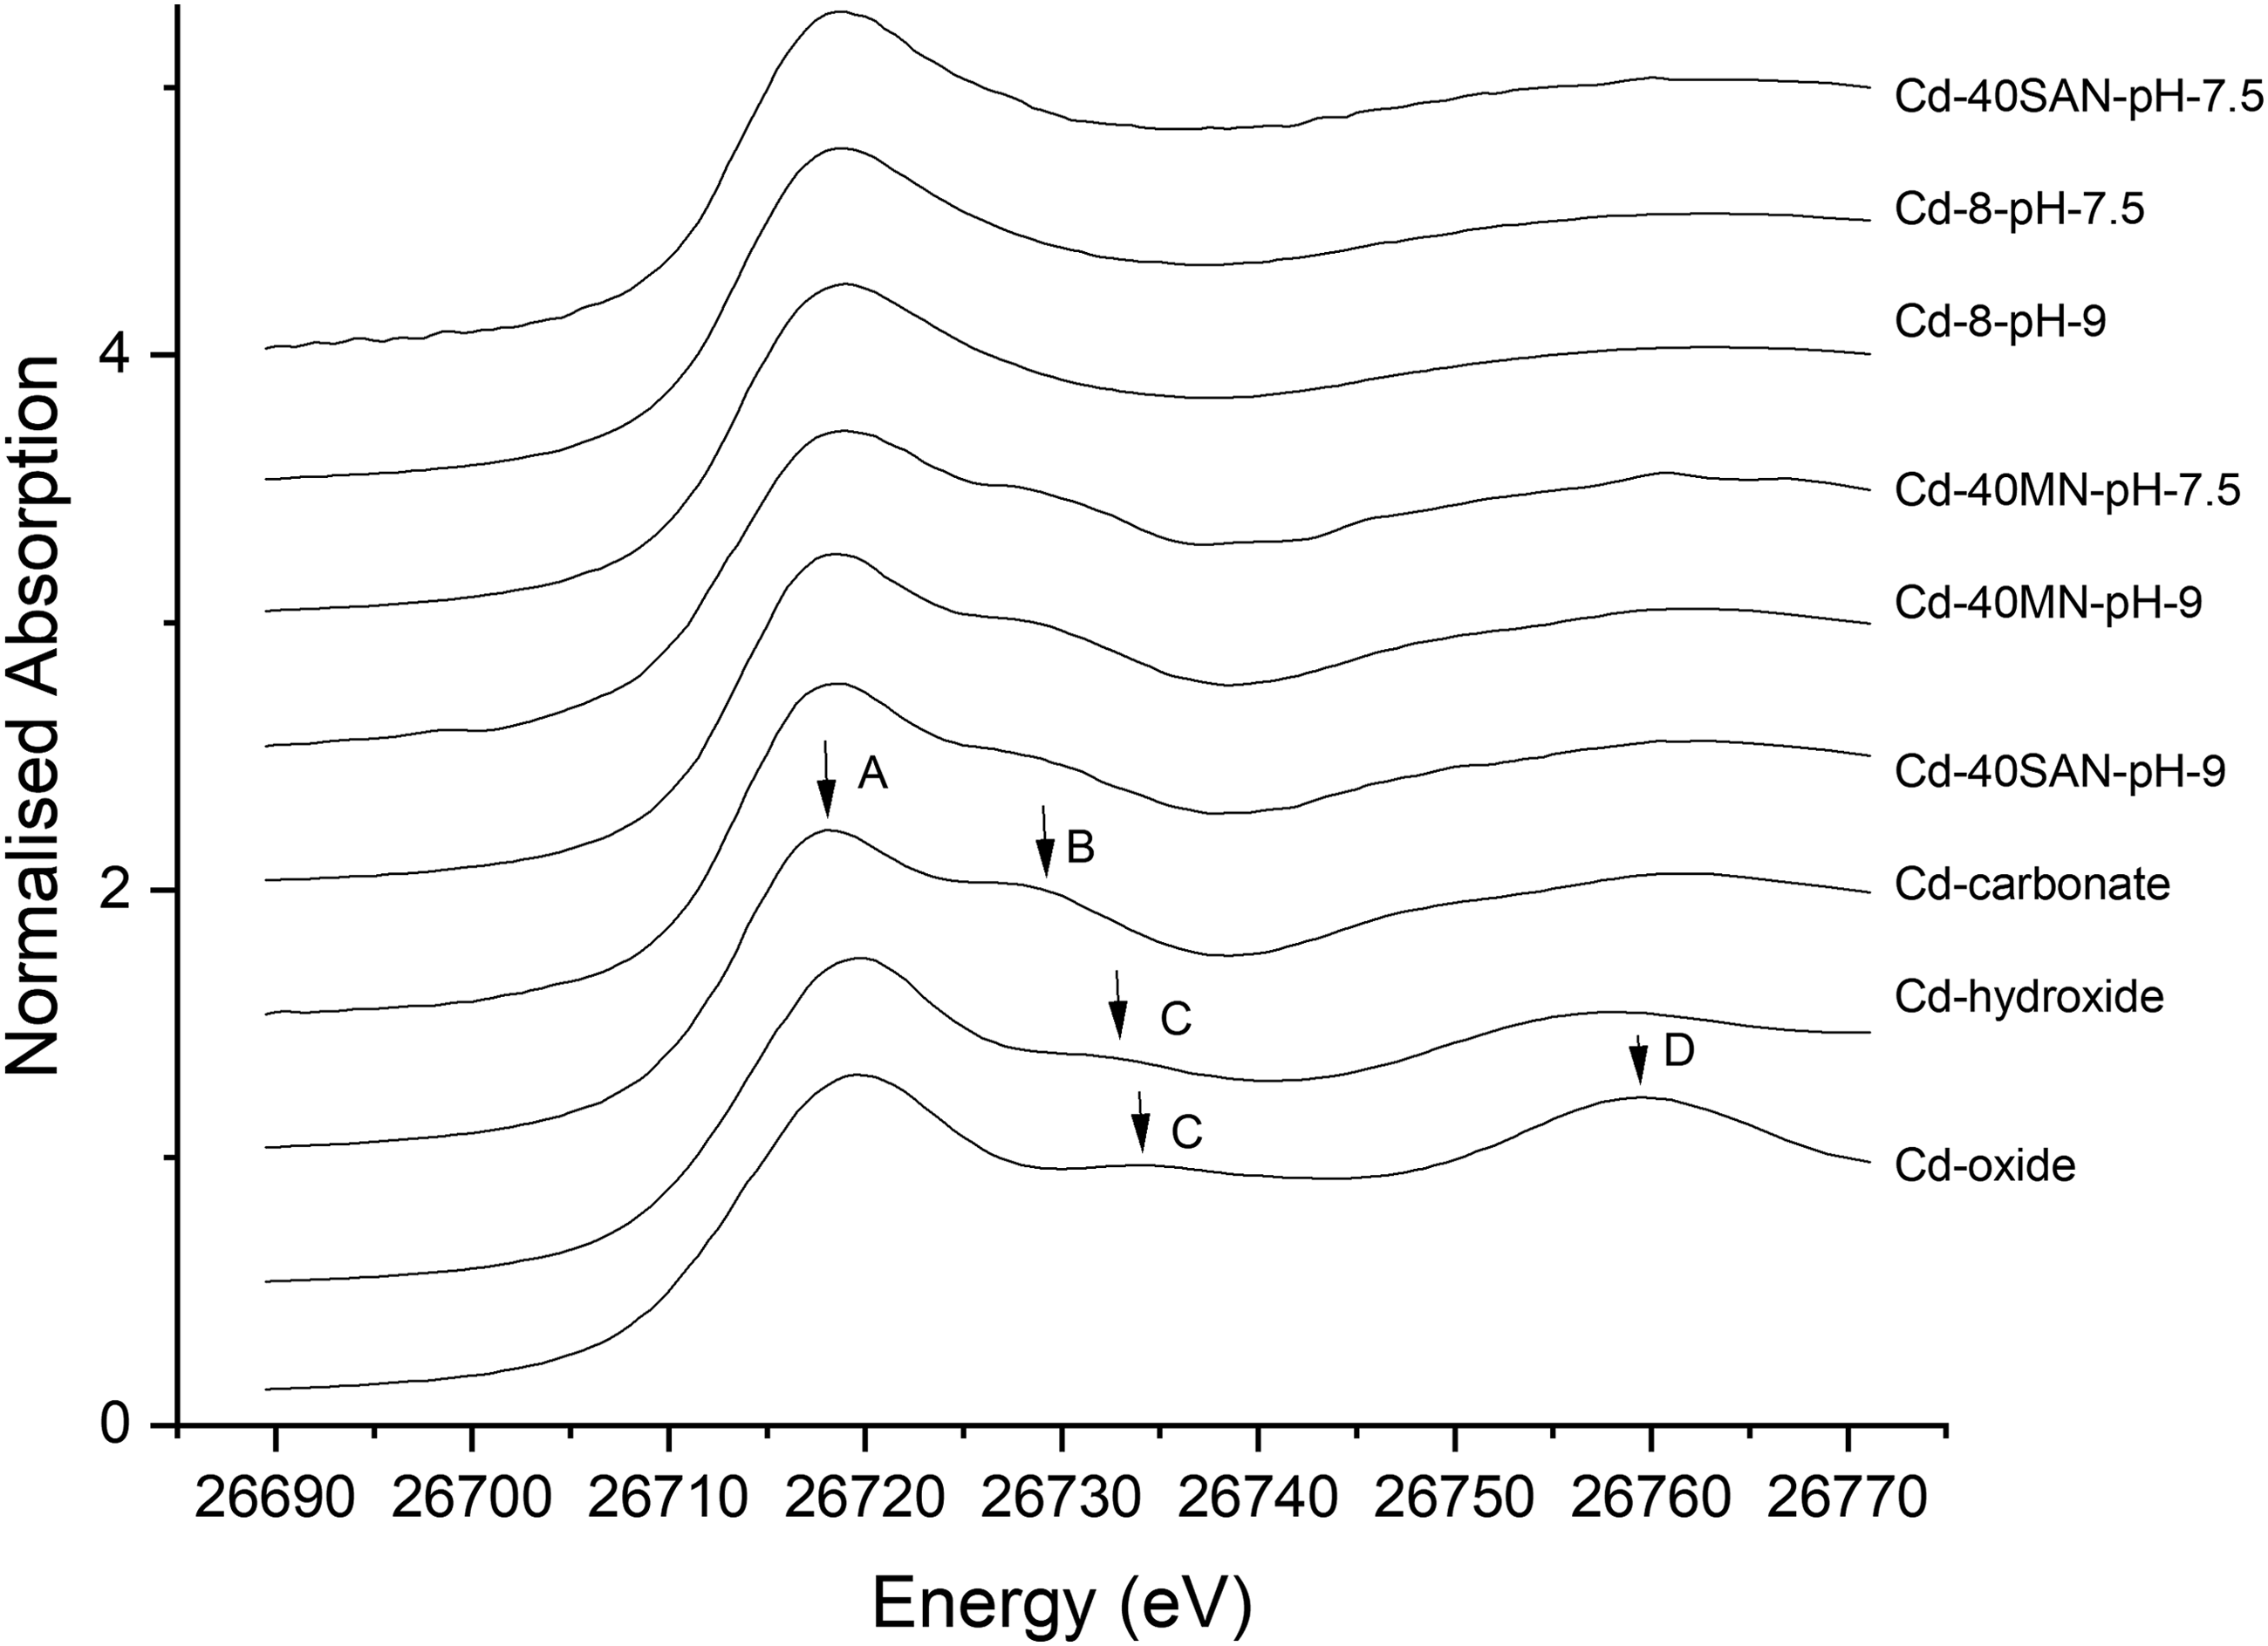
Cd K-edge (26,711 eV) XANES spectra. A, B, C, and D refer to features in the XANES regions of the samples and standards (Names of the spectra can be grouped as, Top three spectra: Primarily adsorption, Middle three spectra: Substantial precipitation, and Bottom three spectra: Solid standards). XANES, X-ray absorption near-edge structure.
Qualitative comparison of the XANES regions of the Cd-8nm NP samples at pH 7.5 and 9.0 and of the 40 nm SAN samples at pH 7.5 (Fig. 2) with the solid mineral standards suggests the presence of little, if any, Cd-containing precipitate since the hematite-containing samples do not show any of the features present in the Cd-bearing standards. Hence, Cd loss from solution can be attributed to adsorption to hematite for both 8 and 40 nm SAN at pH 7.5 samples rather than Cd mineral precipitation. Moreover, the similarity of the XANES regions for these three sample types (8 nm pH 7.5 and 9.0 and 40 nm SAN pH 7.5) suggests a similar coordination environment around the absorbing Cd atom. Previous studies of Cd(II) sorption to kaolinite (Gräfe et al., 2007; Vasconcelos et al., 2008), gibbsite (Gräfe et al., 2007), alumina (Papelis et al., 1995), goethite, and ferrihydrite (Spadini et al., 1994) also suggested the presence of adsorption complexes even at elevated pH values and under conditions of otavite supersaturation.
In contrast, XANES spectra for the Cd-40 MN samples at pH 7.5 and 9.0 and for the 40 SAN sample at pH 9.0 (Fig. 2) contain feature B, which is seen only in the CdCO3 standard, thus indicating the presence of a Cd carbonate precipitate in these samples (although this precipitate might also be a more disordered form of solid Cd carbonate; see section “EXAFS results of Cd(II) adsorption/precipitation to hematite NPs” below). The samples do not exhibit features C or D, indicating little or no Cd oxide or hydroxide precipitation. The reasons for the differences in the XANES features in the above samples compared with 8 nm at pH 7.5 and 9.0 and 40 nm SAN at pH 7.5 are described in terms of NP size and experimental design effects in the section, “Effects of hematite NP size and experimental design on Cd sorption.
These qualitative results were analyzed more rigorously using linear combination fitting of the XANES spectra (Table 1 and Supplementary Fig. S1). For modeling purposes, we used data from the Cd-8nm-pH 7.5 sample as an end-member for a Cd adsorption complex because there was no clear evidence of precipitate formation in this sample (i.e., no B, C, or D peak) and because thermodynamic modeling predicted that this sample was the least saturated with respect to a Cd-bearing mineral phase (Supplementary Table S1). The 8 nm sample at pH 9.0 and 40 nm samples at pH 7.5 and 9.0 were then modeled as a linear combination of the surface site(s) as represented by the Cd-8nm-pH 7.5 sample and the candidate precipitate compounds, CdCO3, Cd(OH)2, and CdO.
X-ray Absorption Near-Edge Structure Region Linear Combination Analysis Results

Results of quantitative LCA for the XANES region, which helps to determine the relative amounts of known constituents present in the sample, are presented in Table 1. The relative amounts of the constituents in each sample are listed as “percentages.” A negligible amount of precipitation is indicated for the 40 nm SAN sample at pH 7.5. Trace precipitation is indicated for the 8 nm sample at pH 9.0. These samples are both dominated (⪆90%) by adsorption (which we term an “adsorption surface site(s)”), as observed on 8 nm NPs at pH 7.5. However, substantial precipitation of ∼64%, ∼76%, and ∼69% CdCO3 (by weight Cd) is indicated for the 40 nm SAN pH 9, the 40 nm MN pH 9, and the 40 nm MN pH 7.5 samples, respectively. In addition, ∼11% (by weight Cd) Cd(OH)2 precipitation is calculated for the 40 nm MN pH 7.5 sample.
Although it could be useful to compare observed Cd “surface coverage” with hematite surface site densities, previous estimates of site densities (Morimoto et al., 1969; Boehm, 1971; Yates et al., 1977; James and Parks, 1982; Barrón and Torrent, 1996) vary by more than an order of magnitude (from 2 to 24 sites/nm2) and little is known about NP size effects on surface site structure and density. Table 1 shows the number of hydrated Cd ions sorbed per unit surface area of hematite NPs in the samples used for XAS (varies between 0.8 and 6.0 Cd atoms/nm2 of NPs). These values indicate that there is Cd coverage of a monolayer or less. Hence, Cd appears unlikely to exceed the availability of potential surface sites on hematite NPs.
EXAFS results of Cd(II) adsorption to hematite NPs
The experimental EXAFS spectrum of the CdCO3 mineral standard was fitted (Supplementary Table S4 and Supplementary Fig. S8) to the crystallographic structure (Graf, 1961) to extract an amplitude reduction factor (Bunker, 2010) of 1.18 ± 0.06 (see Supplementary Data). This value was fixed to model the spectra of NP samples (Tables 2 and Supplementary Tables S3 and S6).
First-Shell Extended X-ray Absorption Fine-Structure Fit Results for Cd-8nm-pH 9.0, Cd-8nm-pH 7.5, and Cd-40SAN-pH 7.5
First-shell Cd-O path from CdCO3 was used to fit the first shell of the above scans with initial starting points for the parameters chosen from CdCO3 first-shell fitting results in Supplementary Table S4.
N = degeneracy of the scattering path (also known as coordination number), R = half-path length of the scattering path, σ2 = mean square relative displacement of the path (DW factor), and ΔE0 = the shift in edge energy of the samples with respect to the absorption edge. The quality of a fit was determined using R factor and reduced
The k range has been restricted to the range k = 2 Å−1 to k = 8.5 Å−1.
The R range has been restricted to the range R = 1 Å to R = 2.3 Å.
Note that four parameters are fit. Using the Nyquist Criterion for the maximum number of independent data points in the fitting,
DW, Debye-Waller.
The 8 nm hematite NPs at pH 7.5 and 9.0 have similar first-shell Cd-O distance (∼2.27 Å) and a similar average first-shell coordination number (CN ∼6) (Table 2). The average first-shell Cd-O distance (∼2.29 Å) and the CN (∼5.53) of the 40 SAN sample at pH 7.5 are similar to those of 8 nm pH 7.5 and 9 samples within uncertainty (Table 2). This suggests that the local coordination environment around sorbed Cd does not change between pH 7.5 and 9.0 for the 8 nm hematite NP samples as well as for the 40 SAN sample at pH 7.5. This is consistent with the similarity in the XANES region of these three samples (Fig. 2).
The presence of a second-shell peak (∼3.3 Å) in the magnitude and real part of the Fourier-transformed EXAFS signal of these three samples (Supplementary Fig. S3) indicates the presence of inner-sphere adsorption (direct covalent surface bonds) with little or no outer-sphere bonding (which would involve water molecules between Cd and the hematite surface).
Therefore, we attempted to fit the EXAFS adsorption data for the 8 nm samples at pH 7.5 and 9.0 and the 40 nm SAN sample at pH 7.5 to different individual potential hematite surface sites for inner-sphere adsorption, as identified by Ha et al. We combined paths generated by FEFF6 (de Leon et al., 1991; Rehr et al., 1991; Zabinsky et al., 1995), a software package used to calculate theoretical multiple scattering paths for EXAFS modeling, based on one or two different models at any one time (see Supplementary Data). However, the resulting modeled paths were not consistent with the observed second-shell peak of 8 nm pH 7.5 and 8 nm pH 9, and 40 nm SAN at pH 7.5.
Good fits could not be obtained (see Supplementary Data), perhaps because the surface sites on hematite NPs are distorted or they are not terminations of the bulk hematite structure. It is also possible that adsorption occurs to more than one or two site(s), which makes modeling difficult. Attempts to combine two modeled surface site configurations did not result in good fits either (see Supplementary Data). Distorted, structurally disordered surface sites and variations in surface topography of nanohematite and various other nanomaterials have been suggested by various researchers (Madden et al., 2006; Wiggington et al., 2007; Waychunas and Zhang, 2008; Barton et al., 2011). Madden et al. suggested that Cu2+ could bind preferentially to surface sites on hematite NPs accommodating Jahn-Teller (J-T) distortion; however, because the actual disordered/reconstructed structure is not known (and may not be a single structure), and there is uncertainty regarding the potential for J-T distorted sites at surfaces, such sites were not modeled here.
EXAFS results of Cd(II) adsorption/precipitation to hematite NPs
XANES LCA analysis of 40 nm SAN pH 9, 40 nm MN pH 9, and 40 nm MN pH 7.5 (Table 1) samples suggest both inner-sphere adsorption (as in Cd-8nm-pH 7.5 sample) and precipitation of Cd-bearing compounds (primarily CdCO3). Based on these observations, fitting of these samples was attempted, modeling the data as a simple LCA of CdCO3(s) and an NP surface adsorption site (as in Cd-8nm-pH 7.5). A complication arises because there are no well-characterized standards for the surface site(s) on hematite NPs. The 8 nm sample at pH 7.5 was used as a proxy “standard” for “pure” adsorption as this sample exhibits little to no precipitation in either XANES or EXAFS spectra. The EXAFS region of the 8 nm sample at pH 7.5 was fitted as closely as possible and the results were used with the EXAFS fitting results of CdCO3 during the LCA process (see Supplementary Data).
As shown in Table 3, the percentage of CdCO3 precipitation in 40 nm SAN at pH 9.0 is 80% ± 29%. The remaining 20% ± 29% contributes to inner-sphere adsorption represented by the surface site configuration in the Cd-8nm-pH 7.5. In the 40 nm MN pH 9.0 sample, the percentage of CdCO3 precipitation is 96% ± 28%, resulting in 4% ± 28% inner-sphere adsorption. Results for the 40 nm MN at pH 7.5 sample indicate 100% ± 11% CdCO3 precipitation. These results are comparable to those from the LCA analysis of the XANES region (Table 1). It is evident that the 40 nm MN samples are more dominated by CdCO3 precipitation than are the 40 nm SAN pH 9.0 samples.
Extended X-ray Absorption Fine-Structure Region Linear Combination Analysis Using CdCO3 and Cd-8nm-pH 7.5 as Standards
R range used in the fitting is from 1 to 4 Å. Refer to parameter descriptions in Table 2 and XAS data analysis section in Supplementary Data for more details of the parameters.
In Cd-8nm-pH-9 and Cd-40SAN-pH-7.5 samples, all the parameters of CdCO3 and Cd-8nm-pH 7.5 samples were fixed, while the percentage of CdCO3 was varied in the fitting. This was done because, in Cd-8nm-pH-9 and Cd-40SAN-pH-7.5 samples, varying DW factors with ΔE0 or R did not result in reasonable parameters. The absence of a precipitate in these samples is consistent with their corresponding XANES linear combination analysis fitting results in Table 1.
Effects of hematite NP size and experimental design on Cd sorption
To consider the effects of experimental design on sorption extent and “mechanism” (as adsorption or precipitation), we can compare macroscopic and spectroscopic results for 40 nm MN versus 40 nm SAN samples. The total hematite 40 nm NP surface area in the MN vessels was 8.3 m2/L, whereas it was considerably higher, 22.3 m2/L, in the SAN vessels. At pH 7.5, the 40 nm hematite NPs run under MN conditions had slightly higher Cd surface coverage (1.3 ± 0.06 Cd atoms/nm2) than the same particles run under SAN conditions (0.8 ± 0.03 Cd atoms/nm2). Sorption to the 40 nm SAN samples occurred primarily by adsorption, whereas sorption to the 40 nm MN samples was only ∼20% by adsorption with ∼69% by CdCO3 precipitation and ∼11% by Cd(OH)2 precipitation. This sort of behavior is typical for metal sorption on oxide minerals at a given pH when surface sites are not fully saturated (Maurice, 2009). Hence, not just the sorption density, but the primary sorption mechanism was different for the two different preparations (MN vs. SAN) of the 40 nm particles at pH 7.5. At pH 9.0, sorption density was considerably higher for the MN (which had less total hematite surface area in the reaction vessels) than the SAN sample. Although both preparations exhibited adsorption and precipitation, the percentage of precipitation was greater for the MN sample (∼76% as CdCO3) than the SAN sample (∼64%). Thus, again, there was an experimental design effect on both extent of sorption and sorption mechanism.
To isolate NP size effects on surface reactivity from size-dependent surface-area effects, we must compare sorption to 8 nm versus 40 nm SAN samples, and neglect the MN samples that contain different total hematite surface area and hence different sorbate (Cd)-to-sorbent (hematite)-surface-area ratios. At pH 7.5, sorption density to the 8 nm NPs (1.9 ± 0.02 Cd atoms/nm2) was considerably greater than the 40 nm SAN NPs (0.8 ± 0.03 Cd atoms/nm2), although for both particle sizes, Cd sorption was dominated by adsorption with little or no precipitation (based on EXAFS data). Hence, while there was an effect of particle size on sorption density, there was little effect on whether sorption was primarily through adsorption or precipitation at pH 7.5. Although we could not determine the exact geometry(ies) of inner-sphere adsorption complex(es), our EXAFS measurements suggest very similar adsorption complex geometry(ies) for inner-sphere sorption on the different NP surfaces at pH 7.5. At pH 9.0, the sorption density on 40 nm SAN NPs (3 ± 0.02 Cd atoms/nm2) was only slightly less than that on 8 nm NPs (3.4 ± 0.02 Cd atoms/nm2). However, there was a notable difference in sorption mechanism, with primarily adsorption (∼93%) and a small amount of precipitation (∼6% as CdCO3 and ∼2% as CdO) on the 8 nm NPs versus a more balanced mix of adsorption (∼37%) and precipitation (∼64% as CdCO3) on the 40 nm SAN NPs. At pH 9, the smaller NPs thus seemed to strongly favor adsorption, whereas the larger NPs showed more precipitation. Considering the entire sorption edges (which provide data beyond the samples at pH 7.5 and 9.0 that were prepared for XAS analysis), there is a shift of ∼1 pH unit to the left for the 8 versus 40 nm SAN particles. Hence, Cd appears to have a higher sorption affinity for the 8 nm hematite NPs than for the 40 nm NPs, at least near circum-neutral pH, that is, the smaller NPs are more reactive in terms of Cd sorption.
Although we observed a particle size effect on sorption, it is difficult to say whether the effect is purely size related or perhaps also due, at least in part, to differences in particle shape. As described by Barton et al., 8 nm NPs are rounded hexagonal, whereas 40 nm NPs are rhombohedral. Shape effects on potential hematite NP surface sites (geometries and/or densities) have been noted previously (Madden and Hochella, 2005; Chernyshova et al., 2007).
Overall, the results of this study confirm that hematite NP size can affect not just the extent of sorption but also sorption “mechanism” in the form of adsorption versus precipitation. Given that sorption “mechanism” can have important effects on metal mobility and transport, models based on observations of larger particles may need to be rethought to account for different NP behaviors. The results also illustrate the importance of careful attention to experimental design when dealing with NPs. We recommend that researchers seeking to determine particle size effects on mineral NP sorption through a batch sorption edge approach conduct experiments that normalize to total surface area within actual reaction vessels rather than simply correcting for differences in surface area mathematically, after the fact. Because NP-specific surface area can increase dramatically as NP size decreases, this approach is essential to maintain similar sorbent-to-sorbate ratios between different particle sizes. Comparing an MN and SAN approach as outlined here can also be instructive, depending upon the specific rationale for a given experiment.
Mineral NPs can behave differently from their larger counterparts. Hence, we cannot always apply classical approaches developed for larger colloidal materials to studies of NPs either in the field (e.g., Hochella et al., 2008) or in the laboratory. The fact that mineral NP size can affect both the extent and mechanism of metal sorption reinforces the importance of developing a new generation of conceptual and quantitative models to account for NP effects on metal fate and transport.
Footnotes
Acknowledgments
This work was conducted with support from the Center for Environmental Science and Technology (University of Notre Dame). K.M. Kuhn was supported by an NSF Graduate Research Fellowship. Useful discussions with Allison Showalter are highly appreciated. We thank the staff (Dr. Soma Chattopadhyay and Dr. Tomohiro Shibata) at Materials Research Collaborative Access Team (MRCAT) for assistance with the beamline setup. MRCAT operations are supported by the Department of Energy and the MRCAT member institutions. This research used resources of the Advanced Photon Source, a U.S. Department of Energy (DOE) Office of Science User Facility operated for the DOE Office of Science by Argonne National Laboratory under Contract No. DE-AC02-06CH11357.
Author Disclosure Statement
No competing financial interests exist.
References
Supplementary Material
Please find the following supplemental material available below.
For Open Access articles published under a Creative Commons License, all supplemental material carries the same license as the article it is associated with.
For non-Open Access articles published, all supplemental material carries a non-exclusive license, and permission requests for re-use of supplemental material or any part of supplemental material shall be sent directly to the copyright owner as specified in the copyright notice associated with the article.