
Abstract
Abstract
Matrix acidizing adds high concentrations of hydrofluoric acid into the oil production well for the purpose of well stimulation and thus, the return fluids could contain high fluoride ion (F−) concentrations. Depending on the fate of the return fluids, high F− concentrations, if untreated, could negatively affect public health and/or the environment. This article shows that calcite (CaCO3) can remove F− ions from solutions containing 200 mg/L of F− and 200 mg/L of aluminum ion (Al3+) or 200 mg/L of iron (III) ion (Fe3+) by precipitation mechanism in batch mode. Al3+ and Fe3+ are among metallic ions that are present in the subsurface and, therefore, may appear in a typical matrix acidizing return fluid. Al3+ and Fe3+ can potentially form complexes with F− and negatively affect F− precipitation. F− concentration was measured at fixed intervals during a 3-h period. The results showed that F− removal efficiencies of up to 95% could be achieved when dissolved calcite is used on distilled water containing 200 mg/L of F− at [Ca2+]/[F−] ratio of 2:1. In addition, the presence of Al3+ or Fe3+ and their complexes did not hinder, and in some instances improved the F− removal efficiency. The PHREEQC geochemical software was utilized as a predictive tool, which verified the study findings regarding the complexes and their role in chemical precipitation of F− compounds.
Introduction
California has some of the highest reserves of oil in the world, and thus, oil and gas production remains a major California industry. For example, the Long Beach oil field in the Los Angeles Basin, once contained about 5 billion cubic meters (three billion barrels) of oil within an area of <7 km2 (2,000 acres) (Long et al., 2015). According to the California Division of Oil, Gas, and Geothermal Resources (DOGGR, 2017), there are 52 oil fields in the state, each with >16 million cubic meters (100 million barrels) of known recoverable oil.
For the past 60 years, well stimulation techniques, such as matrix acidizing, have been used to enhance oil and gas production as California oil fields mature. The modern-day era of acid use in well stimulation began in the 1930s when corrosion inhibitors were discovered to stop acid attack on metal. Commercial use of acids began in the 1950s (Williams et al., 1979). The idea of using acids for well stimulation or cleaning a wellbore is an old concept, but the chemicals, volumes, and techniques used in acidizing have changed.
Matrix acidizing is used to remove formation damage around the wellbore and/or increase reservoir permeability. Operators inject acid solutions, such as hydrofluoric acid (HF), hydrochloric acid (HCl), or mud acid (HF/HCl) into the well at pressures below fracture pressure (Robertson et al., 1989). Acids etch the reservoir silica rock creating channels for oil and gas to flow. The mechanisms involved include etching the mineral surfaces by dissolving the minerals and mobilizing particles by decomposing the rock structure (Mcleod, 1986). In California, matrix acidizing is conducted at depths ranging from 2,000 to 11,000 feet (Abdullah et al., 2016) and are in use throughout central California, especially in Kern Country, and throughout the Southern California region. From April 2013 to September 2015, >600 instances of acidizing took place in urbanized Southern and Central California. During this period, the average amount of HF added during matrix acidizing events reported to California South Coast Air Quality Management District (SCAQMD) and DOGGR are 258 kg and 1,869 kg per treatment, respectively (Abdullah et al., 2016). Reacted HF leaves F− behind, and excessive F− can be detrimental (Abdullah et al., 2016). From September 2014 to September 2015, 23 matrix acidization activities were reported to DOGGR to comply with California Senate Bill 4 (SB4) enacted in 2013. SB4 sets the framework for regulation of well stimulation technologies in California. In all cases, the return fluids were discharged into underground injection control wells, which could potentially contaminate our groundwater and affect human health.
Shuchart (1995) analyzed several sets of well returns after HF acidizing treatments and reported Al3+ and Fe3+ concentrations in a typical return fluid sample to range from 35 to 1,111 mg/L and from 0 to 10,000 mg/L, respectively. The concentration (in mg/L) ratio of F− to Al3+ ranged from 0.58 to 2.44.
F− concentrations of >1.5 mg/L in drinking water can cause fluorosis, and adverse effects have been found from F− concentrations as low as 0.5 mg/L (Ayoob and Gupta, 2007). High concentrations of F−, above levels causing dental fluorosis, have been detected in the groundwater in portions of aquifers in five desert regions of southern California: the Coachella Valley (22%), the Colorado River basin (20%), the Mojave River area (10%), Owens Valley (3%), and the Antelope Valley (3%) (Wong and Stenstrom, 2017). Discharging Matrix acidizing return fluids into the subsurface can add more F− to the already impacted groundwater and affect human health.
Several fluoride removal methods are currently in use, including coagulation and adsorption. Coagulation processes use chemical reagents such as lime, calcium, magnesium salts, polyaluminum chloride, and alum to form a precipitant with fluoride (Wong and Stenstrom, 2017). Adsorption uses sorption media that is often packed in columns. Water containing F− is cycled through the columns, and the media can be regenerated, renewed, or disposed. The use of calcite to remove F− at concentrations of 5–10 mg/L from drinking water and wastewater has been extensively studied. Dissolution of calcite increases calcium concentration until saturation is reached and CaF2 precipitation occurs. Precipitation of CaF2 occurs only at higher concentrations of F− (10–20 mg/L or more) (Wong and Stenstrom, 2017).
A few studies have also been conducted on F
The objectives of this article are the following:
Present potential environmental problems caused by matrix acidizing; increase awareness on the composition and makeup of the recovered matrix acidizing fluids, and the potential impact of untreated F− in matrix acidizing recovered fluids on human health and the environment. Present a simple and effective method of removing F− from matrix acidizing return fluids. Present the results of using calcite in both the dissolved and saturated phase to remove F− at concentrations higher than previously studied from solutions containing F−, Al3+, and Fe3+ ions at high background concentrations of Al3+ and Fe3+. These solutions were prepared to model acidizing return fluids samples that could be recovered in the field. Considering the Al3+ and Fe3+ concentrations in a typical acidizing return fluid, the impact of these ions on the ability of calcite to precipitate F− needs to be investigated. Therefore, the findings of this study should be viewed as primary steps in developing a comprehensive batch process of F− removal from matrix acidizing return fluids at high concentrations of F− and high background concentrations of Al3+ and Fe3+.
Chemistry
Removal processes involving the ions of interest are governed by the reactions presented in Table 1. The formation of fluorite (CaF2), aluminum fluoride (AlF3), aluminum hydroxide [Al(OH)3], and iron (III) hydroxide [Fe(OH)3] depends on the solution pH as shown in Table 2.
Removal Processes Involving Calcium, Aluminum, and Iron
Generalic (2019).
Complexation equilibrium coefficients (Hem, 1968).
Complexation equilibrium coefficients (Inczedy, 1976).
N/A, not available.
The pH Dependence of Calcium, Aluminum, Iron, and Silica Chemistry in Return Fluid Waters
Experimental Design
This study was conducted in two phases as shown in Table 3. In phase I, calcite was used in solid state. In phase II, calcite was used in aqueous state. “Blank sample” refers to the mixture of NaF + CaCO3. “Al-sample” refers to the mixture of NaF + AlCl3 + CaCO3. “Fe-sample” refers to the mixture of NaF + FeCl3 + CaCO3. “Combined (Al3+ + Fe3+) sample” refers to the mixture of NaF + AlCl3 + FeCl3 + CaCO3.
Amounts and Concentrations of Reagents Used in the Study
Volume of deionized water = 400 mL.
Phase I
Sodium fluoride, aluminum chloride, and iron (III) chloride were dissolved in 400 mL of distilled water to produce solutions with starting concentrations of 200 mg/L each for F−, Fe3+, and Al3+ ions. 13.32 g of solid calcite was then added to the solutions. The solutions were continuously stirred and were either analyzed immediately or left for 2 days to reach equilibrium, as done by Cai et al., (2017). F− concentration and pH were measured for a 3-h period.
Phase II
Sodium fluoride, aluminum chloride, and iron (III) chloride were dissolved in 400 mL of distilled water to produce solutions with starting concentrations of 200 mg/L each for F−, Fe3+, and Al3+ ions. Calcite was completely dissolved in distilled water by lowering the pH using HCl to achieve a concentration of 900 mg/L for calcite in each case as described in Table 3. This concentration of calcite was used to achieve a [Ca2+]/[F−] molar ratio of ∼2:1 and to ensure a F− limiting environment.
The pH was raised to the desired value using NaOH as shown on the pH plots indicating the starting pH. Solutions were continuously stirred and were analyzed for F− and pH for a 3-h period.
Experimental protocol
F− concentration was measured using an ion-selective electrode (American Scientific Corporation, Portland, OR) and a silver chloride 900100, single junction, reference electrode (Thermo Fisher Scientific, Waltham, MA) following the procedure given hereunder:
Using solid NaF, a 1,000 mg/L F− stock solution was prepared in “Total Ion Selective Addition Buffer” (TISAB) III (Aqua Solutions, Inc., Deer Park, TX). The stock solution was then diluted to make standards of the following concentrations prepared with the addition of TISAB III.
500 mg/L
100 mg/L
50 mg/L
10 mg/L
The sample to be analyzed was transferred into a clean dry beaker large enough to contain two electrodes. Ten milliliters of TISAB III was added for every 100 mL sample to be analyzed.
The potential difference of the standard solutions was measured by a PHI 350 Digital pH/temperature/mV meter (Beckman Coulter, Inc., Pasadena, CA). The lowest to highest concentration was followed considering the initial fluoride concentrations of the sample to be analyzed.
A clean and dry fluoride ion-selective electrode as well as reference electrode were inserted into the solution and swirled gently.
The potential difference on the meter was recorded using the voltage scale after it was stabilized.
To determine the F− concentration of the sample to be analyzed, a standard calibration curve was prepared showing the measured potential difference versus the log of F− concentration.
A best-fit curve was created, and the equation of the curve was used to calculate the concentration of F− in the sample.
Plastic laboratory ware was used for storage of standard solutions to prevent potential reaction of F− with glass over time.
Geochemical Modeling
PHREEQC software (Parkhurst and Appelo, 2013), a geochemical model for simulating chemical reactions and transport processes in natural or polluted water, was used in this study. PHREEQC is capable of simulating chemical reactions, such as aqueous equilibria, mineral dissolution and precipitation, ion exchange, surface complexion, solid solutions, gas–water equilibrium, and kinetic biogeochemical reactions. The general framework for the PHREEQC simulations is presented in Fig. 1.
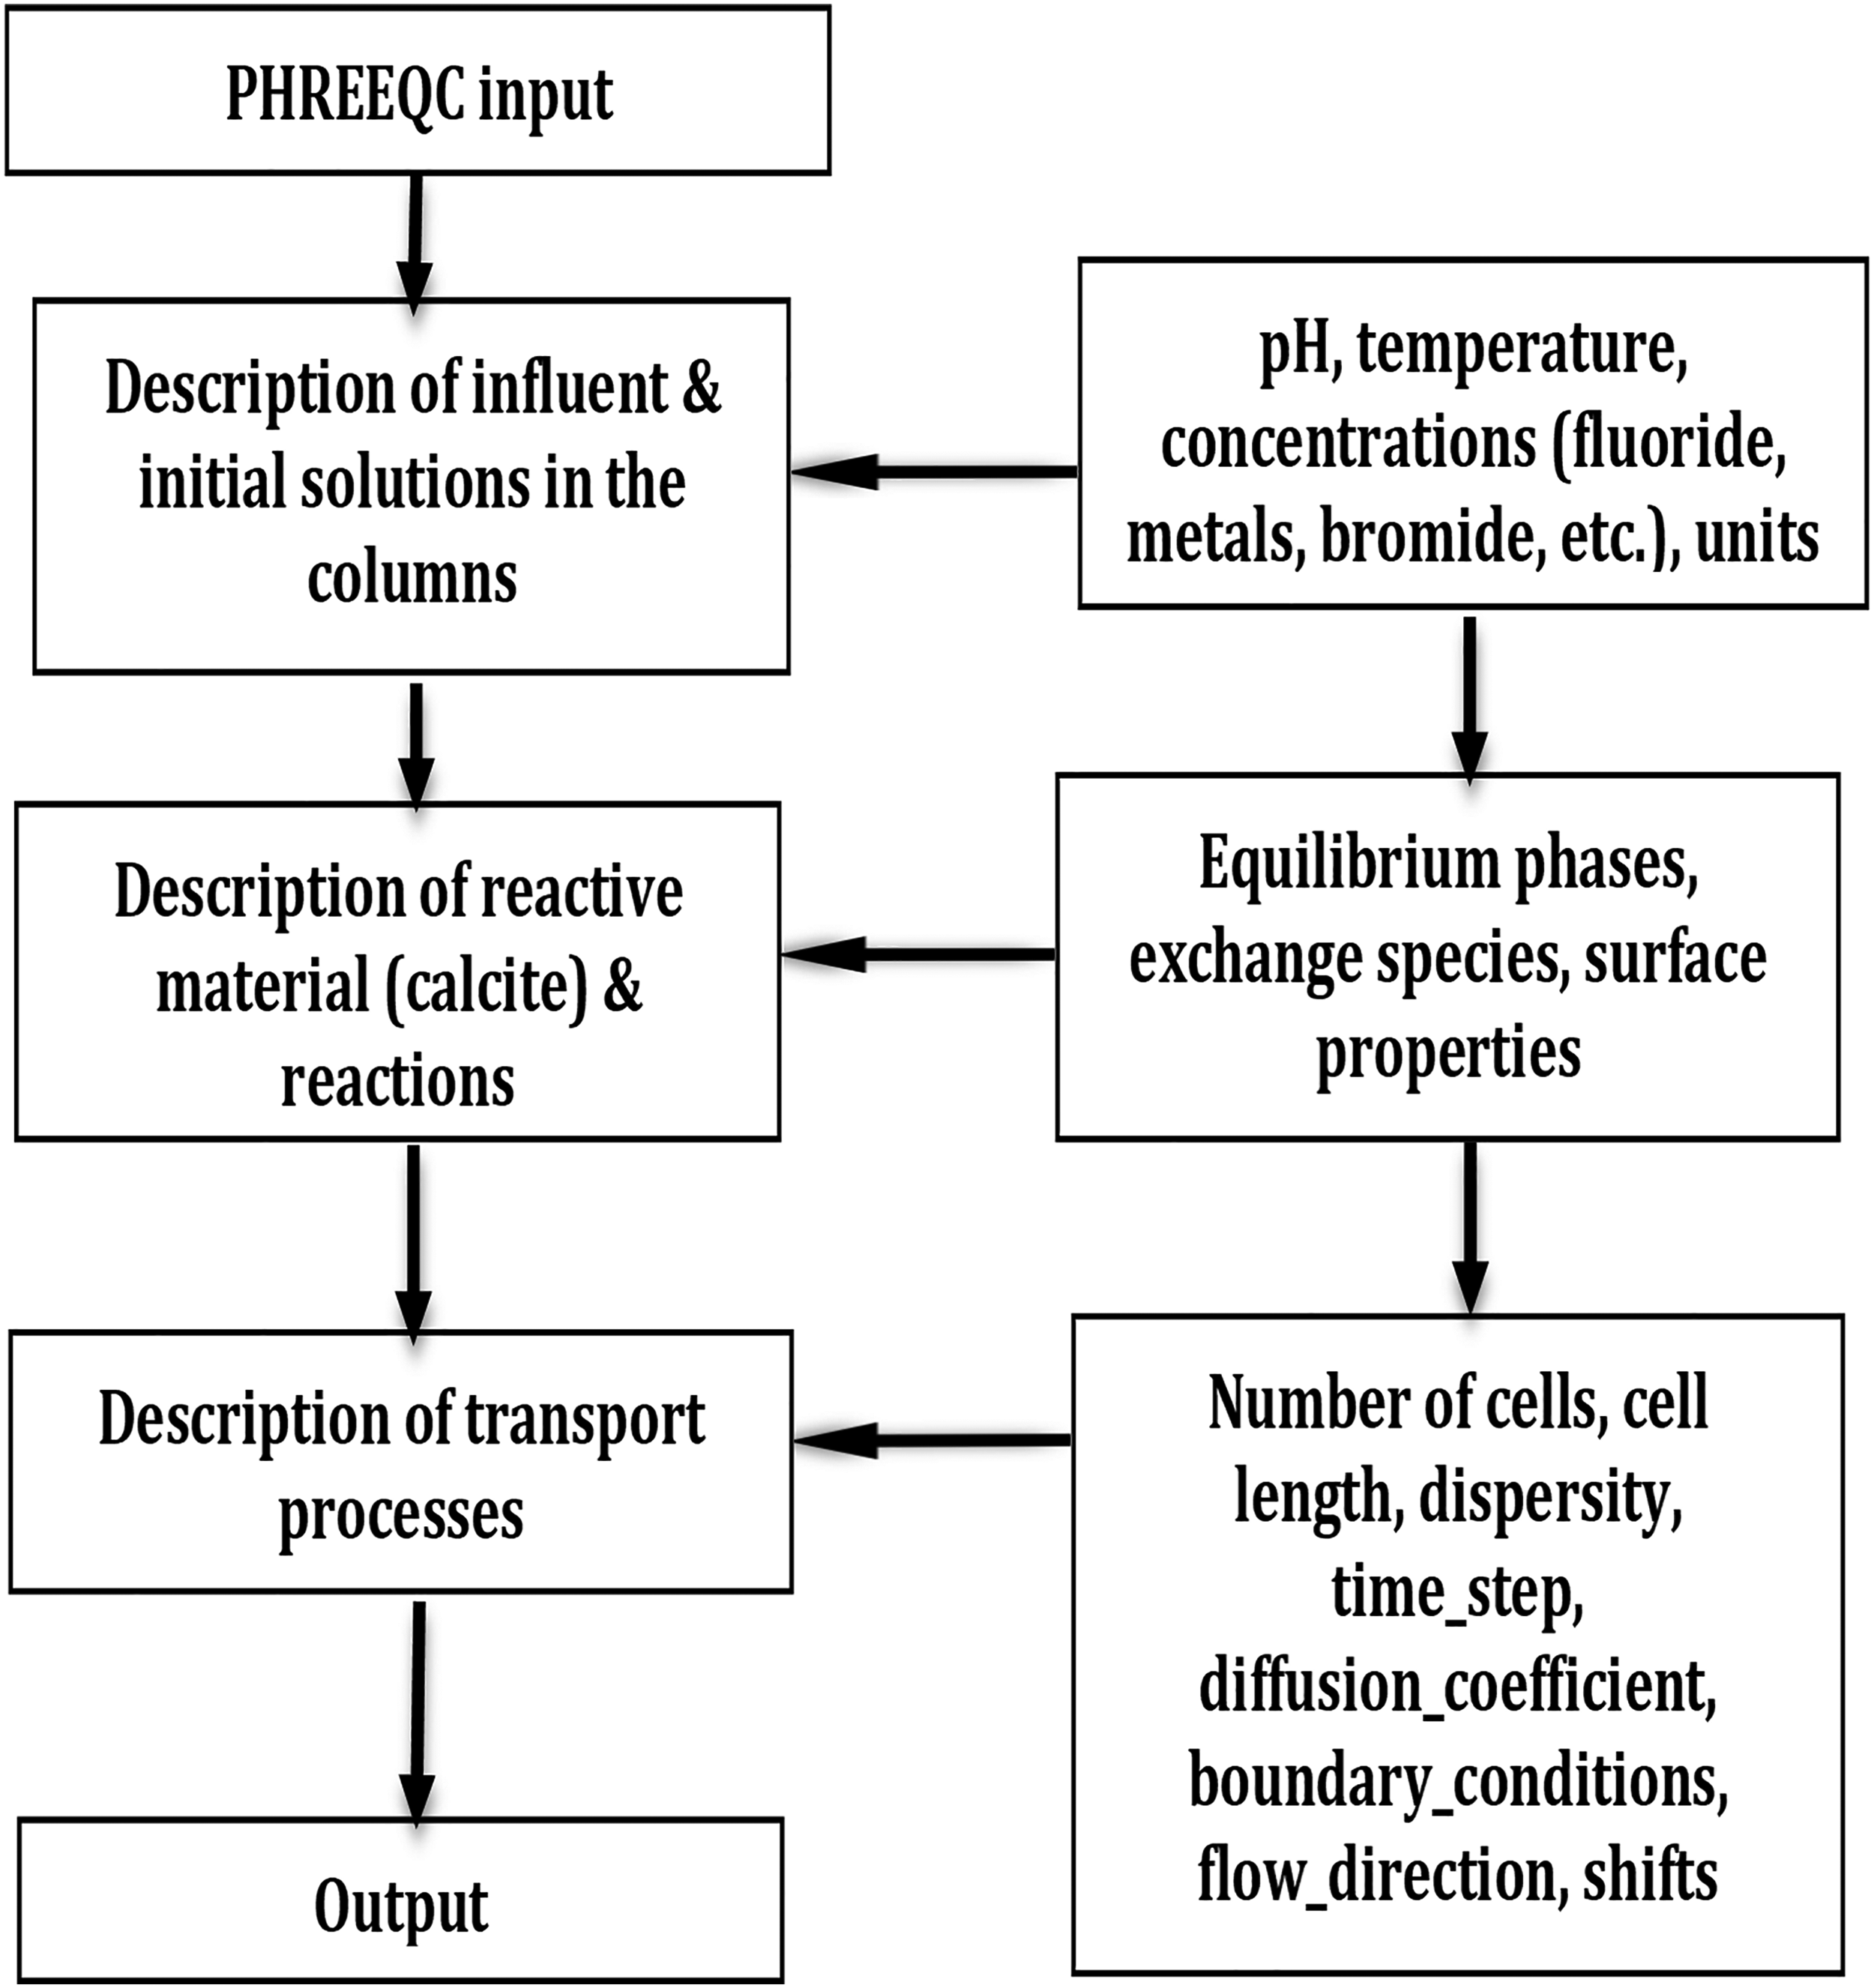
General framework of PHREEQC input file (Cai et al., 2017).
The software was used as a speciation program to calculate saturation indices (SIs) and the distribution of aqueous metal/F− species, and ultimately, to verify the experimental results as follows:
Solution composition, pressure, and temperature were entered into the program.
The program was set to adjust the equilibrium pH to achieve charge balance.
The batch reaction modeling feature of the program was used to predict how the solution reacts with a solid phase or aqueous phase of CaCO3.
Results and Discussion
Phase I
Immediate analysis after calcite addition
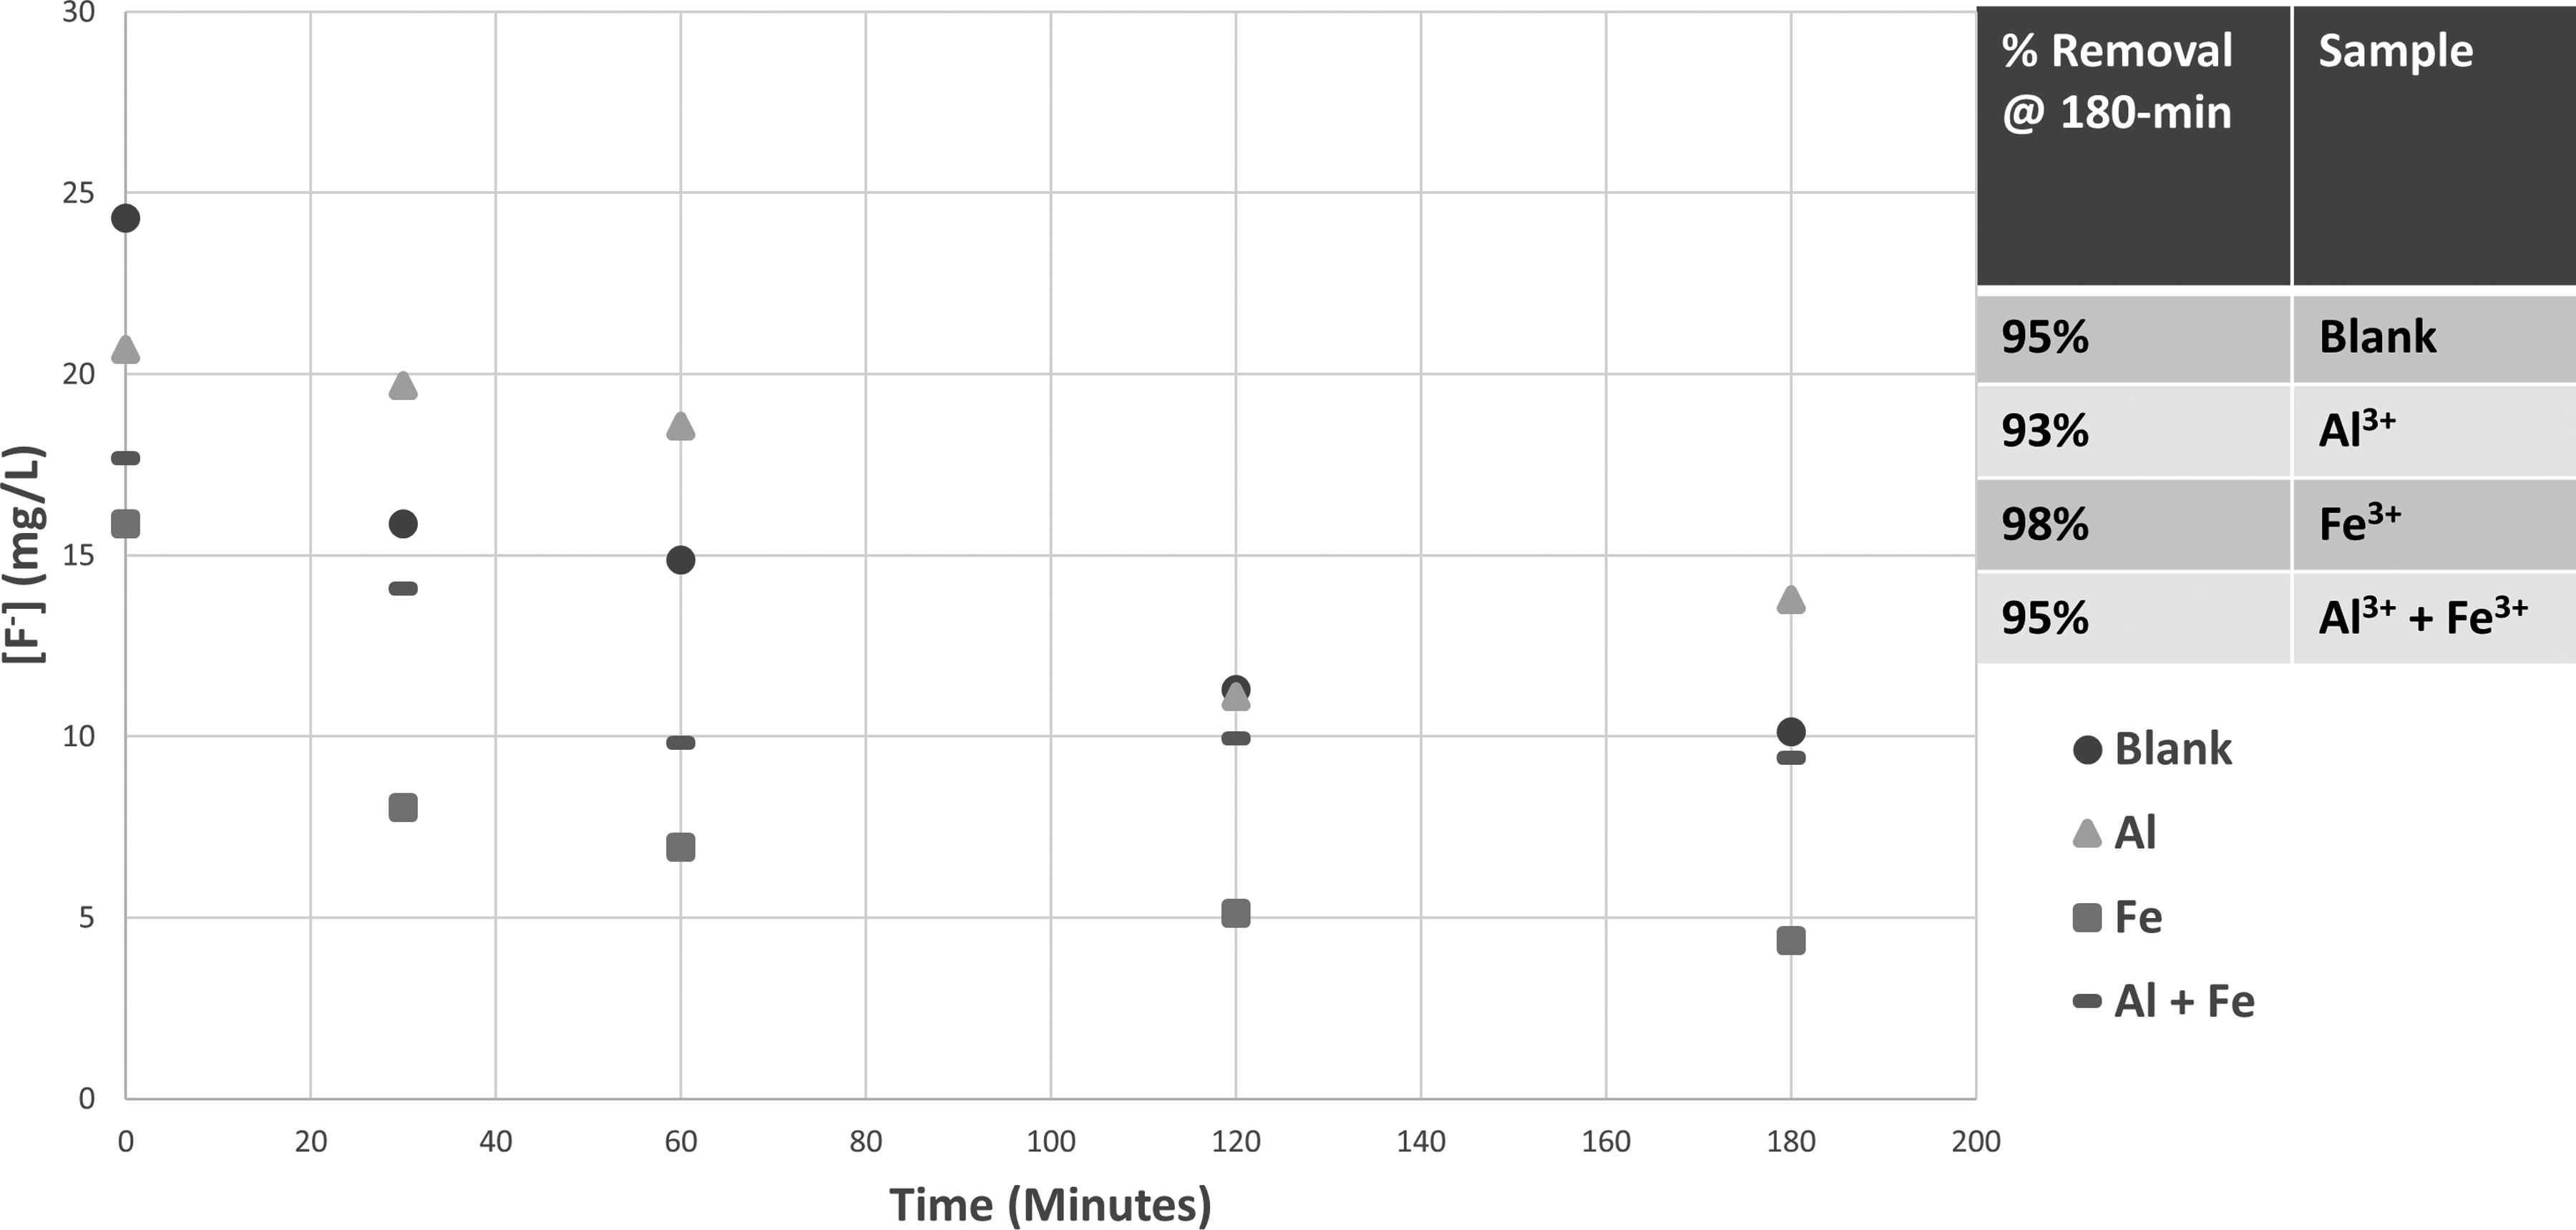
Figure 2 shows that the presence of Fe3+ had a positive impact on F− removal by calcite. For example, at 180-min mark, an 80% F− removal was achieved in the sample containing 200 mg/L Fe3+ as compared with a 25% F− removal in the blank sample. The presence of Al3+ also improved F− removal, but to a lesser extent. Although the starting concentration of F− in all cases was 200 mg/L, the concentration of F− dropped immediately upon measurement at time zero as shown in Figs. 2, 4, 6, and 7. In some instances, the measured initial concentration of F− was slightly above the starting value of 200 mg/L, which could be due to instrumentation error.
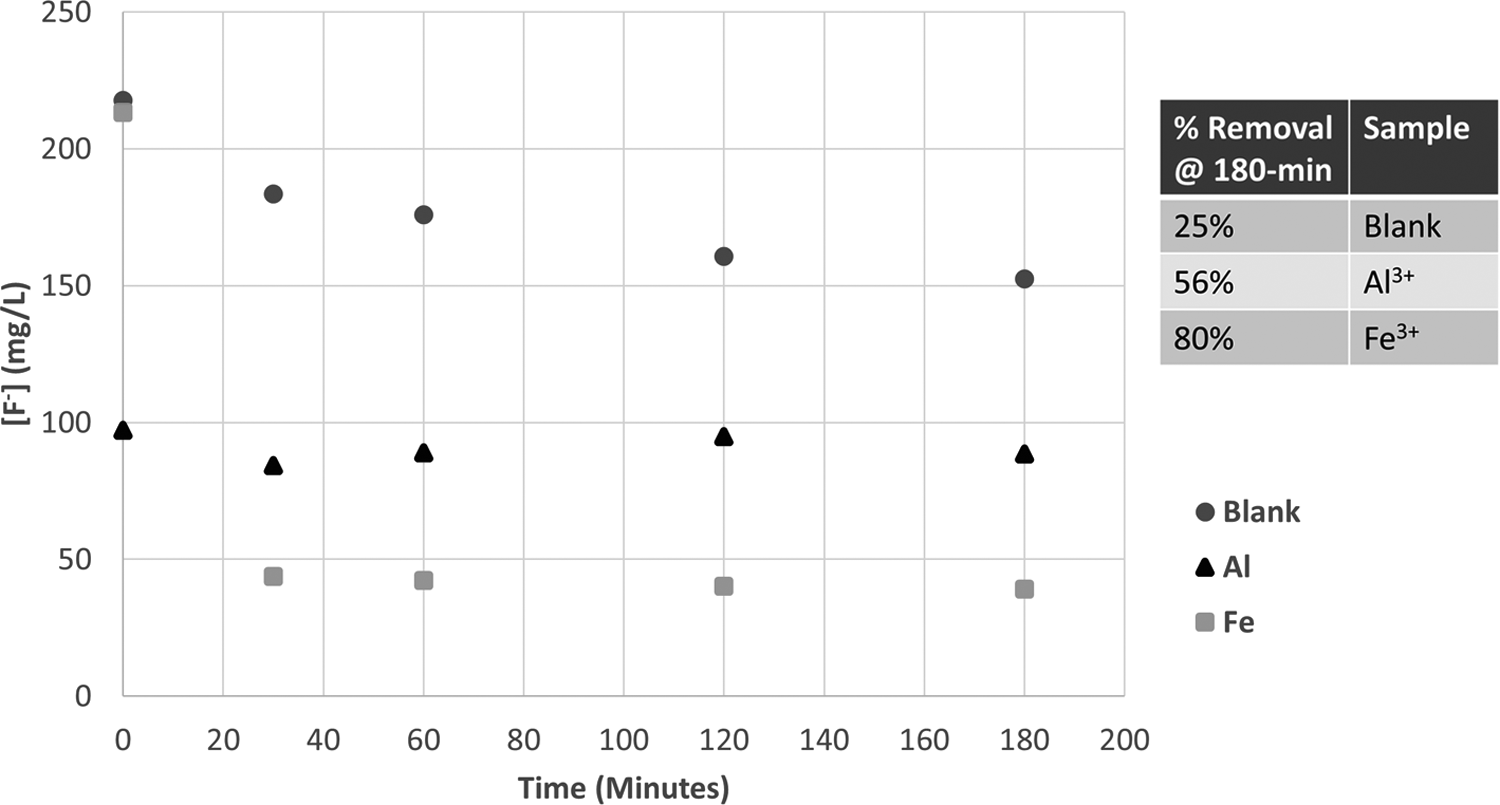
Effect of 200 mg/L Al3+ and Fe3+ on removal of 200 mg/L fluoride samples analyzed immediately after CaCO3 addition.
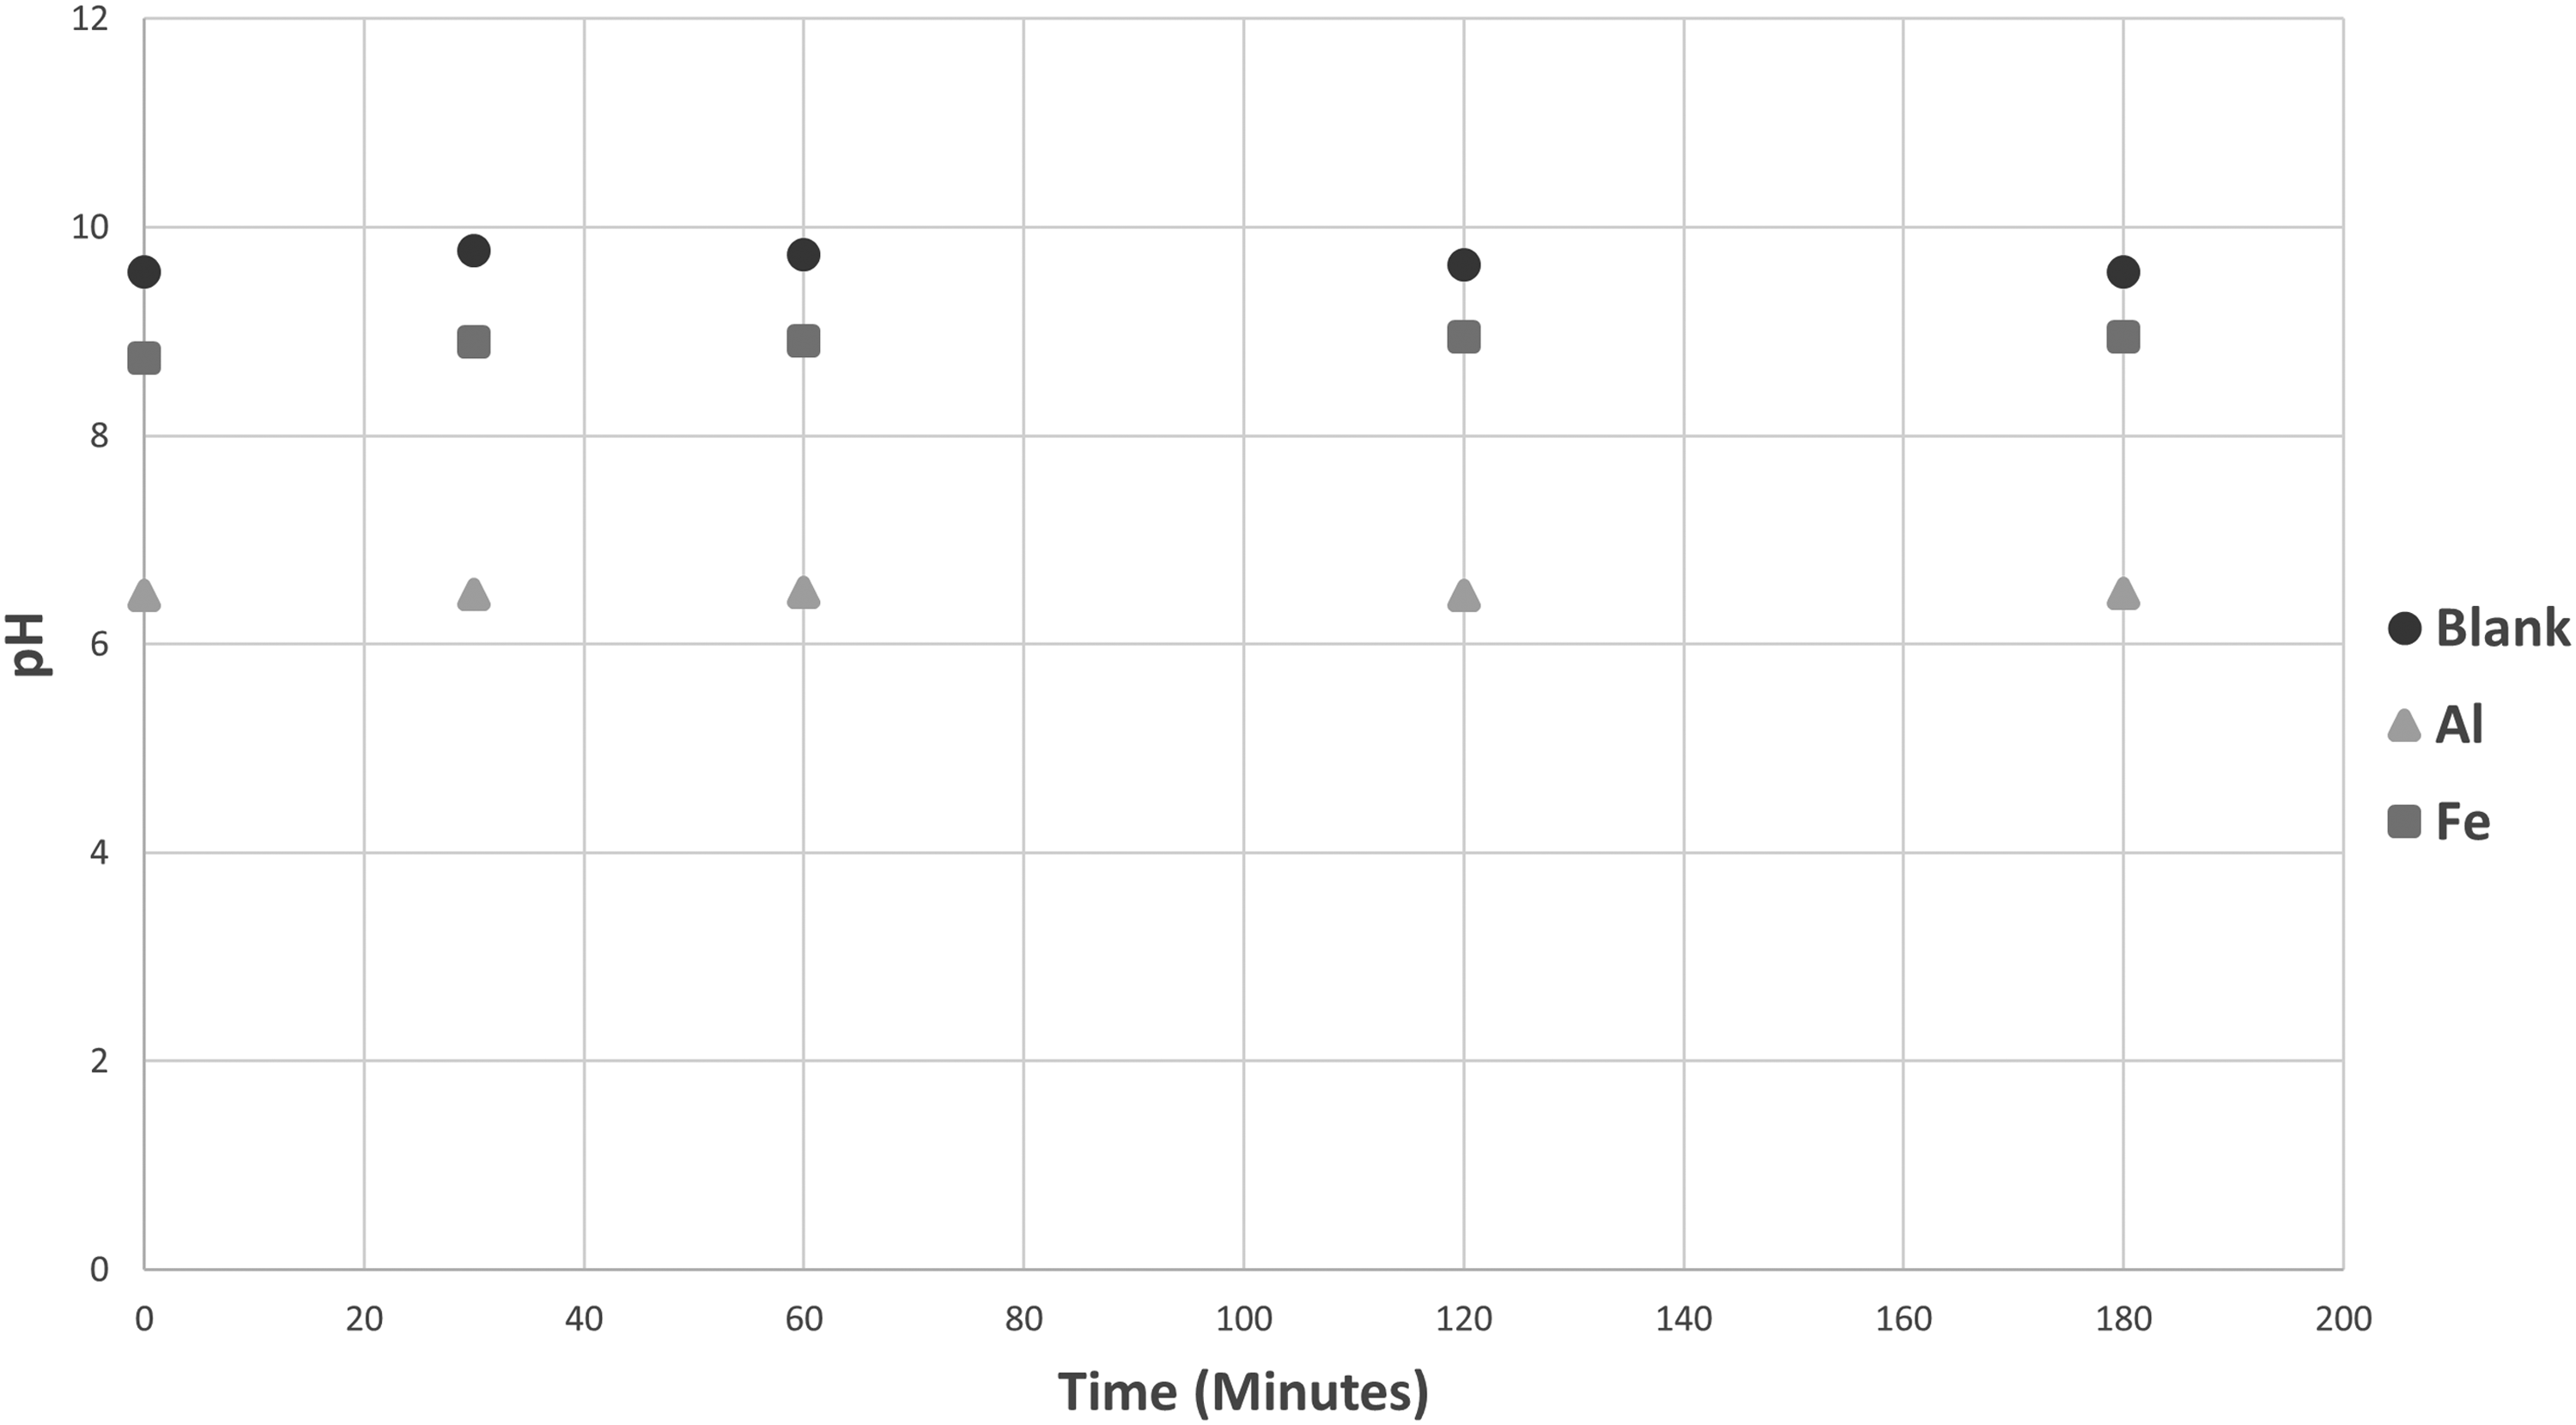
The pH of the solutions after the initial rise was generally stable after 60 min (Figure 3).
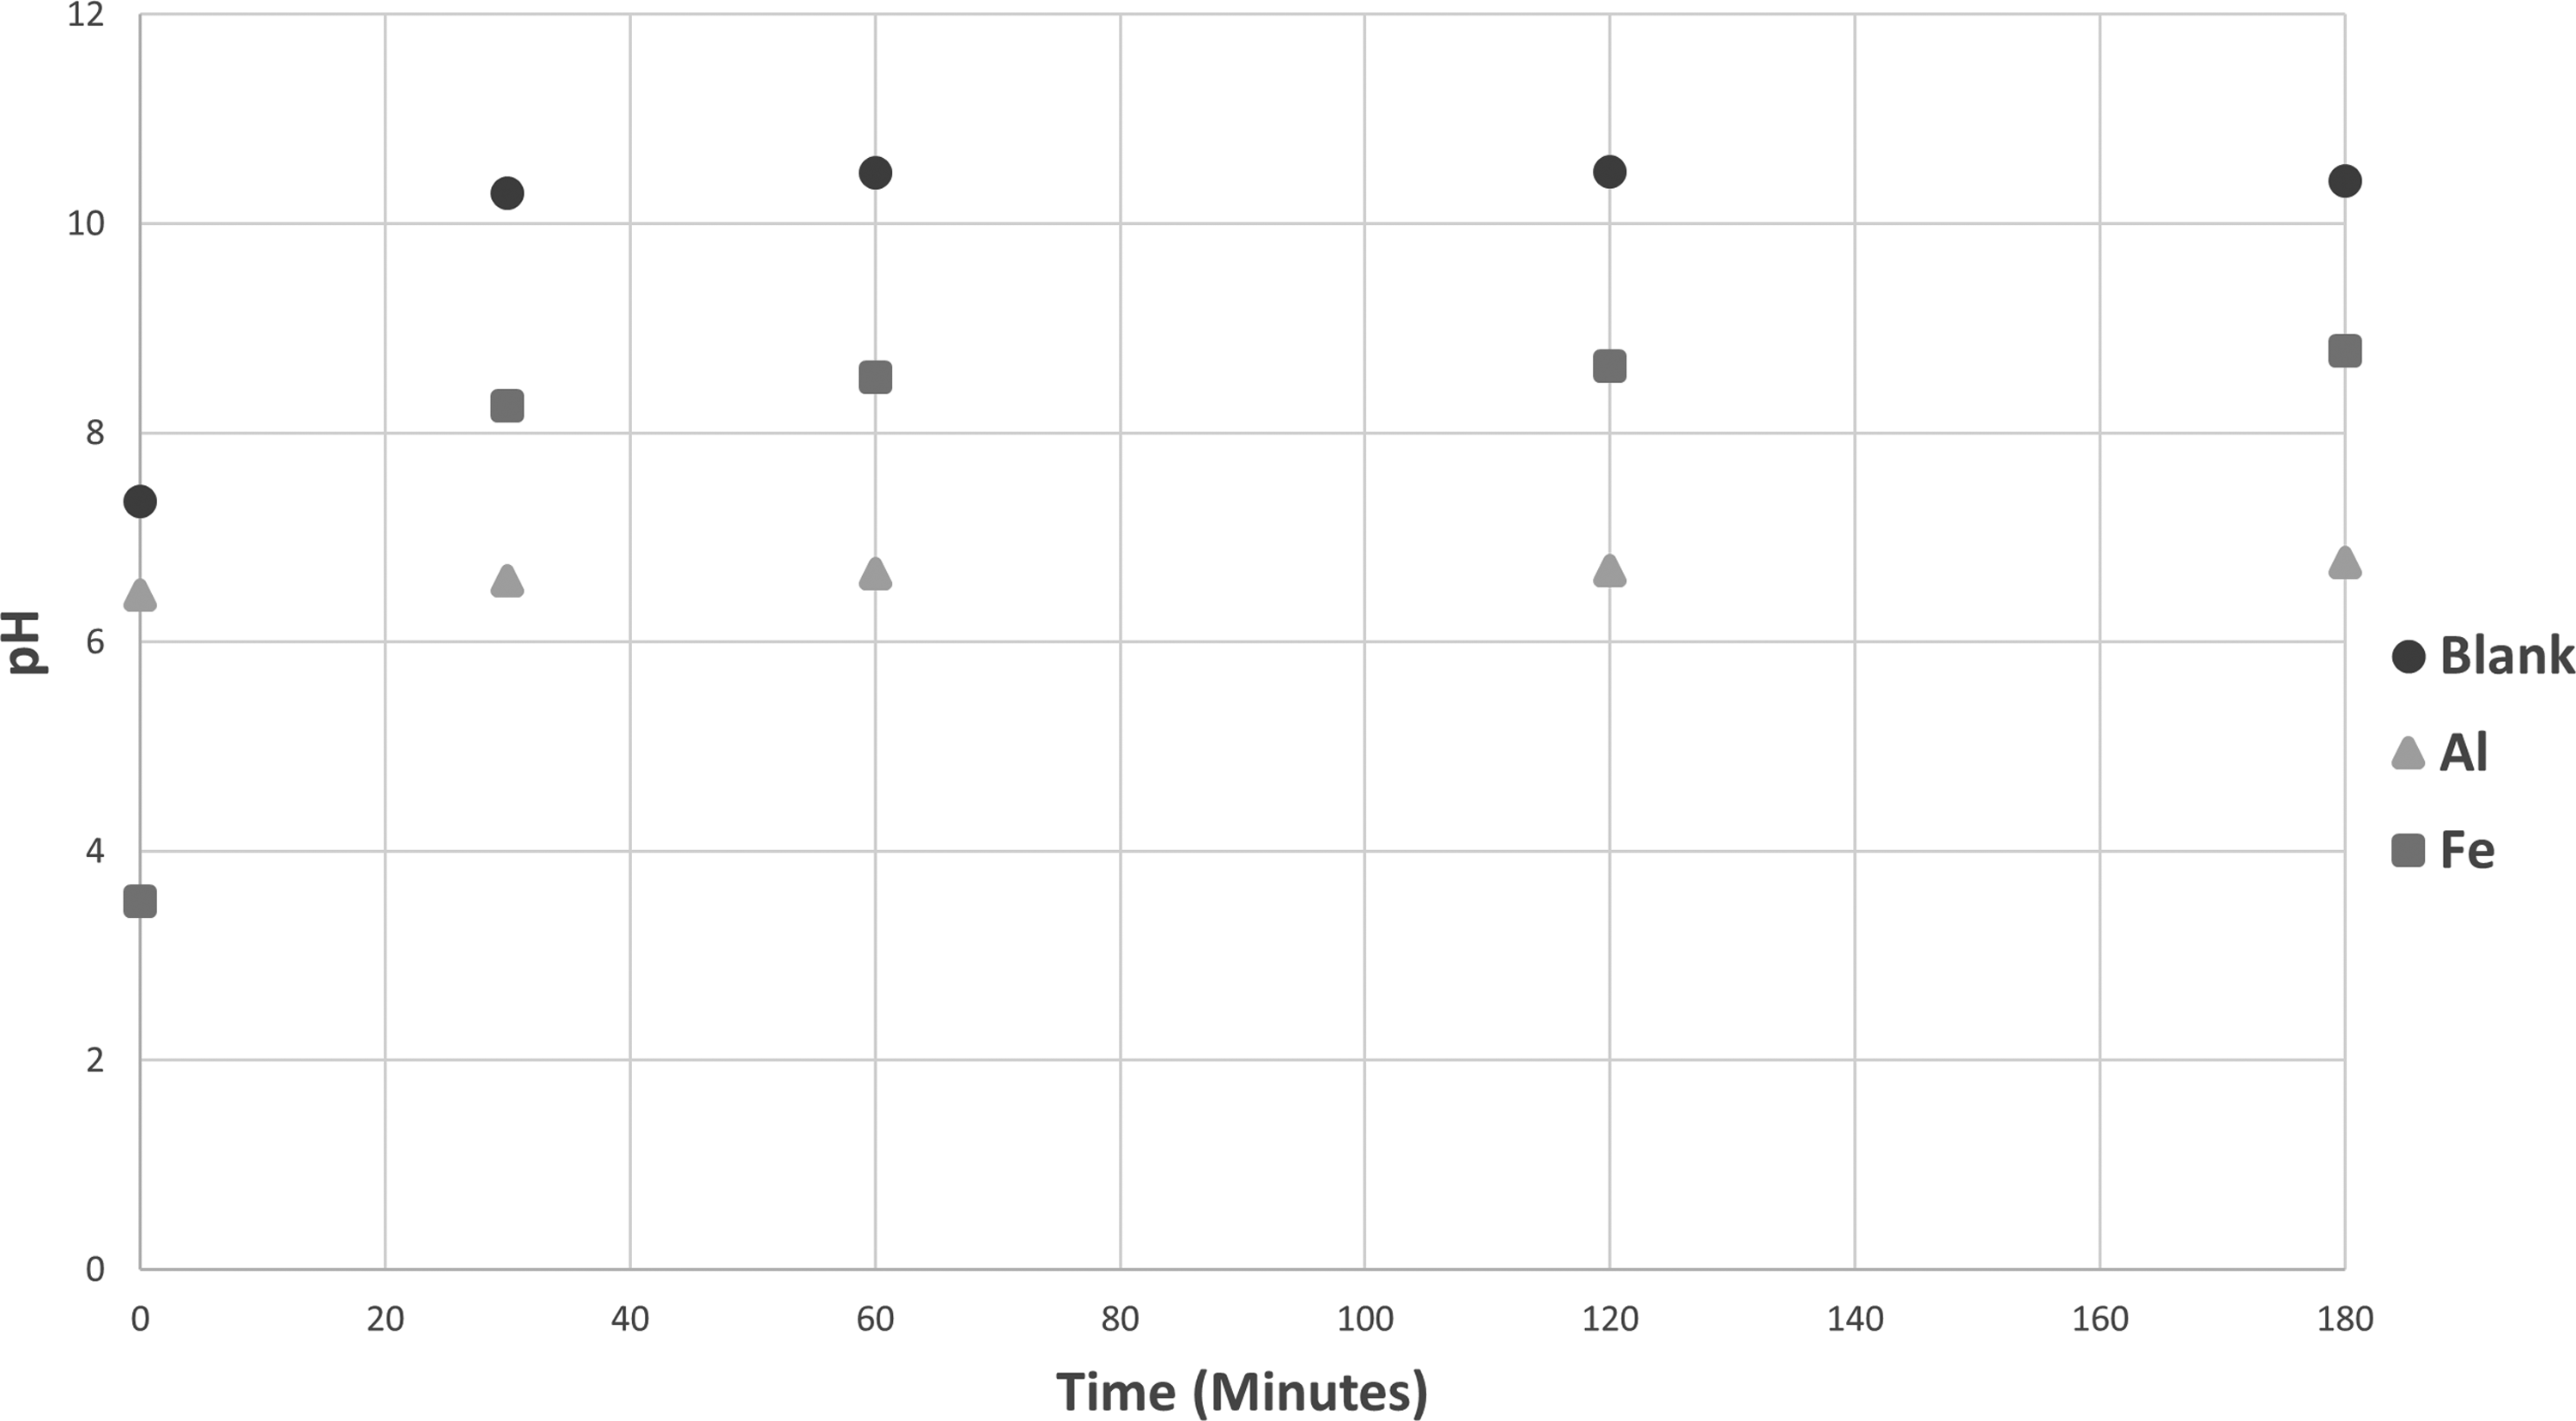
pH versus time plot—effect of 200 mg/L Al3+ and Fe3+ on removal of 200 mg/L fluoride samples analyzed immediately after CaCO3 addition.
The positive saturation indices of CaF2 for all three cases calculated by PHREEQC (Tables 4, 5, and 7) verify that F− removal is governed by the formation of CaF2. Zero saturation indices calculated by PHREEQC for calcite for all three cases indicate that the calcium ions favor combining with the F− ions over the carbonate ions.
Indices—Blank Sample
IAP, ionic activity product; SI, saturation index.
Indices—Al3+ Sample
In case of Al3+, PHREEQC shows that considerable amounts of aqueous Al-F complexes, including AlF3, are expected (Table 6). However, a negative saturation index for AlF3 suggests that AlF3 is undersaturated, and the removal of F− is due only to the formation of solid CaF2 (Table 5).
PHREEQC Output—Al3+ Sample
In case of Fe3+, as Table 7 shows, the positive saturation indices of CaF2 and FeF3 point to the likelihood that F− removal is achieved through the formation of both CaF2 and FeF3.
Indices—Fe3+ Sample
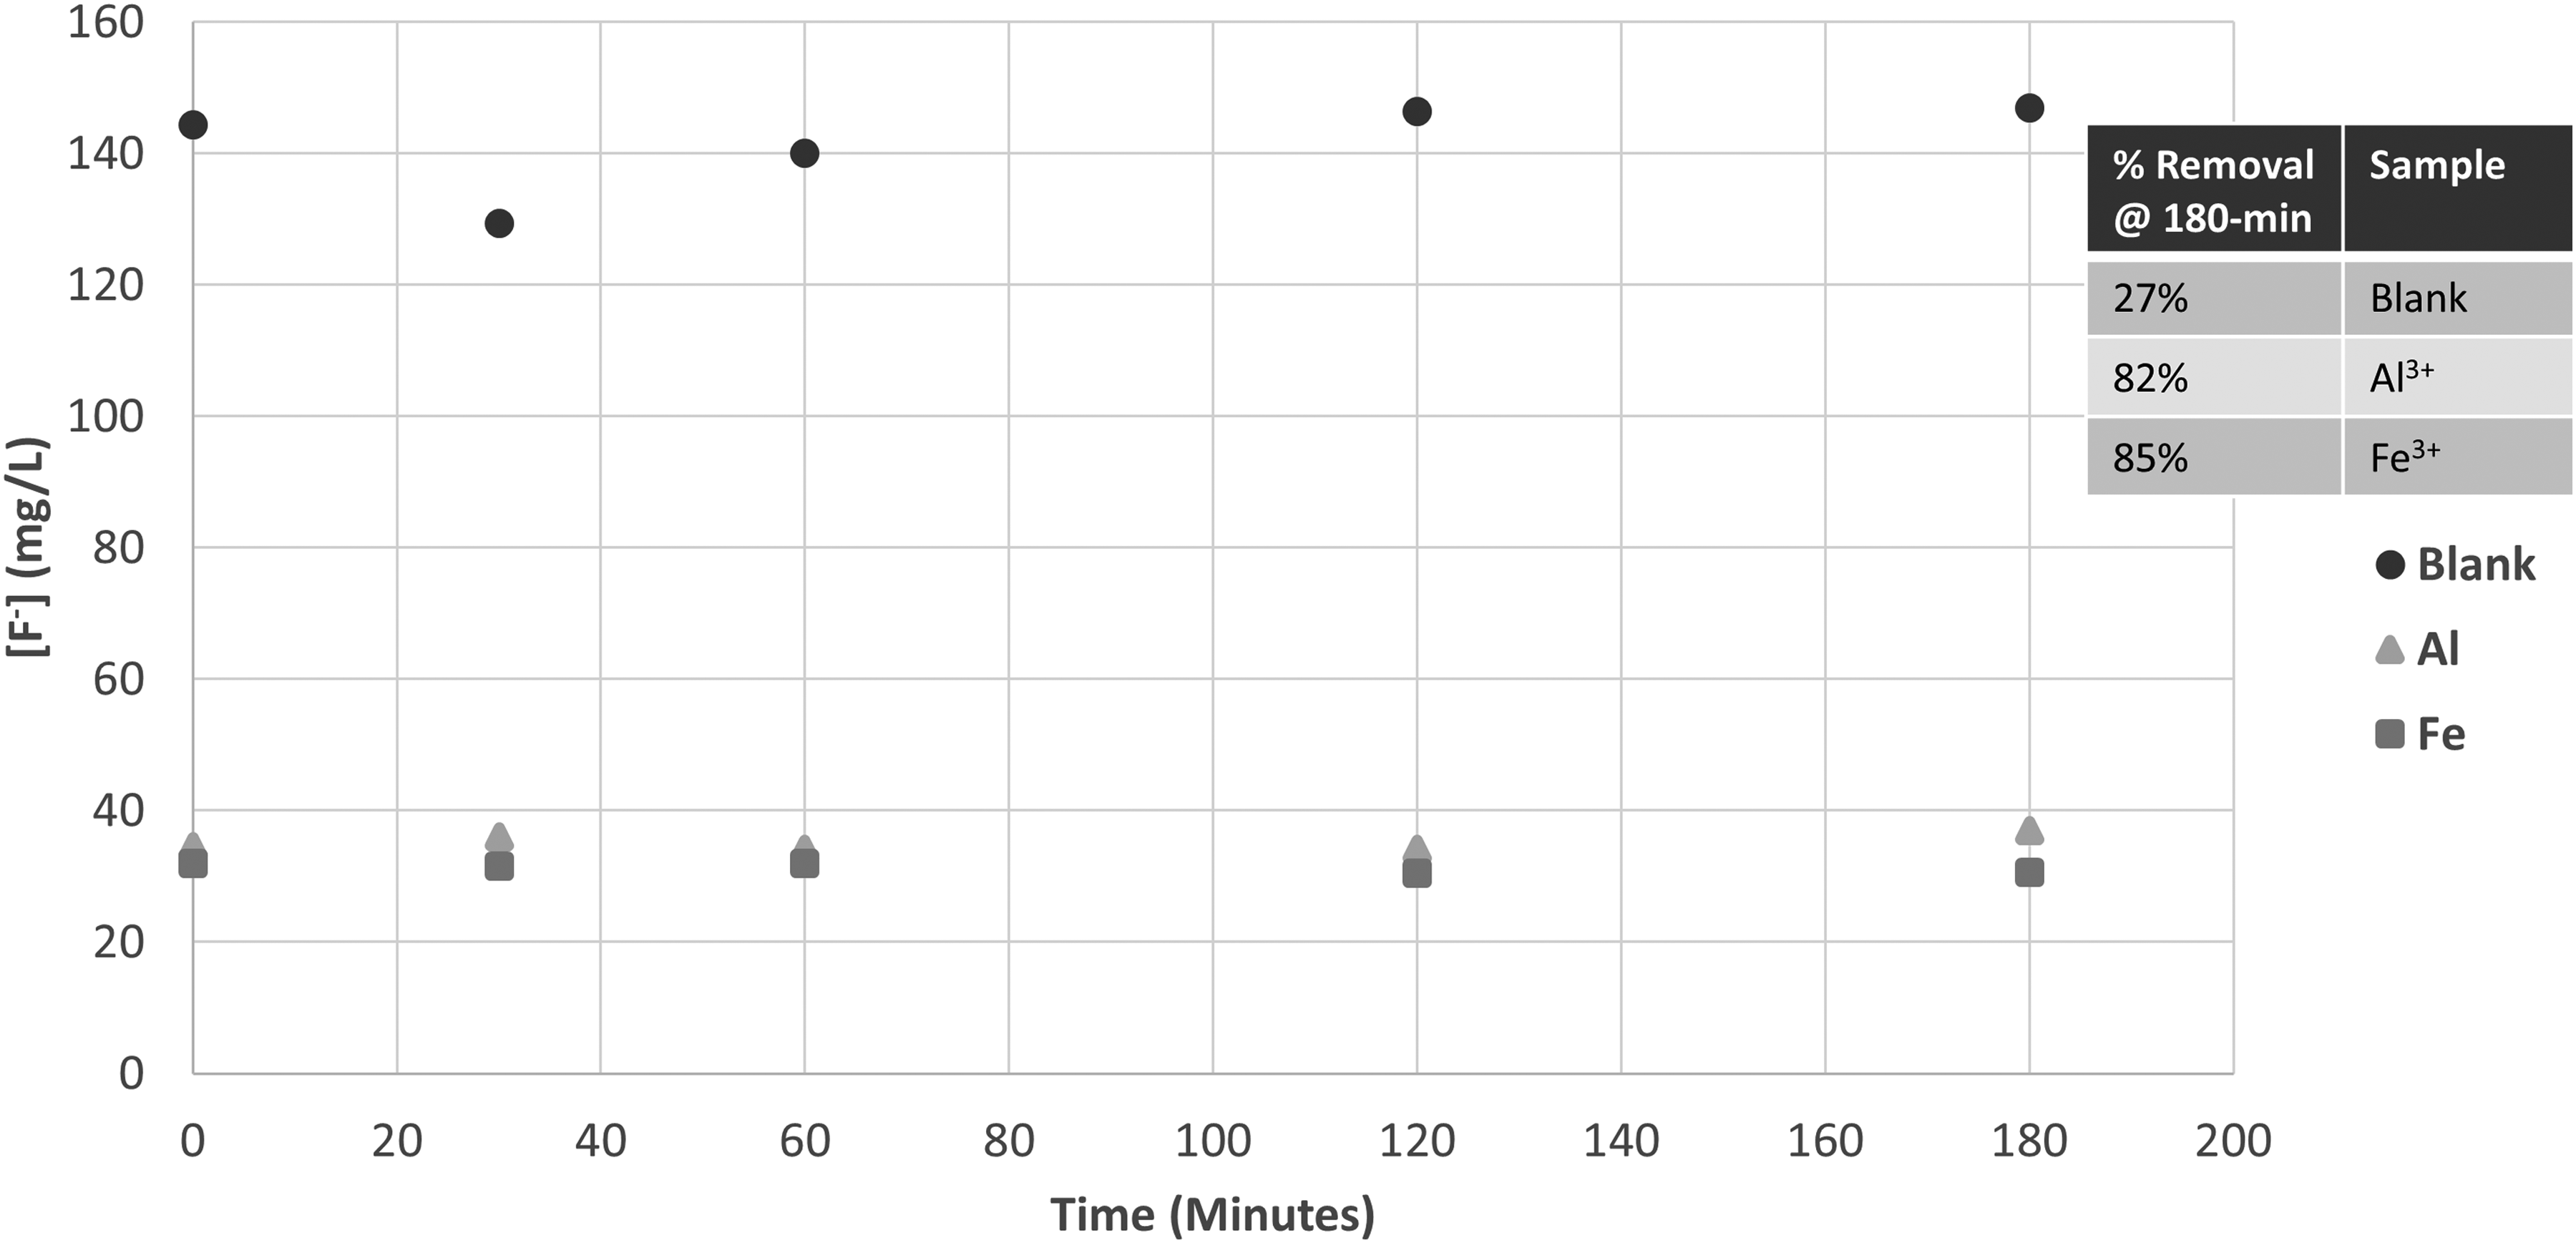
Fluoride analysis 2 days after addition of calcite in solid state
Figure 4 shows that the presence of Al3+ and Fe3+ significantly improved F− removal for samples left for 2 days before analysis. For example, at 180-min mark, 85% F− removal was achieved in the sample containing 200 ppm Fe3+ as compared with 27% F− removal in the blank sample.
Effect of 200 mg/L Al3+ and Fe3+ on removal of 200 mg/L fluoride samples analyzed 2 days after CaCO3 addition.
F− removal was slightly improved compared with the samples containing Fe3+ analyzed immediately after calcite addition (85% vs. 80%, Fig. 2). Figure 5 shows that the pH of the solutions in each case was generally constant throughout the reaction.
pH versus time plot—effect of 200 mg/L Al3+ and Fe3+ on removal of 200 mg/L fluoride samples analyzed 2 days after CaCO3 addition.
Phase II—addition of aqueous calcite
In Phase II, a combined (Al3+ + Fe3+) sample was investigated. As Figs. 6 and 7 show, the F− removal efficiency in the combined (Al3+ + Fe3+) samples was second best after Fe3+ samples.
Effect of 200 mg/L Al3+ and Fe3+ on removal of 200 mg/L fluoride at starting pH = 10. CaCO3 made completely soluble.

Effect of 200 mg/L combined Al3++Fe3+ on removal of 200 mg/L fluoride at different starting pH. pH 10 offers higher removal with soluble CaCO3.
The presence of Fe3+ and Al3+ ions enhanced F− removal when calcite was made completely soluble. As Fig. 7 shows, the combined (Al3+ + Fe3+) samples performed best at pH of 10. Since the recovered fluids will likely contain iron and aluminum ions, the pH should be raised to 10 to obtain the highest removal. In addition, allowing solid calcium carbonate to dissolve completely in the return fluid offers much better F− removal compared with using solid calcium carbonate. The positive saturation index of CaF2 (Table 8) indicates that F− removal is achieved through the formation of CaF2.
Indices—Combined Fe3+ and Al3+ Sample
Tables 8 and 9 present PHREEQC outputs for the combined (Al3+ + Fe3+) samples.
PHREEQC Output—Combined Fe3+ and Al3+ Sample
Conclusion
The PHREEQC geochemical model verified the laboratory study findings regarding the complexes and their role in chemical precipitation of F− compounds in the presence of both Al3+ and Fe3+ ions. As the results show, the F− removal process in the presence of both Al3+ and Fe3+ ions was most efficient at pH of 10. Therefore, a starting pH of 10 in the soluble calcite scenario is recommended. The presence of silicon may complicate our findings and, therefore, needs to be further researched. In addition, the cost-effectiveness of the method presented should be further studied. Owing to the limited amount of information available to the public on the specifics of matrix acidizing operation, very few sources for referencing analytical data on actual return fluid samples were available. California SB4 requires matrix acidizing operators to report analytical results of return fluid sampling. However, there are limitations associated with self-reported information. Therefore, a system that would allow government agencies to access the wells being stimulated or acidized is needed, so that split samples of actual return fluids can be collected and analyzed independently.
Footnotes
Acknowledgments
Our sincere gratitude goes to Eugeniu Carmanov (University of California at Los Angeles undergraduate student), J.P. Liban (summer intern on his way to Duke University), Zhihang Yin, and Violet Chiang (visiting senior undergraduate students from Tsinghua University, Beijing, China) for dedicating their time and effort in helping to complete experiments, making constructive recommendations, and managing the logistics for the project. This study would not have been possible without their contributions.
Author Disclosure Statement
No competing financial interests exist.
Funding Information
No funding was received for this article.