
Abstract
Brazil is one of the major agricultural producers and phosphorus consumers of the world. Phosphorus (P) management in the country has direct impacts in the global cycle of this resource. In this context, this study proposes a Phosphorus Flow Analysis for Brazil, using the Mass Flow Analysis method to create a conceptual model of major P flows and stocks at the country scale, considering the base year of 2013. A total of 10 processes and 46 flows were identified and quantified. Results showed that, for the year of study, Brazil had a P input of 1.7 × 10³ Gg P/year, mainly in the form of P-fertilizers, and a P output of 4.7 × 10² Gg P/year, mainly as grains exports. Agricultural soils were the main stock of P in the country. From the 2.6 × 10³ Gg P/year applied in arable soils, 40% remain in the soil, with other 40% leaving as crop products, and 16% being lost through erosion and runoff to the hydrosphere. P flow in the food actually consumed by the population was 1.8 × 10² Gg P/year, only 8% of total P-fertilizer inputs in agricultural soils. About 6.5 × 10² Gg P/year was lost to the environment. There were no significant flows of P reuse and recycling during the study year. Scarcity scenarios and opportunities for sustainable use of P are discussed, along with the main environmental impacts caused by phosphorus production and consumption in Brazil.
Introduction
The essentiality of phosphorus (P), its physical and economic scarcity, and its role as a potential pollutant in aquatic and marine systems pose a serious challenge for P management around the world (Childers et al., 2011; van Dijk et al., 2016).
Phosphorus is irreplaceable as a major nutrient for agricultural production, and thus of major importance for global food security (Cordell and White, 2011). Currently, the main source of P for soils comes from mined phosphate rocks (Bouwman et al., 2013), which are a finite resource within the human time scale. Concerns about a possible short-term physical P scarcity began to arise mainly after the 2008 price peak of P-rock, which increased 800% in only 2 weeks (World Bank, 2018). Several peak phosphorus assessments estimated that global P demand could surpass the supply in <50 years (Cordell, 2010; Cordell and White, 2015), while others argue that there is no risk of a short-term P scarcity and that a mid-term P scarcity is highly unlikely (Udert, 2018; Scholz and Wellmer, 2019).
Nevertheless, the uneven distribution of global phosphate reserves presents a great risk for economic and geopolitical P scarcity scenarios in the near future. More than half of all known phosphorus reserves are concentrated in Morocco and Western Sahara (Jasinski, 2019), a region with a medium risk of political instability (Scholz and Wellmer, 2013). This could lead to geopolitical tensions and increasing food prices, and create barriers for subsistence farmers to have access to fertilizers.
However, the most pressing problem related with global P management is the environmental pollution caused by anthropogenic P flows, especially those related with the runoff and erosion of agricultural soils and the discharge of domestic wastewater by centralized sanitation systems (Correll, 1998; Daniel et al., 1998; Carpenter, 2008; Steffen et al., 2015; Udert, 2018). Excess P and N are the main causes of eutrophication of rivers, lakes, and coastal waters, which decreases water quality and reduces biodiversity (Correll, 1998; Galli and Abe, 2017). Rockström et al. (2009) and Steffen et al. (2015) established the anthropogenic P flows to the natural P biogeochemical cycle as one of the planetary boundaries defining a sustainable development on the planet, with a limit of 6.2 Tg P/year mined and applied to erodible soils. According to O'Neill et al. (2018), when considering the per capita boundary for P applied (0.9 kg P/year), 80 from 144 countries analyzed were above the limit, including Brazil, with a per capita value of 1.8 kg P/year, two times the limit.
In this context, there is a need to find alternatives to manage P in a more sustainable way, including solutions for P reuse and recycling (Scholz et al., 2014). These solutions can be identified by using tools such as Material Flow Analysis (MFA), which can provide an insight into how resources are used and transformed in the anthroposphere by quantifying its flows, stocks, inputs, and losses in a determined system (Brunner and Helmut, 2011; Graedel and Lifset, 2016). Although it can be applied for the analysis of goods and mixed materials, it is more commonly used for specific resources such as specific metals or elements. In this case, MFA can be termed as Substance Flow Analysis software (STAN) (Bringezu and Moriguchi, 2002), and for the specific case of phosphorus, several MFA studies have used the term Phosphorus Flow Analysis (PFA) (Chowdhury et al., 2014).
Early MFA research began with Robert Ayres, who developed the material balance approach in the early 70’s, which would provide the theoretical base for the MFA methodology. Since then, MFA has been applied in several cases, including the study of urban and industrial metabolism (Ayres, 1989; Baccini and Brunner, 1991), and the identification of elemental flows and balances in different scales, such as metals (Chen and Graedel, 2012), polymers (Kleijn et al., 2000), and nutrients.
PFA studies have been conducted for several spatial and temporal scales, such as for global (Smil, 2000), continental (Ott and Rechberger, 2012; van Dijk et al., 2016), country (Sokka et al., 2004; Gumbo, 2005; Matsubae-Yokoyama et al., 2009; Senthilkumar et al., 2012; Cooper and Carliell-Marquet, 2013; Cordell et al., 2013; Li et al., 2015; Álvarez et al., 2018), and city levels (Kamal et al., 2019), always seeking to identify possible opportunities to improve P management on regional and global scales (Table 1).
Solutions for P Management Identified by Phosphorus Flow Analysis Studies
However, despite Brazil's role in the global phosphorus cycle, there is a lack of studies analyzing P flows in the country. Brazil is one of the major agricultural producers in the world, with exports accounting for 41% of all sugarcane and 29% of all soybean produced in the world [Food and Agriculture Organization of the United Nations (FAO), 2016]. However, since the majority of Brazilian soils is P deficient, to keep up with agriculture demands, the country sustains its production through the intensive application of chemical fertilizers. According to the International Fertilizer Association (IFA), in its report entitled “Assessment of fertilizer use by crop at the global level,” Brazil consumed more than 4.7 million tons of P2O5 in 2014, representing 10.3% of all phosphate-fertilizer consumed in the world in that year. Besides being one of the major consumers of P in the world, Brazil is also highly dependent on fertilizer imports [FAO, 2016; Heffer et al., 2017; Associação Nacional para Difusão de Adubos (ANDA), 2018].
To promote a better understanding of the P-cycle in Brazil, this study seeks to identify and quantify P flows, stocks, and balances within the country, through a PFA.
Materials and Methods
An MFA was used to evaluate P flows and stocks in Brazil. MFA is a quantitative method based on the law of mass conservation (Baccini and Brunner, 1991; Montangero, 2007). The procedure used for this study can be found in Brunner and Helmut (2011), using the following steps: (1) selection of substances; (2) system definition in space and time; (3) identification of relevant flows, stocks, and processes; (4) determination of mass flows, stocks, and concentrations; (5) assessment of total material flows and stocks, and; (6) presentation of results.
System definition
The Brazilian PFA was delimited by Brazil's geographical limits over the period of 1 year. A diagram of the model applied in this study can be seen in Fig. 1. The system contains 10 processes and 46 flows, with a layout similar to other PFA studies such as Cordell et al. (2013) and Senthilkumar et al. (2012). The processes selected are as follows:

MFA system of the Brazilian phosphorus balance: process names and flow numbers. MFA, Material Flow Analysis.
Mining and processing: production, import, and export of commercial P-rock;
Fertilizer industry: production, import, and export of phosphate-fertilizers, phosphoric acid, and intermediary products (monoammonium phosphate—MAP, diammonium phosphate—DAP, single superphosphate—SSP, double superphosphate—DSP, triple superphosphate—TSP, NPK fertilizers, and others);
Nonfood industry: production, import, and export of detergents and other products (chemicals, flame-retardant products, food additives, and others);
Agriculture: crop and animal production systems, including agricultural soils, pastures, and feedlots;
Transportation and storage: export of cereals and oilseeds, transportation of agriculture products for industrial uses, and processing and packaging;
Food industry: processing of crop and animal products, import of processed food products, and packaging for distribution through retail;
Market: retail of food and detergents to the final consumer through the market;
Human consumption: effective consumption of food and detergents by the Brazilian population;
Waste management: collection, treatment, and final disposal of solid waste and sewage generated by the population; and
Losses and wastes: food lost and wasted during processes of agricultural production, transport and storage, processing and packaging, distribution, and consumption.
The process Agriculture (Fig. 2) is a subsystem that contains two processes (Agricultural soil and Animal production), similar to that proposed by Ott and Rechberger (2012). The identification of flows and their description can be found in Table 2.
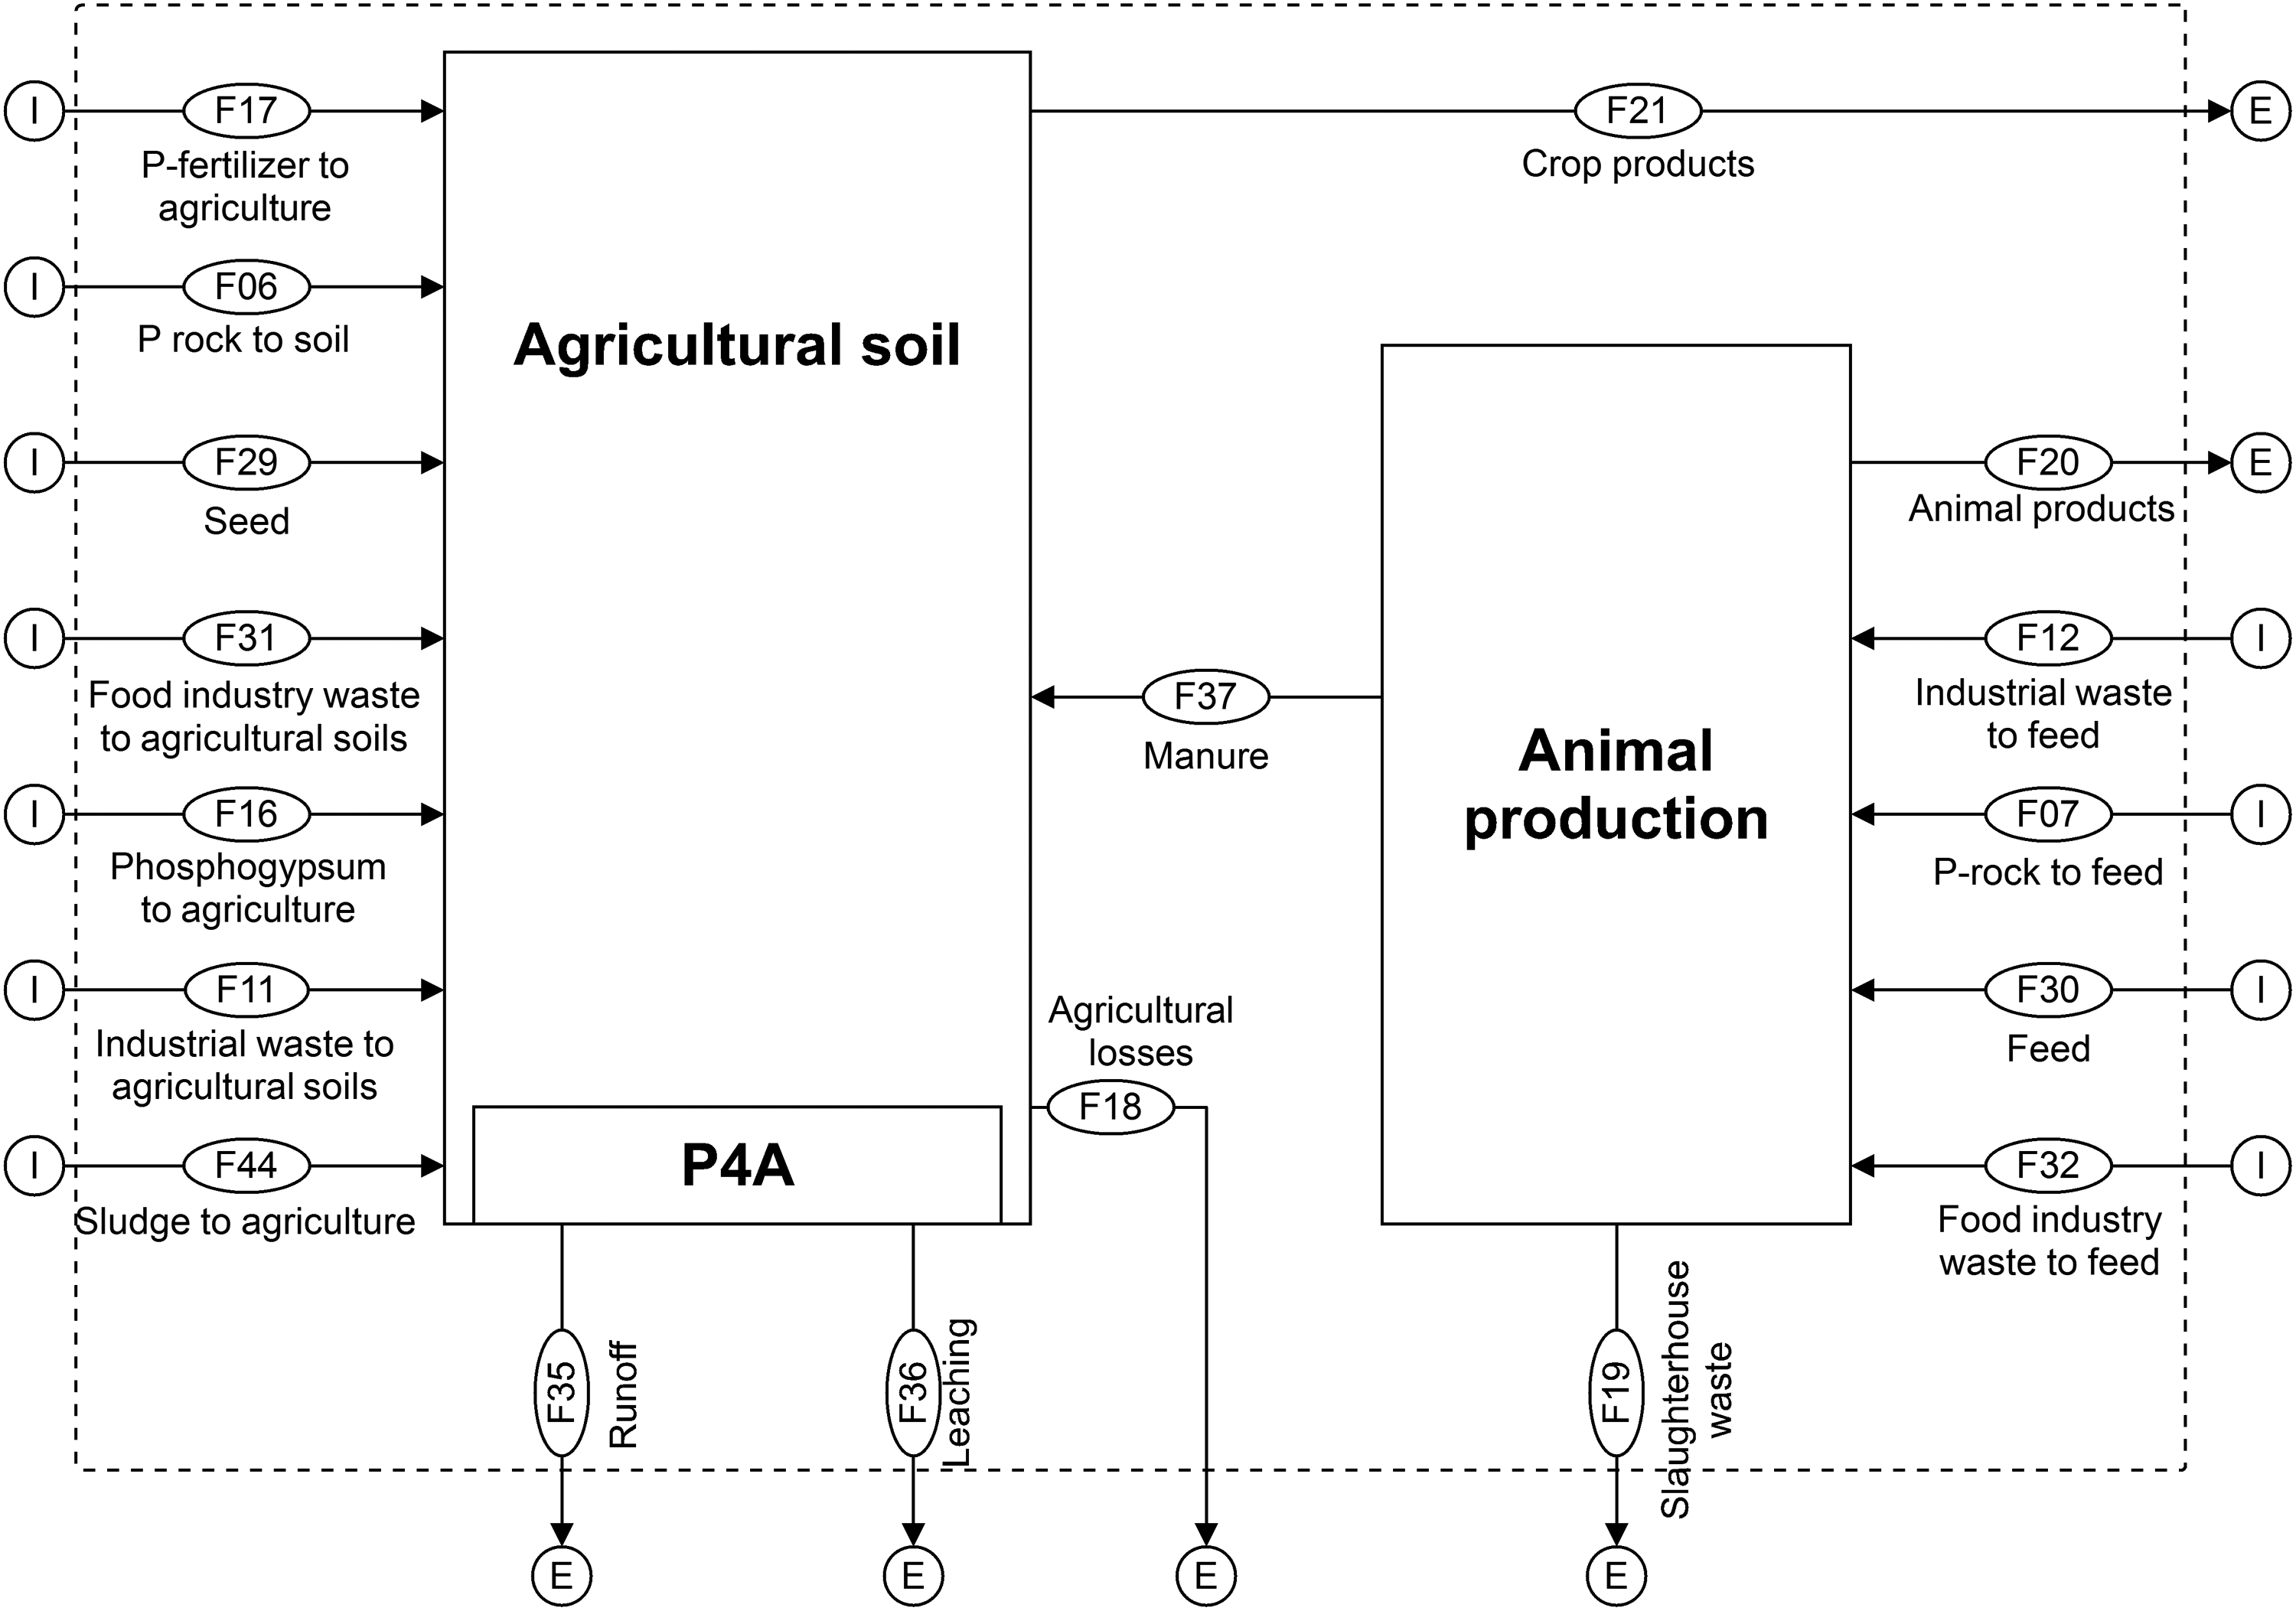
MFA system of the subsystem agriculture: process names and flow numbers.
Description of the P Flows Identified in This Study
ROM, Run of Mine; WTP, Wastewater Treatment Plant.
MFA studies, especially for large spatial scales, present a high level of complexity that is usually handled with the help of different mathematical and statistical tools. In this study, the subSTance flow ANalysis (STAN) software was used to develop the model. STAN code provides a visualization of complex MFA systems, includes the possibility to consider data uncertainties, and its calculation algorithm offers mathematical statistical tools such as data reconciliation and error propagation.
Data source
P flows and stocks were quantified by multiplying the material flows with their respective P content. All fluxes were calculated as elemental P, so even data expressed as P2O5 were converted to P by using a conversion factor of 0.44. Several data sources were used, including databases (FAOSTAT and IFASTAT), Brazilian official data (National Department of Mineral Production [DNPM]), reports from industry associations [Brazilian Association of Cleaning Products and Related Industries (ABIPLA), 2014; Brazilian Association of Public Cleaning and Special Waste Companies (ABRELPE), 2013], and scientific articles with local data. In case of stocks and flows with no local data available, quantities were estimated using mass balances and data from the nearest geographical location.
The analysis considered the base year of 2013, given it was the most recent year with a complete dataset available, especially for data related with food production and consumption, which was taken from the Food and Agriculture Organization of the United Nations (FAO) Balance Food Sheets (FAO, 2013).
Uncertainty characterization
Given that data used to quantify physical flows and stocks come from different sources and may vary in quality, MFA studies are naturally confronted with data limitations and uncertainties, and ignoring these aspects can compromise the reliability of MFA results (Laner et al., 2014; Rechberger et al., 2014). According to Laner et al. (2014), approaches for handling uncertainties in MFA can be divided as follows: (1) qualitative and semiquantitative approaches, used to express confidence in the MFA results without formal characterization of input data; (2) data classification approaches, which focus on the evaluation of input data quality; and (3) statistical approaches, which include both evaluation of data quality and rigorous mathematical procedures to propagate uncertainties in the model.
Data uncertainties in the Brazilian PFA were characterized using a novel approach developed by Laner et al. (2016). The method consists of data quality assessment as a basis for estimating the uncertainty of input data, based on the work of Weidema and Wesnæs (1996) and Hedbrant and Sörme (2001).
First, data quality is evaluated using a pedigree matrix with respect to reliability, completeness, temporal and geographical correlation, and other correlations using indicator scores (Weidema and Wesnæs, 1996). For a detailed description of the indicators used in this study, please refer to Laner et al. (2016). Each indicator receives a score from 1 to 4, where score 1 represents the best level and score 4, the worst. This method has been used in other MFA studies for data quality assessment, although with minor differences depending on the application (Hoekman and von Blottnitz, 2017; Schiller et al., 2017).
After this step, indicator scores are translated into coefficients of variation (CVs) through continuous exponential-type functions, based on the method proposed by Hedbrant and Sörme (2001). Parameters used to describe the functions can be seen in Supplementary Appendix S1, and CVs derived from indicator scores can be seen in Table 3.
Coefficients of Variation (%) for Quality Indicators, According to Score and Sensitivity Level
CV, coefficient of variation.
After determining the CVs for each indicator, the overall uncertainty estimate can be calculated using Equation (1).
where CVrel is the coefficient of variation derived from the indicator reliability; CVcomp is the coefficient of variation derived from the indicator completeness; CVg.corr. is the coefficient of variation derived from the indicator geographical correlation; CVt.corr. is the coefficient of variation derived from the indicator temporal correlation; and CVoth.corr. is the coefficient of variation derived from the indicator other correlation, all expressed in percentage.
The CVs adopted in this study, both for data concerning material flow rates and P concentration in materials, can be seen in Supplementary Table S1 (Supplementary Appendix S1).
This approach has been used in other recent MFA studies (Klinglmair et al., 2016; Zoboli et al., 2016), and although subjectivity is inherent in uncertainty assessment in MFA, the proposed approach allows data description based on different indicators, follows a procedure to ensure its consistency within the model, and provides a comprehensive documentation of the choices underlying the uncertainty analysis. Moreover, it is based on CVs, making the results directly utilizable for the software STAN (Laner et al., 2016; Zoboli et al., 2016).
Results and Discussion
Figures 3 and 4 show the results for the Brazilian PFA for the base year of 2013. Flows are showed as Sankey diagram. Stocks are expressed as Gg and flows as Gg/year of P. Values were reconciled by using mathematical statistical tools within STAN's code. Detailed information on data sources, equations used, and reconciled values of each flow along with their uncertainties can be seen in Supplementary Table S2 (Supplementary Appendix S1).
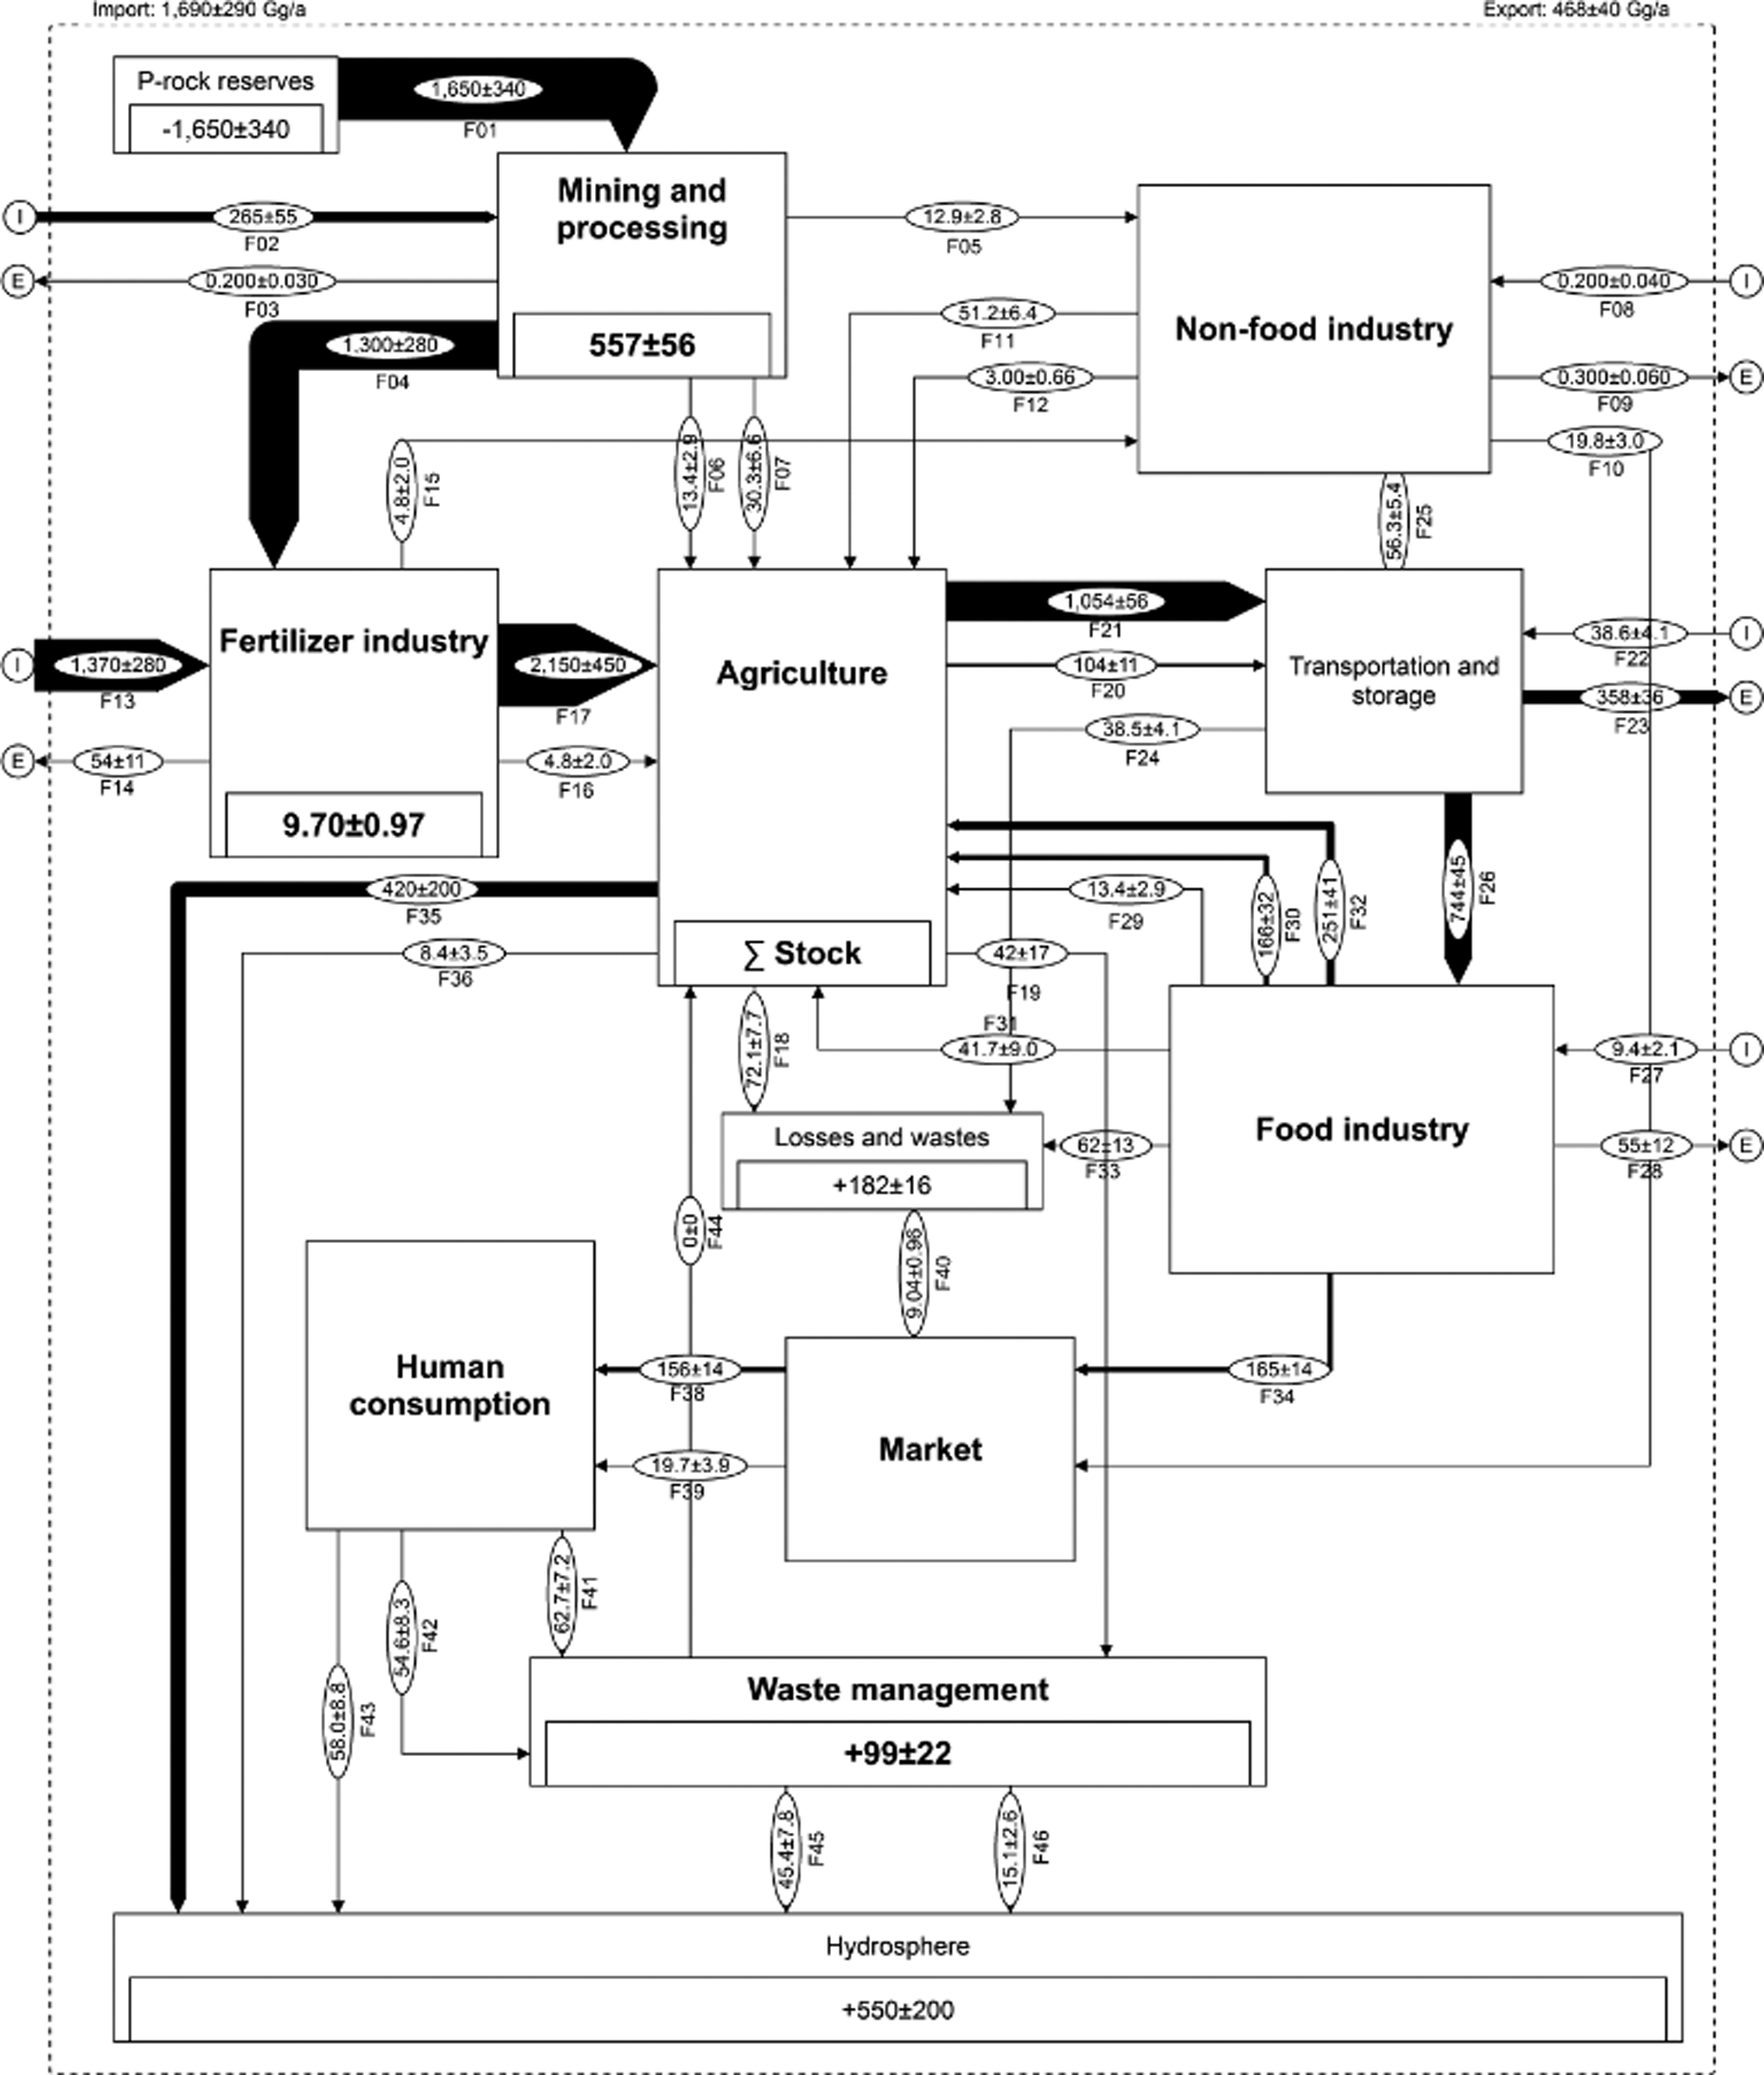
MFA system of the Brazilian phosphorus balance, flows in Gg P/year, base year 2013.

MFA system of the subsystem agriculture, flows in Gg P/year, base year 2013.
P flows and stocks
Brazil imported 1.7 × 10³ (±0.33 × 10³) Gg P/year in the form of P-fertilizers (81.4%), commercial grade P-rock (15.7%), grains (2.3%), processed food (0.6%), and nonfood products (∼0.01%). Exports accounted for 4.7 × 10² (±0.4 × 10²) Gg P/year, divided between flows of cereals and oilseeds (76.6%), P-fertilizers (11.6%), processed food (11.7%), commercial P-rock (0.04%), and nonfood products (0.06%). Overall, Brazil had a positive balance, with a P surplus of 1.2 × 10³ (±0.25 × 10³) Gg P.
Mining and processing provided 1.4 × 10³ (±0.29 × 10³) Gg P/year in the form of commercial grade P-rock (containing 35% of P2O5). P-rock processing generated a stock of 5.6 × 10² (±0.6 × 10²) Gg P as tailings. The fertilizer industry consumed 95.8% of the P-rock produced nationally [Department of Mineral Production (DNPM), 2010]; nonetheless, Brazil imported 1.4 × 10³ (±0.28 × 10³) Gg P/year as P-fertilizers, which represents around 60% of the total fertilizer demand in 2013.
The fertilizer production sector had a stock of 9.7 (±1) Gg P, mainly from phosphogypsum, a residue of phosphoric acid production. According to literature, for each ton of phosphoric acid as P2O5, 5 tons of phosphogypsum are produced as residue, with a total estimated production of 5.9 million tons in 2013 (Dias and Lajolo, 2010; Silva and Giulietti, 2010). With 0.7% of P2O5 in its composition, more than 50% of the phosphogypsum produced in Brazil is reused for liming of agricultural soils and cement production, with the remaining being disposed in stockpiles (Silva and Giulietti, 2010).
Agricultural soils in Brazil received a total of 2.6 × 10³ (±0.52 × 10³) Gg P/year, derived from the application of P-fertilizers (83.4%), animal manure from the animal production process (11.8%), industrial waste (2.0%), soil corrective (0.5%), seed (0.5%), and phosphogypsum (0.2%). Soil P outputs accounted for 1.6 × 10³ (±0.27 × 10³) Gg P/year, from crop production (67.7%), erosion and runoff (27.2%), agricultural production losses (5%), and leaching (0.5%). Agricultural soils had a stock of 1.0 × 10³ (±0.49 × 10³) Gg P in 2013, or 12 kg/ha, representing the largest stock of P in Brazil.
P leaving the soils as crop products represented only 40% of total soil P inputs, which is one of the lowest values for agricultural efficiency when compared with PFA studies for other countries (Fig. 5). The low efficiency of P application in agricultural soils—also noted by other nutrient-balance studies conducted in Brazil (da Cunha et al., 2014, 2018)—could be explained by two reasons. First, Brazilian soils have a high phosphorus-binding capacity with soluble aluminum (Al) and iron (Fe) ions due to natural acidity conditions (pH <6) (Lopes and Guimarães Guilherme, 2016; Roy et al., 2016). Second, the expansion of cropland to areas with low P availability, especially the Brazilian Cerrado, requires large P applications to achieve a satisfactory production (Lopes et al., 2016).
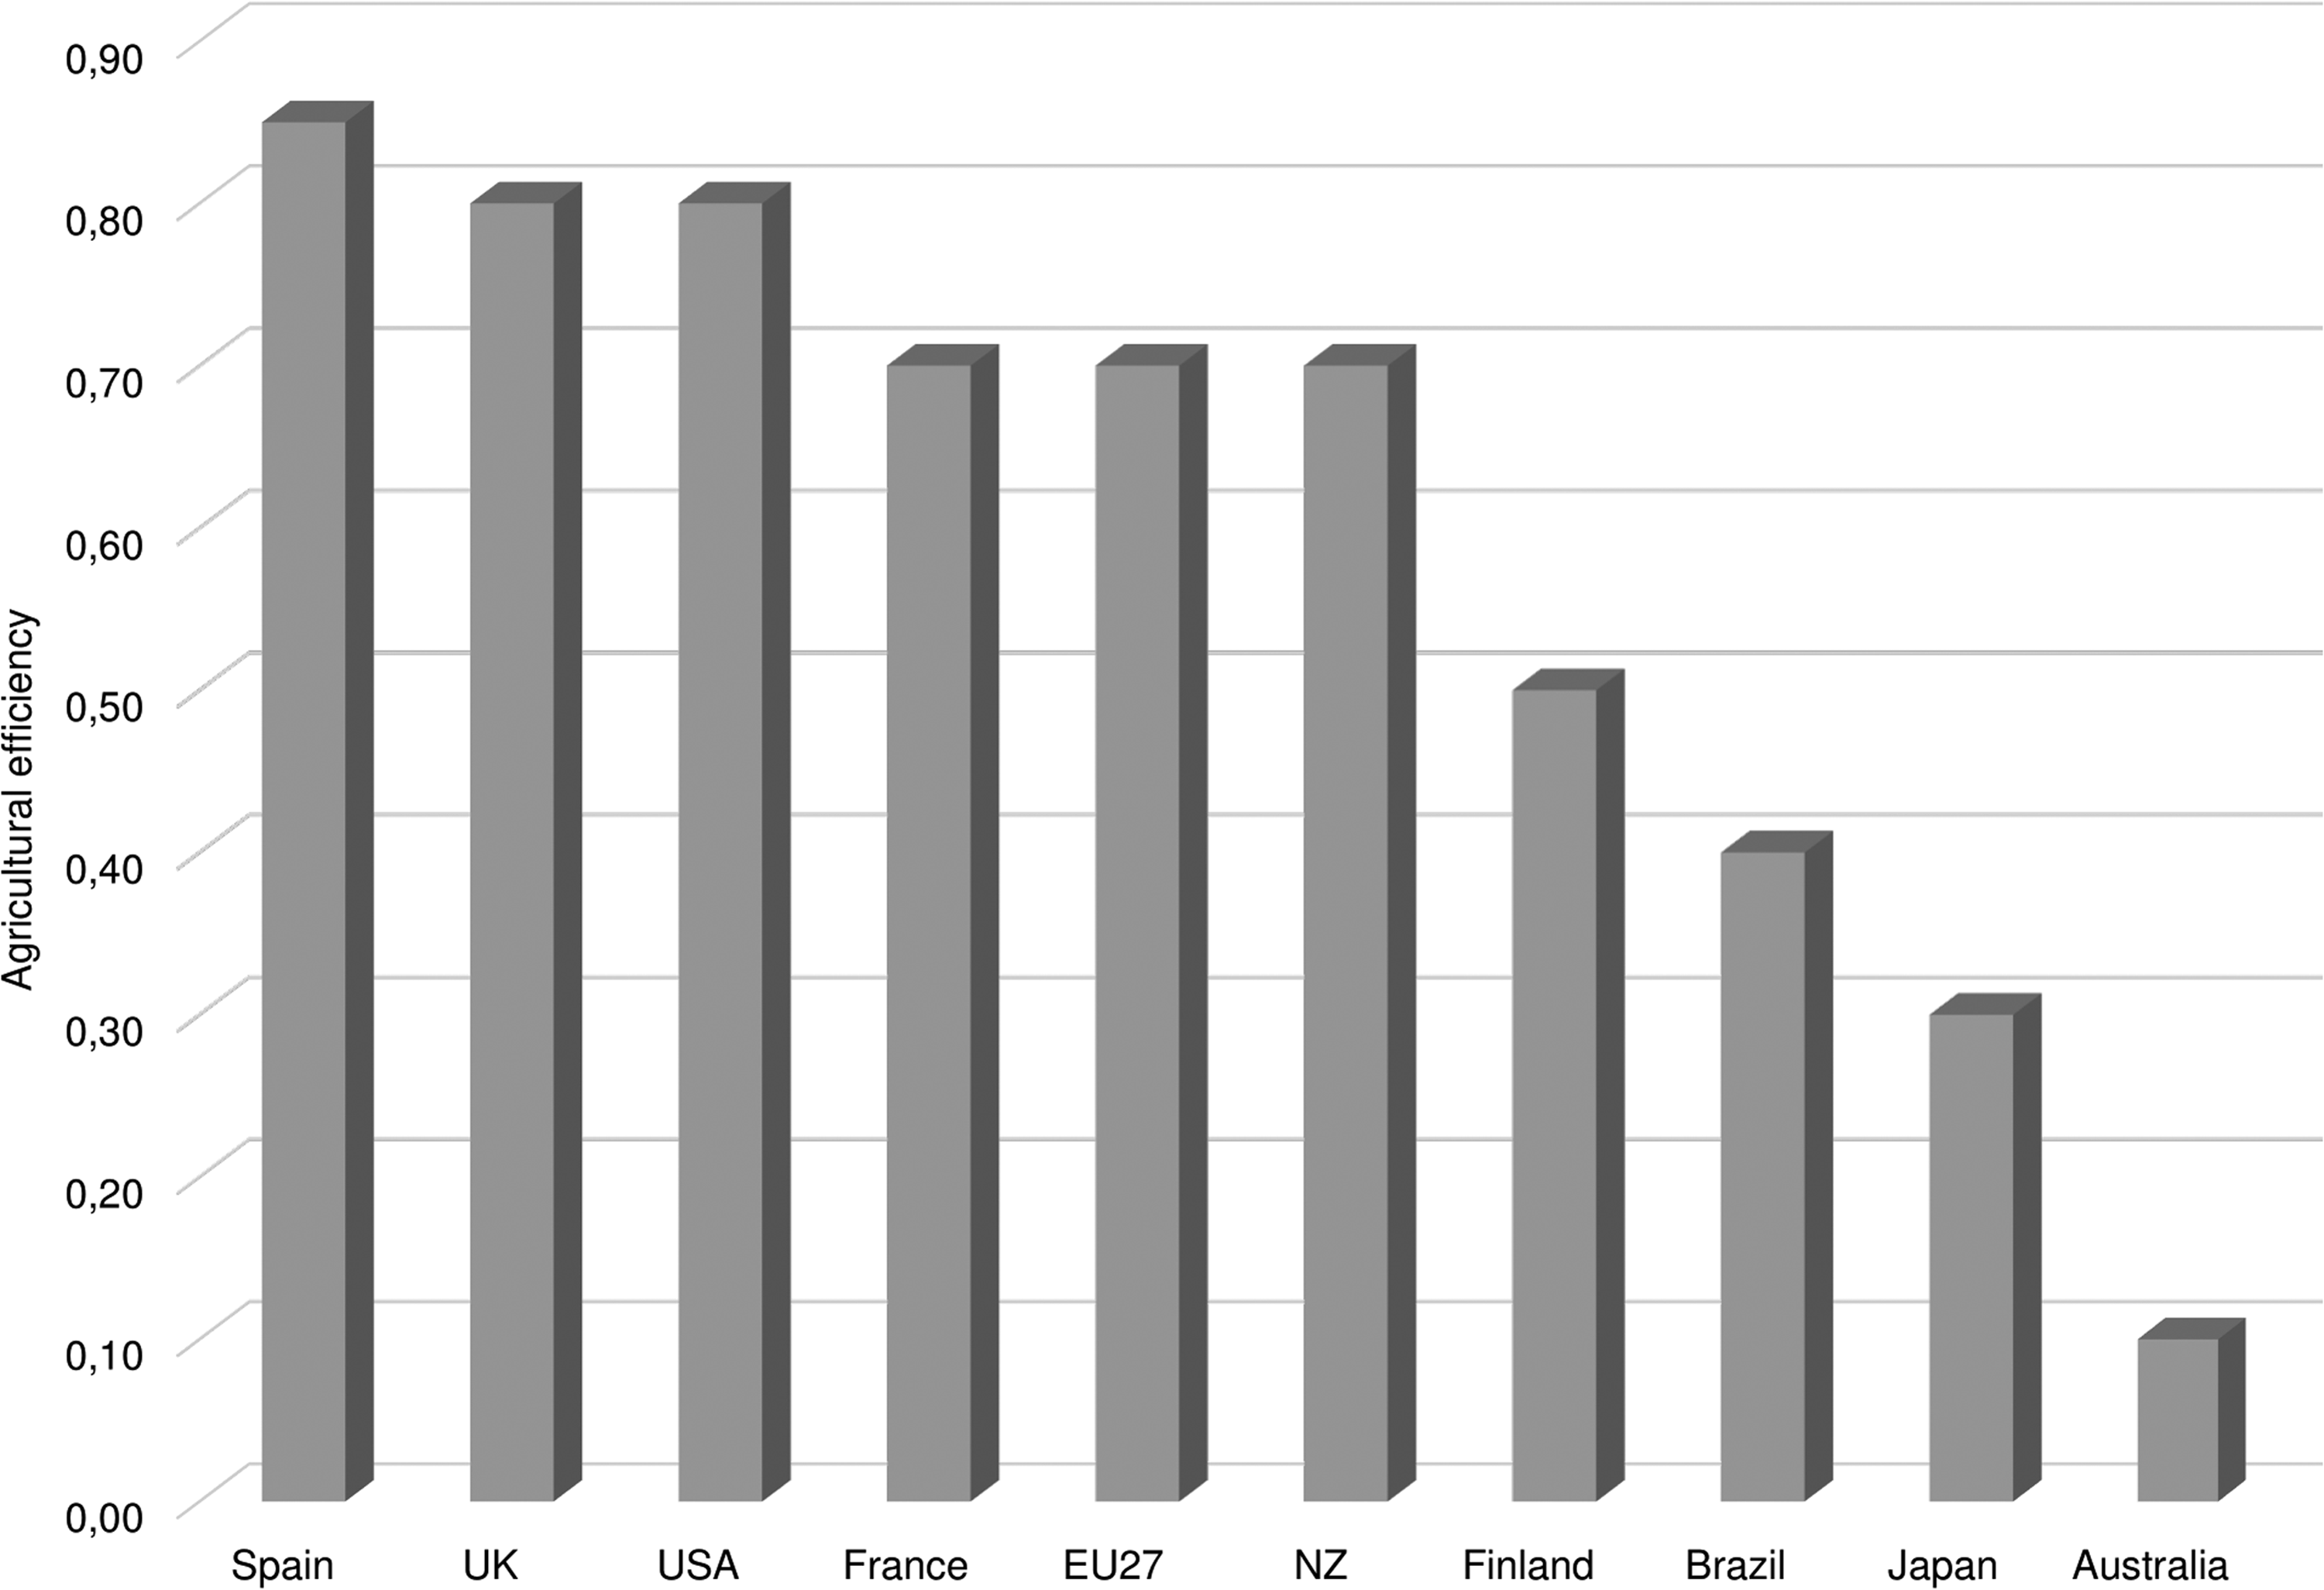
Comparison of P use efficiency in agriculture between different countries. Source: Antikainen et al. (2005); Matsubae-Yokoyama et al. (2009); Cordell and White (2010); Suh and Yee (2011); Ott and Rechberger (2012); Senthilkumar et al. (2012); Cooper and Carliell-Marquet (2013); Li et al. (2015); Álvarez et al. (2018).
Soybean is one of the main drivers for this cropland expansion, having the largest cultivation area in the country (41.8% of total cropland area) (da Cunha et al., 2018). In 2014, more than half of the phosphate-fertilizer consumption in Brazil (56.7%) was destined for soybean crops alone (Heffer et al., 2017), with 52% of the soybean crop production being destined to the foreign market (FAO, 2013).
The total of crop and animal products leaving the agricultural sector was 1.2 × 10³ (±0.06 × 10³) Gg P/year, which is summed with the grain imports (39 ± 4 Gg P/year) in the transportation and storage process. The total of agriculture products from the transportation and storage process was mainly destined for the food industry (62%), with the remainder going to grain exports (30%), nonfood industrial uses (4.7%), and losses (3.3%). Export of cereal and oilseed was the major P flow out of Brazil, representing 34% of all crop produced in the country.
The Brazilian population consumed a total of 1.8 × 10² (± 0.2 × 10²) Gg P/year as food (89%) and nonfood products (11%), releasing this flow as wastewater (64%) and organic solid waste (36%). The P flow in the food actually consumed by the population was only 8% of total P-fertilizer inputs in agricultural soils.
A total of 6.5 × 10² (±2.2 × 10²) Gg P/year was lost to the environment, 85% of which was discharged to the hydrosphere and 15% was landfilled. Total food wastes and losses along the food chain resulted in a flow of 1.8 × 10² (±0.2 × 10²) Gg P/year. This corresponds to ∼16% of all agricultural production, having the same order of magnitude as the food actually consumed by Brazilian population (1.6 × 10² Gg P/year). Agricultural production represents the major source of wastes and losses (40%) followed by food industry (34%), transport and storage (21%), and, finally, distribution (5%). This demonstrates the need for measures for better management of P mainly in the stages of food harvesting, processing, and transportation.
Scarcity and sustainable use of P in Brazil
According to the more recent official data in Brazil, P-rock reserves in the country are estimated to be around 315 Tg of P2O5 (DNPM, 2017). Applying the Hubbert's curve to predict future production of P-rock in Brazil, an approach that has been used for phosphorus in a number of studies (Cordell et al., 2009; Walan, 2013; Cordell and White, 2015), shows that present reserves would reach a peak in production by 2021 (Fig. 6). However, this estimate should be understood as an early warning to improve resource management, and not as a prediction of P physical scarcity, since reserves are dynamic and will be continuously reassessed according to mining companies' business plans and market commodity prices (Udert, 2018; Scholz and Wellmer, 2019).
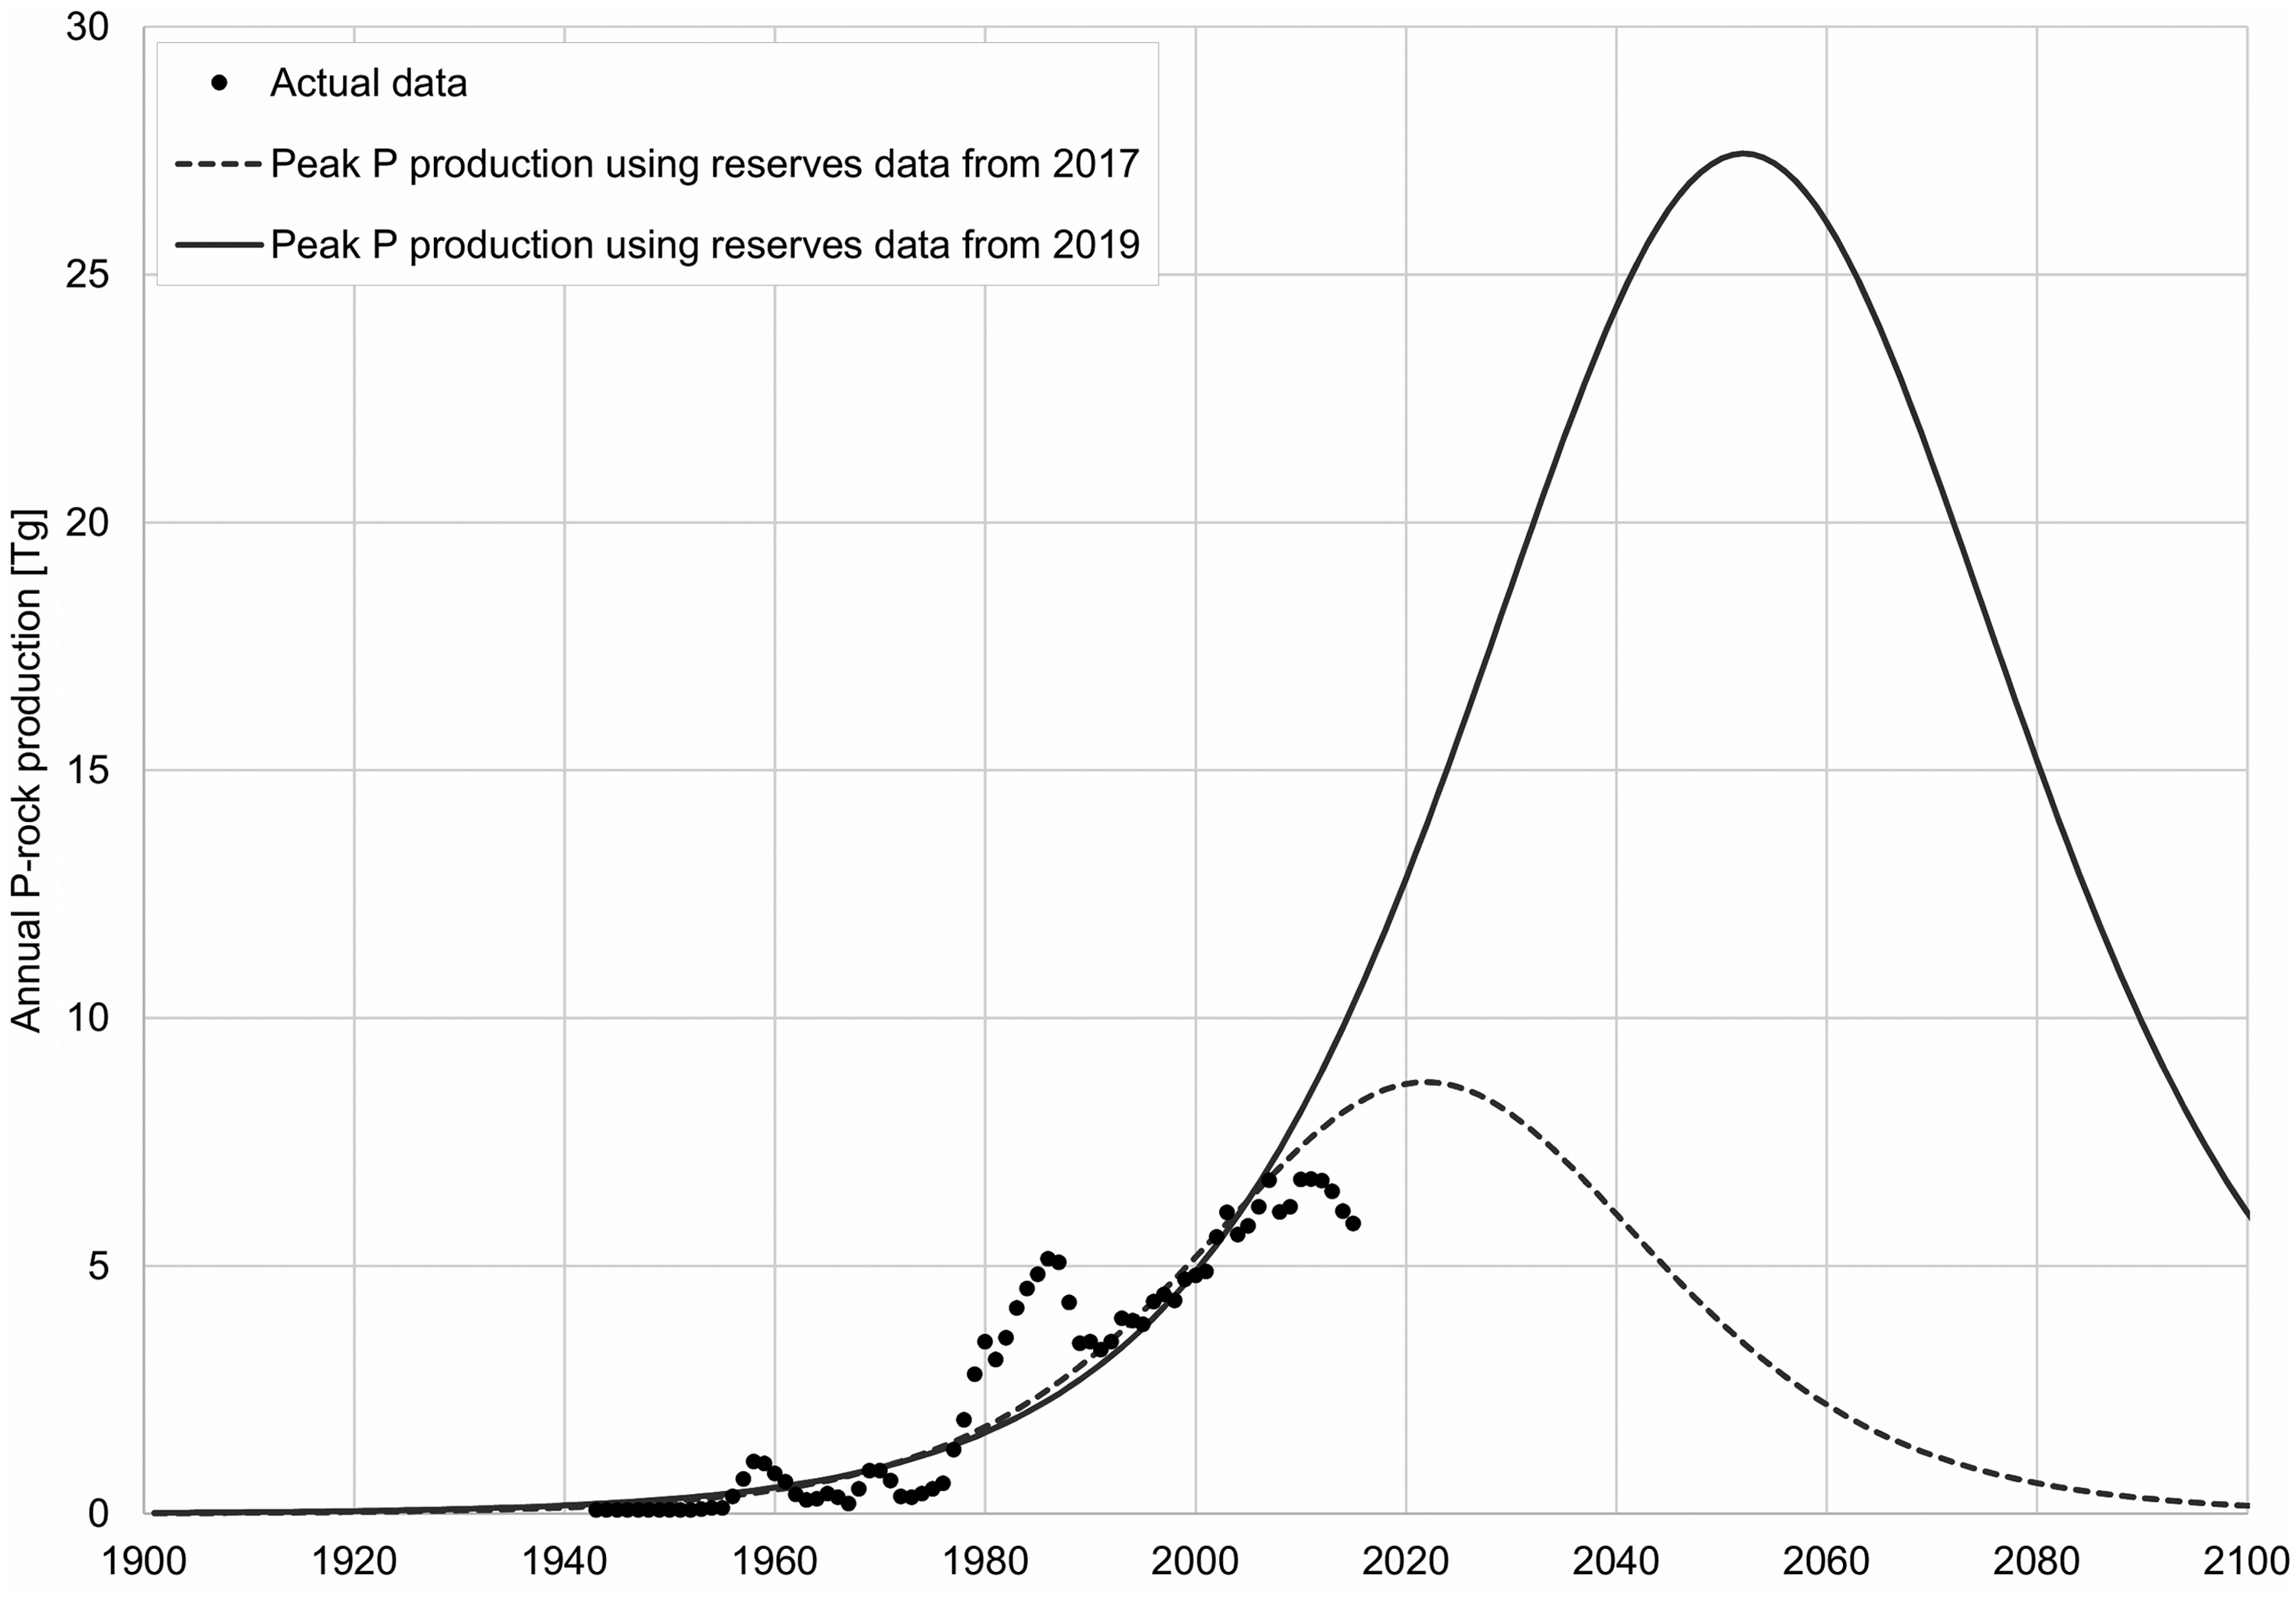
Peak phosphorus curves for Brazil using data on reserves from the Department of Mineral Production (DNPM, 2017) and the U.S. Geological Survey (Jasinsky, 2019).
In fact, recent data published by the US Geological Survey revealed a considerable leap in Brazil's P-rock reserves—from 315 to 1,700 Tg (Jasinski, 2019), similar to what has occurred in Morocco in 2010, when P-rock reserves leapt from 5,700 to 51,000 Tg. Considering the new data on Brazilian reserves, phosphorus peak production would likely occur in 2051 (Fig. 6).
Another factor to be considered is that national P-rock production is limited by the fertilizer demand, which is mainly supplied by imports. In 2014, Brazil consumed about 4.7 million tons of P2O5 (or 2,068 Gg of P), which accounted for 10.3% of all phosphate-fertilizer consumed in the world for that year (Heffer et al., 2017). Imported fertilizers represented more than 60% of this consumption (ANDA, 2018).
Addressing this issue, in 2014, the DNPM stated that, although Brazil had resources to increase phosphate production, there was an economical preference toward imports due to bottlenecks in the national fertilizer production chain, such as the need to import sulfur for phosphoric acid production (DNPM, 2014). In addition, Brazilian reserves occur in lower grade carbonate igneous rocks, with a content range of 5–14% of P2O5 and a low degree of uniformity, increasing the costs of mining and the quantity of mining waste when compared to phosphate from sedimentary rocks, with a content of 25–34% of P2O5, currently imported from countries such as Morocco and Western Sahara (van Kauwenbergh, 2010).
However, the high dependence on fertilizer imports may not pay off, even in the short term, considering the high price volatility of phosphate rock in a possible scenario of geopolitical and economic instability, as an example of what occurred in 2008 when a global economic crisis caused a price peak of more than 800% (Fig. 7). Given the distribution of world reserves, it is likely that in the near future, P-rock prices will be influenced by oligopolistic tendencies, concentrating market power in the Middle Eastern and North African countries, responsible for 80% of total global exports (De Ridder et al., 2012; De Boer et al., 2019). Besides this, countries are likely to implement protectionist measures to protect their own P reserves, which can subsequently increase global prices, as it was the case of China, which increased the export tariffs on phosphate fertilizers in such a way that trade became inviable (De Ridder et al., 2012).
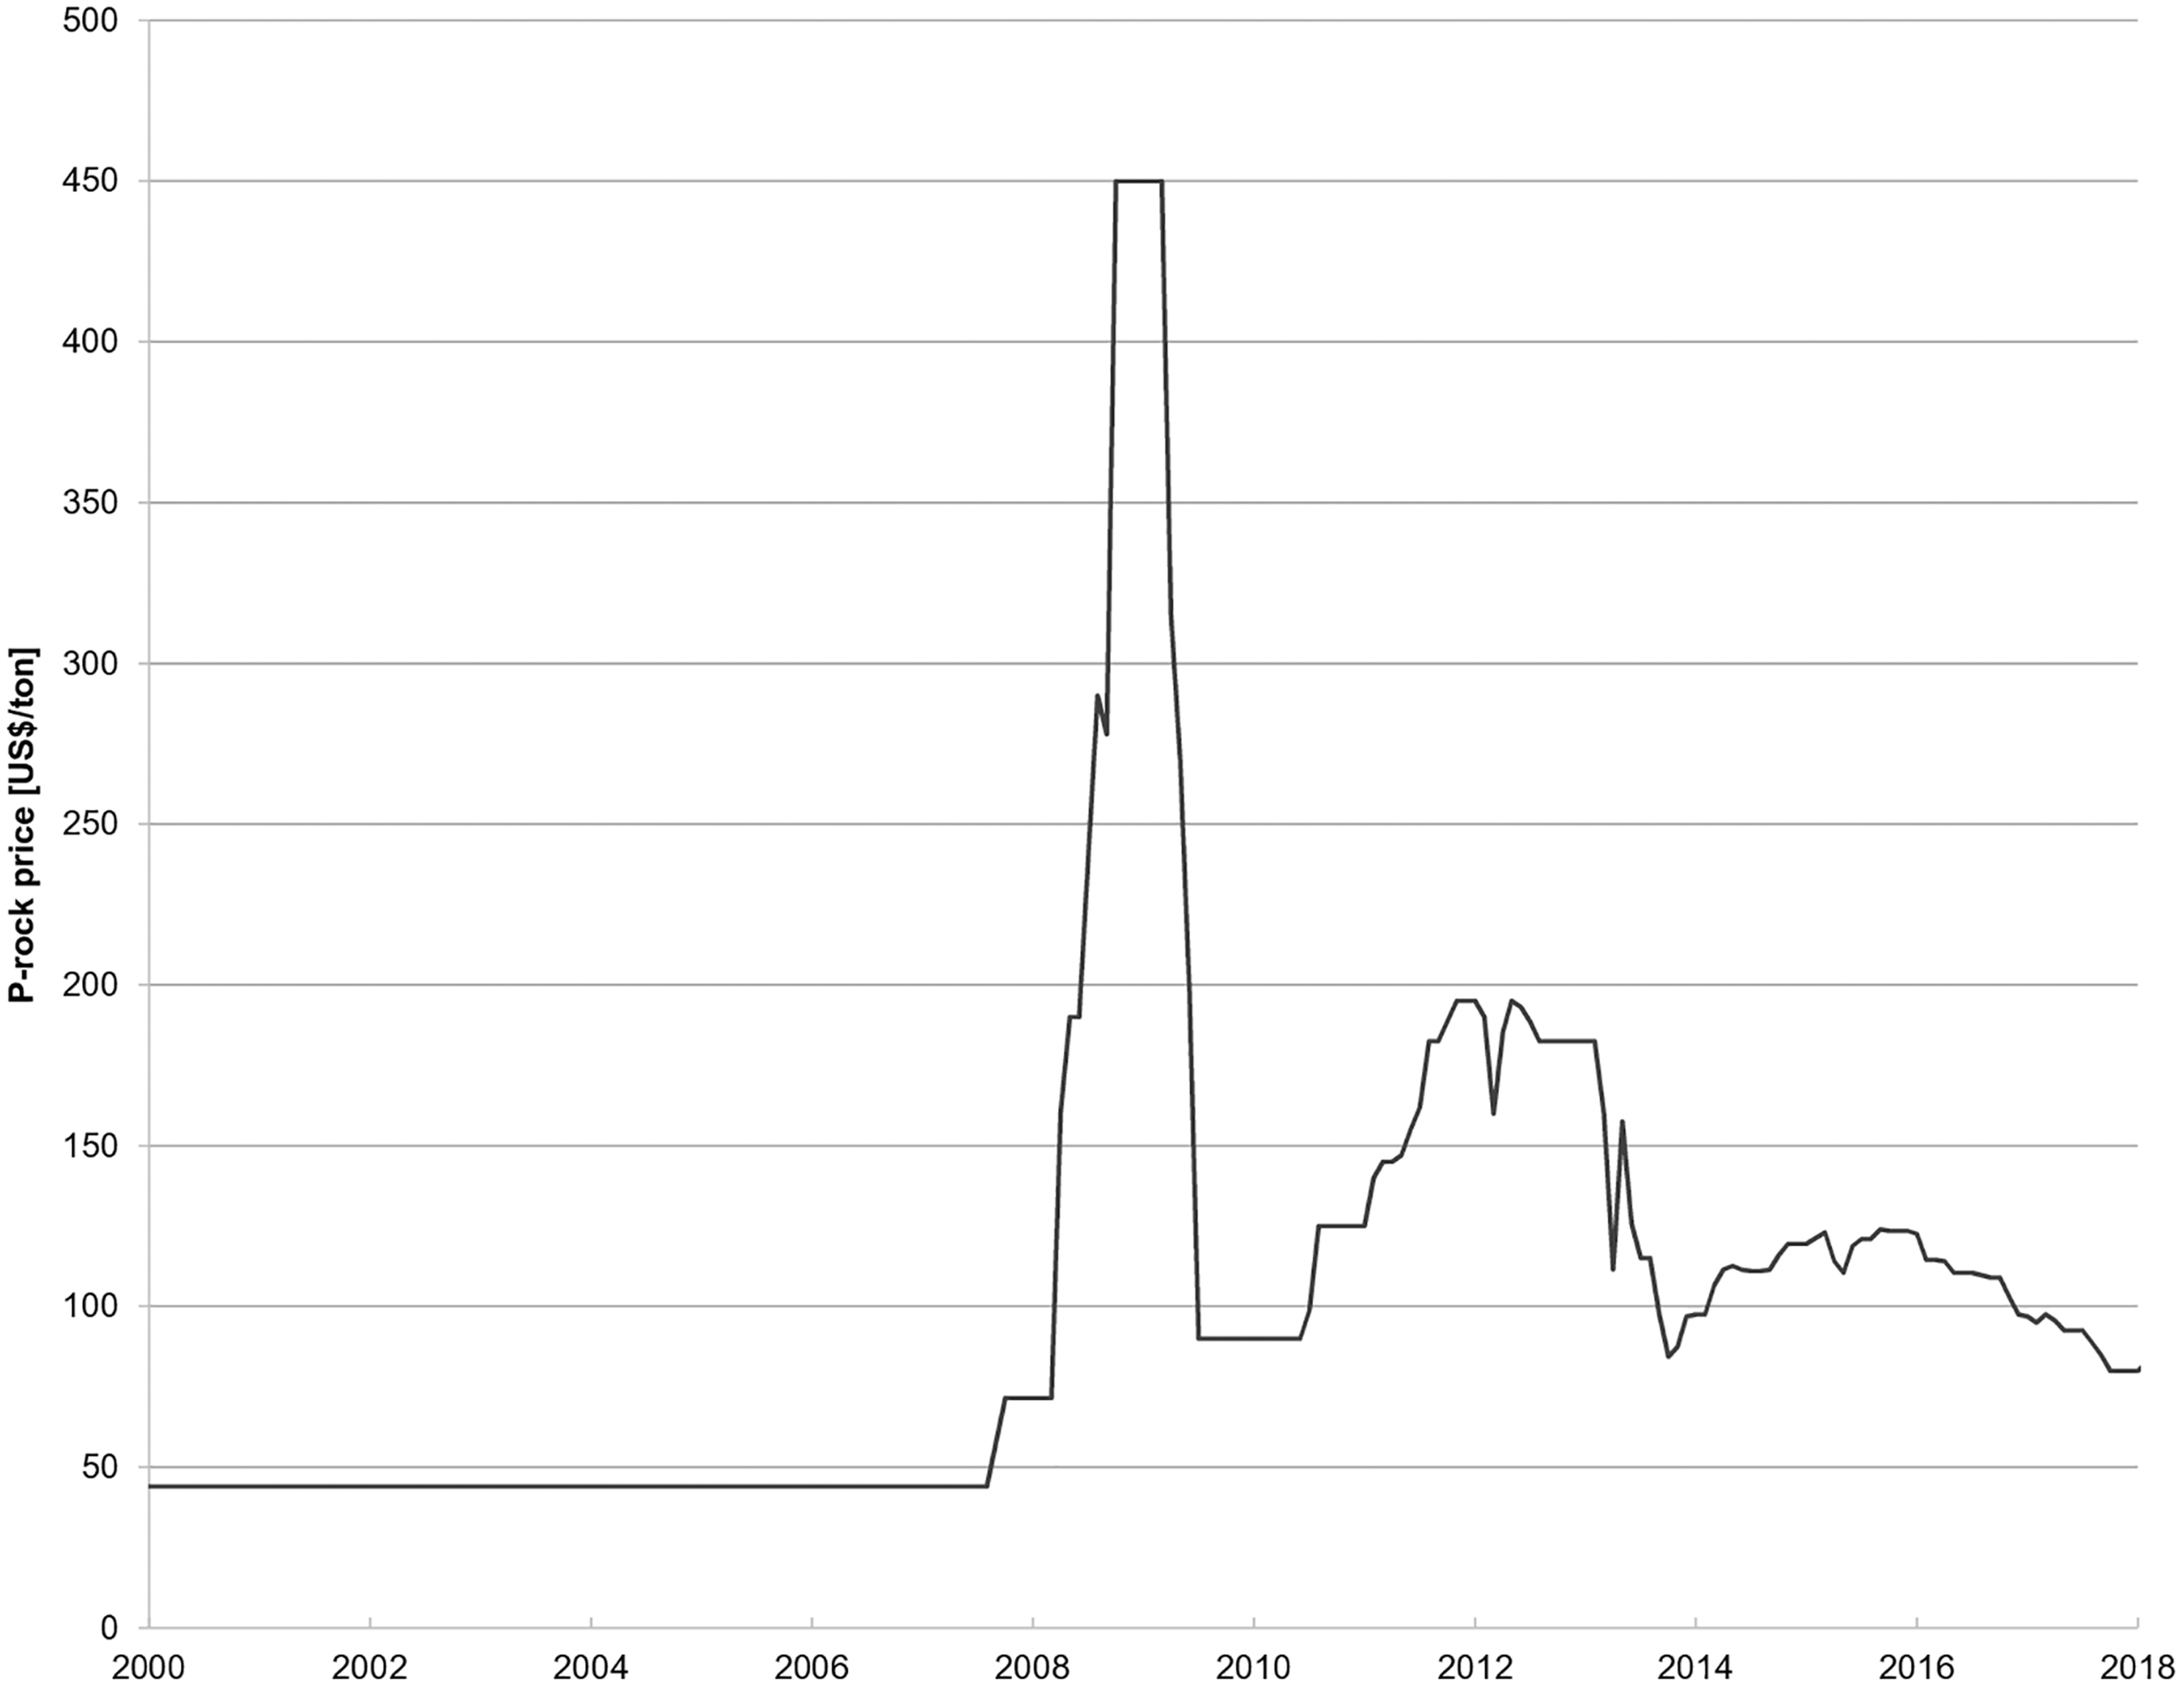
P-rock commodity price variation. Source: World Bank (2018).
Moreover, igneous Brazilian P-rock deposits, even though are mostly low in grade, have both low levels of radioactivity and hazardous metal content when compared to the sedimentary deposits of Morocco, its main fertilizer supplier (da Conceição and Bonotto, 2006; Mello et al., 2018; De Boer et al., 2019). Reuse and recycling solutions could foster increasing diversity among phosphorus producers and reduce supply risk caused by geopolitical tensions (Scholz et al., 2014).
Legacy P fixed in agricultural soils is one of the alternative sources of P with greater potential to compete with imported fertilizers (Withers et al., 2018). According to the literature, legacy P from fertilizer and manure application in the last 50 years could be estimated around 20–28 Tg P (da Cunha et al., 2011; Roy et al., 2016; Withers et al., 2018). The major barrier to its use is whether it could be mobilized to provide for crop demand (Withers et al., 2018). On that matter, there are technologies being developed nationally to improve the availability of P fixed in soils by using phosphate-solubilizing microorganisms (Gomes et al., 2014; Batista et al., 2018). Although still very limited by maize crops, research results have highly positive prospects for the future, with reduction of P-fertilizer imports, while raising agricultural production [Brazilian Agricultural Research Corporation (EMBRAPA), 2019].
Analyzing the Brazilian PFA, it is possible to notice the absence of recycling flows from wastewater treatment and landfill sites. The Brazilian National Environmental Council (CONAMA), through Resolution 475 (Brazil, 2006a) and Resolution 481 (Brazil, 2017), defines the procedures and legal requirements for wastewater sludge and organic waste use in agriculture, respectively. However, despite the great potential, P reuse and recycling from these sources in agriculture are still low, with projects using processed wastewater sludge as agricultural fertilizer in only three municipalities from Paraná, São Paulo, and Goiás (Andreoli et al., 2008; Bittencourt et al., 2017).
Environmental impacts related to P consumption
Environmental impacts caused by the use of P are not limited in terms of degradation of aquatic systems. This section seeks to improve insight into the main impacts associated with the production and consumption of Phosphorus in Brazil.
Mining and fertilizer production
The phosphate-fertilizer production chain has a great potential to cause adverse effects to the environment in all steps of the production chain (mining, processing, and industrialization), through activities such as vegetal suppression, occupation of conservation areas, high energy and water consumption, atmospheric emissions, and disposal of mining waste, tailings, and phosphogypsum (Dias and Lajolo, 2010).
According to the Brazilian Mineral Summary (DNPM, 2014), in 2013, 39 million tons of phosphate ore were mined in 10 mines, with an average content of 9.6% of P2O5. After processing, 6.7 million tons of P-rock with an average content of 37% of P2O5 were produced, which represents a generation of more than 32.3 million tons of sludge and tailings per year, at a rate estimated to reach 71 million tons per year by 2030 (Silva et al., 2012). Most of this residue, with the exception of magnetic tailings, is disposed in 22 tailing dams located in the states of Minas Gerais (MG), Goiás (GO), Tocantins (TO), and Bahia (BA), which are described in Table 4.
Phosphate Tailing Dams in Brazil and Its Characteristics
BA, Bahia; GO, Goiás; MG, Minas Gerais; TO, Tocantins.
Source: National Mining Agency (Brazil, 2019a).
In the light of recent events, with the collapse of two Brazilian iron ore tailing dams in Mariana (MG) and Brumadinho (MG), which caused major environmental impacts and took hundreds of lives (Fernandes et al., 2016), it is possible to consider that the volume of phosphate mining residue poses a risk for the natural and human systems around. According to the National Mining Agency, about 59% of the phosphate tailing dams have a high associated potential damage, and despite all of them being classified as “low risk,” it is important to remember that this was also the case for the tailing dam in Mariana (MG) at the time it collapsed (Lenharo, 2015).
Besides that, environmental impacts during industrialization of phosphate fertilizers are mainly related to the increasing stock of phosphogypsum generated by the production of phosphoric acid. Although it is composed mainly of calcium sulfate, this residue incorporates impurities of the original rock, which can be sources of environmental contamination, such as products of uranium decay, thorium and other radionuclides, fluorides, and others (Rutherford et al., 1994).
Eutrophication of water bodies
According to the “Brazilian Water Resources Report,” phosphorus intakes to water bodies are mainly associated with runoff and erosion of arable soils in rural areas, and with domestic wastewater discharges in urban areas (Brazil, 2018).
As discussed above, Brazil has a considerable P stock in agricultural soils. However, it can be a potential source of contamination, since the rate of erosion for arable soils in Brazil is estimated in 850 Tg/year (Merten and Minella, 2013). In this study, results have shown that erosion and runoff accounted for a per capita discharge in water bodies of 2 kg P/year, above the per capita planetary boundaries for P and comparable with the results from O'Neill et al. (2018). Wastewater discharges also need to be addressed since over 50% of the wastewater generated in the country is not treated, being released directly into the hydrosphere (Brazil, 2019b), and even the treatment processes applied have a P removal efficiency of only 50% (von Sperling, 2005).
As a result, most of sampled points in urban areas from the Brazil's National Water Monitoring Network showed P concentrations above the limits of their respective water body classifications, described by CONAMA's Resolution 357 (Brazil, 2006b). Moreover, monitoring points in key reservoirs used for human water supply have shown high risk of eutrophication, especially in semiarid regions, where drought periods have caused considerable reductions in water flows (Santos et al., 2016; Brazil, 2018; Rocha Junior et al., 2018).
Measures have been applied to reduce P flows in domestic wastewater, such as the creation of Resolution 359 (Brazil, 2005), which became effective in 2008, imposing a concentration limit for P in washing detergents of 4.8% by weight. Analyses have shown that detergent manufacturers have respected this limit. Quevedo and Paganini (2016) found concentrations between 0.001% and 0.1% of P by weight, analyzing samples from various regions of Brazil. However, there is also a need to improve soil management and P-fertilizer application, and wastewater collection and treatment systems.
Conclusions
This study conducted a PFA for Brazil for the base year 2013, to provide a better understanding of the main stocks and flows of P in the country and to cooperate with decision makers for a sustainable management of P.
For the year of study, Brazil imported 1.7 × 10³ (±0.29 × 10³) Gg P/year, mainly in the form of P-fertilizers (1.4 × 10³ ± 0.29 × 10³ Gg P/year), which corresponded to 60% of all P-fertilizer demand in the country. P exports were 4.7 × 10² (±0.4 × 10²) Gg P/year, mainly as grains (3.6 × 10² ± 0.4 × 10² Gg P/year).
The agricultural sector applied 2.6 × 10³ (±0.52 × 10³) Gg P/year in arable soils, with 80% in the form of chemical P-fertilizers. P leaving the soils as crop products accounted for 1.1 × 10³ (±0.56 × 10³) Gg P, showing an agricultural efficiency in the country of 40%. A considerable share of the applied P remained in the soil (1.0 × 10³ ± 0.49 × 10³ Gg P), and 16% was lost through soil erosion and runoff.
The Brazilian population consumed a total of 1.8 × 10² (±0.2 × 10²) Gg P/year as food (89%) and nonfood products (11%), releasing this flow as wastewater (64%) and organic solid waste (36%); P flow in the food actually consumed by the population was only 8% of total P inputs in agricultural soils.
Losses to the environment accounted for a total of 6.5 × 10² (±2.2 × 10²) Gg P/year, 85% of which was discharged to the hydrosphere and 15% was landfilled. Total food wastes and losses along the food chain resulted in a flow of 1.8 × 10² (±0.2 × 10²) Gg P/year, the same order of magnitude as the flow of food consumed. Despite the potential for reuse and recycling, there were no significant P flows from the waste management sector to agricultural soils.
Footnotes
References
Supplementary Material
Please find the following supplemental material available below.
For Open Access articles published under a Creative Commons License, all supplemental material carries the same license as the article it is associated with.
For non-Open Access articles published, all supplemental material carries a non-exclusive license, and permission requests for re-use of supplemental material or any part of supplemental material shall be sent directly to the copyright owner as specified in the copyright notice associated with the article.