
Abstract
The goal of this study is to define the environmental burden of residential heating alternatives, namely natural gas, liquefied petroleum gas (LPG), and an air to water heat pump (HP), using life cycle assessment (LCA) and environmental life cycle cost (ELCC) methods. A novel methodology was presented for ELCC by dividing the LCA results into two parts as raw material based LCA (LCAR) and emission based LCA (LCAE) to avoid the double counting of environmental impact. Six impact categories were investigated in the LCA: elemental-based abiotic depletion potential (ADPe); fossil fuel based abiotic depletion potential (ADPff); global warming potential (GWP100); human toxicity potential (HTP); acidification potential (AP); and photochemical oxidation potential (POP). In ELCC, a steady-state cost model was used. An eco-efficiency (EE) index was used to integrate environmental and economic results. According to the results, natural gas has the lowest impact apart from ADPff. The LPG heating system has the highest GWP100 value. In contrast, the HP heating system has the higher impact values for ADPe, HTP, AP, and POP than those of natural gas and LPG. The ELCC value of natural gas (6.06€) is lower compared with LPG (14.55€) and of the HP (coefficient of performance value = 3.5) (10.30€). The HP would have the lowest ELCC value if the electricity had been supplied from a photovoltaic panel (1.43€). According to the EE index based on GWP100, LPG and the HP fall under the entire non EE area relative to the natural gas.
Introduction
Buildings represent one of the main sources of energy consumption using 32% of the world's energy in 2010. In addition, the percentage of building energy consumption is around 40% in many developed countries (Huo et al., 2018). The choice of energy source is important for residential heating from both environmental and economic aspects. Therefore, a comprehensive approach should be applied. At this point, life cycle assessment (LCA) and life cycle cost (LCC) have emerged as important tools to quantify potential environmental impact and to determine the costs of the building heating alternatives. LCA is a holistic approach that can be applied to products and services to determine environmental impact. Table 1 shows studies from the literature that have focused on the LCA of heating systems.
Literature Studies on Life Cycle Assessment (Only) of Heating Systems
COP, coefficient of performance; GSHP, ground source heat pump; HP, heat pump; LPG, liquefied petroleum gas; PV, photovoltaic.
An LCC is a comprehensive decision-making tool for calculating the total costs, which are generated over the entire lifetime of products and services (Auer et al., 2017). Three distinct types of LCC, namely (1) conventional life cycle cost (CLCC), (2) societal LCC, and (3) environmental life cycle cost (ELCC), are defined by the Society of Environmental Toxicology and Chemistry (SETAC) (Hunkeler et al., 2008).
CLCC is based on a purely economic evaluation and considers various costs associated with a product, which are borne directly by a given actor. Generally, only costs borne by the actor matter, and environmental costs or external end-of-life costs are omitted (Hoogmartens et al., 2014; Petrillo et al., 2016). This type of LCC is a one-dimensional approach, without connections to other axes of sustainability. Aste et al. (2010) applied CLCC by comparing a gas boiler, air conditioning, and a heat pump (HP) from an economical perspective for a 15- to 20-year life span. The costs indicated for the compared systems were related to standard product availability in the market and include the cost of heat generator, distribution system, and supply terminals, but not externalities. Another CLCC study on heating systems was conducted by Morrissey and Horne (2011) for house designs heated by natural gas to investigate LCCs in a cool temperate climate, Melbourne, Victoria.
The societal LCC includes externality costs (i.e., it “internalizes” the environmental and social impact by assigning monetary values to the respective effects), using accounting prices. Societal LCCs may also be characterized as “socio-economic” or “welfare-economic” assessments (Martinez-Sanchez et al., 2015).
ELCC is defined as a complementary analysis to the environmental LCA with equivalent system boundaries and the same functional unit (Foolmaun and Ramjeeawon, 2012; Hoogmartens et al., 2014). ELCC is an assessment of all costs associated with the life cycle of a product that are directly covered by one or more of the actors in the product life cycle, with complementary inclusion of externalities that are anticipated to be internalized in the decision relevant future (Hunkeler et al., 2008; Foolmaun and Ramjeeawon, 2012). Externality costs represent effects on the welfare of individuals caused by activities which are not otherwise compensated. Externalities can be environmental, that is, relate to the emissions in the LCA, or nonenvironmental in the form of noise or time spent by the households on waste sorting (Rebitzer and Hunkeler, 2003; Martinez-Sanchez et al., 2015).
One way to include external environmental costs in ELCC is to use monetary-weighted results, as applied in this study, obtained from environmental system analysis (such as LCA) (Du et al., 2014). For internalizing the environmental externalities based on LCA, there are different valuation methods at midpoint and end point levels. Valuation at the midpoint level would be less uncertain than the end point level because there is often insufficient scientific knowledge for carrying out the end point valuation approaches (Kaenchan and Gheewala, 2017).
There are different midpoint monetary valuation applications: the Ecotax 2002 (averting behavior approach; Finnveden et al., 2006); Stepwise2009 (the budget constraint approach; Weidema, 2009); LIME (the choice experiment approach; Itsubo et al., 2004); Ecovalue08 (a mix of contingent valuation-market price approach; Ahlroth and Finnveden, 2011); and Environmental Priority Strategies (EPS; a mix of contingent valuation-market price-abatement cost approach; Steen, 1999) (Pizzol et al., 2015). Of these, Ecotax2002 and Ecovalue08 are the applications based on CML (Centre for Environmental Sciences, Leiden University) life cycle impact methodology. The Ecovalue08 monetary weighting set has been developed for evaluating midpoint environmental impact based on willingness-to-pay (WTP), with particular focus on Swedish conditions, while the Ecotax set is based on environmental taxes and fees levied by a focal society (Du et al., 2014). Ecovalue08 is a global-scale weighting method, whereas the weighting factors (WFs) of Ecotax 2002 are based on geographically specific WTP (Sweden) (Pizzol et al., 2015; Huysegoms et al., 2018).
In general, to decide between the alternatives, as in this study, the solution is required to be environmentally sustainable, as well as being economically viable. These two aspects can be achieved by integration of LCA and LCC. In the literature, there are few studies that focus on LCA and LCC for heating systems in the same study (Glick and Guggemos, 2010; Ristimäki et al., 2013; Huang and Mauerhofer, 2016; Moran et al., 2017 ). Among them, ELCC was only used in two studies (Huang and Mauerhofer, 2016; Moran et al., 2017), but it is partial ELCC, not a full ELCC, that has the same boundaries as LCA. Moran et al. (2017) focus on the LCC and environmental analysis (using energy and global warming potential [GWP100] as indicators) of almost zero energy buildings using various heat sources, such as a gas boiler, biomass boiler, a domestic gas fired combined heat and power unit, a HP, and renewable technology. They applied a partial ELCC by considering that the cost of carbon emissions only resulted from operational phase and not from other life cycle phases. They also failed to consider the impact of other life cycles except for those that are carbon based. Huang and Mauerhofer (2016) focus on evaluation of ground coupled ground source heat pumps (GSHPs). They used partial ELCC by quantification of the production phase-based environmental effects of GSHP under the term “prevention cost.” However, they did not consider that the operational phase-based emissions of a HP resulted from electricity consumption. In addition to this, the LCA and LCC applied in these studies were not integrated to each other, and their results were given independently.
In this study, LCA and ELCC were performed for three different residential heating systems based on natural gas, liquefied petroleum gas (LPG), and an air to water (A/W) HP.
Natural gas is the most preferred fuel where its connection system is available. If it is not, the LPG system has been used for the heating of residents, especially in the rural regions. The HP is a relatively new application for residents and it is commonly used for green buildings. In addition to this, HP applications have been encouraged by the government with the use of renewable energy sources. Differing from the literature, a novel methodology was presented for ELCC by dividing the LCA results into two parts as raw material based LCA (LCAR), and emission based LCA (LCAE) to avoid the double counting of environmental impact. In addition, a Monte Carlo simulation and a sensitivity analysis were performed to determine the uncertainty of the results. Finally, the LCA and ELCC results were integrated under the eco-efficiency (EE) index to decide between the alternatives.
Life Cycle Assessment
The LCA technique used in this study is based on the ISO 14040 framework and ISO 14044 guidelines and requirements, consisting of four steps; goal and scope definition, inventory analysis, impact assessment, and interpretation [International Organization for Standardization (ISO), 2006a, 2006b]. Impact assessment and interpretation have been combined in the Results section.
Goal and scope definition
The aim of the study is to define the environmental burden of residential heating alternatives, including a natural gas boiler, an LPG boiler, and an A/W HP using LCA. The functional unit of the study was a heating requirement of 1 m3 of a house for 1 year. This building is in the city of Eskişehir in the northwest Central Anatolia Region of Turkey.
System boundaries, including energy resource production, heating system production, transportation, operation, and End of Life (EoL) phases, are shown in Fig. 1. For the EoL phase, it was assumed that, after the expiration of a lifetime, the boilers and HP as scrap material were send to a steel rebar production facility and melted down using induction melting furnace technology. Other operational energy end uses, such as hot water, appliances, lighting, and cooking, are excluded.
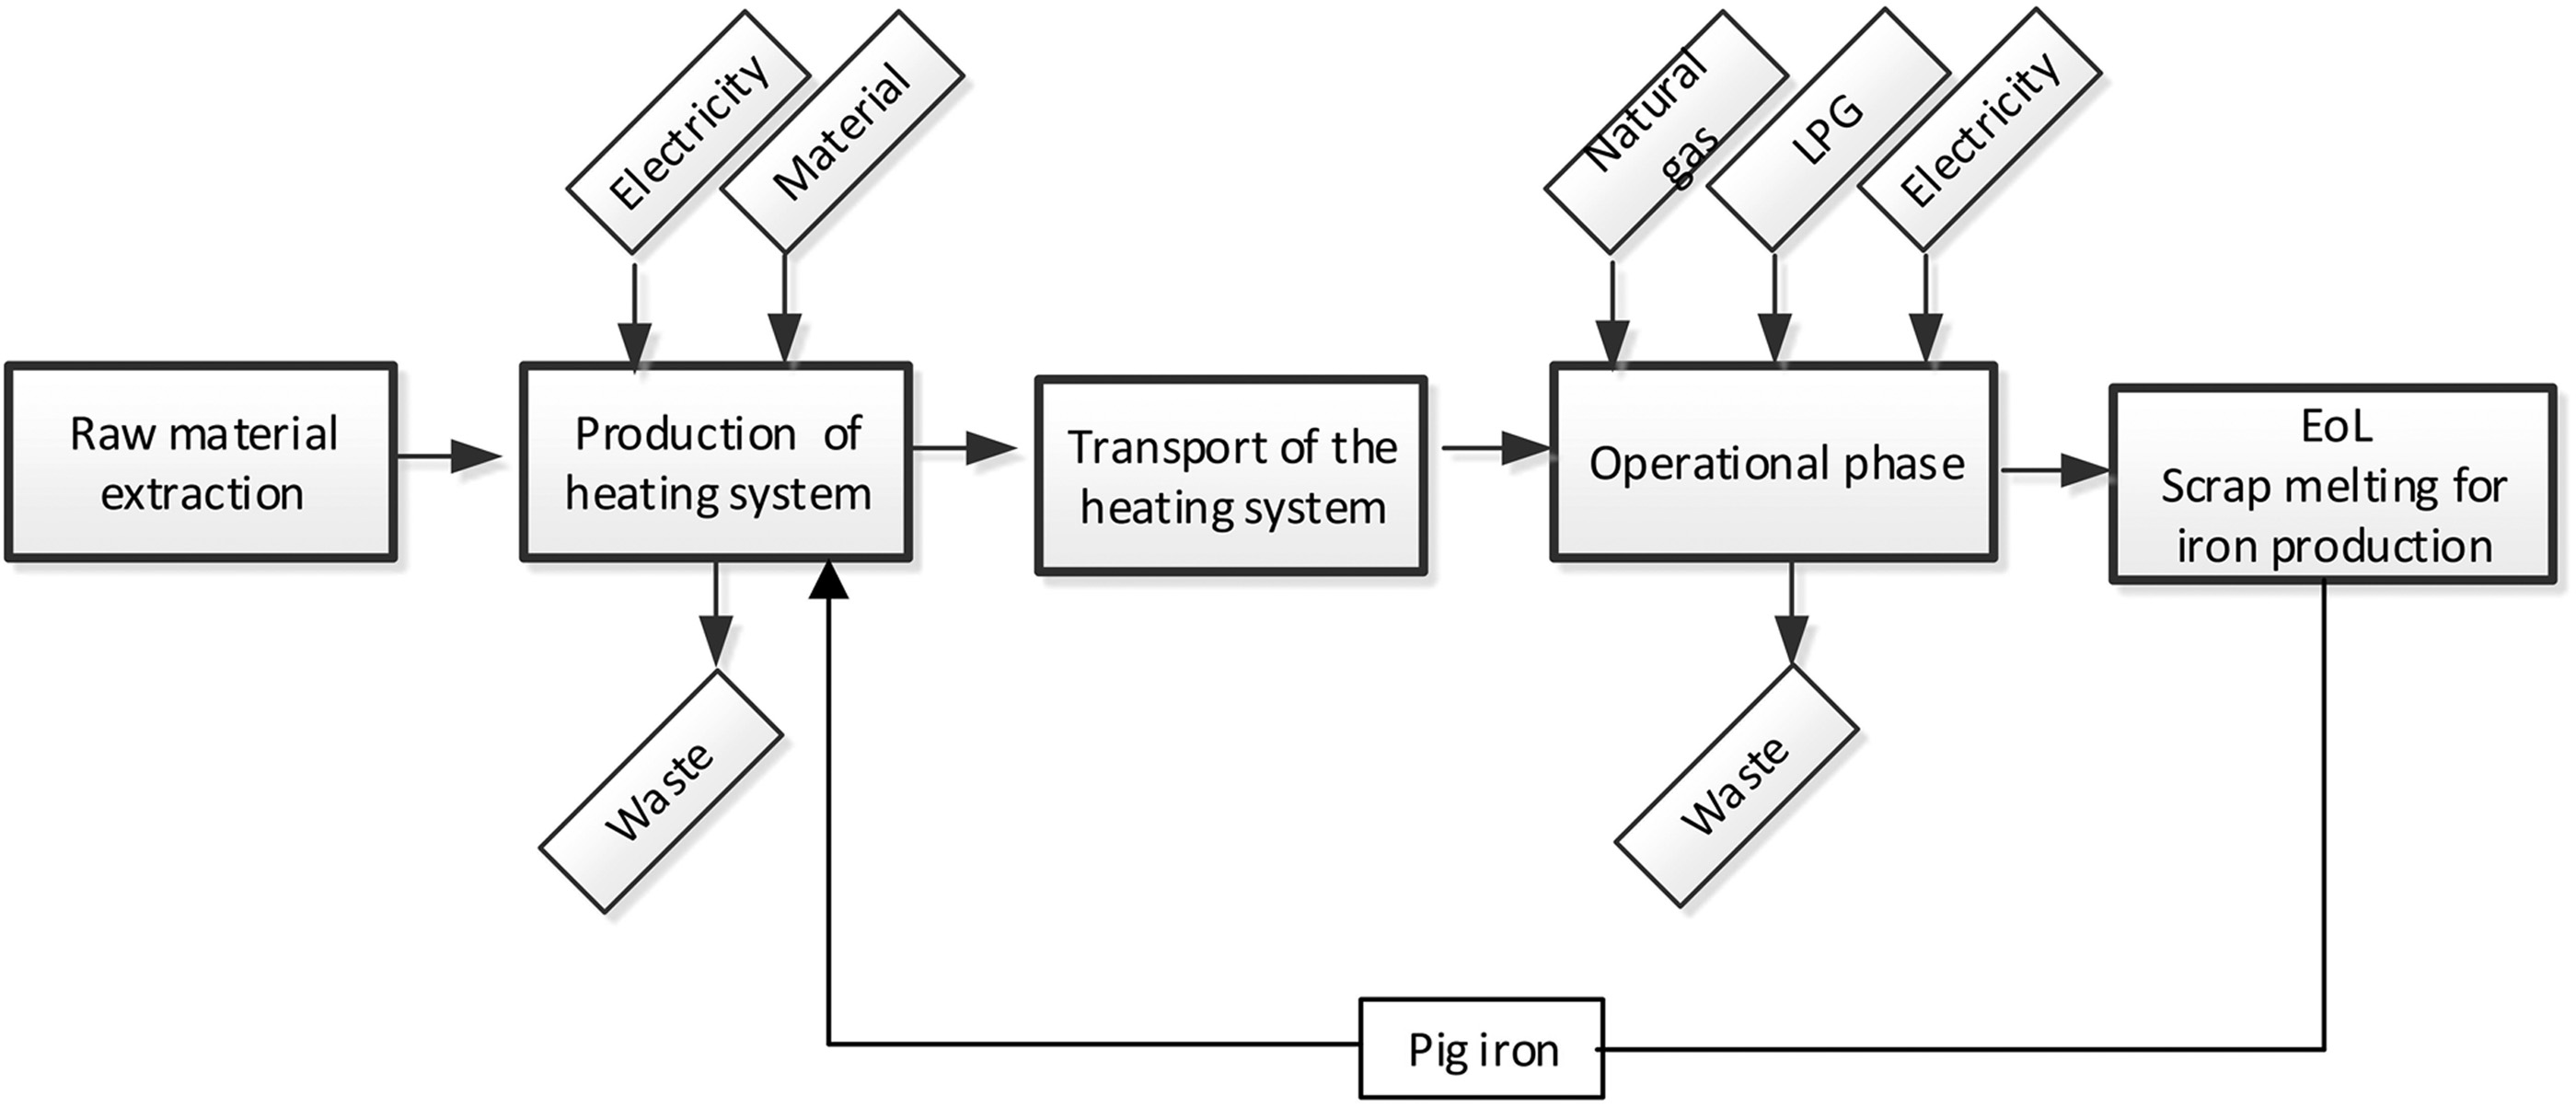
System boundaries of the study.
No cutoff criteria were used in terms of mass, energy, and environmental impact. All the data regarding the components of boilers and HP were included in the Life Cycle Inventory (LCI) modeling. The percentile distribution of the processes to the impact categories was reported by not using any cutoff value.
Allocation was avoided using system expansion as recommended by ISO 14044 [International Organization for Standardization (ISO), 2006b]. Avoided burdens, gained through recycling, that constituted the EoL phase were used as a credit for the boiler and HP production phases.
Data Quality Indicators are explained in two categories: foreground and background data. The foreground data were gathered from a residential house heating project that was prepared by a project firm. These data were used to determine heat loss. Therefore, the uncertainty resulting from the foreground data is the same for all of the heating alternatives. The heat loss of the building was used to determine the capacities of boilers (natural gas and LPG) and HP. The background data were obtained from Ecoinvent, whose integrity and usability have been highlighted elsewhere (Franzoni et al., 2018; Visentin et al., 2019). Ecoinvent uses Pedigree matrix (Weidema, 1998) to assess the uncertainty of data based on five Data Quality Indicators; reliability, completeness, temporal correlation, geographical correlation, and further technological correlation. This can only be achieved through lognormal distribution. All the data selected from Ecoinvent for this study show lognormal distribution. The minimum pedigree matrix values of the data were 4,3,3,3,4,3. The effect of uncertainties on the results was evaluated using a Monte Carlo simulation.
Life cycle inventory
Determination of the heat requirement of the building is the starting point of the life cycle inventory. These data were used to determine the capacity of the boiler/HP for the production phase and fuel/electricity consumption for the operational phase. Heat requirement data were developed using foreground data gathered from a residential house heating project that was prepared by a project firm. The project building is a villa type house with a net using area of 605 m2. Although average building type in Turkey is apartment flat, only natural gas and coal based heating systems are used in there. The reason behind the selection of villa type house is that it's open to use all three heating alternatives. A facade drawing of the building that was obtained from the project firm is shown in Fig. 2. The city where the building is located, Eskişehir, is in the third area of degree-day. Insulation of the building conforms to the Turkish Standard for Heating and Insulation of Buildings; Turkish Standard Number (TS) 825 [Turkish Standard Number 825 (TS 825), 1999]. Therefore, this building has good energy efficiency (B type, calculated heat requirement being lower than 90% of maximum allowed heat requirement) according to TS 825. (A comparison of TS 825 with other related international standards can be accessed from Dilmac and Kesen, 2003).

Technical drawing of the house.
Using the volume weighted calculation method given by TS 825, the annual heat requirement of the building was calculated as 39,430.75 kWh by the project firm. The internal temperature was 19°C, and the average external temperature range was between −13°C and 21.7°C for the months of January and July, respectively, as indicated by TS 825. The annual heating requirement value of the house was used to determine the amount of energy resource consumption by the heating systems. Heat loss was calculated using the AutoCAD drawing of the heating system and was found to be 46.5 kW by the project firm, according to TS 825. Winter conditions were taken as the design data for heat loss calculation; the outside temperature being −12°C and the internal temperature being 19°C between 0800 and 1800 h and 16°C between 18.00 and 0800 h. The heat loss of the building was used to determine the capacities of the boilers (natural gas and LPG) and HP.
Alternative 1: natural gas boiler
The gas boiler capacity was selected as 50 kW according to a calculated heat loss of 40,000 kcal/h (46.5 kWh). The data for the gas boiler were taken from Ecoinvent Database v3, the average particulate matter (PM) values of boiler component data being 3,4,3,1,1,3. It was assumed that the boiler was produced by a factory in Bozuyuk, where there is an international factory that produces boilers and HPs and transported to Eskisehir using a 16-T capacity lorry. The distance between Bozuyuk and Eskisehir is 30 km. Natural gas consumption was calculated as 6.63 m3 for 1 m3 heating using annual heat requirement and the calorific value of natural gas. The calorific value of the natural gas used in Eskişehir is 34.54 MJ/m3 (Banar and Çokaygil, 2010). The boiler is a condensing type boiler that works at an efficiency of 103% based on the lower heating value from the catalogs of boiler suppliers. The natural gas served in Eskişehir is mainly composed of CH4 (94. 74%) (BOTAŞ, Petroleum Pipeline Company, personal communication by e-mail, 2017). CO2 emissions were calculated using the stoichiometric combustion of natural gas with 5% excess air. NOx emissions were determined based on the limit value of 80 mg NO2/kWh for residential heating systems burned liquid/gas fuel as detailed by the Turkish Heating Related Air Pollution Control Regulation (2005). Other emissions were calculated using USEPA emission factors (USEPA, 1998) given in Supplementary Table S1. The life expectancy of the boiler was assumed to be 20 years (Ecoinvent Database v3). At the end of its life span, the boiler would be sent to a steel production facility as scrap material for melting down. It was assumed that the same amount of pig iron usage was avoided using this scrap material. An inventory table for the natural gas heating system is given in Supplementary Table S2.
Alternative 2: LPG boiler
The LPG boiler capacity was calculated according to heat loss (40,000 kcal/h), the same as the natural gas boiler, and was found to be 50 kWh. The same Ecoinvent value for the natural gas boiler was also used for the LPG boiler. It was assumed that the boiler was produced by the same factory in Bozuyuk and similarly transported to Eskisehir. The calorific value of LPG is 11,100 kcal/m3 (Ecoinvent Database v3). LPG consumption was calculated as 4.98 m3 for 1 m3 heating. LPG is mainly composed of propane (C3H8; 95%). The efficiency of the boiler was 92% for a conventional type boiler (from the catalogs of boiler suppliers). Air emissions were calculated using stoichiometric combustion of LPG with 5% excess air. For the emissions of NOx, SO2, PM10, CO, and volatile organic compound (VOC), the same procedure as with natural gas was applied. Due to the low boiling point of propane gas (−42°C), this system does not use evaporator units. For this reason, there is no need for electricity. In addition to the boiler, the LPG system has a storage tank with a 3,000 L storage capacity. The weight of the tank is 440 kg (Öztürk, 2003) and it was made of pressure vessel steel (P355). This tank was thought to have been moved from a tank production facility in Kayseri to Eskisehir. The distance between Kayseri and Eskişehir is 520 km. The life expectancy of the boiler is 20 years (Ecoinvent Database v3) and at the end of its life span the LPG boiler and storage tank would be sent to a steel production facility as a scrap material for melting down. An inventory table for the LPG heating system is given in Supplementary Table S3.
Alternative 3: heat pump
A HP uses electricity to force the movement of heat from a low temperature medium to a higher temperature medium. The type of HP depends on the type of low-temperature source, such as air, water, or ground source (Abusoglu and Sedeeq, 2013). In this study, an A/W HP was selected, since it has a wide range of uses with the advantage of simple operation, an easy heat source, high energy efficiency, and low operational costs, and suchlike. It was assumed that the HP was produced by the same factory in Bozuyuk and similarly transported to Eskisehir. The coefficient of performance (COP) value of the HP ranges between 2 and 4.5 and it was assumed to be 3.5 for Eskişehir conditions according to the firm that installed the HP (Yensis, Renewable energy systems company, personal communication, 2018; www.yensis.com). The capacity of the HP was calculated as 15 kW using the annual heat requirement and the COP value of the HP. As the climate in Eskişehir does not require the use of cooling in summer, the cooling function of the heating pump is not taken into consideration. In general, residents prefer natural ventilation. The amount of electricity used by the HP was calculated to be 21.7 kWh using the annual heat requirement and the COP value. Background data for the HP were taken from the Ecoinvent database. The data include the most important materials used for production and coolant emissions during production, but not under operational conditions. The coolant used was R134A, which was produced from trichloroethylene and tetrachloroethylene (v/v: 50/50). Coolant losses during the operation were assumed to be 6% per year (Dahlstrøm et al., 2012). Maintenance of the HP only involved completing the required coolant level. The electricity profile data were adapted from the authors' previous work (Günkaya et al., 2016) using the electricity generation mix percentages of Turkey for 2017. The considered electricity generation mix is composed of 35% natural gas, 24.6% hydro, 31% coal (mainly hard coal, imported coal, and lignite), 10.9% wind, and 2% geothermal. It was assumed that the lifetime of the HP is 20 years, and after its expiration, as with the boilers, the HP would be used by the steel production plant as scrap material. The remaining refrigerant would be reused, assuming losses of 20% during the extraction process (Greening and Azapagic, 2012). An inventory table for the air pump heating system is given in Supplementary Table S4.
Life cycle impact assessment
An LCA analysis was performed using licensed SimaPro 8.5.0 software based on the CML-IA (v.3.00) method for the impact categories of abiotic depletion potential (elemental ADPe and fossil fuel ADPff), GWP100, human toxicity potential (HTP), acidification potential (AP), and photochemical oxidation potential (POP). ADPff and GWP100 were selected since the natural gas, LPG, and electricity generation resources are mainly carbon based fossil fuels. ADPe and HTP were investigated because of elemental consumption and toxicity that is related to the mechanical parts of heating systems. The reason behind the selection of AP was SO2 pollution during the electricity generation. POP was selected due to the coolant emissions released from the HP.
The LCA results were divided into the following two parts to avoid double counting emissions in accordance with LCC (Swarr et al., 2011): resulting from raw material usage (LCAR) and resulting from emissions (LCAE). According to this division, input related impact categories (ADPe and ADPff) and output related impact categories (GWP100, HTP, AP, and POP) are given under the LCAR and LCAE, respectively. EU25 + 3, 2000 was applied for normalization.
Interpretation
All process data of Ecoinvent used in this study show a lognormal distribution with standard deviation (SD). For this reason, the results are interpreted in the light of a Monte Carlo simulation analysis (with the Monte Carlo function built in SimaPro 8.5 software), which was performed to note the effects of data variation on the results; the SD values of the subprocesses of heating systems are given in the Supplementary Tables S5–S7. In the analysis, 1,000 fixed runs were carried out at a significance level α = 0.05, and the number of comparison runs in which the LPG heating system was greater than the natural gas heating and the HP heating systems was counted by the software for the entire inventory result. Simulation results are shown with a graphic distribution of the difference between the heating systems.
Sensitivity analyses
Sensitivity analyses were performed for four scenarios: conventional type natural gas boiler with an efficiency of 97% (calculated based on Che et al., 2004); a condensing type LPG boiler with an efficiency of 103% (from the catalogs of boiler suppliers); different COP values; and the electricity source of the HP. COP value is an important factor in determining the environmental performance of a HP, as well as its efficiency. The COP varies depending on the temperature difference between the high evaporation temperature and heat output temperature. In the catalog of the HP producer, the COP value ranges between 2 and 4.5. An LCA analysis of the HP was performed for an average COP value of 3.5. However, since Eskişehir is situated in a continental climate, there would be large temperature differences between day and night and inlet and outlet. For this reason, analyses were repeated for the other COP values in the range to observe the effect of COP value on the environmental impact of the HP heating system.
Electricity demand is the main input for HPs. In a comparison of heating alternatives, a national grid mix was used for the electricity source of the HP. In contrast, if it is thought that HPs are generally used in green buildings, a scenario that electricity might be supplied from photovoltaic (PV) panels gains approval. For this reason, a second sensitivity analysis was performed for the case of the electricity input of the HP totally supplied by PV panels. For these scenarios, a 10 kW PV was assumed to have been placed on the roof.
ELCC Assessment
In this study, ELCC was applied since, according to Rebitzer and Hunkeler (2003), the eligible type of LCC that can be applied in parallel with LCA is the ELCC. In ELCC, a steady-state cost model was used, which means no discounting or depreciation was taken into account (Luo et al., 2009). The economic results of the ELCC are complemented by an LCA for the same system, but special attention should be given to avoid double counting of emissions; that is, once they are internalized in the economic part, they should not be accounted for in the environmental part (Martinez-Sanchez et al., 2015). The costs of all the life cycle phases should not be included to avoid double counting, and all the costs that are borne upstream in a certain stage of the supply chain should be summarized in the price of any good or service purchased at that stage (Heijungs et al., 2013). The connection between LCA and ELCC that was established in accordance with these explanations is shown in Fig. 3 with system boundaries applied in the LCA. This figure shows that the environmental impact of the life cycle phases resulting from raw material usage (LCAR) corresponds to the internal costs (equipment, operational, and maintenance costs) and that the environmental impact of the emissions (LCAE) is monetized to obtain external costs. In addition, the sum of the internal and external costs gives the ELCC. The functional unit of heating 1 m3 of the project house was also applied for ELCC.
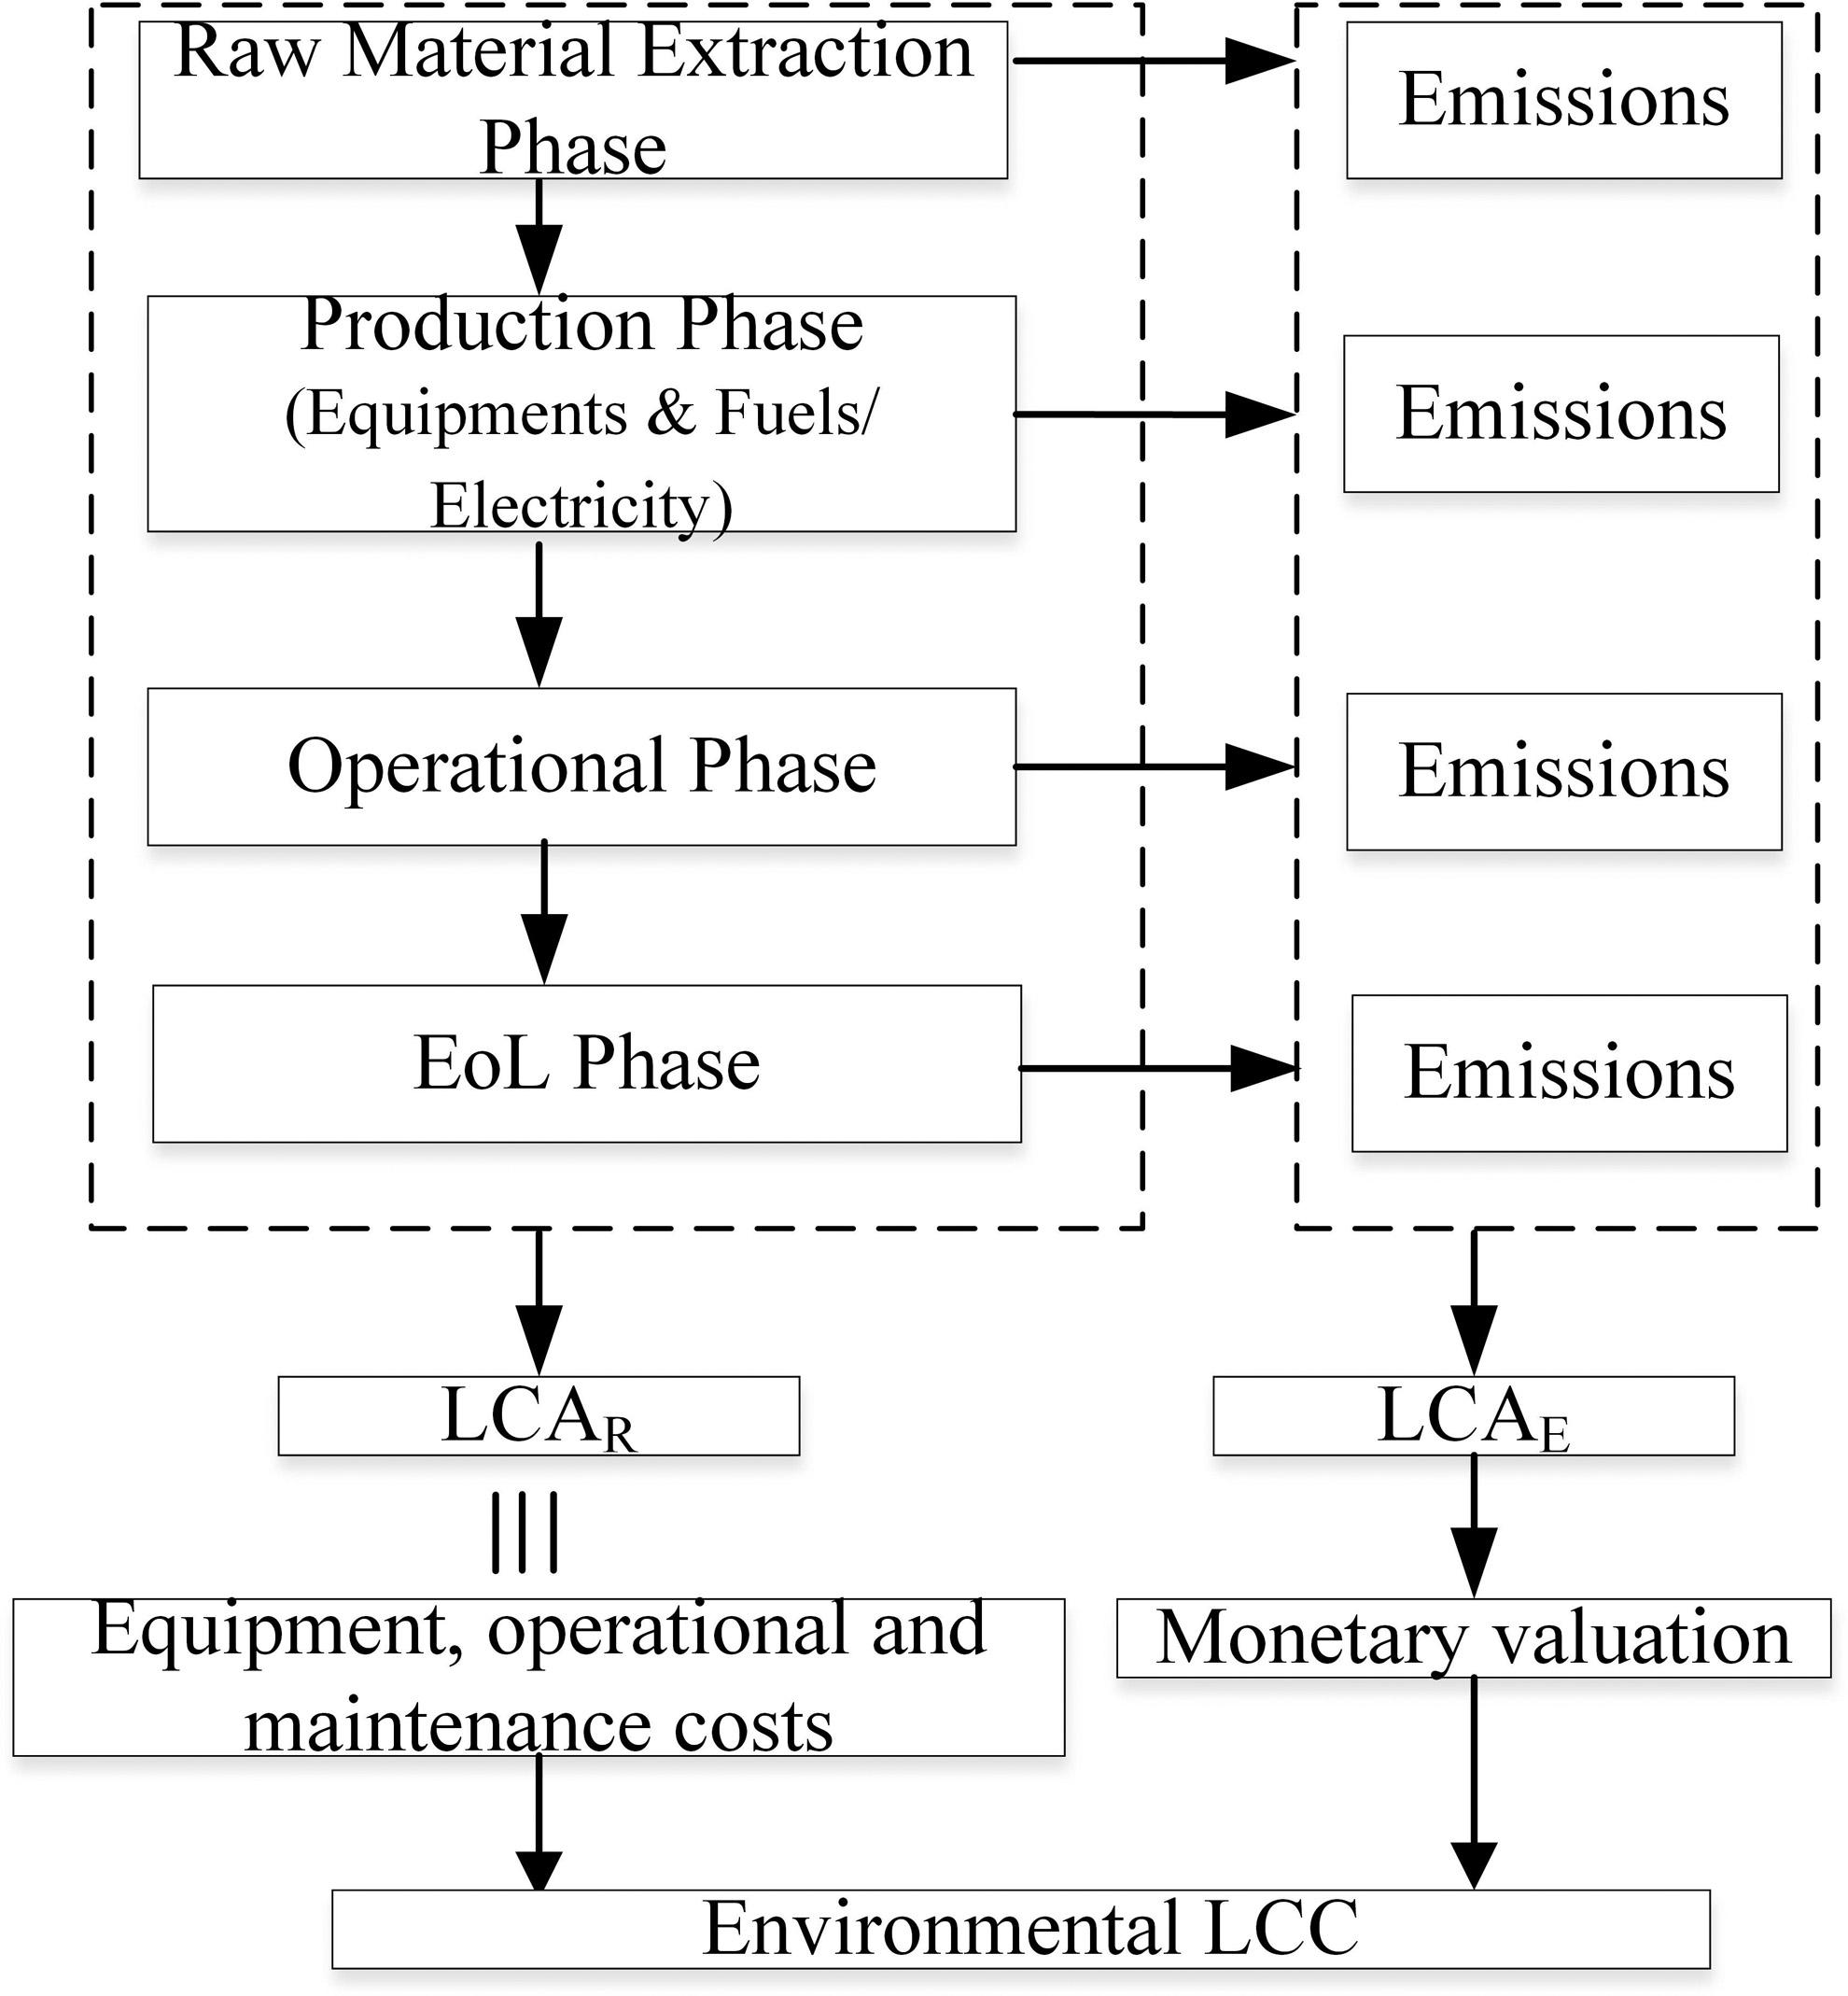
The connection between LCA and ELCC. ELCC, environmental life cycle cost; LCA, life cycle assessment; LCAE, emission based LCA; LCAR, raw material based LCA.
Internal cost data are given in Table 2. It is thought that the cost of raw materials, transport, energy, production, labor, and packaging is already charged in the market prices given in Table 2. These values are associated with the functional unit by dividing by the lifetime of the equipment (20 years) and the total volume of the house. Table 2 also shows the operational costs based on natural gas, LPG, and electricity consumption per functional unit and the annual maintenance costs of the heating systems.
Internal Costs of Heating Systems
Data were obtained from the website of a producer.
Data were calculated using the unit price specified in the natural gas bill.
Data were calculated using unit price obtained from the website of a LPG supplier.
Data were calculated using the unit price specified in the natural gas bill.
Data were obtained by personal communication with an authorized service.
f.u., functional unit.
External costs include the cost of environmental impact resulting from emissions (i.e., CO2, NO2, SO2, PM10, CO, and VOC) generated during the raw material extraction, production of heating systems, fuel, electricity, operation/maintenance, and EoL phases. The impact of these emissions is given as LCAE. For monetization of the results of the LCAE, Ecovalue08 was used in this study. The reasons behind the selection of Ecovalue08 are that it is based on CML life cycle impact methodology and it is a global-scale weighting method.
The WFs to aggregate midpoints to a monetized end point impact proposed in Ecovalue 08 are all based on market valuations of resource depletion and individual WTP estimates for environmental quality. Instead of using WTP directly, the gross domestic product (GDP) in purchasing power parity (PPP) per capita can be used because WTP or ability to pay to avoid damages is proportional to the GDP(PPP)percap (Silalertruksa et al., 2012). The baseline and the WF are derived from several European valuation studies based on GDP(PPP)percap (Huysegoms et al., 2018). To transfer the monetary WFs given by Ecovalue08 for the European Union (EU) into Turkey, the benefit transfer methodology based on the estimation of economic values of environmental commodities in another place and time using economic information gathered from one place and time (Silalertruksa et al., 2012; Woon and Lo, 2016) was used. The monetary WFs for Turkey were calculated by adjusting reported WFs for the EU with the rate of GDP(PPP)percap between Turkey and the EU (Woon and Lo, 2016) [Eq. (1)].
where WF is the weighting factor; GDP (PPP)percap TR and GDP (PPP)percapEU are, respectively, GDP at PPP per capita in Turkey and in the EU. WFs in Euro2008 and in Euro2018 for the EU and Turkey are given in Table 3.
Weighting Factors of Impact Categories
Huysegoms et al. (2018); some factors have minimum and maximum values. Maximum values were used.
WFs for Turkey are calculated by adjusting the reported external environmental values for the European Union using GDP at PPP per capita. GDP (PPP) of EU-28:100; Turkey:64 [Eurostat, 2018; http://ec.europa.eu/eurostat/statistics-explained/index.php?title=File:2DeceVolume_indices_per_capita,_2014–2016_(EU-28%3D100).png]
![http://ec.europa.eu/eurostat/statistics-explained/index.php?title=File:2DeceVolume_indices_per_capita,_2014–2016_(EU-28%3D100).png]](http://ec.europa.eu/eurostat/statistics-explained/index.php?title=File:2DeceVolume_indices_per_capita,_2014–2016_(EU-28%3D100).png])
Calculated using the rate between consumer price index values of 2008 and 2018 (TUIK, 2018).
EU, European Union; GDP, gross domestic product; PPP, purchasing power parity; WF, weighting factor.
EE Index
EE analysis is a comprehensive and science-based approach that comprises the use of environmental impact data and cost data to calculate the EE of a product (Woon and Lo, 2016; Miah et al., 2017). In the traditional view of environmental cost analysis, an environmental problem is a negative output and decreasing negative output requires more input (more environmental costs). However, from another point of view, consider that pollution is a form of economic inefficiency and, therefore, reductions in pollution actually reduce costs. This competing hypothesis challenges the traditional model of pollution and cost management and is referred to as EE (Soares et al., 2013). There are two dimensions of EE, where “eco” stands for both economic and ecological performances that relate to product values with environmental influences calculated (Soares et al., 2013). The cost indicator related to the environmental indicator, which is based on LCA, was calculated according to ELCC methodology, as applied by Vercalsteren et al. (2010).
In this study, the Cartesian coordinate system was used to determine EE. The y-axis shows the relative internal cost, and the x-axis shows the relative life cycle environmental impact calculated by LCA (LCAE). Each part of this system can be expressed negatively or positively, corresponding to a reduction or increase from the economic costs and to an improvement or damage from environmental aspects, respectively. All positive results indicate a worse situation than the reference; all negative results indicate better conditions than the reference (Woon and Lo, 2016). The natural gas heating system was accepted as the reference. Only one environmental issue was taken into account; GWP. The reason behind the selection of GWP is higher CO2 emissions resulting from the operational stage and also their higher costs among the other impact values. Taking natural gas as the reference point, the LPG and HP were compared with the natural gas by calculating the relative change in the percentage of the LCA and the internal cost (IC) of the LPG and HP to natural gas using Equations (2) and (3), respectively (Soares et al., 2013):
where EnRPC is relative change in percentage of life cycle environmental impact, and EcRPC is relative change in percentage of internal cost. The external environmental costs were excluded to avoid potential double counting. This is because the damage impact due to air pollutants has been taken into account by the LCA (LCAE) impact of the proposed heating systems (Woon and Lo, 2016). EE index methodology is illustrated in Fig. 4.
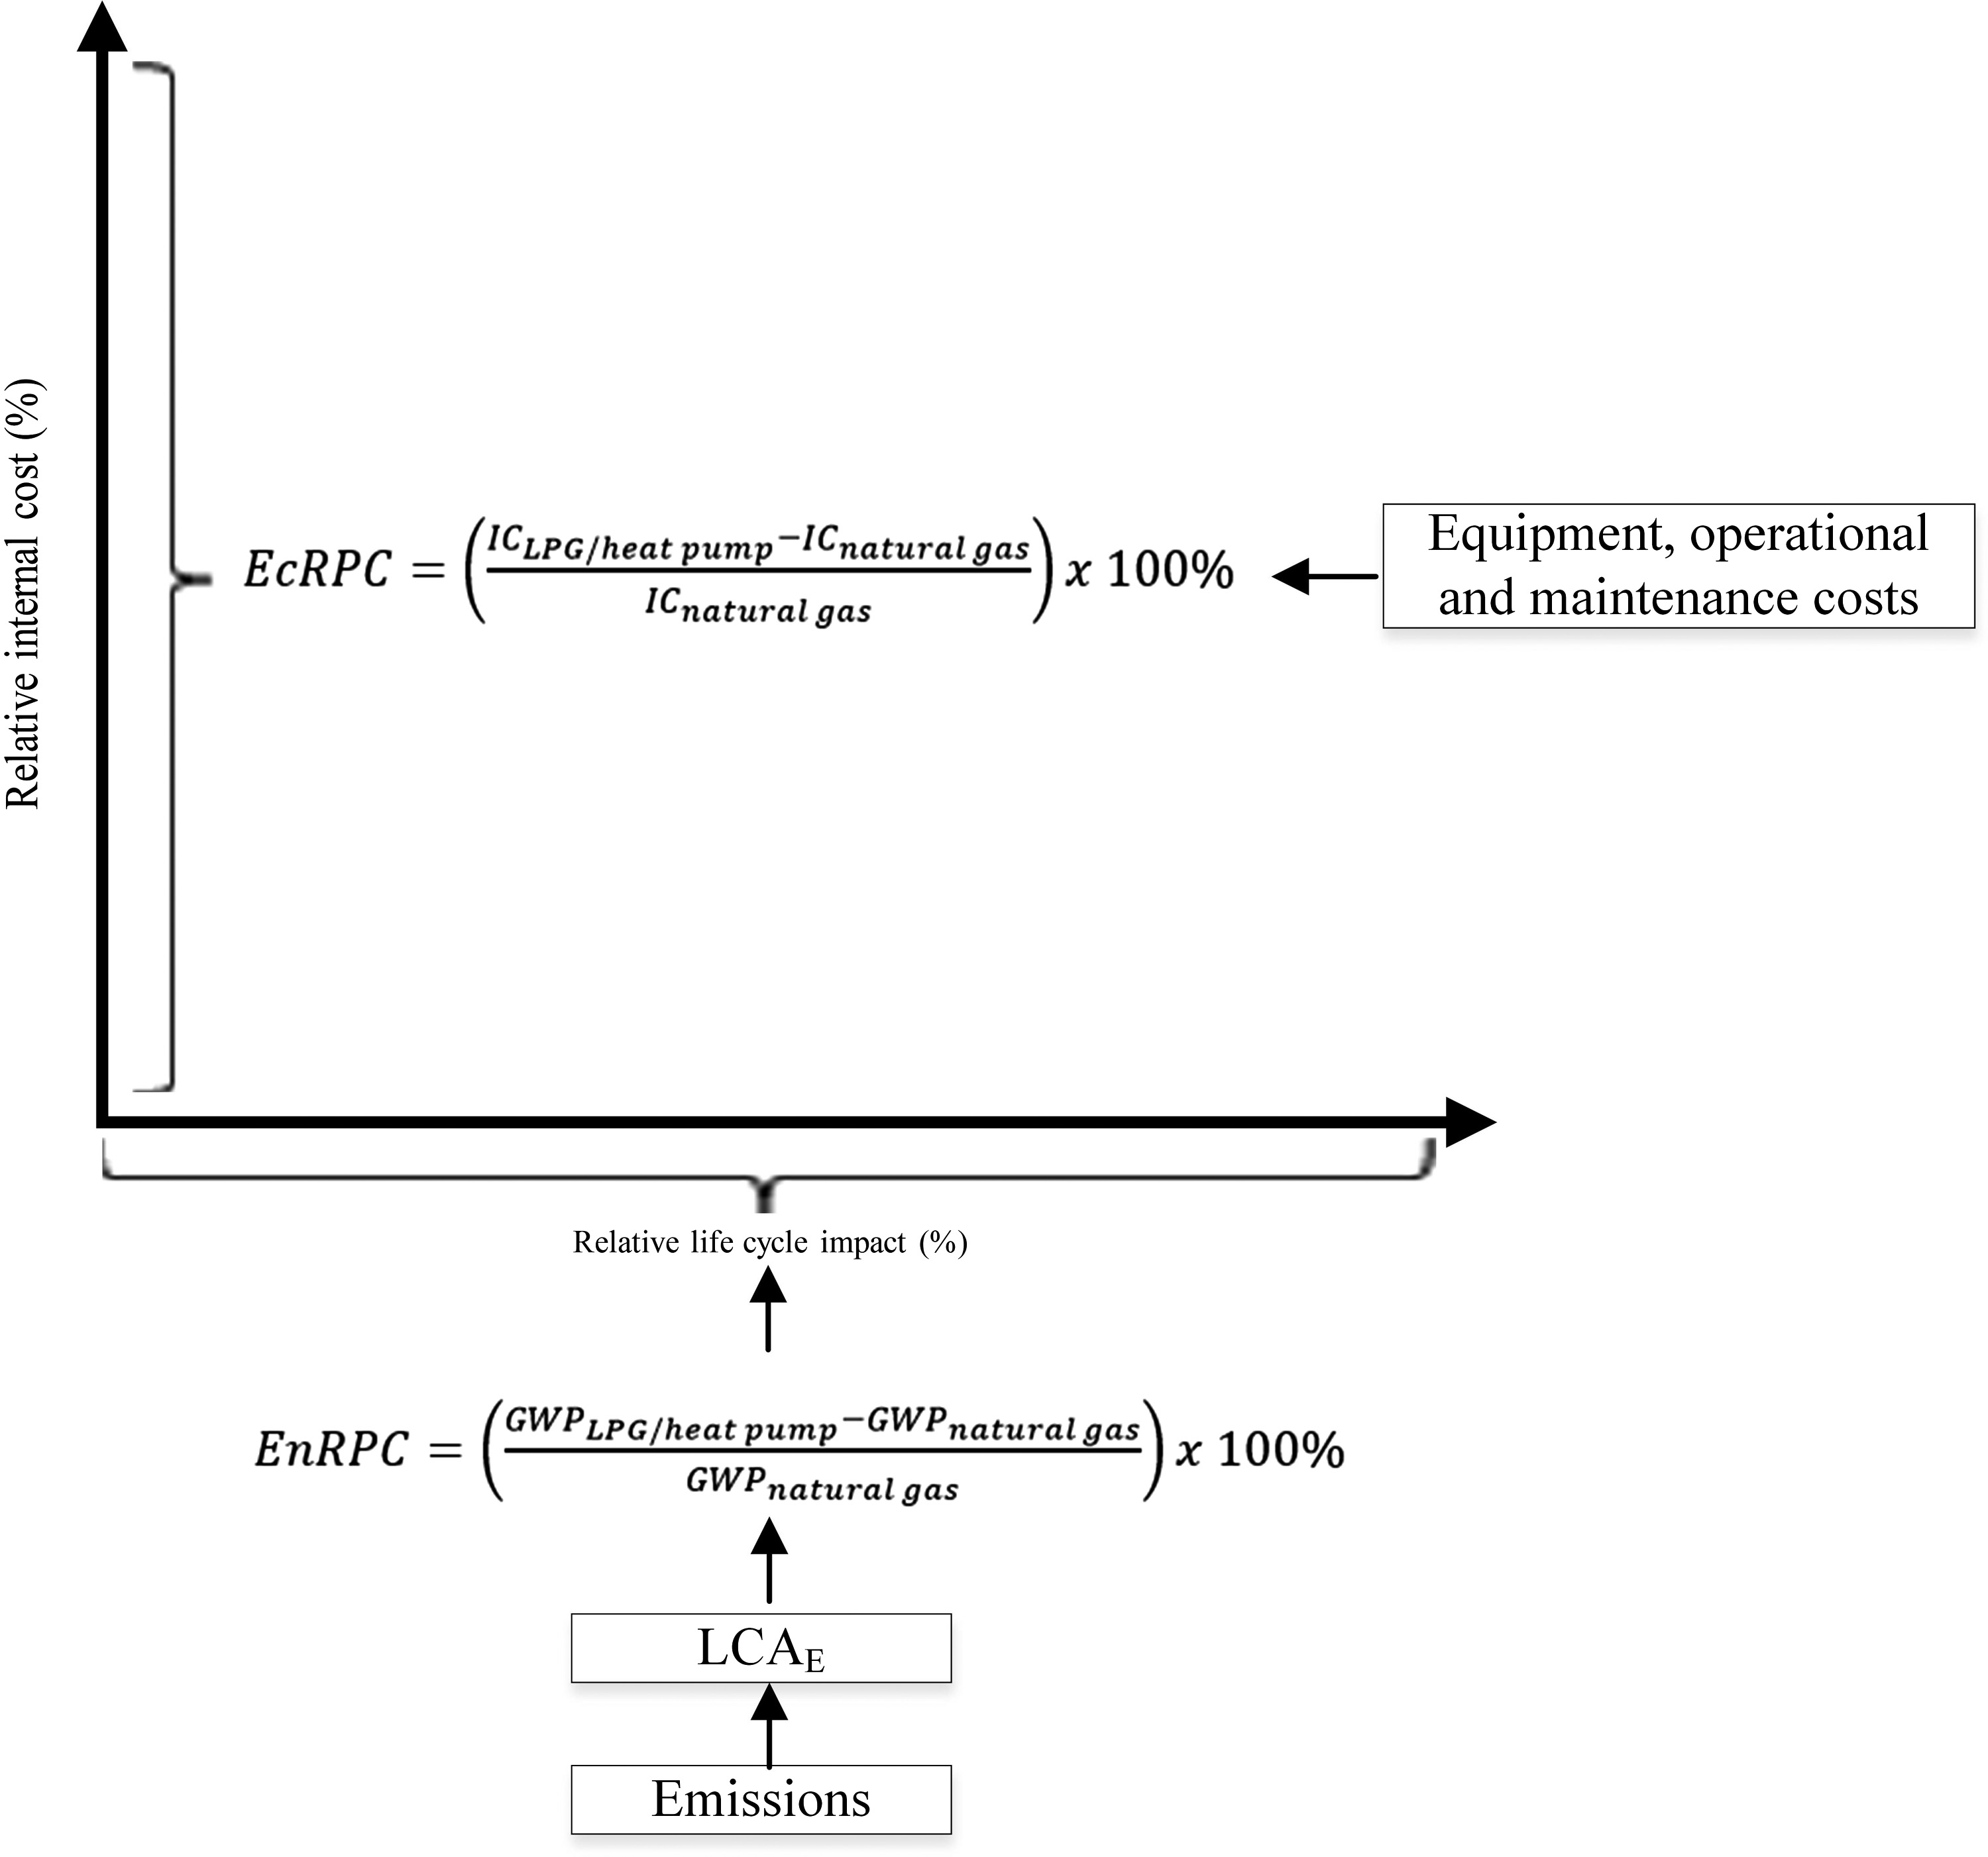
Eco-efficiency index methodology.
Results
LCA results
The life cycle comparison results of heating systems with natural gas, LPG, and the HP are given in Table 4 (the highest value of the row was shown in bold). According to these characterization results, natural gas has the lowest impact apart from ADPff. The LPG heating system has the highest GWP100 value. In contrast, the HP heating system has greater impact values for ADPe, HTP, AP, and POP than those of natural gas and LPG heating systems. Greening and Azapagic (2012) also found higher results for the HP than those for a natural gas boiler with certain exceptions. Contrary to the current study, they declared that a HP was better than natural gas for GWP and POP. The rate of GWP values between natural gas and a HP found by Greening and Azapagic (2012) is 1.06, whereas the rate found by this study is 0.77. It is believed that this difference probably results from the different shares of fossil fuels in the electricity mix of Turkey and the United Kingdom within the geographical scopes of the studies.
Life Cycle Comparison Results of Heating Systems
ADPe, elemental based abiotic depletion potential; ADPff, fossil fuel based abiotic depletion potential; AP, acidification potential; GWP100, global warming potential; HTP, human toxicity potential; LCAE, emission based LCA; LCAR, raw material based LCA; LCAT, LCAtotal; POP, photochemical oxidation potential.
Heating systems are compared in two graphics as shown in Fig. 5. Figure 5a shows the total normalized values, and Fig. 5b presents the distribution of these values to the life cycle phases of fuel/electricity production, equipment production, and operation. The transportation phase could not be shown in Fig. 5b since it had no considerable effect on environmental impact. In addition, the EoL phase is shown in Fig. 5c separately, because of its negative values (avoided impact). Therefore, the sum of the percentiles in Fig. 5b and c equates to 100%. According to Fig. 5a, the main impact of the natural gas heating system is ADPff and GWP100. The ADPff value of natural gas heating resulted entirely from the natural gas production (Fig. 5b). The main contributor of the GWP impact is the operational phase of the natural gas heating system due to CO2 emissions from the chimney (95%) (Fig. 5b). The LPG heating system has higher values for ADPff, GWP100, and HTP (Fig. 5a). Crude oil consumption is responsible for the ADPff with a percentage of 92% (Fig. 5b). The GWP100 value of the LPG heating system resulted entirely from the operational phase (Fig. 5b) due to the CO2 and methane emissions, with shares of 78.3% (76.6% from LPG production, 1.7% from chimney) and 21%, respectively. The HTP impact of the LPG resulted mainly from LPG production (∼46%) and equipment (boiler and tank) production (∼55%) (Fig. 5b). The pollutants causing this impact are as follows: barium (36%, from produced water during crude oil extraction—produced water is a complex mixture of dissolved and particulate inorganic and organic matter and it includes barium 1.10-3-2.0 mg/L; Yusta-García et al., 2017); nickel (23%, from heavy fuel oil combustion, according to the US National Research Council the Ni content of residual [heavy] oil was observed to be 89 ppm; Peltier et al., 2009); benzene (22%, resulting from propane generation during the crude oil refining); and cadmium (5%, from combustion of residual heavy fuel oil—emission factor for cadmium from heavy oil combustion is 24 g/T (Shao et al., 2013)) emissions. With regard to the HP heating system, POP is the dominant impact, whereas AP, ADPff, GWP100, and HTP have considerable values (Fig. 5a). All this impact of the HP is due to fossil fuel based electricity production (Fig. 5b). Carbon monoxide emissions from natural gas combustion, SO2 emissions from the burning of lignite, CO2 emissions from coal combustion, and heavy metal emissions from ash disposal are the main pollutants that cause POP, AP, GWP100, and HTP, respectively. The EoL phase provides a number of improvements on the life cycle impact of heating systems due to the avoidance of pig iron production using scrap materials (Fig. 5c). The highest avoided impact was in the POP category of natural gas (∼15%).
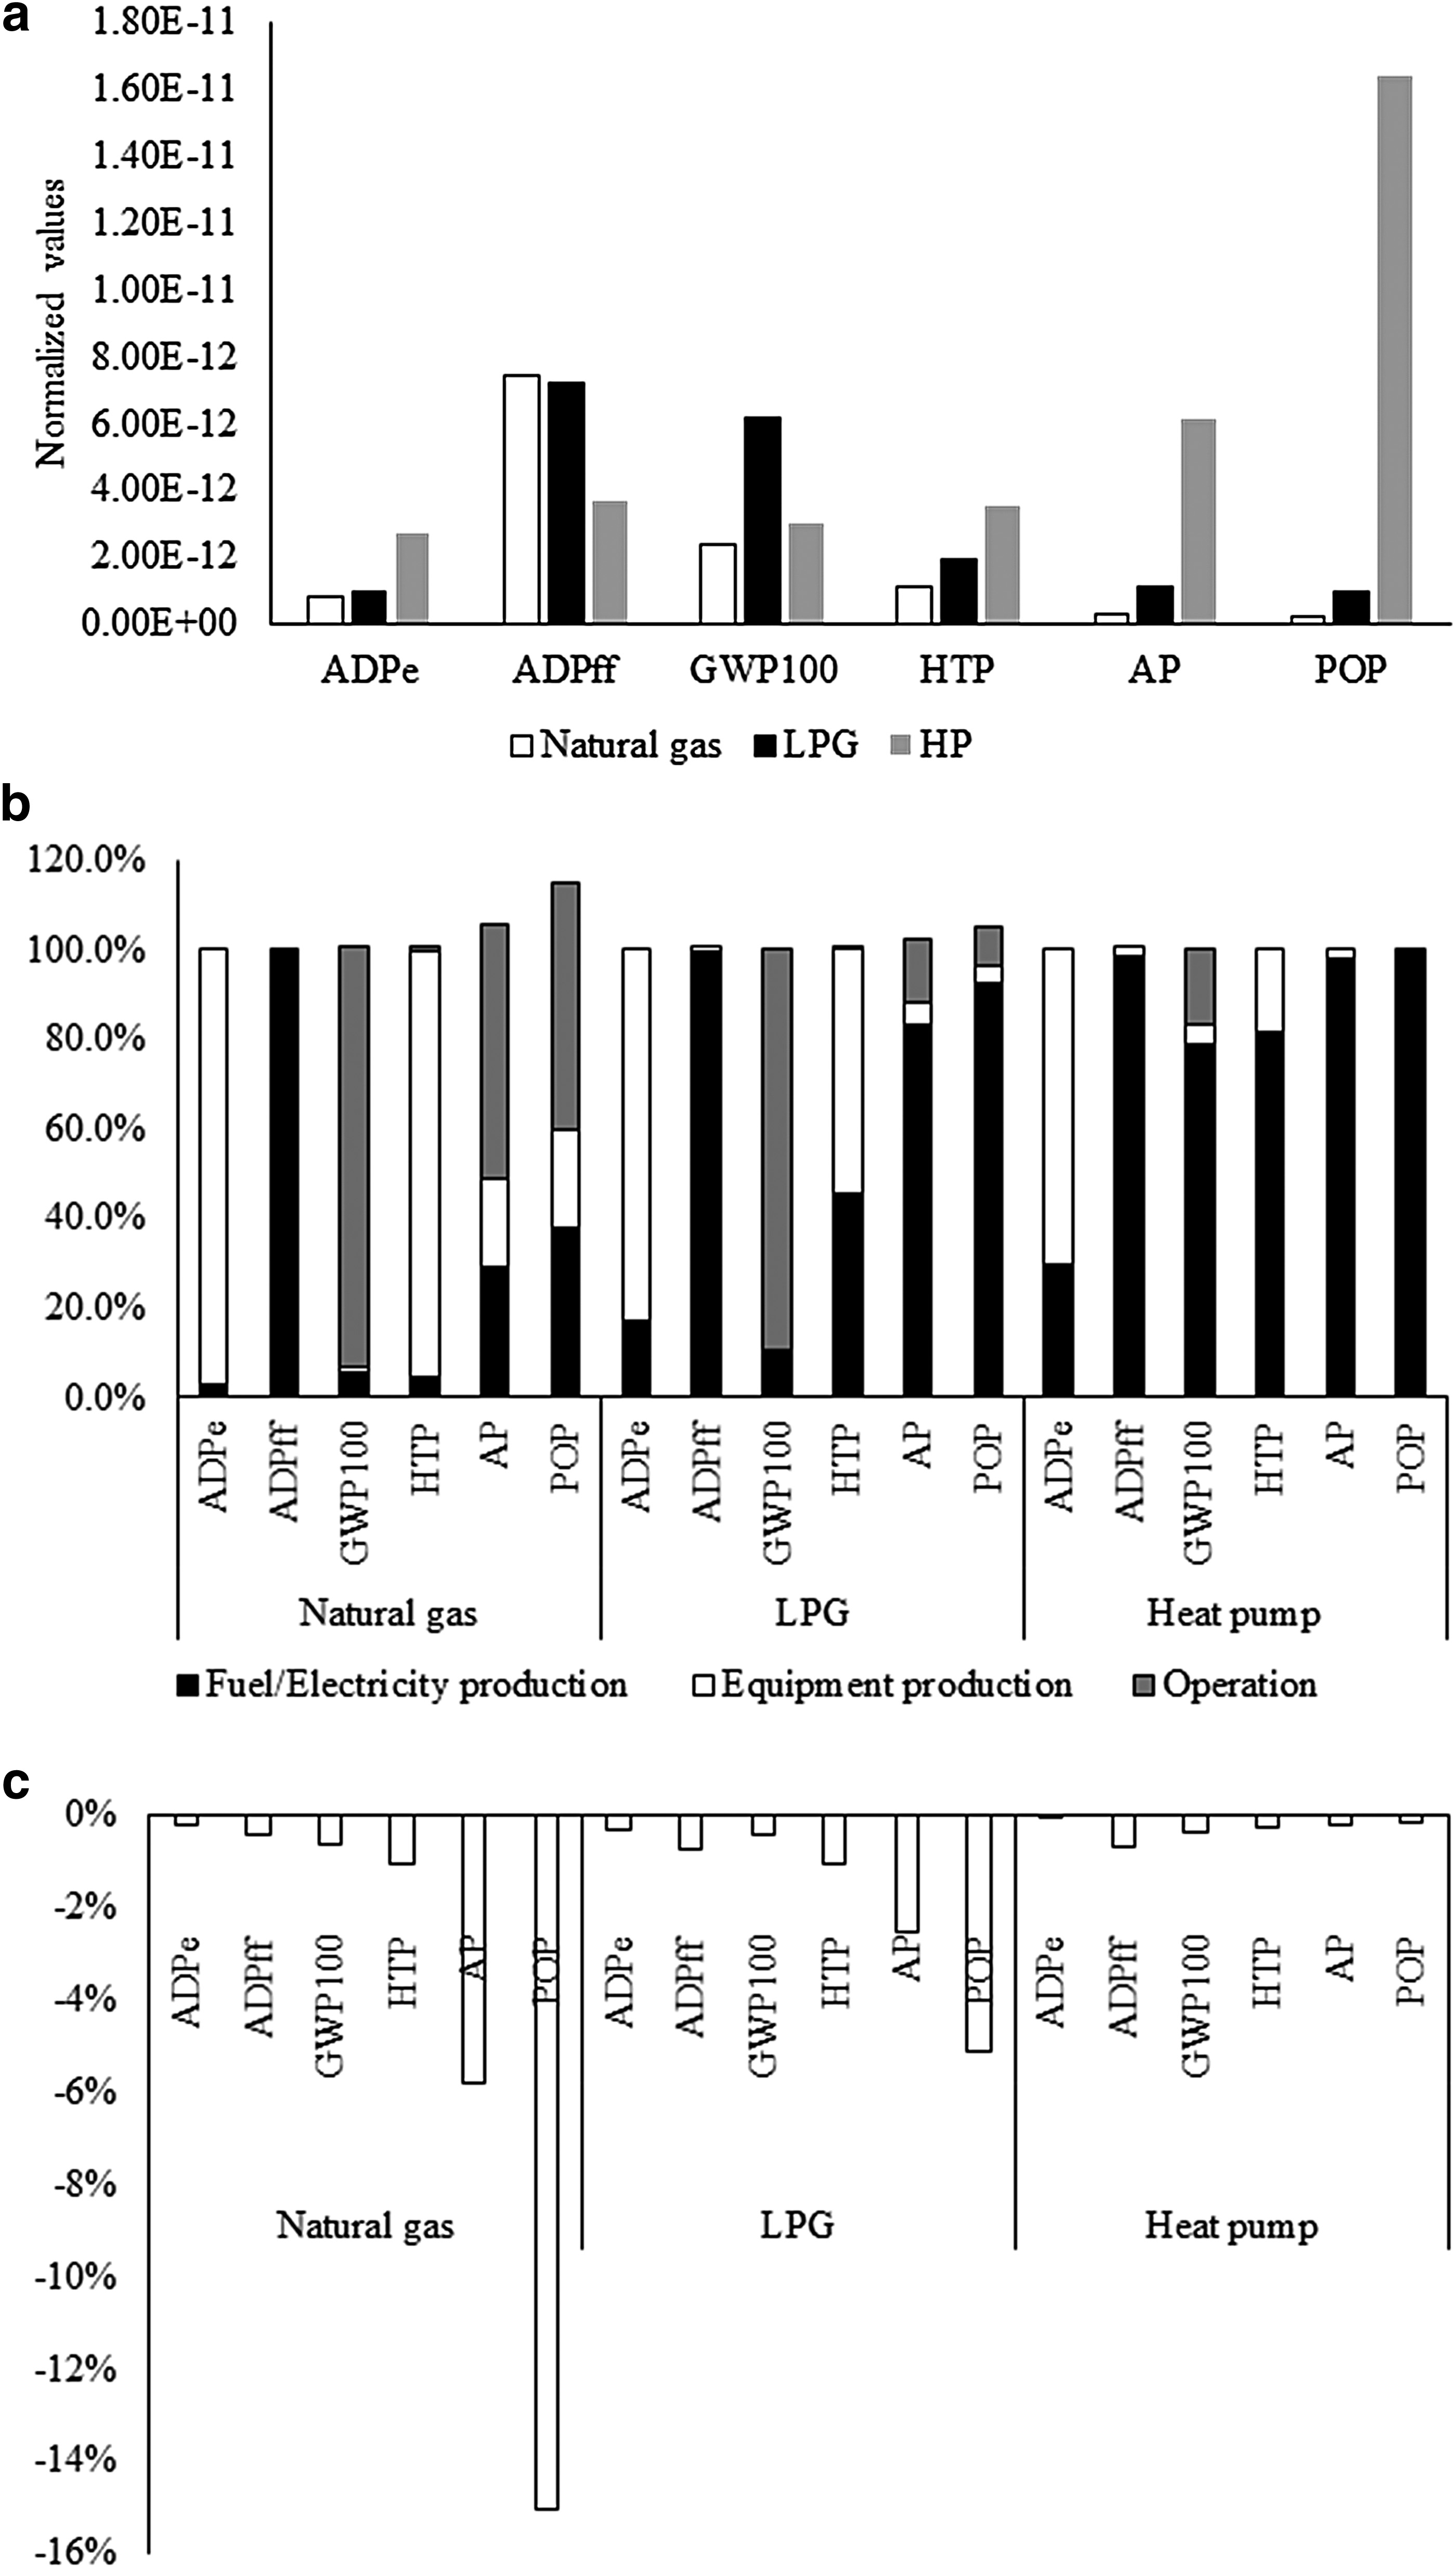
Normalization results of heating systems.
A Monte Carlo simulation was run to estimate uncertainties in the LCA comparisons between the heating systems (Fig. 6). Figure 6a shows the results of uncertainty assessment in terms of the probability of the LPG heating system having a lower impact than the natural gas heating system (on the left) and the probability of the natural gas heating system having a lower impact than the LPG heating system (on the right). For ADPff, there is a 50% probability that the natural gas heating system has a higher impact than the LPG heating system and vice versa, whereas all the other indicators (ADPe, GWP, HTP, AP, and POP) are always higher for the LPG heating system without uncertainty. Figure 6b shows the results of the uncertainty assessment in terms of the probability of the HP heating system having a lower impact than the LPG heating system (on the left) and the probability of the LPG heating system having a lower impact than the HP heating system (on the right). According to Fig. 6b, the HP has lower values for ADPff and GWP100 impact than those of LPG without uncertainty. In addition, the HP heating system has higher values for ADPe, HTP, AP, and POP than those of LPG without uncertainty.
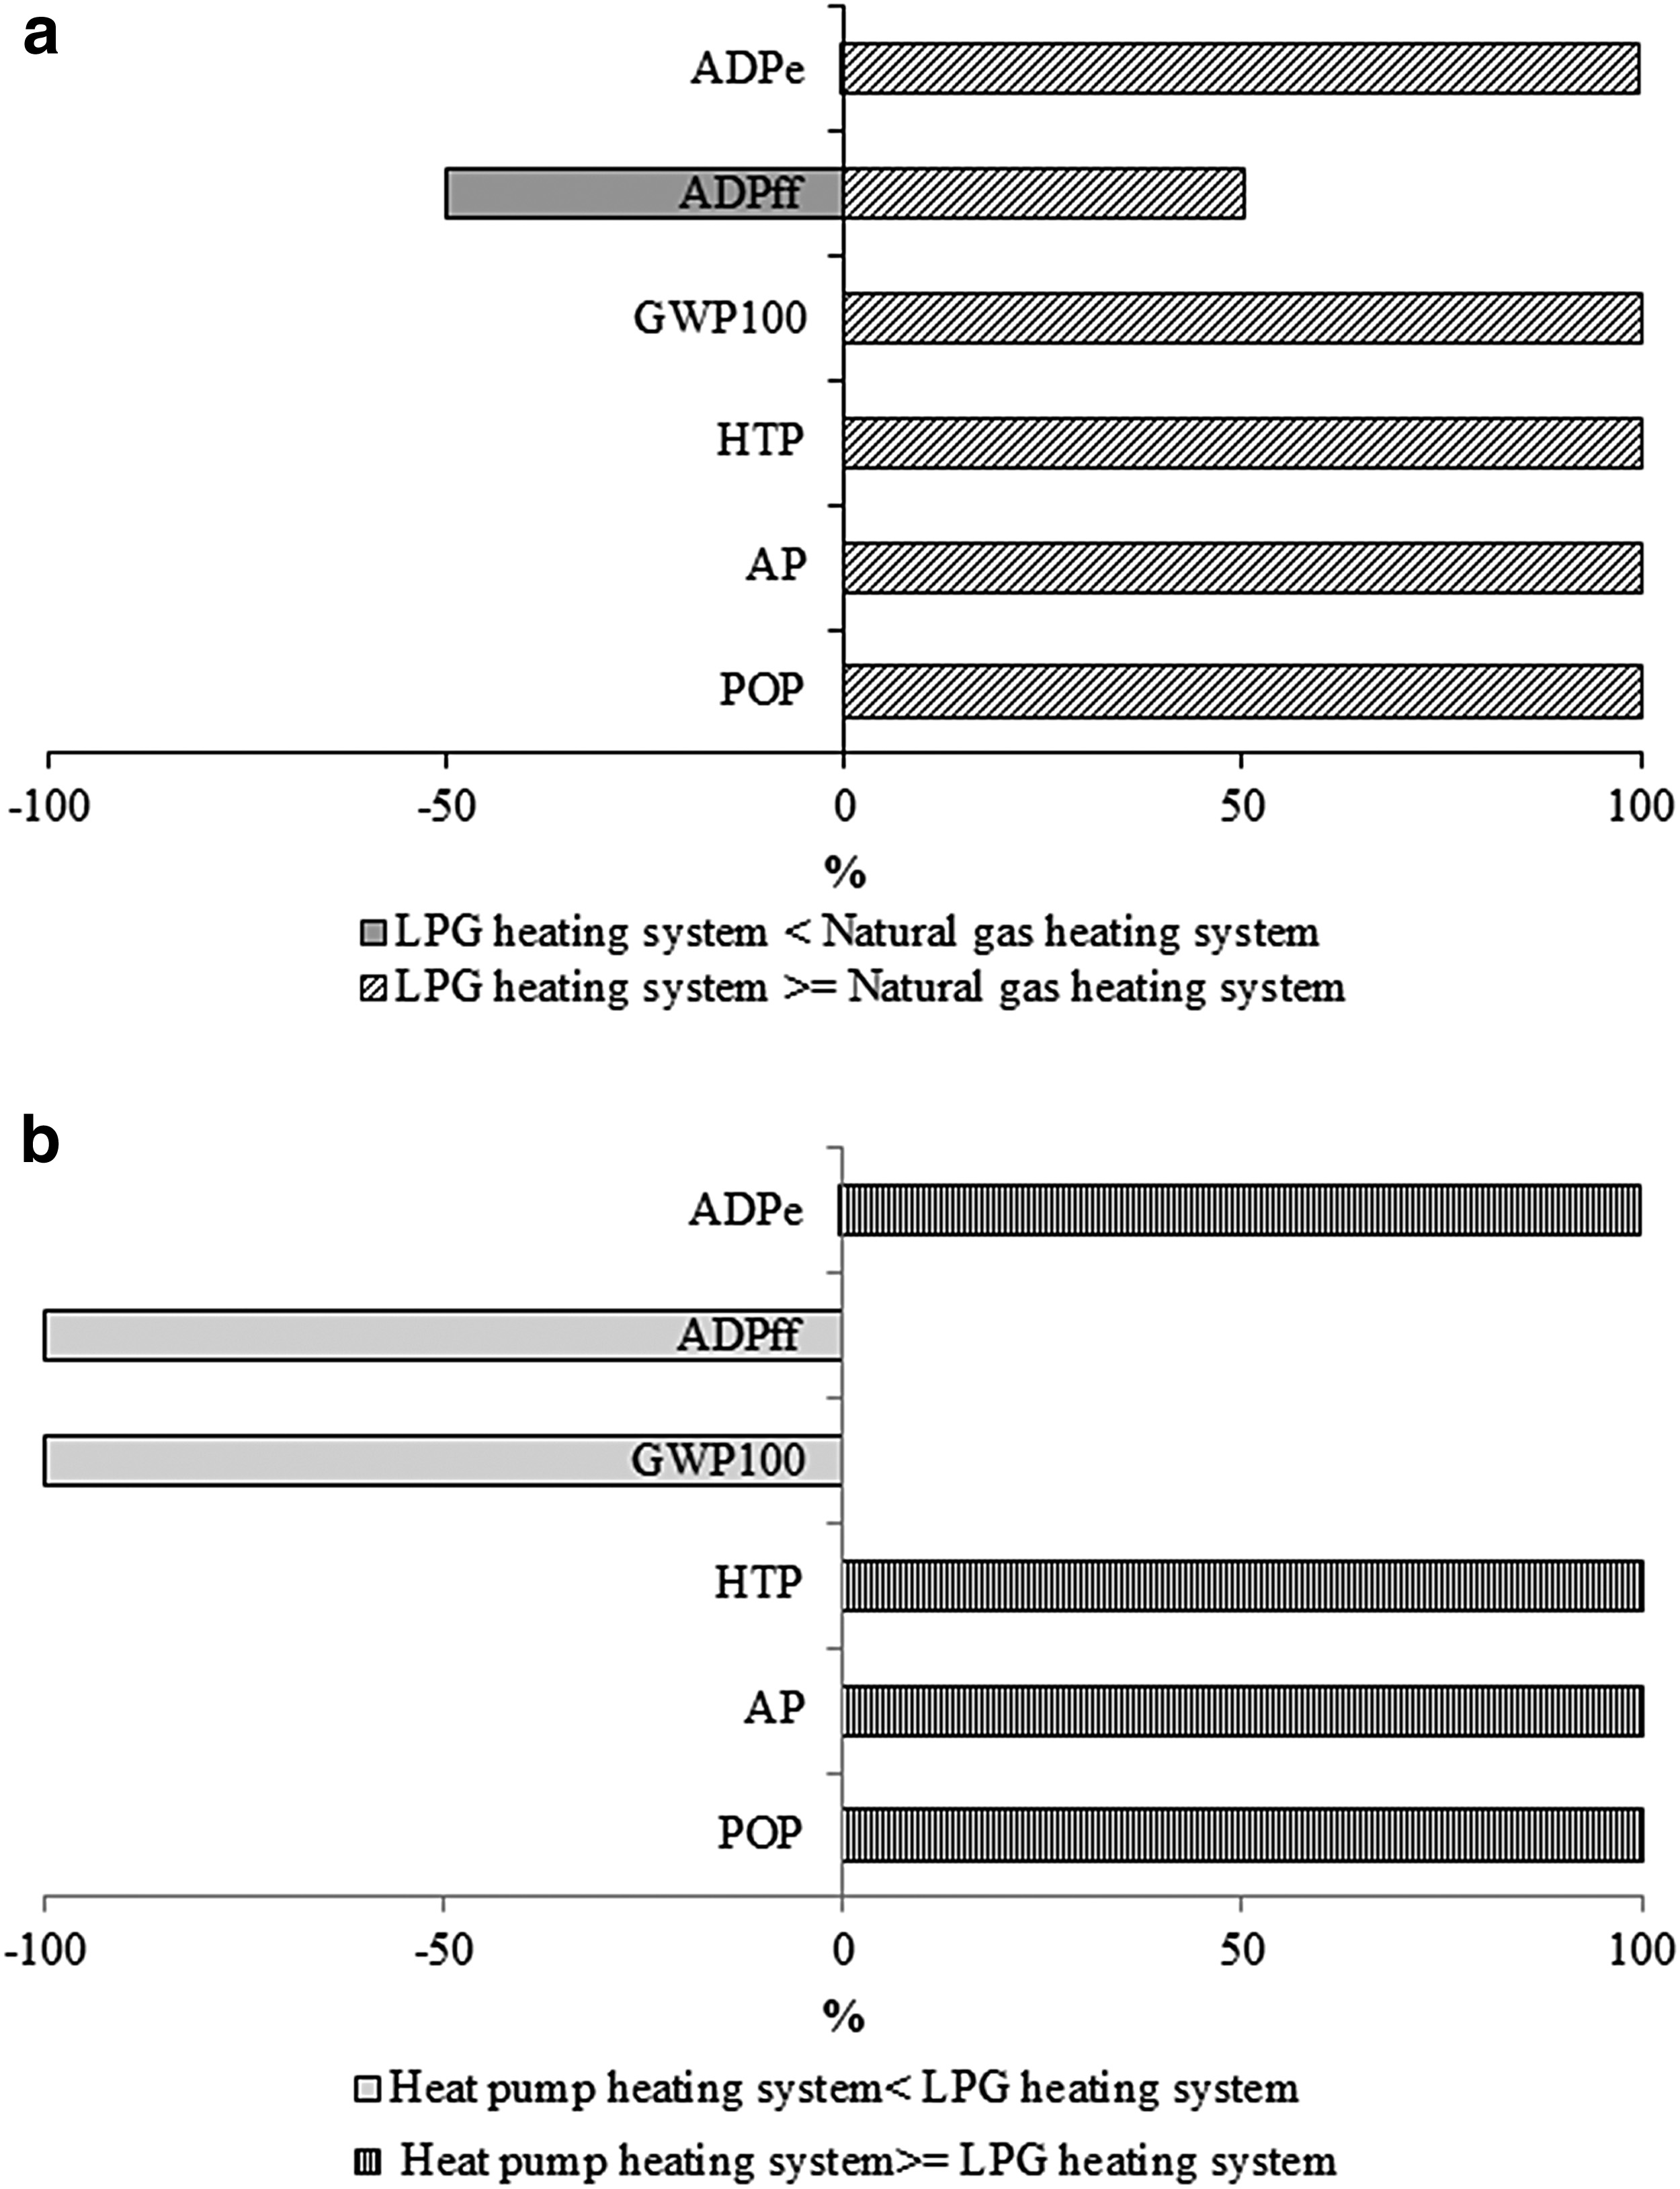
Monte Carlo simulation results.
Sensitivity results are given in Fig. 7 as percentile changes according to the base cases. This figure shows that a reduction of ∼6% in the efficiency of the natural gas system causes a maximum of 6% increase on the impact values (ADPff, GWP100, and POP) of the natural gas system. In contrast, a 12% increase in the efficiency for the LPG system would provide a maximum of 10% improvement (ADPff, GWP100, and POP) on the environmental impact of the LPG heating system. This would make LPG more preferable than a condensing natural gas system for ADPff, but the GWP100 value would still be higher compared with natural gas. The scenarios for HP have more significant changes relative to natural gas and LPG systems. Photovoltaic panel powered heat pump (HP-PV) shows better improvement (50–98%) among the sensitivity scenarios except for ADPe. The change on the ADPe could not be shown in Fig. 7, since it has a huge amount of ∼10 times over. Scenarios based on different COP values depict that if the COP is between 2 and 3, the environmental performance of the HP decreases making it a less preferable heating alternative. In contrast, if electricity is supplied by PV, even the COP is a value as low as 2 (photovoltaic panel powered heat pump with coefficient of performance value of 2 [HP-PV-COP = 2]), HP would have a good environmental performance. Best environmental performances of heating alternatives are compared in Fig. 8 through normalization. According to this figure, a condensing type natural gas system, that is a commonly-used heating system, has lower environmental impact than an LPG heating system with better performance except for ADPff. HP would better environmental performance with reference to ADPff and GWP100 than the natural gas heating system if it is possible to supply electricity from PV panels. In contrast, when Fig. 8 is compared to Fig. 5a it can be seen that a PV panel would significantly increase the ADPe impact of the HP and, in addition to this, there would be slight increases in the values of the natural gas system.
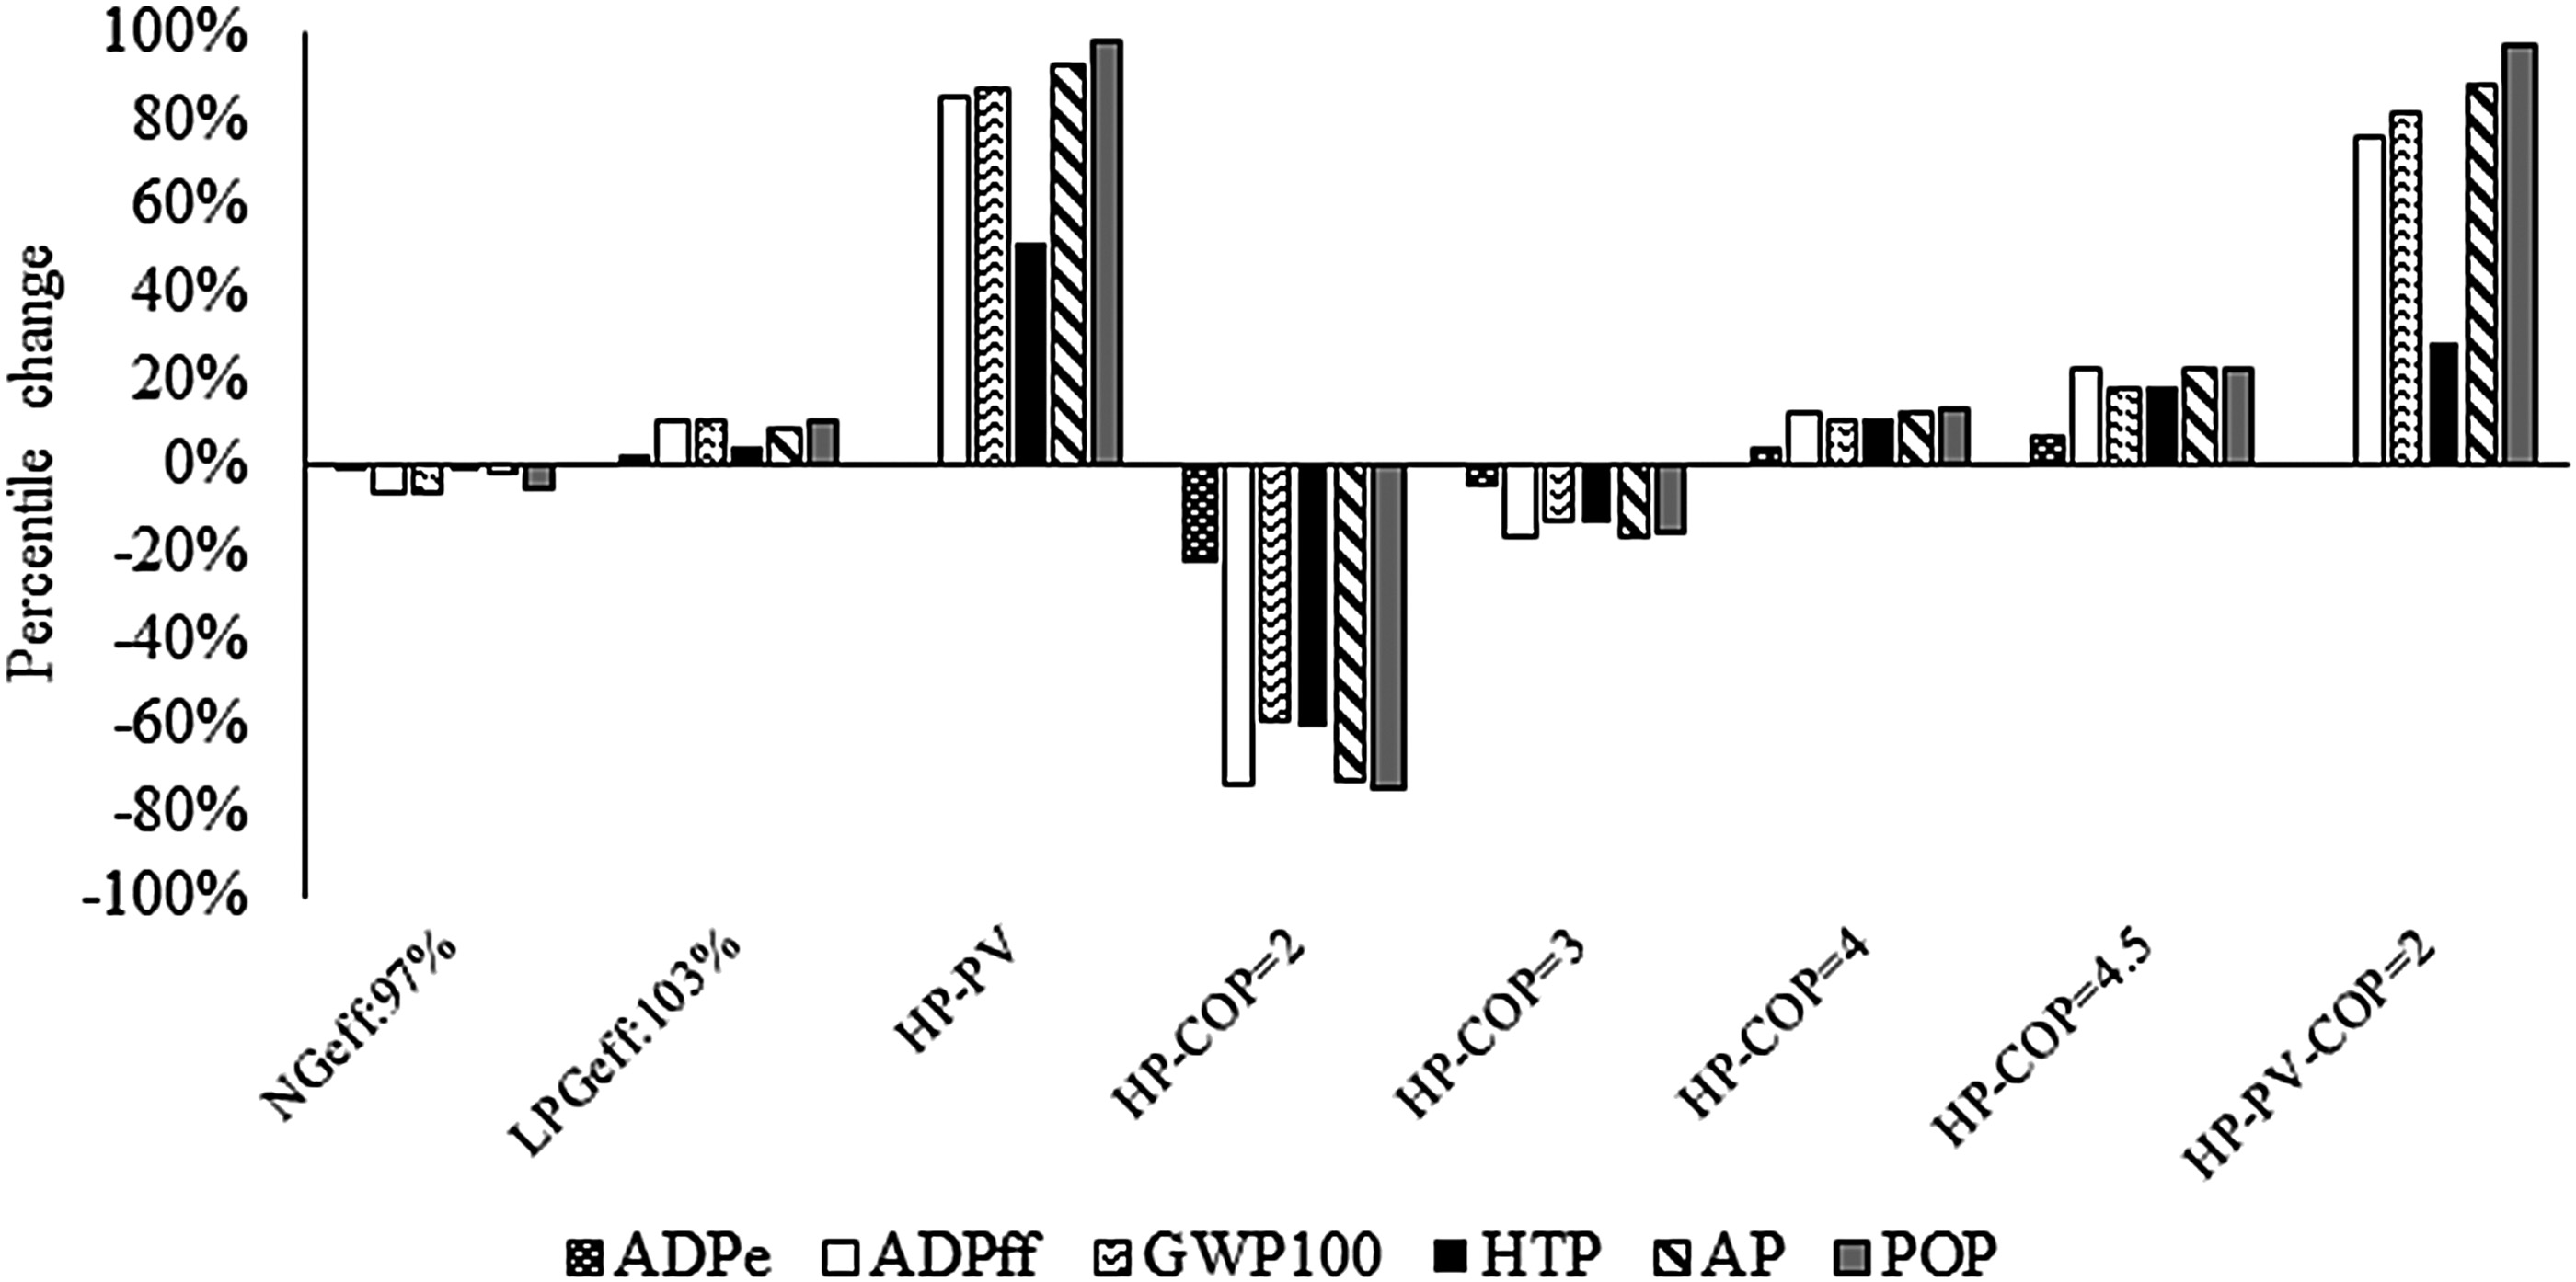
Sensitivity analyses as percentile change according to the base cases. HP-COP = 2–4.5, heat pump with varied coefficient of performance ranges between 2 and 4.5; HP-PV, photovoltaic panel powered heat pump; HP-PV-COP = 2, photovoltaic panel powered heat pump with coefficient of performance value of 2; LPG, liquefied petroleum gas; LPGeff:103%, LPG boiler with the efficiency of 103%; NGeff:97%, natural gas boiler with the efficiency of 97%.
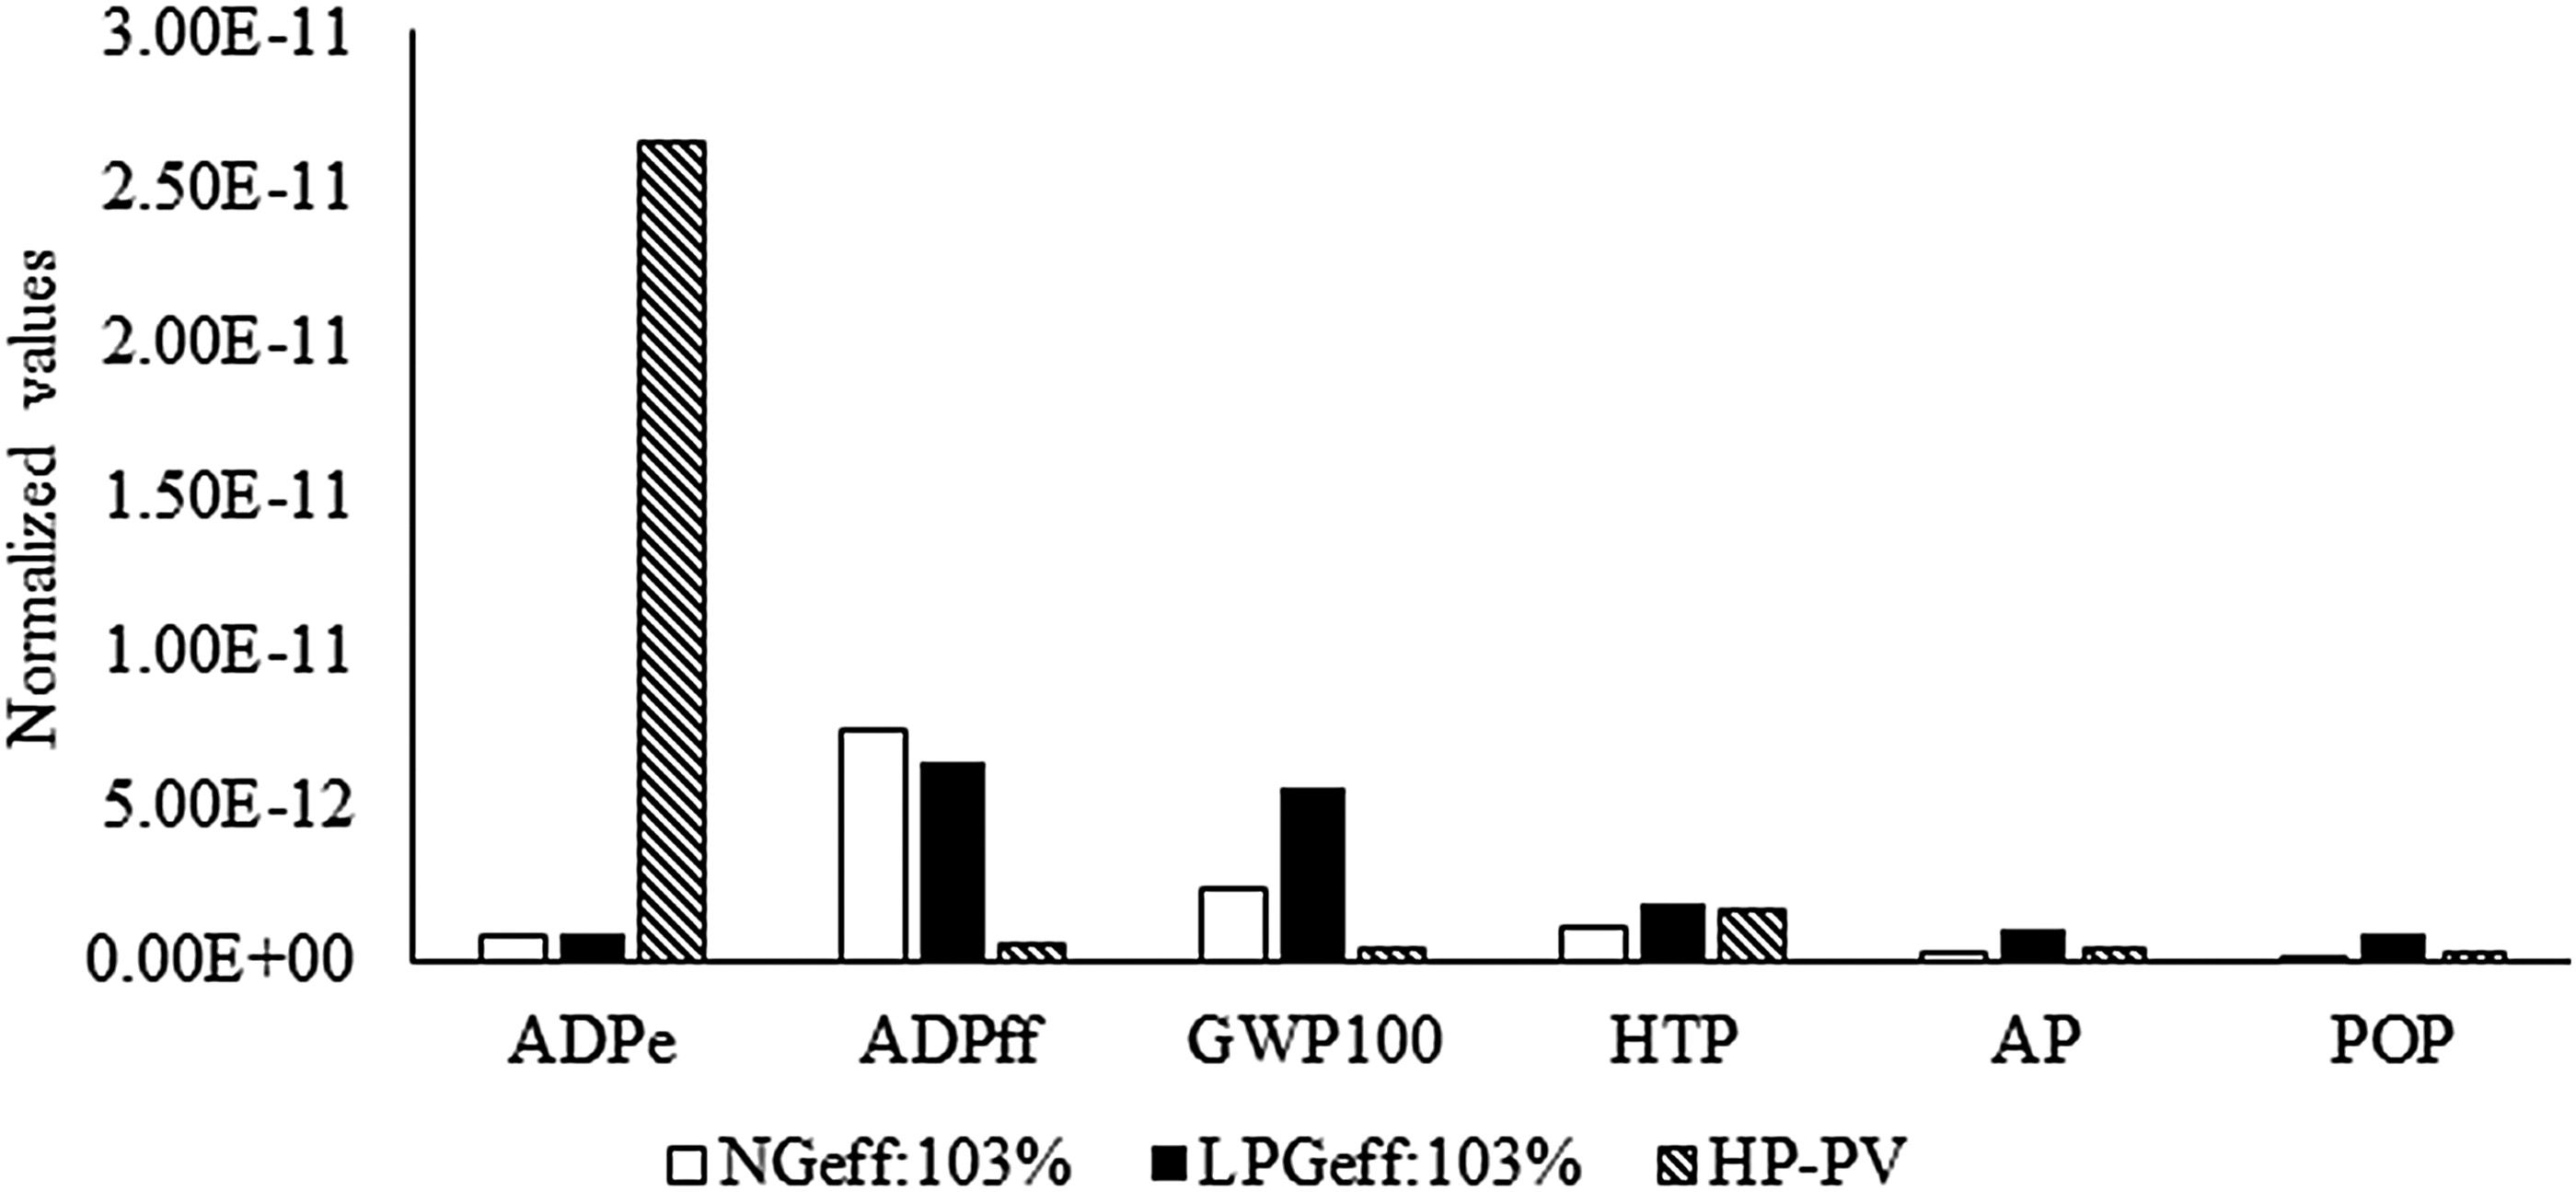
Comparison of heating systems with best environmental performance.
ELCC results
Monetized externalities are given in Table 5. LPG had the highest external cost among the heating systems. The external cost value of the HP is approximately twice that of natural gas. GWP is the main external cost component for three of the heating systems. Its share percentages are 56%, 78%, and 84%, respectively, for the HP, natural gas, and LPG heating systems. HTP also has a considerable external cost share for heating systems. It should be remembered that, although these values were obtained using maximum WF values for GWP, HTP, and POP, the WFs of such impact are given in the range of minimum and maximum values. This range is extremely large for HTP (the maximum value is 3,000 times larger than the minimum value) relative to GWP and POP. This shows that the use of the Ecovalue 08 method for monetization of the externalities contains large uncertainty, especially for HTP, and it should be carefully used for decision-making, as indicated by Huysegoms et al. (2018).
Monetized Externalities
The ELCC values, or the sum of the internal and external cost values, of the heating systems and sensitivity scenarios are presented in Table 6. The ELCC value of natural gas is lower than those of LPG and the HP (COP = 3.5) heating systems. The HP scenario with maximum COP value (COP = 4.5) has a higher ELCC value than the natural gas heating system. The HP would have the lowest ELCC value if the electricity had been supplied from a PV panel. The share of external costs (74–82%) is higher compared with the internal costs (18–25%) for all of the heating systems.
Environmental Life Cycle Cost Values and Its Distribution to the Costs of Heating Systems
ELCC, environmental life cycle cost.
EE index
The EE index is presented in Fig. 9 for GWP100 impact. According to Fig. 9, the most significant heating system in terms of environmental and economic mean is based on natural gas. LPG and the HP fall under the full non EE area relative to the reference exhibiting that they are in a worse situation than the natural gas heating system. This indicates that individually, the internal costs and environmental impact of the HP and LPG have the same worse EE level relative to the natural gas for GWP100. This EE index was realized only for GWP100, but the coordinates of LPG and the HP will change for other impact categories.
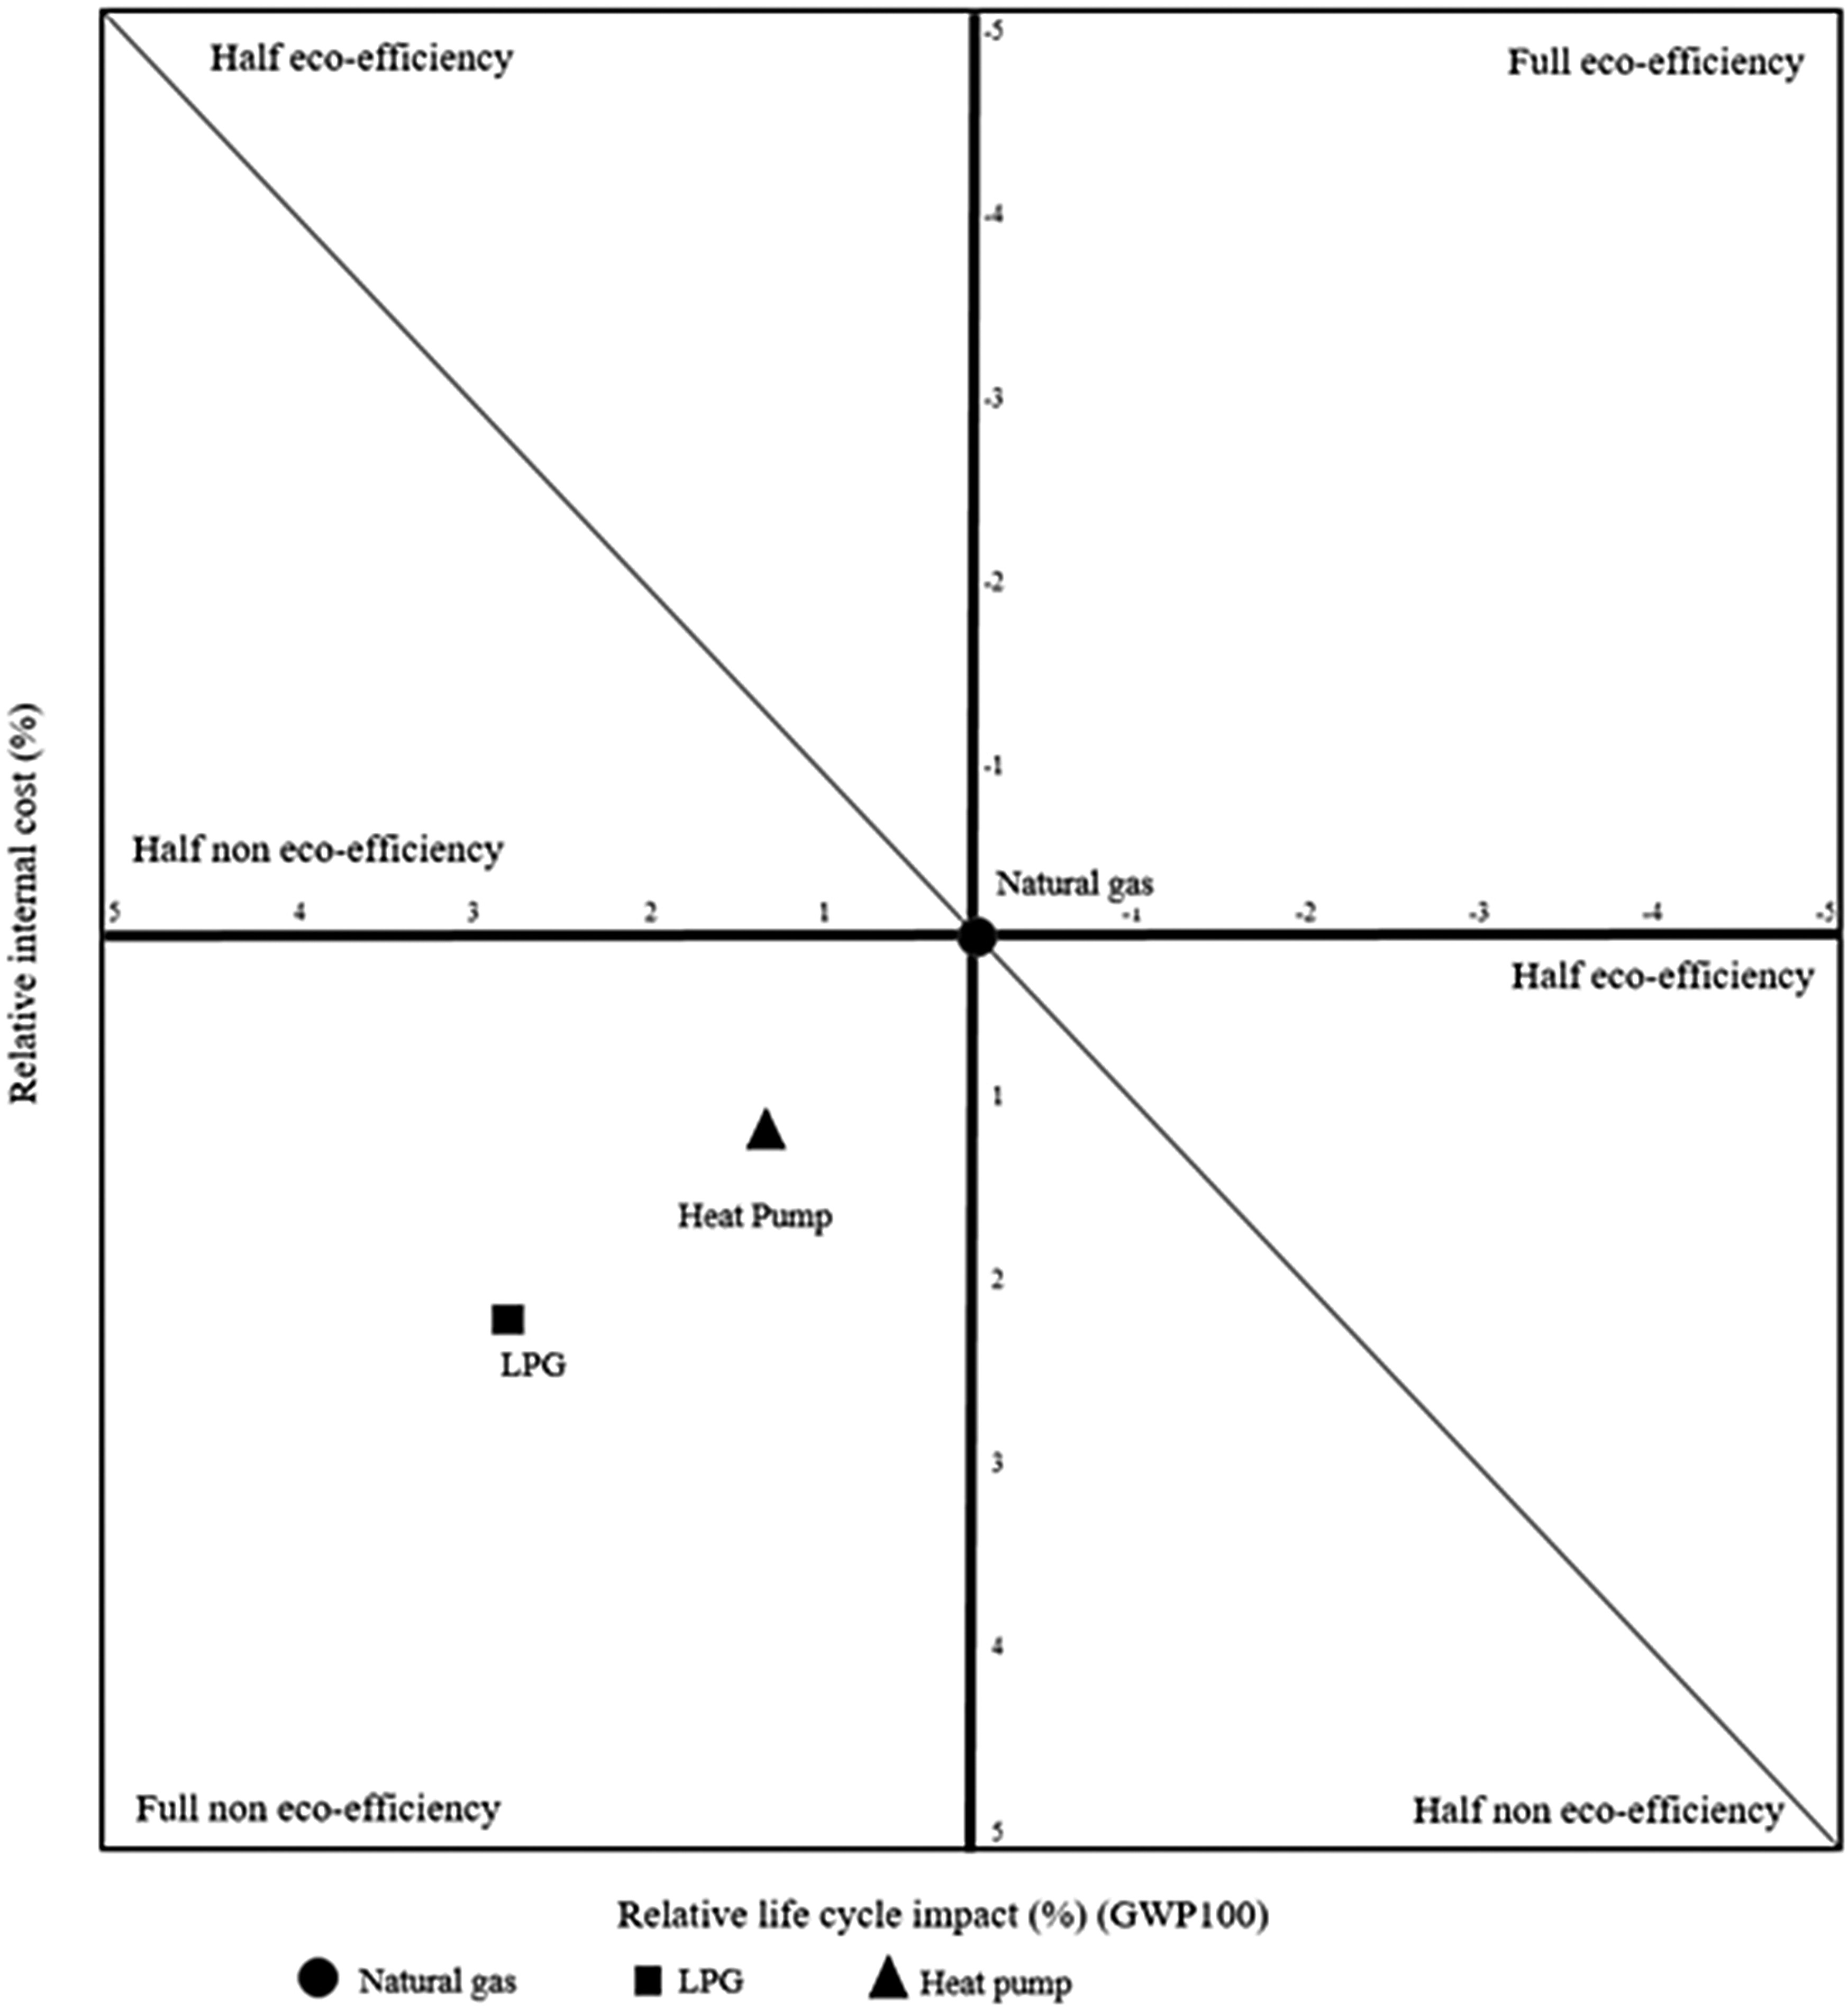
Eco-efficiency index for GWP100.
Conclusion
This study has aimed to perform an environmental and economic life cycle comparison of residential heating systems. The individual result of LCA, ELCC, and their aggregated results, which was applied as EE, shows that the most remarkable heating system, in terms of environmental and economic mean, is based on natural gas with a condensing type boiler for most of the impact categories, especially for GWP100, with the exception being ADPff. Condensing type boiler use is an important point for natural gas based heating. According to the EU Energy Related Products (ErP) Directive (Directive 2009/125/EC, 2009), seasonal space heating energy efficiency shall not fall below 86% for fuel boiler space heaters with rated heat output ≤70 kW. This requirement makes the use of condensing type boilers obligatory. In Turkey, a regulation was expected to come into force regarding ErP in 2018. However, boiler producers have already started to renovate their product according to the requirements of the ErP Directive. In contrast, the results of this study show that even if a condensing type LPG boiler is used, its environmental and economic performance would not be as good as a natural gas heating system. With regard to the air pump, COP and sources of the electricity mix are the hot points. The COP value has an important role on the impact of the HP since it refers to the efficiency and electricity consumption of a HP. A higher COP means lower electricity consumption and lower emissions. The electricity supply source is a more important factor than the COP value that affects the environmental performance of a HP. The increasing share of renewable energy sources in the electricity generation mix or total use of renewable energy source, such as PV panels, as seen in the sensitivity analyses, would decrease its environmental load.
Another side of this study is the ELCC application by dividing the LCA results into two categories resulting from raw materials (LCAR) and resulting from emissions (LCAE). This kind of study avoids double counting of the environmental impact. In addition, it is a time-saving methodology for LCA practitioners to integrate the environmental and economic results of a system without finding detailed economic data of the life cycle phases. In contrast, monetization would cause uncertainty if it is based on the range of minimum and maximum values. The use of more than one monetization method and a comparison of the results may be minimized by any uncertainty resulting from this issue. The EE index helps with an understanding of the relative relationships between alternatives, both environmentally and economically, but can only be applied to one impact category. To see the overall results, all impact category results can be combined using decision-making methods, such as analytical network processing.
As a conclusion, the decision-making process between alternative heating systems should not be based on a single point, such as emissions at the operational stage. A lifecycle approach should be integrated into the design phase of space heating systems. Such an approach would provide more reliable results. However, as a holistic approach, environmental and economic analyses alone are insufficient; the social impact should also be taken into account using social LCA.
Footnotes
References
Supplementary Material
Please find the following supplemental material available below.
For Open Access articles published under a Creative Commons License, all supplemental material carries the same license as the article it is associated with.
For non-Open Access articles published, all supplemental material carries a non-exclusive license, and permission requests for re-use of supplemental material or any part of supplemental material shall be sent directly to the copyright owner as specified in the copyright notice associated with the article.